Projecting Fantasy Football Points
|
|
|
- Benedict Neal
- 6 years ago
- Views:
Transcription
1 Projecting Fantasy Football Points Brian Becker Gary Ramirez Carlos Zambrano MATH 503 A/B October 12,
2 1 Abstract Fantasy Football has been increasing in popularity throughout the years and becoming a popular way for participants to earn money. Participants form leagues in which they draft NFL players into their teams to compete against other teams in their leagues. Participants utilize projections of players overall Fantasy Points from various websites to help them draft the highest scoring players to their team in the beginning of each season. Our goal is to reproduce and improve these projections for the quarterback position. We will use saved data from the previous NFL seasons to train various linear regression models. We will compare the results of our various linear regression models against one other while also striving to surpass Fantasy Football Analytics projections performance. 2 Introduction Fantasy Football is a growing industry where participants go head-to-head on a weekly basis to see which of their teams can get the most points. These points are accumulated based on player performance, so picking the best players can take one anywhere from several minutes to hours. Teams are initially picked in Fantasy Drafts, which consist of 6-14 participants. Participants take turns in selecting players for their team; however, there are several ways in which the teams are selected. For example: some participants go after their favorite players; others quickly select the players with the highest amount of projected fantasy points. These projected points are provided by several different experts within the fantasy football world, but how does one come up with such projections? Fantasy football points are known to be difficult to project. For example, even a wellregarded player who regularly scores his projected points might be pulled out of a game due to injury or suspension. This leads to a very high variation in each player s fantasy points. This is the main difficulty in projecting fantasy points for each player; players do not typically score similar fantasy points in consecutive seasons. While utilizing a player s past performance, we would also like to find a way to account for a player s of not playing the same number of games or not obtaining enough ball touches (where the player could subsequently score fantasy points). 3 Literature Review There are many Fantasy Football websites out on the web that offer black box type projections. Some of the most commonly used websites offer fantasy football projections include ESPN, FantasyPros, FantasySharks, NFL.com, and Yahoo. In fact, Isaac Peterson [10] from Fantasy Football Analytics analyzes the accuracy of these types of projections of seventeen of such websites; for the aforementioned five websites projections he computes the coefficient of determination, R 2 and the mean absolute scaled error, MASE statistics to be: 2
3 Source R 2 MASE ESPN FantasyPros FantasySharks NFL.com Yahoo Table 1: 2014 Projection Evaluations by FFA We can think of R 2 as a measure of how much of the variance of the dependent variable is explained by the model [6], and the M ASE statistic as a relatively new, scale-free measure of the accuracy of forecast models [5]. A good model will ideally capture a high R 2 and a low MASE. With such low R 2 values, we can see that these websites struggle forming accurate projections for the next season. Peterson improves upon these websites projections by using a weighted average of fourteen such black box websites projections in which he assigns weights based on each websites historical accuracy. With this approach, he is able to achieve an R 2 of.569 and an M ASE of.479, an improvement of the individual website projections. Others have attempted to assist fantasy football players in other ways via the application of more complex machine learning algorithms. Boris Chen from the New York Times applies a Gaussian mixture model to an aggregation of expert ranking data provided form FantasyPros.com to find clusters or tiers of players within the ranking data to help fantasy football players understand the natural tiers of NFL players [3]. Niltin Kapania from Standford applies both linear regression and k-means clustering to attempt to predict running backs total season fantasy points and achieves results that are nearly on par with fantasy football expert Mike Kruger s running back projections [7]. Matt Bookman, a graduate student from Stanford attempts to predict weekly quarterback fantasy points by training both linear regression and support vector machine models to achieve a slightly greater Pearson s ρ than Yahoo s projections, indicating consistently better rankings each week than Yahoo s rankings [1]. Dr. J.J. McKinley uses the random forests machine learning algorithm, trained on each players regular season fantasy point production to find the top value plays for each weekend s wild card games [9]. These varying models help to better serve fantasy football competitors in their league s performance in different ways; we wish to form our own projections for the quarterback position season total points to aid in preseason drafting and see if we can match or improve upon these results. 4 Data Description The majority of our data was retrieved from [2] which includes NFL statistics broken down by each player for each week s game from the years 2008 to These data provides us with essential quarterback, wide receiver, and running back performance statistics from the seasons. For the quarterback position, this includes the player name, the player s 3
4 respective team, the opposing team, their quarterback rating for the particular game, their fantasy-point production statistics, and other performance statistics. We then calculate each quarterback s actual fantasy points each week by using the standard scoring formula : Fantasy Points = 1 1 (Passing Yards) + 6 (Passing Touchdowns) + 25 (Rushing Touchdowns) 2 (Interceptions) 2 (Fumbles) 10 (Rushing Yards) + 6 Next, we acquire teams various seasonal defensive and offensive measures/projections from Football Outsiders. We merge the team offense statistics with each player s team and opposing team passing defense statistics with each player s opposing team to have a better understanding of how a player s own team s offense and opposing team s defense will influence their fantasy point production. Because our main goal is to project season total fantasy points for each quarterback, we summarize each quarterback s performance statistics, games played, quarterback rating, actual season total fantasy points,and their team/opponents respective offense and defense statistics for each entire season. We form the training set by labeling all quarterbacks season fantasy points from years 2008 to 2012 as their old points to explain their subsequent season s performance from years 2009 to 2013, as their new points. Thus, we will train on these players previous season total points to predict these players upcoming season total points. Our testing set then consists of all quarterbacks old fantasy points in 2013 which our models will use to predict the new fantasy points for Because we have the actual 2014 data, we can then ascertain our models performance on the testing set by comparing our projected or fitted values to actual fantasy points the quarterbacks accumulated throughout the 2014 season. 5 Methodology To choose the best players to draft to our teams we wish to predict the players accumulated season fantasy points. To accomplish this, we choose to implement a simple linear regression model, what is often considered the bread and butter prediction method for statisticians and data scientists [12]. We first train a simple, one variable linear regression model that uses players season totals of last year s fantasy points as the explanatory variable to predict their current years season totals of fantasy points (the response variable). After analyzing the results of this simple model, we can utilize more of variables present in our data to hopefully increase the fit of our linear regression model. To better understand which data might serve as explanatory variables, we can make exploratory plots to pick out which variables show correlations or trends with the dependent variable. Next, we implement many multiple regression models which now include various combinations of explanatory variables such as: Quarterback rating 4
5 Fantasy Point production statistics Opposing team passing defense statistics player s team offense statistics To quickly evaluate our models performance, we will use the three following statistics: R 2 = ni=1 (ŷ i ȳ) 2 ni=1 (y i ȳ) 2 n MASE = 1 n RSME = 1 n i=1 1 n 1 y i ŷ i ni=2 y i y i 1 n (y i ŷ i ) 2 i=1 The best of our models would be the model which achieves the highest R 2 value while maintaining both low MASE and RSME values on the testing set. Note that even good scores on the training set do not necessarily indicate an accurate forecasting model; a high performance on the training set coupled with a low performance on the testing set indicates that our model is overfitting the data [6]. To better visualize our models performance, we plot the predicted points vs the actual points while using a loess smoother [4] to quickly characterize our scatter plots. We may also compare how close our results line up on the y = x or the line of perfect prediction [12]. 6 Implementation Details After making heavy use of the dplyr package to summarize and filter our data by seasons, and form our training and testing sets. We use the built in R function lm to form our various linear models. We train our first simple linear regression model in R and our two most successful multiple regression models via modelone <- lm(newfanpoints oldfanpoints, data = TRAIN) modeltwo <- lm(newfanpoints oldfanpoints + OppPassingDef, data = TRAIN) modelthree <- lm(newfanpoints oldfanpoints + OppPassingDef + Status, data = TRAIN) In addition to checking our scatter plots for unusual residual patterns and visually measuring our goodness of fits, we call the summary function on our models to better analyze our p-values and coefficients of our linear models. 5
 (Intercept) 10.51836 6.")
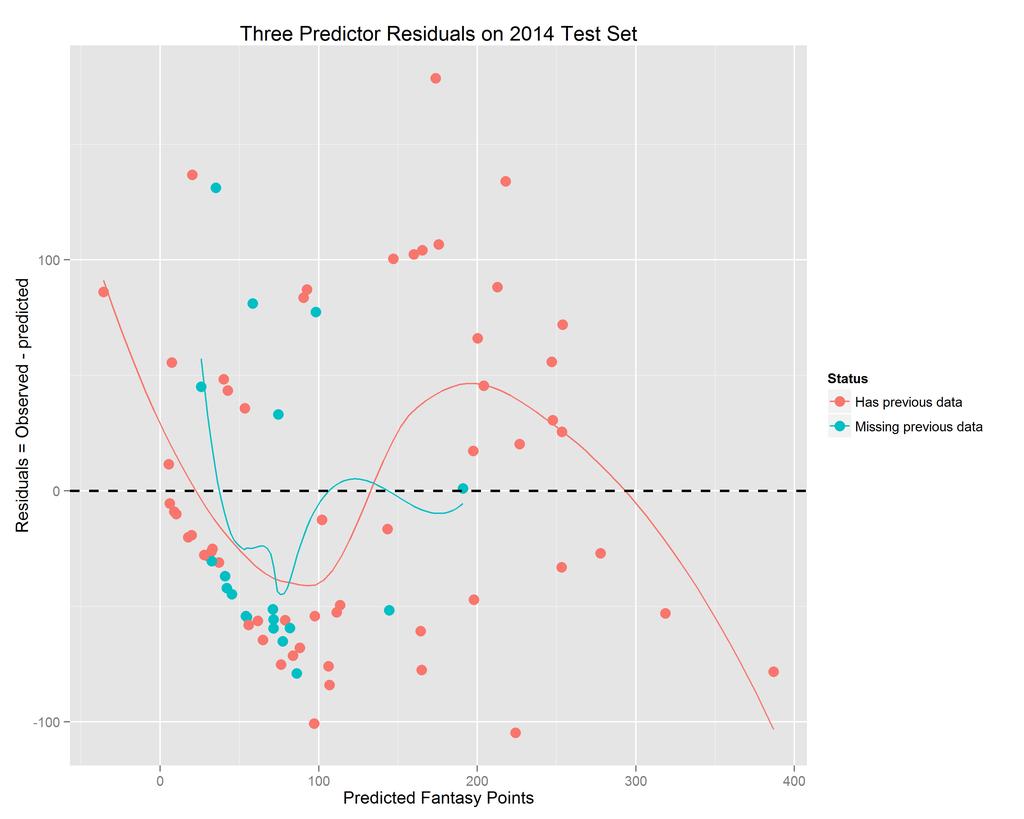
6 7 Analysis To better understand our explanatory variables and their effects on the current season s fantasy points, we read the output from the summary call in R on our models. We include the output from our final most successful model. Residuals: Min 1Q Median 3Q Max Coefficients: Estimate Std. Error t value Pr(> t ) (Intercept) oldfanpoints < 2e-16 *** OppPassingDef e-11 *** StatusMissing previous data *** --- Signif. codes: 0 *** ** 0.01 * Figure 1: Bimodal Distribution The most important part of regression analysis is analyzing our residuals [6]. We can see that while we might expect one or two high magnitude residuals as and , more alarmingly we see a median value that is quite fare from zero. This suggests that on average we are over predicting the players fantasy points. A likely reason for this might be due to the bimodal distribution of fantasy points [11]. This suggests that we ought to model the weaker quarterbacks separately from the high-performing star quarterbacks. Unfortunately, none of our attempts to model these populations separately significantly improved our models results. Note that the Standard Errors of oldfanpoints and OppPassingDef are at least an order of magnitude lower than the coefficient estimates, which indicates that our coefficient estimates are likely close to the true coefficient values. Also, the low p values corresponding to the explanatory variables are relevant to predicting the newfanpoints variable. Also of interest is that the estimated coefficient of the third variable indicates that quarterbacks whom do not have previous NFL experience are penalized by about 33 fantasy points for their upcoming year. This suggests new quarterbacks score less fantasy points than experienced ones. As expected, the largest contributor to predicting fantasy points comes from the oldfanpoints variable which should be interpreted as for each 1 unit increase of last year s fantasy points, we predict an increase of about 0.68 for this year s. 6


7 8 Results We include three plots for our simple and three-predictor regression models. The first depicts the goodness of fit, the second helps us see the residuals more closely, and the third depicts the distribution of the residuals. Note that we would ideally obtain normally distributed residuals centered at zero [8]. 7


8 Compare those results with our best multiple regression model. 8

9 9
10 We summarize the results of our three linear models against Fantasy Football s projections in the following table. Model R 2 MASE RMSE Simple LM Predictor LM Predictor LM FFA Projections Table 2: Model Evaluations: Includes players with missing 2013 data 9 Conclusion The most surprising results from our modeling process was noting the power of simple linear regression. Using each players previous season points (and filling in players missing previous season points with the median of that year) got us to explaining 55% of the variation of the next year s points. Adding in the opponents passing defense statistics improved our fit by an additional 6 percentage points. Finally, by training our model to deal with players that had missing data, we were able to explain up to 65% of the variation; this appears to be a significant improvement upon FFA s projections. Unfortunately, data that would be available before the upcoming season such as a quarterback s age, quarterback rating, and projected team offense statistics turned out to lack any real predictive power. Considering that there is high amount of variability for our explanatory variables, it is surprising that we obtained the a significantly higher R 2 than FFA. However, as our still high RM SE indicates, the standard deviation of unexplained variance is about 70.5; we might interpret this to mean that about 66% of the actual results will be within a range of ± 66.5 fantasy points of our predicted values. This means that there is still a lot of room for improvement. Before moving on to other machine learning methods we could expect to easily improve our linear models by acquiring data for the players with missing season 2013 data (possibly through their college games). We would also probably benefit from training on more than just one previous season s fantasy points for the players that have several years of experience. Finally, we have yet to really solve the issue of the bimodal distribution of quarterback fantasy points. More research about dealing with multimodal distributions might help us in separately modeling the two populations of mediocre and star quarterbacks. 10
11 References [1] Matt Bookman. Predicting Fantasy Football - Truth in Data url: http : / / cs229.stanford.edu/proj2012/bookman- PredictingFantasyFootball.pdf (visited on 10/06/2015). [2] John Broberg. Excel for Fantasy Football url: wordpress.com/get-free-nfl-stats-in-excel/ (visited on 09/28/2015). [3] Boris Chen. Turning Advanced Statistics Into Fantasy Football Analysis url: advancedstatistics-into-fantasy-football-analysis.html?ref=football&_r=1 (visited on 10/06/2015). [4] Robert Cohen. An Introduction to PROC LOESS for Local Regression. url: http: // (visited on 10/06/2015). [5] Koehler Hyndman. Another look at measures of forecast accuracy. In: (). url: http: // (visited on 10/06/2015). [6] Gareth James et al. An Introduction to Statistical Learning: With Applications in R. Springer Publishing Company, Incorporated, isbn: , [7] Nitin Kapania. Predicting Fantasy Football Performance with Machine Learning Techniques. URL: FantasyFootballAndMachineLearning.pdf [8] Mark Lunt. Introduction to statistical modelling: linear regression. In: Rheumatology 54.7 (2011), pp [9] J.J McKinley. Using Machine Learning to Create Daily Fantasy Football Projections for the Wild Card Round url: create- daily- fantasy- football- projections- wild- card- round/ (visited on 10/06/2015). [10] Isaac Peterson. Fantasy Football Analytics. URL: net/ (Visited on 09/28/2015). [11] Erhard Reschenhofer. The bimodality principle. In: Journal of Statistics Education 9.1 (2001). [12] Nina Zumel, John Mount, and Jim Porzak. Practical data science with R. Manning,
Matthew Fox CS229 Final Project Report Beating Daily Fantasy Football. Introduction
 Matthew Fox CS229 Final Project Report Beating Daily Fantasy Football Introduction In this project, I ve applied machine learning concepts that we ve covered in lecture to create a profitable strategy
PROJECTING KEY STATISTICS FOR FANTASY FOOTBALL
 PROJECTING KEY STATISTICS FOR FANTASY FOOTBALL A Major Qualifying Project submitted to the Faculty of Worcester Polytechnic Institute In partial fulfillment of the requirements for the Degree in Bachelor
Gridiron-Gurus Final Report
 Gridiron-Gurus Final Report Kyle Tanemura, Ryan McKinney, Erica Dorn, Michael Li Senior Project Dr. Alex Dekhtyar June, 2017 Contents 1 Introduction 1 2 Player Performance Prediction 1 2.1 Components of
Predicting the outcome of NFL games using machine learning Babak Hamadani bhamadan-at-stanford.edu cs229 - Stanford University
 Predicting the outcome of NFL games using machine learning Babak Hamadani bhamadan-at-stanford.edu cs229 - Stanford University 1. Introduction: Professional football is a multi-billion industry. NFL is
State-Space Models with Kalman Filtering for Freeway Traffic Forecasting
 State-Space Models with Kalman Filtering for Freeway Traffic Forecasting Brian Portugais Boise State University brianportugais@u.boisestate.edu Mandar Khanal Boise State University mkhanal@boisestate.edu
Scatter Plots, Correlation, and Lines of Best Fit
 Lesson 7.3 Objectives Interpret a scatter plot. Identify the correlation of data from a scatter plot. Find the line of best fit for a set of data. Scatter Plots, Correlation, and Lines of Best Fit A video
Using Administrative Records for Imputation in the Decennial Census 1
 Using Administrative Records for Imputation in the Decennial Census 1 James Farber, Deborah Wagner, and Dean Resnick U.S. Census Bureau James Farber, U.S. Census Bureau, Washington, DC 20233-9200 Keywords:
Reduce the Wait Time For Customers at Checkout
 BADM PROJECT REPORT Reduce the Wait Time For Customers at Checkout Pankaj Sharma - 61310346 Bhaskar Kandukuri 61310697 Varun Unnikrishnan 61310181 Santosh Gowda 61310163 Anuj Bajpai - 61310663 1. Business
Table 1. List of NFL divisions that have won the Superbowl over the past 52 years.
 MA 2113 Homework #1 Table 1. List of NFL divisions that have won the Superbowl over the past 52 years. NFC North AFC West NFC East NFC North AFC South NFC North NFC East NFC East AFC West NFC East AFC
3.0. GSIS 5.0 Release Notes. NFL GSIS Support: (877) (212)
 (212)") 3.0 NFL GSIS Support: (877) 635-0171 (212) 450-2442 Copyright 2007, The National Football League, All Rights Reserved This document is the property of the NFL. It may not be reproduced or transmitted in
3.0 NFL GSIS Support: (877) 635-0171 (212) 450-2442 Copyright 2007, The National Football League, All Rights Reserved This document is the property of the NFL. It may not be reproduced or transmitted in
UNLEASHED IN STORES AUGUST
 TOPPS CELEBRATES THE KICKOFF OF THE NFL SEASON WITH ITS FLAGSHIP BRAND, 2014 TOPPS! 2014 TOPPS PAYS TRIBUTE TO ICONIC TOPPS DESIGNS OF THE PAST WHILE UNLEASHING THE FUTURE WITH GROUNDBREAKING INSERTS,
Mathematics Success Grade 8
 T936 Mathematics Success Grade 8 [OBJECTIVE] The student will find the line of best fit for a scatter plot, interpret the equation and y-intercept of the linear representation, and make predictions based
Session 5 Variation About the Mean
 Session 5 Variation About the Mean Key Terms for This Session Previously Introduced line plot median variation New in This Session allocation deviation from the mean fair allocation (equal-shares allocation)
STAB22 section 2.4. Figure 2: Data set 2. Figure 1: Data set 1
 STAB22 section 2.4 2.73 The four correlations are all 0.816, and all four regressions are ŷ = 3 + 0.5x. (b) can be answered by drawing fitted line plots in the four cases. See Figures 1, 2, 3 and 4. Figure
Why Randomize? Jim Berry Cornell University
 Why Randomize? Jim Berry Cornell University Session Overview I. Basic vocabulary for impact evaluation II. III. IV. Randomized evaluation Other methods of impact evaluation Conclusions J-PAL WHY RANDOMIZE
How can it be right when it feels so wrong? Outliers, diagnostics, non-constant variance
 How can it be right when it feels so wrong? Outliers, diagnostics, non-constant variance D. Alex Hughes November 19, 2014 D. Alex Hughes Problems? November 19, 2014 1 / 61 1 Outliers Generally Residual
Spring 2017 Math 54 Test #2 Name:
 Spring 2017 Math 54 Test #2 Name: You may use a TI calculator and formula sheets from the textbook. Show your work neatly and systematically for full credit. Total points: 101 1. (6) Suppose P(E) = 0.37
Developments in Electromagnetic Inspection Methods II
 6th International Conference on NDE in Relation to Structural Integrity for Nuclear and Pressurized Components October 2007, Budapest, Hungary For more papers of this publication click: www.ndt.net/search/docs.php3?mainsource=70
Learning Dota 2 Team Compositions
 Learning Dota 2 Team Compositions Atish Agarwala atisha@stanford.edu Michael Pearce pearcemt@stanford.edu Abstract Dota 2 is a multiplayer online game in which two teams of five players control heroes
LOW POWER GLOBAL NAVIGATION SATELLITE SYSTEM (GNSS) SIGNAL DETECTION AND PROCESSING
 SIGNAL DETECTION AND PROCESSING") LOW POWER GLOBAL NAVIGATION SATELLITE SYSTEM (GNSS) SIGNAL DETECTION AND PROCESSING Dennis M. Akos, Per-Ludvig Normark, Jeong-Taek Lee, Konstantin G. Gromov Stanford University James B. Y. Tsui, John Schamus
LOW POWER GLOBAL NAVIGATION SATELLITE SYSTEM (GNSS) SIGNAL DETECTION AND PROCESSING Dennis M. Akos, Per-Ludvig Normark, Jeong-Taek Lee, Konstantin G. Gromov Stanford University James B. Y. Tsui, John Schamus
Detiding DART R Buoy Data and Extraction of Source Coefficients: A Joint Method. Don Percival
 Detiding DART R Buoy Data and Extraction of Source Coefficients: A Joint Method Don Percival Applied Physics Laboratory Department of Statistics University of Washington, Seattle 1 Overview variability
Optimal Yahtzee performance in multi-player games
 Optimal Yahtzee performance in multi-player games Andreas Serra aserra@kth.se Kai Widell Niigata kaiwn@kth.se April 12, 2013 Abstract Yahtzee is a game with a moderately large search space, dependent on
An Introduction to Machine Learning for Social Scientists
 An Introduction to Machine Learning for Social Scientists Tyler Ransom University of Oklahoma, Dept. of Economics November 10, 2017 Outline 1. Intro 2. Examples 3. Conclusion Tyler Ransom (OU Econ) An
Modified Knaster s Sealed Bids Approaches for Fantasy Sports Drafts
 Abstract Modified Knaster s Sealed Bids Approaches for Fantasy Sports Drafts Phil Poletti, Joseph Massey {ppoletti, jmassey}@wustl.edu Repo: fdfantasysports Department of Computer Science, Washington University
What is a Z-Code Almanac?
 ZcodeSystem.com Presents Guide v.2.1. The Almanac Beta is updated in real time. All future updates are included in your membership What is a Z-Code Almanac? Today we are really excited to share our progress
Read & Download (PDF Kindle) Essential Strategies For Winning At Daily Fantasy Sports
 Essential Strategies For Winning At Daily Fantasy Sports") Read & Download (PDF Kindle) Essential Strategies For Winning At Daily Fantasy Sports Daily fantasy sports is significantly different than traditional fantasy sports and requires unique strategies and
Read & Download (PDF Kindle) Essential Strategies For Winning At Daily Fantasy Sports Daily fantasy sports is significantly different than traditional fantasy sports and requires unique strategies and
Reminders. Quiz today. Please bring a calculator to the quiz
 Reminders Quiz today Please bring a calculator to the quiz 1 Regression Review (sort of Ch. 15) Warning: Outside of known textbook space Aaron Zimmerman STAT 220 - Summer 2014 Department of Statistics
Statistics, Probability and Noise
 Statistics, Probability and Noise Claudia Feregrino-Uribe & Alicia Morales-Reyes Original material: Rene Cumplido Autumn 2015, CCC-INAOE Contents Signal and graph terminology Mean and standard deviation
May 10, 2016, NSF-Census Research Network, Census Bureau. Research supported by NSF grant SES
 A 2016 View of 2020 Census Quality, Costs, Benefits Bruce D. Spencer Department of Statistics and Institute for Policy Research Northwestern University May 10, 2016, NSF-Census Research Network, Census
Pan (7:30am) Juan (8:30am) Juan (9:30am) Allison (10:30am) Allison (11:30am) Mike L. (12:30pm) Mike C. (1:30pm) Grant (2:30pm)
 Juan (8:30am) Juan (9:30am) Allison (10:30am) Allison (11:30am) Mike L. (12:30pm) Mike C. (1:30pm) Grant (2:30pm)") STAT 225 FALL 2012 EXAM ONE NAME Your Section (circle one): Pan (7:30am) Juan (8:30am) Juan (9:30am) Allison (10:30am) Allison (11:30am) Mike L. (12:30pm) Mike C. (1:30pm) Grant (2:30pm) Grant (3:30pm)
STAT 225 FALL 2012 EXAM ONE NAME Your Section (circle one): Pan (7:30am) Juan (8:30am) Juan (9:30am) Allison (10:30am) Allison (11:30am) Mike L. (12:30pm) Mike C. (1:30pm) Grant (2:30pm) Grant (3:30pm)
Demand for Commitment in Online Gaming: A Large-Scale Field Experiment
 Demand for Commitment in Online Gaming: A Large-Scale Field Experiment Vinci Y.C. Chow and Dan Acland University of California, Berkeley April 15th 2011 1 Introduction Video gaming is now the leisure activity
Predicting outcomes of professional DotA 2 matches
 Predicting outcomes of professional DotA 2 matches Petra Grutzik Joe Higgins Long Tran December 16, 2017 Abstract We create a model to predict the outcomes of professional DotA 2 (Defense of the Ancients
CSE 258 Winter 2017 Assigment 2 Skill Rating Prediction on Online Video Game
 ABSTRACT CSE 258 Winter 2017 Assigment 2 Skill Rating Prediction on Online Video Game In competitive online video game communities, it s common to find players complaining about getting skill rating lower
The US Chess Rating system
 The US Chess Rating system Mark E. Glickman Harvard University Thomas Doan Estima April 24, 2017 The following algorithm is the procedure to rate US Chess events. The procedure applies to five separate
CONTENTS THE RULES 3 GAME MODES 6 PLAYING NFL BLITZ 10
 TM CONTENTS THE RULES 3 GAME MODES 6 PLAYING NFL BLITZ 10 THE RULES Quarter Length In NFL Blitz, you play four two-minute quarters and score when you make it to the end zone. Clock You have 10 seconds
Dota2 is a very popular video game currently.
 Dota2 Outcome Prediction Zhengyao Li 1, Dingyue Cui 2 and Chen Li 3 1 ID: A53210709, Email: zhl380@eng.ucsd.edu 2 ID: A53211051, Email: dicui@eng.ucsd.edu 3 ID: A53218665, Email: lic055@eng.ucsd.edu March
(3 pts) 1. Which statements are usually true of a left-skewed distribution? (circle all that are correct)
 1. Which statements are usually true of a left-skewed distribution? (circle all that are correct)") STAT 451 - Practice Exam I Name (print): Section: This is a practice exam - it s a representative sample of problems that may appear on the exam and also substantially longer than the in-class exam. It
STAT 451 - Practice Exam I Name (print): Section: This is a practice exam - it s a representative sample of problems that may appear on the exam and also substantially longer than the in-class exam. It
Chapter 4. Displaying and Summarizing Quantitative Data. Copyright 2012, 2008, 2005 Pearson Education, Inc.
 Chapter 4 Displaying and Summarizing Quantitative Data Copyright 2012, 2008, 2005 Pearson Education, Inc. Dealing With a Lot of Numbers Summarizing the data will help us when we look at large sets of quantitative
December 12, FGCU Invitational Mathematics Competition Statistics Team
 1 Directions You will have 4 minutes to answer each question. The scoring will be 16 points for a correct response in the 1 st minute, 12 points for a correct response in the 2 nd minute, 8 points for
AP STATISTICS 2015 SCORING GUIDELINES
 AP STATISTICS 2015 SCORING GUIDELINES Question 6 Intent of Question The primary goals of this question were to assess a student s ability to (1) describe how sample data would differ using two different
Achieving Desirable Gameplay Objectives by Niched Evolution of Game Parameters
 Achieving Desirable Gameplay Objectives by Niched Evolution of Game Parameters Scott Watson, Andrew Vardy, Wolfgang Banzhaf Department of Computer Science Memorial University of Newfoundland St John s.
MATRIX SAMPLING DESIGNS FOR THE YEAR2000 CENSUS. Alfredo Navarro and Richard A. Griffin l Alfredo Navarro, Bureau of the Census, Washington DC 20233
 MATRIX SAMPLING DESIGNS FOR THE YEAR2000 CENSUS Alfredo Navarro and Richard A. Griffin l Alfredo Navarro, Bureau of the Census, Washington DC 20233 I. Introduction and Background Over the past fifty years,
Business Statistics. Lecture 2: Descriptive Statistical Graphs and Plots
 Business Statistics Lecture 2: Descriptive Statistical Graphs and Plots 1 Goals for this Lecture Graphical descriptive statistics Histograms (and bar charts) Boxplots Scatterplots Time series plots Mosaic
Section 3 Correlation and Regression - Worksheet
 The data are from the paper: Exploring Relationships in Body Dimensions Grete Heinz and Louis J. Peterson San José State University Roger W. Johnson and Carter J. Kerk South Dakota School of Mines and
Jitter Analysis Techniques Using an Agilent Infiniium Oscilloscope
 Jitter Analysis Techniques Using an Agilent Infiniium Oscilloscope Product Note Table of Contents Introduction........................ 1 Jitter Fundamentals................. 1 Jitter Measurement Techniques......
Official Skirmish Tournament Rules
 Official Skirmish Tournament Rules Version 2.0.1 / Updated 12.23.15 All changes and additions made to this document since the previous version are marked in blue. Tiebreakers, Page 2 Round Structure, Page
PRICES OF THE LIBERTY STANDING QUARTER
 This document deals with the prices paid by collectors for quarters in the Liberty standing set, issued between 1916 and 1930. Year / Mint / Type Mintage Value 1916 52,000 14,690 1917 Type 1 8,740,000
Comp 3211 Final Project - Poker AI
 Comp 3211 Final Project - Poker AI Introduction Poker is a game played with a standard 52 card deck, usually with 4 to 8 players per game. During each hand of poker, players are dealt two cards and must
How Many Imputations are Really Needed? Some Practical Clarifications of Multiple Imputation Theory
 Prev Sci (2007) 8:206 213 DOI 10.1007/s11121-007-0070-9 How Many Imputations are Really Needed? Some Practical Clarifications of Multiple Imputation Theory John W. Graham & Allison E. Olchowski & Tamika
Review of TECMO Super Bowl
 Review of TECMO Super Bowl (c) 2001 - Jeffrey Mancuso Some images are linked to their respective sources. Cover of TECMO Super Bowl Sure Madden 2001 for Playstation 2 has amazing real-time 3D graphics
Chaloemphon Meechai 1 1
 A Study of Factors Affecting to Public mind of The Eastern University of Management and Technology in Faculty Business Administration students Chaloemphon Meechai 1 1 Office of Business Administration,
MULTIPLICATION FACT FOOTBALL
 DIRECTIONS FOR STUDENTS: MULTIPLICATION FACT FOOTBALL 1. Students pair up and decide who will answer questions first (be on offense). That student places his or her helmet (or a colored counter) onto the
Math 247: Continuous Random Variables: The Uniform Distribution (Section 6.1) and The Normal Distribution (Section 6.2)
 and The Normal Distribution (Section 6.2)") Math 247: Continuous Random Variables: The Uniform Distribution (Section 6.1) and The Normal Distribution (Section 6.2) The Uniform Distribution Example: If you are asked to pick a number from 1 to 10
Math 247: Continuous Random Variables: The Uniform Distribution (Section 6.1) and The Normal Distribution (Section 6.2) The Uniform Distribution Example: If you are asked to pick a number from 1 to 10
HEALTH CARE EXPENDITURE IN AFRICA AN APPLICATION OF SHRINKAGE METHODS
 Vol., No., pp.1, May 1 HEALTH CARE EXPENDITURE IN AFRICA AN APPLICATION OF SHRINKAGE METHODS Emmanuel Thompson Department of Mathematics, Southeast Missouri State University, One University Plaza, Cape
Operation Take the Hill Event Outline. Participant Requirements. Patronage Card
 Operation Take the Hill Event Outline Operation Take the Hill is an Entanglement event that puts players on a smaller field of battle and provides special rules for the duration of the event. Follow the
(Notice that the mean doesn t have to be a whole number and isn t normally part of the original set of data.)
") One-Variable Statistics Descriptive statistics that analyze one characteristic of one sample Where s the middle? How spread out is it? Where do different pieces of data compare? To find 1-variable statistics
One-Variable Statistics Descriptive statistics that analyze one characteristic of one sample Where s the middle? How spread out is it? Where do different pieces of data compare? To find 1-variable statistics
AUTOMATED MUSIC TRACK GENERATION
 AUTOMATED MUSIC TRACK GENERATION LOUIS EUGENE Stanford University leugene@stanford.edu GUILLAUME ROSTAING Stanford University rostaing@stanford.edu Abstract: This paper aims at presenting our method to
Read & Download (PDF Kindle) Fantasy Football For Smart People: How To Win At Daily Fantasy Sports
 Fantasy Football For Smart People: How To Win At Daily Fantasy Sports") Read & Download (PDF Kindle) Fantasy Football For Smart People: How To Win At Daily Fantasy Sports "Fantasy Football for Smart People: How to Win at Daily Fantasy Sports" is a data-driven guide to becoming
Read & Download (PDF Kindle) Fantasy Football For Smart People: How To Win At Daily Fantasy Sports "Fantasy Football for Smart People: How to Win at Daily Fantasy Sports" is a data-driven guide to becoming
NEW ASSOCIATION IN BIO-S-POLYMER PROCESS
 NEW ASSOCIATION IN BIO-S-POLYMER PROCESS Long Flory School of Business, Virginia Commonwealth University Snead Hall, 31 W. Main Street, Richmond, VA 23284 ABSTRACT Small firms generally do not use designed
What Limits the Reproductive Success of Migratory Birds? Warbler Data Analysis (50 pts.)
") 1 Warbler Data Analysis (50 pts.) This assignment is based on background information on the following website: http://btbw.hubbardbrookfoundation.org/. To do this assignment, you will need to use the Data
1 Warbler Data Analysis (50 pts.) This assignment is based on background information on the following website: http://btbw.hubbardbrookfoundation.org/. To do this assignment, you will need to use the Data
The Game-Theoretic Approach to Machine Learning and Adaptation
 The Game-Theoretic Approach to Machine Learning and Adaptation Nicolò Cesa-Bianchi Università degli Studi di Milano Nicolò Cesa-Bianchi (Univ. di Milano) Game-Theoretic Approach 1 / 25 Machine Learning
Human or Robot? Robert Recatto A University of California, San Diego 9500 Gilman Dr. La Jolla CA,
 Human or Robot? INTRODUCTION: With advancements in technology happening every day and Artificial Intelligence becoming more integrated into everyday society the line between human intelligence and computer
NUMERICAL DATA and OUTLIERS
 ESSENTIAL MATHEMATICS 2 WEEK 2 NOTES AND EXERCISES NUMERICAL DATA and OUTLIERS Example Peter asked eight friends about the amount of pocket money they received each week. The results were: $20 $32 $32
DOB: Aug. 2, 1988 (Age 30)
") 5-10 197 DOB: Aug. 2, 1988 (Age 30) Pope John Paul II High School 9th Year Hendersonville, Tennessee 2013 Originally selected by Seattle in the 2nd round (60th overall) of the 2010 NFL Draft, Golden Tate
5-10 197 DOB: Aug. 2, 1988 (Age 30) Pope John Paul II High School 9th Year Hendersonville, Tennessee 2013 Originally selected by Seattle in the 2nd round (60th overall) of the 2010 NFL Draft, Golden Tate
A Comparison of Particle Swarm Optimization and Gradient Descent in Training Wavelet Neural Network to Predict DGPS Corrections
 Proceedings of the World Congress on Engineering and Computer Science 00 Vol I WCECS 00, October 0-, 00, San Francisco, USA A Comparison of Particle Swarm Optimization and Gradient Descent in Training
MULTIPLE CHOICE. Choose the one alternative that best completes the statement or answers the question. B) Blood type Frequency
 Blood type Frequency") MATH 1342 Final Exam Review Name Construct a frequency distribution for the given qualitative data. 1) The blood types for 40 people who agreed to participate in a medical study were as follows. 1) O A
MATH 1342 Final Exam Review Name Construct a frequency distribution for the given qualitative data. 1) The blood types for 40 people who agreed to participate in a medical study were as follows. 1) O A
DOB: Aug. 2, 1988 (Age 30)
") 5-10 197 DOB: Aug. 2, 1988 (Age 30) Pope John Paul II High School 9th Year Hendersonville, Tennessee 2013 Originally selected by Seattle in the 2nd round (60th overall) of the 2010 NFL Draft, Golden Tate
5-10 197 DOB: Aug. 2, 1988 (Age 30) Pope John Paul II High School 9th Year Hendersonville, Tennessee 2013 Originally selected by Seattle in the 2nd round (60th overall) of the 2010 NFL Draft, Golden Tate
Multiple Choice: Identify the choice that best completes the statement or answers the question.
 Name: Class: Multiple Choice: Identify the choice that best completes the statement or answers the question. 1. A floral delivery company conducts a study to measure the effect of worker experience on
Oakland Raiders Transcript
 Head Coach Jack Del Rio Opening Statement: Fast Friday type approach. On our way traveling down to Dallas tomorrow to play a good football team at their place. Really, this is a critical time in the evaluation
Algebra 1 B Semester Exam Review
 Algebra 1 B 014 MCPS 013 014 Residual: Difference between the observed (actual) value and the predicted (regression) value Slope-Intercept Form of a linear function: f m b Forms of quadratic functions:
Voice Activity Detection
 Voice Activity Detection Speech Processing Tom Bäckström Aalto University October 2015 Introduction Voice activity detection (VAD) (or speech activity detection, or speech detection) refers to a class
ABSTRACT. Keywords: Color image differences, image appearance, image quality, vision modeling 1. INTRODUCTION
 Measuring Images: Differences, Quality, and Appearance Garrett M. Johnson * and Mark D. Fairchild Munsell Color Science Laboratory, Chester F. Carlson Center for Imaging Science, Rochester Institute of
Outcome Forecasting in Sports. Ondřej Hubáček
 Outcome Forecasting in Sports Ondřej Hubáček Motivation & Challenges Motivation exploiting betting markets performance optimization Challenges no available datasets difficulties with establishing the state-of-the-art
Revision: April 18, E Main Suite D Pullman, WA (509) Voice and Fax
 Voice and Fax") Lab 1: Resistors and Ohm s Law Revision: April 18, 2010 215 E Main Suite D Pullman, WA 99163 (509) 334 6306 Voice and Fax Overview In this lab, we will experimentally explore the characteristics of resistors.
Lab 1: Resistors and Ohm s Law Revision: April 18, 2010 215 E Main Suite D Pullman, WA 99163 (509) 334 6306 Voice and Fax Overview In this lab, we will experimentally explore the characteristics of resistors.
10 Wyner Statistics Fall 2013
 1 Wyner Statistics Fall 213 CHAPTER TWO: GRAPHS Summary Terms Objectives For research to be valuable, it must be shared. The fundamental aspect of a good graph is that it makes the results clear at a glance.
Symmetric (Mean and Standard Deviation)
") Summary: Unit 2 & 3 Distributions for Quantitative Data Topics covered in Module 2: How to calculate the Mean, Median, IQR Shapes of Histograms, Dotplots, Boxplots Know the difference between categorical
Summary: Unit 2 & 3 Distributions for Quantitative Data Topics covered in Module 2: How to calculate the Mean, Median, IQR Shapes of Histograms, Dotplots, Boxplots Know the difference between categorical
2008 Excellence in Mathematics Contest Team Project A. School Name: Group Members:
 2008 Excellence in Mathematics Contest Team Project A School Name: Group Members: Reference Sheet Frequency is the ratio of the absolute frequency to the total number of data points in a frequency distribution.
Plotting Points & The Cartesian Plane. Scatter Plots WS 4.2. Line of Best Fit WS 4.3. Curve of Best Fit WS 4.4. Graphing Linear Relations WS 4.
 UNIT 4 - GRAPHING RELATIONS Date Lesson Topic HW Nov. 3 4.1 Plotting Points & The Cartesian Plane WS 4.1 Nov. 6 4.1 Plotting Points & The Cartesian Plane WS 4.1-II Nov. 7 4.2 Scatter Plots WS 4.2 Nov.
Read & Download (PDF Kindle) Fantasy Football For Smart People: What The Experts Don't Want You To Know
 Fantasy Football For Smart People: What The Experts Don't Want You To Know") Read & Download (PDF Kindle) Fantasy Football For Smart People: What The Experts Don't Want You To Know Fantasy Football for Smart People: What the Experts Donâ t Want You to Know contains solutions to
Read & Download (PDF Kindle) Fantasy Football For Smart People: What The Experts Don't Want You To Know Fantasy Football for Smart People: What the Experts Donâ t Want You to Know contains solutions to
Black Box Machine Learning
 Black Box Machine Learning David S. Rosenberg Bloomberg ML EDU September 20, 2017 David S. Rosenberg (Bloomberg ML EDU) September 20, 2017 1 / 67 Overview David S. Rosenberg (Bloomberg ML EDU) September
3 Millions Internet Poker Players Information Records Revealed Online
 3 Millions Internet Poker Players Information Records Revealed Online Released on: July 28, 2008, 6:18 am Press Release Author: Poker Sharks Radar Poker Players Stats Database Search Industry: Internet
Math 10 Homework 2 ANSWER KEY. Name: Lecturer: Instructions
 Math 10 Homework 2 ANSWER KEY Name: Lecturer: Instructions Type your answers and paste images directly into this document. Answers are usually short, with 1-3 sentences. Print out and hand in homework
Coordinate Algebra 1 Common Core Diagnostic Test 1. about 1 hour and 30 minutes for Justin to arrive at work. His car travels about 30 miles per
 1. When Justin goes to work, he drives at an average speed of 55 miles per hour. It takes about 1 hour and 30 minutes for Justin to arrive at work. His car travels about 30 miles per gallon of gas. If
GREATER CLARK COUNTY SCHOOLS PACING GUIDE. Algebra I MATHEMATICS G R E A T E R C L A R K C O U N T Y S C H O O L S
 GREATER CLARK COUNTY SCHOOLS PACING GUIDE Algebra I MATHEMATICS 2014-2015 G R E A T E R C L A R K C O U N T Y S C H O O L S ANNUAL PACING GUIDE Quarter/Learning Check Days (Approx) Q1/LC1 11 Concept/Skill
Sections Descriptive Statistics for Numerical Variables
 Math 243 Sections 2.1.2-2.2.5 Descriptive Statistics for Numerical Variables A framework to describe quantitative data: Describe the Shape, Center and Spread, and Unusual Features Shape How is the data
Global Journal of Engineering Science and Research Management
 A KERNEL BASED APPROACH: USING MOVIE SCRIPT FOR ASSESSING BOX OFFICE PERFORMANCE Mr.K.R. Dabhade *1 Ms. S.S. Ponde 2 *1 Computer Science Department. D.I.E.M.S. 2 Asst. Prof. Computer Science Department,
Chapter IV THEORY OF CELP CODING
 Chapter IV THEORY OF CELP CODING CHAPTER IV THEORY OF CELP CODING 4.1 Introduction Wavefonn coders fail to produce high quality speech at bit rate lower than 16 kbps. Source coders, such as LPC vocoders,
0, 0, 0, 0, 0, 0, 0, 1, 1, 1, 1, 2, 2, 2, 2, 2, 2, 2, 3, 3, 3, 3, 4, 5, 8
 Name Date One Variable Statistics Dot Plots Independent Practice 1. The number of boots that 25 students had in their homes in Florida were recorded below: 0, 0, 0, 0, 0, 0, 0, 1, 1, 1, 1, 2, 2, 2, 2,
Math 165 Section 3.1 Linear Functions
 Math 165 Section 3.1 Linear Functions - complete this page Read the book or the power point presentations for this section. Complete all questions on this page Also complete all questions on page 6 1)
ROBUST DESIGN -- REDUCING TRANSMITTED VARIATION:
 ABSTRACT ROBUST DESIGN -- REDUCING TRANSMITTED VARIATION: FINDING THE PLATEAUS VIA RESPONSE SURFACE METHODS Patrick J. Whitcomb Mark J. Anderson Stat-Ease, Inc. Stat-Ease, Inc. Hennepin Square, Suite 48
M 3 : Manipulatives, Modeling, and Mayhem - Session I Activity #1
 M 3 : Manipulatives, Modeling, and Mayhem - Session I Activity #1 Purpose: The purpose of this activity is to develop a student s understanding of ways to organize data. In particular, by completing this
System and method for subtracting dark noise from an image using an estimated dark noise scale factor
 Page 1 of 10 ( 5 of 32 ) United States Patent Application 20060256215 Kind Code A1 Zhang; Xuemei ; et al. November 16, 2006 System and method for subtracting dark noise from an image using an estimated
Weekly Newsletter. Welcome. UMN Fantasy Sports Analytics and Consulting Club. Week of October 22
 UMN Fantasy Sports Analytics and Consulting Club Weekly Newsletter Week of October 22 Welcome The UMN Fantasy Sports Analytics and Consulting Club (FSAC) would like to welcome you to our organization.
UT-ONE Accuracy with External Standards
 UT-ONE Accuracy with External Standards by Valentin Batagelj Batemika UT-ONE is a three-channel benchtop thermometer readout, which by itself provides excellent accuracy in precise temperature measurements
Operation Blue Metal Event Outline. Participant Requirements. Patronage Card
 Operation Blue Metal Event Outline Operation Blue Metal is a Strategic event that allows players to create a story across connected games over the course of the event. Follow the instructions below in
2. The value of the middle term in a ranked data set is called: A) the mean B) the standard deviation C) the mode D) the median
 the mean B) the standard deviation C) the mode D) the median") 1. An outlier is a value that is: A) very small or very large relative to the majority of the values in a data set B) either 100 units smaller or 100 units larger relative to the majority of the values
1. An outlier is a value that is: A) very small or very large relative to the majority of the values in a data set B) either 100 units smaller or 100 units larger relative to the majority of the values
A New Design and Analysis Methodology Based On Player Experience
 A New Design and Analysis Methodology Based On Player Experience Ali Alkhafaji, DePaul University, ali.a.alkhafaji@gmail.com Brian Grey, DePaul University, brian.r.grey@gmail.com Peter Hastings, DePaul
CS221 Project Final Report Gomoku Game Agent
 CS221 Project Final Report Gomoku Game Agent Qiao Tan qtan@stanford.edu Xiaoti Hu xiaotihu@stanford.edu 1 Introduction Gomoku, also know as five-in-a-row, is a strategy board game which is traditionally
ƑantasyɃit. The Token of Fantasy Football Skill
 ƑantasyɃit The Token of Fantasy Football Skill by ƑantasyɃit Blockchain Token Created by NFL Statistics Earned with Skill Utilized in Distributed Futures Market Fantasy Sports Fantasy Players mimic GMs
Simulated Statistics for the Proposed By-Division Design In the Consumer Price Index October 2014
 Simulated Statistics for the Proposed By-Division Design In the Consumer Price Index October 2014 John F Schilp U.S. Bureau of Labor Statistics, Office of Prices and Living Conditions 2 Massachusetts Avenue