Technical Documentation
|
|
|
- Melvin Simpson
- 5 years ago
- Views:
Transcription
1 Technical Documentation Hand-held Analyzers Types 2250 and 2270 With Sound Level Meter Software BZ-7222, Frequency Analysis Software BZ-7223, Logging Software BZ-7224, Enhanced Logging Software BZ-7225, Sound Recording Option BZ-7226, Reverberation Time Software BZ-7227 and Tone Assessment Option BZ-7231 User Manual English BE
2
3 Hand-held Analyzers Types 2250 and 2270 with Sound Level Meter Software BZ-7222, Frequency Analysis Software BZ-7223, Logging Software BZ-7224, Enhanced Logging Software BZ-7225, Sound Recording Option BZ-7226, Reverberation Time Software BZ-7227 and Tone Assessment Option BZ-7231 User Manual BE April 2011
4 BE April 2011
5 Safety Considerations This apparatus has been designed and tested in accordance with EN/IEC and ANSI/ UL Safety Requirements for Electrical Equipment for Measurement, Control and Laboratory Use. This manual contains information and warnings which must be followed to ensure safe operation and to retain the apparatus in safe condition. Special note should be made of the following: Safety Symbols The apparatus will be marked with this symbol when it is important that you refer to the associated warning statements given in the manual. Protective Earth Terminal Hazardous Voltage Explosion Hazard The equipment is not designed to be used in potentially explosive environments. It should not be operated in the presence of flammable liquids or gases. Warnings Switch off all power to equipment before connecting or disconnecting their digital interface. Failure to do so could damage the equipment. Whenever it is likely that the correct function or operating safety of the apparatus has been impaired, it must be made inoperative and be secured against unintended operation. Any adjustment, maintenance and repair of the open apparatus under voltage must be avoided as far as possible and, if unavoidable, must be carried out only by trained service personnel. Do not dispose of electronic equipment or batteries as unsorted municipal waste It is your responsibility to contribute to a clean and healthy environment by using the appropriate local return and collection systems Hazardous substances in electronic equipment or batteries may have detrimental effects on the environment and human health The symbol shown to the left indicates that separate collection systems must be used for any discarded equipment or batteries marked with that symbol Waste electrical and electronic equipment or batteries may be returned to your local Brüel & Kjær representative or to Brüel & Kjær Headquarters for disposal Trademarks Microsoft, Windows and Excel are registered trademarks of Microsoft Corporation. PCL is a registered trademark of the Hewlett-Packard Company. Pentium is a registered trademark of Intel Corporation or its subsidiaries. Copyright , Brüel & Kjær Sound & Vibration Measurement A/S All rights reserved. No part of this publication may be reproduced or distributed in any form, or by any means, without prior written consent from Brüel & Kjær Sound & Vibration Measurement A/S, Nærum, Denmark
6
7 Contents CHAPTER 1 Introduction Welcome How to Use this Manual... 1 Conventions Used in this Manual... 1 Beginners... 2 Experienced Users of Acoustic Measurement Equipment... 2 CHAPTER 2 Assembling your Analyzer Introduction Instrument Components Description of Inputs/Outputs... 6 Top Socket... 6 USB Interface... 6 Earphone... 7 Output... 7 Trigger Input... 7 Input 1 (Type 2270 only)... 8 Input (Input Ch.2 for Type 2270)... 8 External Power... 8 Battery Charge Indicator... 8 Reset Button... 8 Slot for Compact Flash (CF) Cards... 8 Slot for Secure Digital (SD) Cards... 9 LAN Socket (Type 2270 only) Hardware Setup Assembling the Analyzer Charging the Battery for the First Time Making Good Measurements Alternative Measurement Method (Extended Microphone) Measuring for Convenience CHAPTER 3 Making your First Measurement Introduction Point and Shoot Congratulations! Making a Measurement What is a Project Template? Switching On Set the Sound Level Meter Project Template... 17
8 3.4 Save your Measurement Viewing the Saved Measurement Document your Measurement Switching Off CHAPTER 4 Calibration Introduction Acoustic Calibration Sound Level Calibration Standard Calibration Calibration Settings Vibration Calibration Electrical Calibration Manual Calibration Calibration History Transducer Database Calibration Reminder Charge Injection Calibration Theory of CIC Performing a Manual CIC Calibration with your Type 2250/ CHAPTER 5 Getting to Know Your Analyzer What is a Sound Level Meter? What is the Hand-held Analyzer? Sound Level Meter Software Module BZ Frequency Analysis Software Module BZ Logging Software Module BZ Enhanced Logging Software Module BZ Sound Recording Option BZ Reverberation Time Software BZ Tone Assessment Option BZ Built-in Help What is Utility Software for Hand-held Analyzers BZ-5503? Basic Principles when using the Analyzer Navigation Principles Star Navigation Concept The Display Screen Use of Pushbuttons for Controlling Measurements On-screen Feedback and Traffic Light Use of Stylus and Navigation Pushbuttons How to Change Parameter Values How to Personalise your Setup How to Manage the Project Templates Locking the Pushbuttons and Display CHAPTER 6 Data Management Organising Measurements... 55
9 Description of Jobs and Projects Navigating in Jobs Selecting Default Measurement Job/Path Recalling Measurements Viewing Data Re-using Setups from Projects Viewing or Listening to Annotations and Metadata CHAPTER 7 Connection to PC or Mobile Phone Introduction Transferring Measurement Data to Your PC Post-processing and Reporting Internet Browser for On-line Display and Control of the Analyzer CHAPTER 8 Advanced Use of the Analyzer Tips and Tricks Setting your Preferences on the Analyzer Display Settings Power Settings Regional Settings Storage Settings Headphone Settings Multi-user Facility Printer Settings Modem/DynDNS Settings Connection Through Modem Connection to Network using GPRS/EDGE/HSPA Modem DynDNS Network Settings Parameters in Network Settings Notifications Web-server Preparing your Measurements Metadata Timers and Automatic Measurements CHAPTER 9 Updating and Upgrading Applications, Maintenance, Calibration and Troubleshooting How to Install New Applications How to Update/Upgrade Applications and Install New Languages Update/Upgrade using BZ Update Through the Internet Downgrade to an Earlier Version How to Move a License Troubleshooting Analyzer Measurements... 92
10 SD and CF Cards Battery Pack and Recalibration of Battery Charge Indicator Touch Screen Reset Options Care, Cleaning and Storage Handling the Instrument Cleaning the Instrument Storing the Instrument Services at Brüel & Kjær for Types 2250 and Accredited Calibration Initial Calibration Regular Re-calibration Filter Calibration Service and Repair Hardware Maintenance and Repair Rental Training CHAPTER 10 1/1- or 1/3-octave Frequency Analysis (Optional Module) Setting up the Instrument Controlling the Measurement Displaying the Results Smileys Saving Results CHAPTER 11 Logging (Optional Module) Setting up the Instrument Controlling the Measurement Annotating a Project Recording Sound Displaying the Results The Profile View Marking Sound Categories Editing Markers on Profiles Annotate Sound Categories Editing Annotations on Profiles Saving and Recalling Results CHAPTER 12 Enhanced Logging (Optional Module) Setting up the Instrument Controlling the Measurement Annotating a Project Recording Sound Displaying the Results The Profile View Displaying Noise Indicators
11 Saving and Recalling Results CHAPTER 13 Sound Recording (Optional Module) Sound Level Meter and Frequency Analysis Software Setting up the Instrument Controlling the Recording Playing the Recording Logging and Enhanced Logging Software Setting up the Instrument Controlling the Recording Control Recording using the Stylus Playing the Recording Sound Recordings on the PC CHAPTER 14 Reverberation Time Software (Optional Module) Introduction Definition How Do We Measure Reverberation Time? Setting up the Instrument Interrupted Noise Method Impulsive Method Sound Recording Controlling the Measurement Annotating Projects and Positions Displaying the Results Overview Spectrum Decay Measurements with Graphical Position Management Quality Indicators Saving and Recalling Results CHAPTER 15 Tone Assessment Option BZ /3-octave Method General Tone Assessment According to ISO , Annex D ISO , Annex D Tone Assessment Calculations Tone Assessment according to Italian Law Setting up the Instrument Selecting the Tone Assessment Option Setting up a Measurement Manually Setting up the Measurement using the Default Setup Sound Recording Measuring Result Display Logging Software BZ-7224 Template
12 15.7 Enhanced Logging Software BZ-7225 Template Status Codes (Smiley s) Recalling Saved Measurements CHAPTER 16 Specifications APPENDIX A Setup Parameters A.1 Input (for Type 2250) A.2 Input (for Type 2270) A.3 Input Ch. 1 (for Type 2270) A.4 Input Ch. 2 (for Type 2270) A.5 Frequency Weightings A.6 Bandwidth A.7 Statistics A.8 Measurement Control for BZ-7222 to BZ A.9 Measurement Control for Reverberation Time Software BZ A.10 Logged Broadband (100 ms) A.11 Logged Broadband A.12 Logged Spectrum A.13 Markers A.14 Level Trigger A.15 Triggers A.16 Sound Recording A.17 Output Socket Signal A.18 L den Periods A.19 Occupational Health A.20 Generator A.21 Post-processing A.22 Tone Assessment APPENDIX B Measurement Parameters B.1 Total Measurement For Sound Level Meter Software BZ-7222, Frequency Analysis Software BZ-7223, Logging Software BZ-7224 and Enhanced Logging Software BZ B.2 Periodic Reports For Enhanced Logging Software BZ B.3 Logged Measurement For Logging Software BZ-7224 and Enhanced Logging Software BZ B.4 Logged (100 ms) Measurement For Logging Software BZ-7224 and Enhanced Logging Software BZ B.5 Instantaneous Measured Parameters (available at any time) Processed Parameters for Display Only Relationship Between Setup and Measurement Parameters B.6 Reverberation Time Measurement For Reverberation Time Software BZ
13 APPENDIX C Instrument Parameters C.1 Current Transducer C.2 Transducer Database Transducer Setup Calibration History C.3 Calibration Setup C.4 Type 2250/2270 Microphones APPENDIX D Preferences D.1 Display Settings D.2 Power Settings D.3 Regional Settings D.4 Storage Settings D.5 Headphone Settings D.6 Users D.7 Printer Settings D.8 Modem/DynDNS Settings D.9 Network Settings D.10 Notification Settings D.11 Web Server Settings D.12 Image Settings (Type 2270 only) APPENDIX E Glossary INDEX
14
15 1 Chapter 1 Introduction 1.1 Welcome This user manual describes the Type 2250 Hand-held Analyzer and the Type 2270 Hand-held Analyzer platforms, including Sound Level Meter Software BZ-7222, Frequency Analysis Software BZ-7223, Logging Software BZ-7224, Enhanced Logging Software BZ-7225, Sound Recording Option BZ-7226, Reverberation Time Software BZ-7227 and Tone Assessment Option BZ The manual explains how to perform a basic sound measurement, which parameters you can measure and how the instrument should be operated. In addition, some practical hints and guidelines are provided, including all relevant technical specifications. Finally, a glossary is added to help with specific terminology found in this manual. 1.2 How to Use this Manual Conventions Used in this Manual Analyzer refers to Type 2250 or Type 2270 if the description is valid for both types. Instructions and descriptions that refer to the analyzer pushbuttons are shown with the pushbutton icons as seen on the instrument. See Chapter 2 for a list of pushbutton icons and their functions. Menu items and buttons/tabs used on the screen Indicated by bold type face (for example, select Calibration from the list of options). Parameter Text Appearing on the Screen Parameters, instructions and descriptions appearing on the screen are indicated by italics (for example, Measurement Mode). Path Denotations Indicated by capitals (for example, SETUP\BZ7222\).
16 2 Hand-held Analyzers Types 2250 and 2270 User Manual Beginners Before you read the rest of this manual, read Brüel & Kjær s primer on Measuring Sound. This will give you a basic idea of acoustic measurements. It can be found on the Web site, by typing Primer in the search window. The Web site also contains lots of other information you might find useful. Further information is available in the On-line Help installed on the analyzer Experienced Users of Acoustic Measurement Equipment The manual is designed so that you don t have to read all of it to be able to use the instrument. It is built around the most frequently used operations, these are as follows: Assembling your Analyzer (see Chapter 2) Making your First Measurement (see Chapter 3) Getting to Know Your Analyzer (see Chapter 5) Calibration (see Chapter 4) Data Management (see Chapter 6) Connection to PC or Mobile Phone (see Chapter 7) Advanced Use of the Analyzer Tips and Tricks (see Chapter 8) Updating and Upgrading Applications, Maintenance and Troubleshooting (see Chapter 9) However, it is recommended that you read the entire manual for appropriate procedures on how to use the analyzer to obtain accurate sound level measurement results.
17 3 Chapter 2 Assembling your Analyzer 2.1 Introduction This chapter describes how to assemble and set up your analyzer. It provides a brief description and an associated diagram showing the instrument components and the various input and output connections. This enables you to start getting familiar with the instrument, while assembling your system. This is followed by an overview of the hardware components, showing all the main configurations of the instrument and its accessories. Finally, instructions are provided that explain how to assemble standard and optional hardware components used in your system. Once you have followed the assembly instructions, your hand-held analyzer will be ready to make measurements. 2.2 Instrument Components An overview of the main Instrument components is provided in Fig.2.1. The descriptions that follow refer to those components.
 Measurement Microphone: A Brüel & Kjær Prepolarized Free-field ½ Microphone is used.")
18 4 Hand-held Analyzers Types 2250 and 2270 User Manual Fig.2.1 Instrument components ) Measurement Microphone: A Brüel & Kjær Prepolarized Free-field ½ Microphone is used. A robust and reliable microphone with a wide frequency range. 2) Preamplifier: Used to convert the high-impedance output of the microphone to low impedance, suitable for driving long extension cables. 3) (Manual Event Pushbutton): This allows you to manually indicate events during a measurement. Using BZ-7222 and BZ-7223 software you can control sound recording (this requires a license for the BZ-7226 option), and using BZ-7224 Logging Software or
19 CHAPTER 2 Assembling your Analyzer 5 BZ-7225 Enhanced Logging Software you can insert an Event Marker and control sound recording (the latter requires a license for the BZ-7226 option). In Type 2270 this button can also be used to capture images. 4) (Commentary Pushbutton): This allows you to add recorded audio messages to your measurement files. 5),,, (Navigation Pushbuttons): These move the active screen component (Field Selector) and navigate the user interface. 6) (Back-erase Pushbutton): This allows you to erase the last 5 seconds of measurement data or to insert an Exclude Marker (BZ-7224 Logging Software or BZ-7225 Enhanced Logging Software only). 7) (Accept Pushbutton): This allows you to accept any changes you make to the instrument s setup. 8) (Reset Measurement Pushbutton): This allows you clear the current measurement from the screen. 9) (Start/Pause Pushbutton): Press this to start, pause or continue with a measurement. 10) (Status Indicator): The red, yellow or green lights, (or LEDs), referred to as the Traffic Light either side of the Start/Pause pushbutton, indicate important states of the instrument during operation, i.e., measurement stopped, paused or running. See Chapter 4 for further details. 11) (Save Pushbutton): This allows you to save measurement results. 12) Display Screen: A high-contrast, colour, touch-sensitive screen. 13) (Main Menu Icon): This calls up the Main Menu, which allows you to navigate immediately to all the main functions of the instrument, such as Setup, Explorer (or Databrowser), Preferences, and the Calibration procedure. 14) (Power-on Pushbutton): Turns the instrument on and off. If held in for 1 second, the instrument goes into standby mode; if held in for more than 4 seconds, it turns the instrument off. 15) Stylus: Stored in a holder on the side of the instrument, for use on the touch-sensitive screen. You can choose to use the stylus or the hardkeys, depending on your preference and the measurement situation. (Also see section ) 16) Secondary Microphone: This is used to add recorded comments to measurements and is positioned on the underside of the instrument. 17) Top Socket: This is the main microphone input socket for the instrument. The Measurement Microphone and Preamplifier (items 1 and 2 respectively) are normally connected directly to this socket. For more details see section ) Tripod Mounting Thread: Use this to mount the instrument onto the tripod and/or tripod extension.
20 6 Hand-held Analyzers Types 2250 and 2270 User Manual 19) Wrist Strap/Tripod Mounting Thread: Use this to attach the wrist strap to the instrument for added security, or use it to mount the instrument onto the tripod and/or tripod extension using the tripod adaptor UA ) Internal Battery Pack: Rechargeable, high-capacity Li-Ion battery pack to power the instrument. 21) Hinged Cover FB-0679/FB-0699: A removable plastic cover is provided, which is hinged at the top to provide protection for the connector panel underneath. To remove, simply open the cover and pull the hinge out of the slot at the top of the connector panel. The cover includes a rubber insert printed with an overview of the main connectors and reset button for easy recognition. Six indents are provided on the inside of the cover (behind the insert) which allow you to drill holes in the plastic cover, giving access to the main connectors underneath, so you can use the cover while power is connected, for example. 22) Camera (Type 2270 only): This feature is used to add images to measurements. Protected and positioned on the underside at 45 degrees, this is designed to allow simultaneous image capture and noise measurement without the need to reposition the analyzer for each task. 23) High Speed USB and LAN Interfaces (Type 2270 only): This is used to provide fast and seamless transfer of measurment data, recordings and photographs back to the office. Both high-speed interfaces, USB or LAN, can be used when the analyzer is located in close proximity to the PC. However, if the analyzer is remote from the host PC, the LAN interface has the further advantage of data download from anywhere within the same LAN network. Both interfaces are not just used for data download, but also for remote monitoring and remote control of Type Description of Inputs/Outputs Top Socket This 10-pin LEMO connector is the main microphone input for the instrument (see item 17 in Fig.2.1). Microphone Type 4189 (including Preamplifier ZC-0032) is normally connected directly to this connector. If required, however, one of two microphone extension cables (AO-0697-D-030, 3 m and AO-0697-D-100, 10 m), can be fitted between the input stage and the main microphone input socket, to extend the distance to the desired length. For Type 2270, the microphone is connected to input Channel 1. In addition, you can use the Dual 10-pole Adaptor JP-1041 for accessing both input Channel 1 and input Channel USB Interface The USB Interface (see item 1 in Fig.2.2) provides high-speed direct communication with a PC s USB port. It is used to synchronise measurement and setup data with a host PC. Use the supplied cable, AO The USB Interface is also used for connection to a printer (see section 8.1.7). Use cable AO-0657 for connection to a printer that supports PCL language.
 is used to output the conditioned input signal, for monitoring purposes, or to output the generator signal.")
21 CHAPTER 2 Assembling your Analyzer Earphone Output The 3.5 mm minijack earphone socket (see item 2 in Fig.2.2) enables the instrument to be connected to a set of headphones/earphones, for reviewing recorded comments or for monitoring the measured sound. Use the supplied earphones, HT This triaxial LEMO connector (see item 3 in Fig.2.2) is used to output the conditioned input signal, for monitoring purposes, or to output the generator signal. Use cable AO-0440-D-015 (LEMO to BNC) Trigger Input This triaxial LEMO connector (see item 4 in Fig.2.2) is used for the external trigger input, or start/stop signals to the instrument, or for monitoring an external voltage. Using BZ-7222, BZ-7223, BZ-7224 or BZ-7225 software you can control sound recording (this requires a license for the BZ-7226 option). If you want to start and stop the recording using an external device, connect it to this input. See details in Appendix A. Fig.2.2 Connector panel of Type
22 8 Hand-held Analyzers Types 2250 and 2270 User Manual Input 1 (Type 2270 only) This triaxial LEMO connector (see item 11 in Fig.2.2) is used for AC or CCLD inputs to Channel 1. It can be used when analysing electrical signals, from (for example) transducers or sound recordings. Use cable AO-0440-D-015 (LEMO to BNC). Note: This connector is referred to as the Rear Socket Channel 1, also in the software Input (Input Ch.2 for Type 2270) This triaxial LEMO connector (see item 5 in Fig.2.2) is used for AC or CCLD inputs to Type 2250 or to Channel 2 of Type It can be used when analysing electrical signals, from (for example) transducers or sound recordings. Use cable AO-0440-D-015 (LEMO to BNC). Note: This connector is referred to as the Rear Socket (Type 2250) or Rear Socket Channel 2 (Type 2270), also in the software External Power CAUTION: Use specified battery charger only. Charging below 0 C (32 F) is not recommended. Note: If you charge the battery pack below 0 C, the lifetime of the batteries will be reduced. Do not charge battery pack in temperatures above 60 C. Do not dissassemble or expose battery pack to fire or water. The instrument is powered by an internal rechargeable battery pack. An indication of available charge is shown by the battery icon at the bottom of the screen. If the charge remaining is low or empty, the batteries can be recharged by connecting Mains Power Supply (Part No. ZG-0426) to the Ext. Power socket (see item 6 in Fig.2.2). When the power supply lead is connected, the icon will be displayed in place of the battery icon Battery Charge Indicator A battery charge light, (LED), indicates when the battery pack is being charged from external power (see item 7 in Fig.2.2). It shows a steady green light when external power is applied (and the battery is charging), and a flashing green light when charging has finished Reset Button Located above the USB connector (see item 8 in Fig.2.2), it is used to reset the instrument if you have problems with the instrument and cannot get it to operate. To reset, press the button with the point of the stylus see chapter 9 for troubleshooting Slot for Compact Flash (CF) Cards This slot (see item 9 in Fig.2.2) accepts CF sized cards and can be used for memory or, for example, a modem.
23 CHAPTER 2 Assembling your Analyzer Slot for Secure Digital (SD) Cards This slot (see item 10 in Fig.2.2) accepts SD and Secure Digital High Capacity (SDHC) memory cards, and is typically used to save measurement data. Capacities in excess of 2 gigabytes are acceptable LAN Socket (Type 2270 only) The LAN Socket (see item 12 in Fig.2.2) provides high-speed direct communication with a Local Area Network. It is used to synchronise measurement and setup data with a host PC.
24 10 Hand-held Analyzers Types 2250 and 2270 User Manual 2.4 Hardware Setup Fig.2.3 Type 2250/2270 Hardware Overview UA-1404 Outdoor Microphone Kit UA mm Windscreen with AutoDetect 4189/4190 Microphone 4231 Sound Calibrator ZC Microphone Preamplifier AO D-030 Microphone Ext. Cable, 3 m AO D-100 Microphone Ext. Cable, 10 m JP-1041 Dual 10-pole Adaptor UA Small Tripod (or UA -0587) UA Microphone Holder 2250/2270 Hand-held Analyzer UL Industrial Grade SD Memory Card for Hand-held Analyzer BZ Environmental Software CD incl. Utility software QB Rechargeable Battery Pack KE Protective Cover UA extra Styli UA Adaptor for Standard Tripod Mount UA Tripod Extension for Hand-held Analyzer UA Tripod or UA AO-1449-D-010 LAN Interface Cable Crossover, 1m AO-1450 LAN Interface Cable, 1.5 m AO USB Interface Cable, 1.8 m HT-0015 Earphones AO D-015 Output Cable, 1.5 m AO-0440-D-015 Trigger Input Cable, 1.5 m AO Sound Cable, 1.5 m ZG Mains Power Supply AO D-015 Input Cable, 1.5 m DH Wrist Strap KE Travel Bag for 2250/2270 and Accessories FB Hinged Cover for Hand-held Analyzer ZG Battery Charger for QB /7
25 CHAPTER 2 Assembling your Analyzer Assembling the Analyzer Charging the Battery for the First Time Battery Pack QB-0061 comes charged to approximately half capacity on initial delivery. Before assembling your analyzer for the first time, it is recommended that you fully charge the battery pack, by connecting Mains Power Supply ZG-0426 to the external power socket (see item 6 in Fig.2.2). It should take approximately 8 10 hours. The battery charge light (see item 7 in Fig.2.2) shows a steady green light when external power is applied (and the battery is charging), and a flashing green light when charging has finished. You can leave the analyzer with external power on, even when the battery is fully charged. Also refer to section Making Good Measurements The fact that you are using your Type 2250 or Type 2270, which fully complies with the IEC standard, ensures you always make good measurements. The analyzer should be set up using the following recommended assembly instructions. This is to minimise the influence of acoustical reflections during measurements. All the components described below are shown in Fig.2.1 and Fig.2.3. Another set of instructions are provided in section 2.5.3, for situations where you need to position the microphone at a distance from the instrument, while still complying with the standard. Placing the Measurement Microphone The measurement microphone must be placed away from shielding, reflecting, or absorbing objects. In a diffuse sound field, absorbing objects will reduce the measured sound levels. In a free sound field, reflecting objects can change the measured sound levels. Typically, the sound level 0.5 m from a plane reflecting wall is 3 db higher than if there was no wall. The operator of the system may be personally shielding, absorbing, and reflecting, and can be an additional noise source. Measure downwind in dry conditions with a windspeed less than 5 m/s. The optimum position for the microphone is best found by trying different positions and observing the resulting sound levels. Mounting the Measurement Microphone Before mounting the measurement microphone, note the following precautions: When screwing the microphone on, do it gently to avoid damaging threads Keep dust and foreign matter off the microphone diaphragm. Do not touch the diaphragm with anything it is very delicate Note: Once the measurement microphone and preamplifier have been assembled and connected to your analyzer, they should normally be left connected to the instrument.
26 12 Hand-held Analyzers Types 2250 and 2270 User Manual To connect 1) Gently screw the microphone onto Preamplifier ZC-0032, see items 1 and 2 in Fig ) Insert the male plug of the preamplifier into the top socket of the hand-held analyzer (see item 17 in Fig.2.1) and push gently until it snaps into position. To Disconnect 1) To remove the preamplifier and microphone, grip the locking collar firmly and slide back, to remove the preamplifier and microphone combination from the instrument. Mounting the Windscreen For short outdoor noise measurements (or indoor measurements exposed to air movement) mount Windscreen UA-1650 onto the microphone and preamplifier combination, making sure it snaps into place over the windscreen sensor. The sensor is built into the preamplifier, see item 2 in Fig.2.1. Icons in the status field on the screen indicate whether the windscreen is detected or not. For longer-term outdoor measurements, see Mounting the Outdoor Microphone Kit below. Mounting the Analyzer onto the Tripod Extension Stem and Tripod Mount the analyzer onto the Tripod Extension Stem UA-1651 and Small Tripod UA-0801, as follows: 1) Screw Tripod Extension Stem UA-1651 onto the threaded stud of the ball-joint on Small Tripod UA Secure the ball-joint roughly in a vertical position (i.e., in-line with the tripod) until ready to follow the instruction in step 4. 2) Screw the Extension Stem UA-1651 into the instrument, using the threaded socket situated on the underside of the instrument, at the back (see item 18 in Fig.2.1). 3) Set Small Tripod UA-0801 (including the instrument) in the required position, and adjust it to the required height. Ensure that one of the three legs is pointing roughly in the same direction as your instrument needs to point. (We will refer to this leg as the front leg.) 4) Position the extension stem at an angle of 45 to the horizontal and vertically in-line with the front leg of the tripod this is to ensure the whole setup is stable. Note: The procedure is the same if Tripod UA-0587 is used instead of Small Tripod UA Once you have carried out these instructions, you are ready to start measuring, see Chapter Alternative Measurement Method (Extended Microphone) The measurement microphone can be placed a distance from the instrument by connecting an extension cable and fitting the microphone to a microphone holder or to Outdoor Kit UA The instrument should be set up using the following assembly instructions. This is to ensure that the accessories have limited acoustical influence on the instrument during measurement. All the components described below are shown in Fig.2.1 and Fig.2.3.
27 CHAPTER 2 Assembling your Analyzer 13 Mounting the Outdoor Microphone Kit For longer-term outdoor measurements, an Outdoor Microphone Kit UA-1404 will be required as an alternative to the windscreen. If this is the case, mount the kit onto the microphone and preamplifier combination according to assembly and mounting instructions in the User Manual for the Outdoor Microphone Kit, BE Connecting a Microphone Extension Cable The optional extension cables that are recommended for use with Type 2250/2270 are: AO-0697-D m long AO-0697-D m long Note: Connecting a recommended microphone extension cable has no acoustical effect on the hand-held analyzer s measurement and has no effect on the instrument s calibration. However, although it is not essential to re-calibrate, it is good measurement practice to calibrate the whole measurement chain (including microphone extension cable) before starting a measurement. Decide which cable you require and assemble as follows: 1) Gently screw the microphone onto Preamplifier ZC-0032, see items 1 and 2 in Fig ) Insert the preamplifier into the female plug of the extension cable and push gently until it snaps into position. 3) Insert the male plug of the extension cable into the top socket of the hand-held analyzer (see item 17 in Fig.2.1) and push gently until it snaps into position. Connecting Two Microphones (Type 2270 only) To connect two microphones to a Type 2270, use the Dual 10-pole Adaptor JP-1041, two extension cables (AO-0697-D m long or AO-0697-D m long) and two Preamplifiers and two Microphones. 1) Gently screw the Microphones onto Preamplifiers ZC-0032, see items 1 and 2 in Instrument components (Fig.2.1). 2) Insert the preamplifiers into the female plugs of the extension cables and push gently until into position. 3) Insert the male plugs of the extension cables into the female plugs of the dual 10-pole adaptor and push gently until they snap into position. Note: Channel 1 is tagged CH 1 and Channel 2 is tagged CH 2 on the dual 10-pole adaptor. 4) Insert the male plug of the dual 10-pole adaptor into the top socket of Type 2270 (see item 17 in Fig.2.1) and push gently until it snaps into position. Mounting the Measurement Microphone on the Microphone Holder and Tripod Mount the microphone and preamplifier combination onto Microphone Holder UA-1317 and Small Tripod UA-0801, as follows: 1) Set Small Tripod UA-0801 in the required position, and adjust to the required height.
28 14 Hand-held Analyzers Types 2250 and 2270 User Manual 2) Screw Microphone Holder UA-1317 onto the threaded stud on the tripod ball-joint, and position the holder as required. 3) Push the microphone and preamplifier combination carefully into the microphone holder, so that it grips onto the body of the microphone and preamplifier. Ensure that the microphone cable sits properly in the plastic guide. Once you have carried out these instructions, you are ready to start measuring, see Chapter Measuring for Convenience Measurements that need to be done at short notice, with no particular accuracy can be carried out by simply holding the instrument or using any combination of hardware components and accessories shown in Fig.2.3.
29 15 Chapter 3 Making your First Measurement 3.1 Introduction This chapter describes how to make a basic measurement and how to save and document the results. It assumes you have just received your Hand-held Analyzer Type 2250 or Type 2270 and are turning it on for the first time. If the instrument has been used before, and the previous user has initiated the multi-user facility, then the screens that are displayed may not follow the sequence described below. If this is the case, please refer to section Note: A stylus is stored in a holder on the side of the instrument, see item 15 in Fig.2.1. This can be used on the touch-sensitive screen to select icons and functions during the procedures that follow. Alternatively, you can use the various pushbuttons, see items 3 to 11 in Fig.2.1. The following procedures assume that the measurement microphone and preamplifier have been mounted as described in Chapter 2 and the analyzer has a fully charged battery, see section Point and Shoot Using the following basic procedure you will be able to start using your hand-held analyzer immediately to make measurements and start the familiarisation process: 1) Switch on by pressing and make sure the SOUND LEVEL METER Project Template is selected. 2) Check that the data path at the top of the screen displays the correct job/project, (i.e., where you want to save the new data). See section ) Set Measurement Mode to manual and change any setup parameters by tapping the Main Menu icon and selecting Setup from the drop-down that appears. 4) Press the Start/Pause pushbutton, then monitor the status indicator (traffic light). 5) Use the Start/Pause, Continue, Back-erase and Reset pushbuttons to control the measurement. 6) When measurement has finished, press the Save pushbutton to save your data.
30 16 Hand-held Analyzers Types 2250 and 2270 User Manual 7) Add any spoken comments to the measurements by pressing the Commentary pushbutton, and add any written comments by tapping the Main Menu icon and selecting Add Note to Current Measurement from the drop-down that appears. 8) To view and organise your data, tap the Main Menu icon and select Explorer. Note: You are not required to set any measurement ranges on the analyzer, the instrument has a dynamic range of more than 120 db, from 140 db down to the noise floor of the microphone, (if the microphone has nominal sensitivity) Congratulations! You should now be familiar with the basic principles of the the analyzer. If you need more help, the following section goes into the measurement process in more detail. If not, please refer to Chapter Making a Measurement What is a Project Template? A Project Template contains all the common display settings and measurement setups required to perform a noise measurement. The template does not contain any measurement data this data is saved as individual projects, stored in job folders, see section The Project Templates covered by this manual, are: Sound Level Meter Project Template (included in BZ-7222 software) Frequency Analysis Project Template (included in BZ-7223 software) Logging Project Template (included in BZ-7224 software) Enhanced Logging Project Template (included in BZ-7225 software) Reverberation Time Project Template (included in BZ-7227 software) Note 1: Sound Recording Option BZ-7226 does not contain a specific template the sound recording options are available in all templates. Note 2: Tone Assessment Option BZ-7231 does not contain a specific template the tone assessment options are available in all templates included in BZ-7223/24/25/30. If you make any changes to the settings in a Project Template, an * will appear next to the template name to indicate that the new settings have not been saved. Tap the Template to select Template Explorer (or select it from the Main Menu ) and tap the Save icon to save the settings in the current template Switching On Switch the analyzer on by pressing. The start-up time depends on the state the instrument was in when last switched off and it may take up to 2 minutes from a cold start, or up to 10 seconds if the instrument is already in Standby Mode, (i.e., from a warm start).
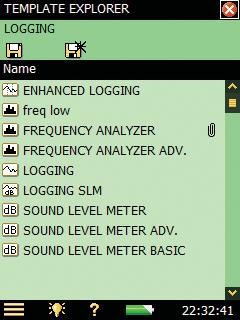
31 CHAPTER 3 Making your First Measurement 17 Note: A cold start is described as a re-boot of the instrument from ROM. This normally occurs after the instrument has been turned off for some time, either by the user or following an automatic power-down. A warm start takes the instrument quickly from Standby Mode to Operating Mode without having to re-boot. (The battery needs to be charged for this to happen, see section ) Set the Sound Level Meter Project Template After initialisation, the screen shown in Fig.3.1 appears: Fig.3.1 Initial sound level meter screen 1) Check that the SOUND LEVEL METER Project Template is displayed at the top of the screen, see Fig.3.1. If not, use the stylus to tap the bar at the top of the screen to reveal the Template Explorer and select SOUND LEVEL METER from the list, see Fig.3.2. Tap the Template icon to open directly or tap the template name to reveal a drop down where you select Open.
32 18 Hand-held Analyzers Types 2250 and 2270 User Manual Fig.3.2 Changing the project template 2) Tap Measurement Mode in the view area and set to Manual, see Fig.3.3. Note: The bar-graph showing the sound pressure level L AF is now live, but parameters such as L Aeq are not. This is because L AF is an instantaneous value, always available for display, whereas L Aeq is a measured value that needs to be averaged over a period of time. Therefore, it cannot be displayed before you have started a measurement using the Start/ Pause pushbutton. Fig.3.3 Setting the measurement mode 3) Press the Start/Pause pushbutton to start the measurement. Note: Start appears on the screen as feedback when you press the Start/Pause pushbutton. Notice the Running Icon on the screen and monitor the red, yellow, green traffic light status indicators around the Start/Pause pushbutton while you are measuring.
33 CHAPTER 3 Making your First Measurement 19 The indications should be as follows: Yellow status indicator flashing every 5 s before you start the measurement Steady green status indicator after you have pressed the Start/Pause pushbutton and during the measurement (if everything is OK) Short green flash every second means the measurement is waiting for the trigger Yellow status indicator flashing every 5 s when you have stopped, saved the measurement and are ready to do another measurement Yellow status indicator flashing slowly, 0.5 s on, 0.5 s off, if you pause the measurement Red status indicator flashing rapidly if you encounter an overload condition during the measurement 4) Use the Start/Pause, Continue, Back-erase and Reset pushbuttons to control the measurement. The status field at the top of the screen will give short textual feedback on the pushbutton operation. A visual indication of measurement status is also displayed on the status line, by way of the Stopped icon, the Running icon and the Pause icon. See Fig.3.4. Fig.3.4 Measurement feedback in the status field 5) Toggle between different display parameters, as required, by tapping on each parameter field (for example LAF90.0 in Fig.3.4) with the stylus and selecting other parameters from the drop-down lists that appear. Note: The tabs at the bottom of the screen allow you to choose different ways of displaying the measurement results: The Broadband view shows an instantaneous L AF readout, with associated bar graph and four measurement parameters, followed by two measurement setup parameters. (The first parameter is displayed in a larger font size for better readability, see Fig.3.4) The XL View increases the size of the first parameter readout to a 4 digit, full-screen display (including decimal point)

34 20 Hand-held Analyzers Types 2250 and 2270 User Manual 6) Set Measurement Mode to Automatic and choose a preset time for your measurement. Then repeat steps 3 and 4. The measurement will automatically pause after the preset time. This allows you to either save your measurement or continue measuring, as required. 7) Tap the Main Menu icon and select Setup from the list of options, see Fig.3.5. Fig.3.5 Main Menu options Change the broadband weighting parameters by tapping on the plus icon next to Frequency Weightings, then on the weighting parameter field on the right-hand side of the screen. A weighting drop-down menu will appear, see Fig.3.6. Change the parameters as required. Fig.3.6 Changing the broadband frequency weightings 8) Return to the bar-graph screen of the SOUND LEVEL METER template, by tapping and you are ready to make a new measurement.
35 CHAPTER 3 Making your First Measurement Save your Measurement When you have completed your measurement, you need to save it. By default the analyzer creates a job folder called JOB 01. Job folders represent the upper level of the data (or file) management system, with individual measurements or sets of data, represented by projects appearing under the relevant job. By default the analyzer also creates a project called Project 001 under JOB 01. (Subsequent measurements will be labelled Project 002, Project 003, etc., under JOB 01. This will happen each time you have saved a measurement a.) Check that the data path at the top of the screen displays \JOB 01\Project 001* and save your measurement by pressing the Save pushbutton. For more details refer to section 6.1. Note: An asterisk will appear alongside the project at the top of the status field as soon as you start your measurement, see Fig.3.7. This signifies that the measurement has not been saved. It will disappear once you have saved the measurement. Fig.3.7 Saving your measurement Viewing the Saved Measurement 1) To view the saved measurement, tap project name or the Main Menu icon and select Explorer from the list of options. Tap the name of your measurement (Project 001 in this case) and select View from the drop-down that appears, see Fig.3.8. (Or just tap the measurement icon to the left of the name.) a. If you are using Reverberation Time Software BZ-7227 (see Chapter 14), please note that there are more measurements stored in Reverberation Time projects than Sound Level Meter, Frequency Analyzer or Logging Projects, which all contain one measurement within each project.

36 22 Hand-held Analyzers Types 2250 and 2270 User Manual Fig.3.8 Viewing your measurement in Explorer 2) This opens the Data Viewer, see example in Fig.3.9. The viewer displays the data in a pre-defined format, where you can select and view different parameters, as necessary. Fig.3.9 The Data Viewer 3) When finished, tap to return to Explorer and to return to the measurement screen. 3.5 Document your Measurement One method for documenting your measurement is adding metadata to your project. Tap (upper right corner of the screen, see Fig.3.7) to open the Annotations screen with metadata on the Metadata tab and annotations on the Annotations tab. see Fig.3.10.

37 CHAPTER 3 Making your First Measurement 23 Fig.3.10 The Metadata tab of the Annotations screen Fig.3.10 Metadata are text or numbers, which are easily set and changed using the keyboard or selected from a user-defined picklist. The metadata are stored together with the measurement on the project. Refer to section 8.6 for a more comprehensive description of using metadata. Tap the icon to close the Annotations screen. Another method for documenting your measurement is by attaching a short spoken comment to the project you are working on. This is done before, during a or after saving the measurement by pressing and holding down the Commentary pushbutton, while talking to the instrument. (The microphone situated on the underside of the analyzer will pick up your comments.) Recording stops when you release the pushbutton. Note: Tap the paperclip icon to see a list of all annotations in the project and tap the loudspeaker icon in the annotation to hear the comment using the earphones plugged into the earphone socket. A third method is to make a short written comment and attach it to the project you are working on. This is done before, during or after saving the measurement by tapping the Main Menu icon and then tapping on Add Note to Current Measurement in the list of options. A blank note screen will appear, where you can make written comments about the measurement, using the standard full character keyboard that appears at the bottom of the note screen. See the example in Fig Tap the paperclip icon to see a list of all annotations in the project and tap the text icon in the annotation to view the comment. a. For Logging Software BZ-7224 and Enhanced Logging Software BZ-7225, annotations can be added directly to the measurement profile during the measurement, see section 11.2.

38 24 Hand-held Analyzers Types 2250 and 2270 User Manual Fig.3.11 Example of a written annotation that is attached to a measurement A fourth method is to attach an image (Type 2270 only). Similar to adding notes or comments, adding an image can also be done before, during or after saving the measurement by a tap Main Menu icon and then a tap Add Image to Current Measurement in the list of options. The Viewfinder display will then appear showing what is coming through the camera lens. The camera has fixed focus and automatically adjusts the light sensitivity; you just have to position the analyzer so that the object you want to capture is visible in the Viewfinder and then press the Manual Event pushbutton or tap the icon to capture the image see Fig Fig.3.12 Viewfinder When captured, the image is presented as a still picture and you can save the captured image by pressing the Save pushbutton (or by closing the Images view), or you can reject the image by pressing the Back-erase pushbutton.

39 CHAPTER 3 Making your First Measurement 25 Fig.3.13 Viewfinder Note: When finished, tap the icon to return to the measurement screen. Tap the paperclip icon to see a list of all annotations in the project and tap the camera icon in the annotation to view the image. To get more familiar with this process, try the following: 1) Make a new measurement (see section 3.2, if unsure). 2) Tap the paperclip icon and define or select metadata. 3) Make a short written comment and attach it to the new measurement (as previously described). 4) Make a short spoken comment (as previously described). 5) Make an image (as previously described for Type 2270 only). 6) Tap the paperclip icon and check that you have three annotations select one of them to see/hear the annotation. 3.6 Switching Off Switch the analyzer off by pressing. If held in for 1 second, the instrument goes into standby mode; if held in for more than 4 seconds, it switches the instrument off. The instrument will automatically switch off, when it has been in standby mode without external power for more than 30 hours.
40 26 Hand-held Analyzers Types 2250 and 2270 User Manual
41 27 Chapter 4 Calibration 4.1 Introduction Calibration is an adjustment of your analyzer to measure and display correct values. The sensitivity of the transducer as well as the response of the electronic circuitry can vary slightly over time, or could be affected by environmental conditions such as temperature and humidity. While you are unlikely to ever experience a large drift or change in sensitivity with the analyzer, it is nevertheless good practice to perform regular calibrations, normally before and after each set of measurements. Often calibration is required by measurement standards, such as IEC If you want your analyzer to remind you when the next Accredited/Traceable calibration is due, you can set it up on the Reminder tab of the Calibration screen. See section 4.9. You can check the complete measurement chain during long-term measurement using Charge Injection Calibration. See section Acoustic Calibration Acoustic calibration is the preferred calibration method when measuring with microphones, particularly when standards and regulations require calibration before a measurement. The method involves applying an acoustic signal of known magnitude and frequency to the microphone, which calibrates all the instrument s components (microphone, preamplifier and electrical circuitry). 4.3 Sound Level Calibration To perform acoustic calibration use Sound Calibrator Type It provides a stable sound pressure at 1 khz and has minimal susceptibility to environmental factors. The procedure itself is relatively simple, and on the analyzer the procedure is referred to as the Standard Calibration procedure. The procedure for performing an acoustic calibration and instructions on how to fit the calibrator are given in the following section.
42 28 Hand-held Analyzers Types 2250 and 2270 User Manual Standard Calibration 1) Stand away from loud sound sources that may interfere with the calibrator s signal. 2) Switch on the analyzer by pressing. 3) Tap the Main Menu icon and select Calibration from the list of options. The screen shown in Fig.4.1 will appear. Fig.4.1 Initial Calibration screen This screen contains a bar graph showing the actual sound pressure level and three placeholders for displaying information about the last calibration. 4) Following the first part of the instruction in the status field, fit Sound Calibrator Type 4231 carefully onto the microphone of the hand-held analyzer. (To avoid handling vibrations to disturbing the calibration rest the assembly in a roughly horizontal position on a table or other flat surface.) Ensure that the calibrator fits snugly on the microphone. 5) Switch on the Calibrator. Wait a few seconds the level to stabilise. 6) Tap the button on the screen to start the calibration. Note: Detecting level... appears on the screen as feedback. 7) While the analyzer is searching for the calibration signal and the signal level is stabilising, the traffic light indicates a short green flash every second. When the level is stable, the traffic light indicates a steady green and the signal is measured and used for calibration. Once the calibration has been completed successfully, the traffic light indicates a short yellow flash every 5 seconds. The Sensitivity is automatically calculated and displayed in a pop-up together with the deviation from the last calibration. Press Yes to accept and use the new sensitivity and save it in the calibration history. Press No to disregard the new calibration and continue with the old calibration. If the calibration deviates more than 1.5 db from the initial calibration (microphones only), then the calibration is stopped without changing the calibration of the instrument.
43 CHAPTER 4 Calibration 29 The traffic light will indicate a fast flashing red and an error description will appear in the status field. Hint: If the microphone is separated from the analyzer using a microphone extension cable then place the analyzer so it can be seen from the location of the microphone. Start the calibration process (select the Calibration screen and tap the button on the screen), then go to the microphone and fit the Calibrator onto the microphone, switch on the Calibrator and monitor the traffic light on the the analyzer, as discussed previously. 8) Once you have completed the calibration, tap the button and remove the calibrator. It will automatically switch off after a few seconds Calibration Settings Select the Details tab on the Calibration screen to view the calibration details, see Fig.4.2. Fig.4.2 Calibration details screen This screen displays the following information: Details of the last calibration: date, sensitivity, deviation from last calibration and deviation from initial calibration The connected transducer: type and serial number Note: you select a new transducer by tapping on the Main Menu icon and selecting Setup, followed by Input) Max. Input Level: the maximum sinusoidal input level to be measured without overload indication A Calibration History link: which is provided to enable you to view a history of transducer and calibration settings, see below The calibration settings can be adjusted as follows: Calibrator: select between Type 4231 and a custom calibrator
44 30 Hand-held Analyzers Types 2250 and 2270 User Manual Calibration Level: type in the specific level of your custom calibrator. If you are using Type 4231 calibrator, and the microphone being used is connected to the top socket, then the level of the calibrator is automatically detected (shown as Auto detect on the screen) Note: The Auto detect setting enables the calibration process to automatically detect the calibration level. For free-field types of microphones (like Types 4189 and 4190) the calibration level from a Type 4231 Calibrator is either db or db. For diffuse or pressure field types, the calibration level is either 94 db or 114 db. The calibration process automatically determines the correct level Calibrator Serial Number: type in the serial number for your calibrator. The calibrator will be documented in the calibration history 4.4 Vibration Calibration To calibrate an accelerometer use Calibration Exciter Type It provides a stable acceleration of 10 m/s 2 at 159 Hz. The procedure is very similar to the Standard Calibration procedure for Sound Calibration described above; however, follow the procedure for mounting the accelerometer to the exciter as described in the user manual for Type Electrical Calibration To calibrate the Direct input use a stable sinusoidal voltage at a frequency between 150 Hz and 10 khz. The procedure is very similar to the Standard Calibration procedure for Sound Calibration described above; however, without the transducer mounting procedure. 4.6 Manual Calibration If no calibrator is available (or a known amplification is introduced, i.e., by analyzing a tape recorded signal) then you can type the sensitivity directly into the Sensitivity field. The analyzer will be regarded as un-calibrated and the text Uncal. will appear in the status field. 4.7 Calibration History You select the calibration history by tapping on the Calibration History link on the Calibration Details screen, see Fig.4.2. The analyzer saves the last 20 calibrations, plus the initial calibration, which can be viewed on the Calibration History screen, see Fig.4.3. When you have finished, tap to return to the calibration details screen and then tap again to return to the measurement screen.
45 CHAPTER 4 Calibration 31 Fig.4.3 Calibration History screen 4.8 Transducer Database The specifications for Microphone Types 4189 and 4190 (and Preamplifier ZC-0032), which come fitted in the top socket of the analyzer, are described in a transducer database. 1) Select the Transducer Database by tapping the Main Menu icon and choosing Transducers from the list of options. The screen shown in Fig.4.4 will appear. Fig.4.4 Transducer Database screen 2) Tap the transducer name/number, or select the plus icon next to name/number, to view the details in the database, see Fig.4.5.

46 32 Hand-held Analyzers Types 2250 and 2270 User Manual Fig.4.5 Details in the Transducer Database All the details for the currently selected microphone can be found in the database. You can add other transducers by tapping on the Add New Transducer icon, selecting Microphone, Accelerometer or Direct input from the drop-down, and filling in the details of your particular transducer parameters. See section C.2.1. This is done by selecting the item from the drop-down list that appears on some parameter fields, or by entering the data via the keyboard that appears on other parameter fields. A number of parameters are set automatically for a known microphone type, such as Type Note 1: If the transducer is a microphone and the microphone type is known to the the analyzer (as in the example in Fig.4.5, where Type 4189 details are known), then the parameters Nominal Sensitivity, Polarization Voltage, Free-field, Capacitance and CCLD are set automatically. See details in Appendix C. The analyzer can then make sound field correction and windscreen correction as specified in the setup. To confirm which type of correction is being applied, an icon is displayed in the measurement Status field, as described on section If the microphone is unknown to the analyzer, no corrections can be made and no icon appears in the Status field. The parameters mentioned above have to be set manually (i.e., typed in). We recommend that you insert the value for Nominal Sensitivity directly from the calibration chart. Nominal Sensitivity is used in the automatic level detection calculations, when calibrating using the Type 4231 Calibrator, to determine whether the level is 94 or 114 db. Note 2: If the transducer is an accelerometer and the accelerometer type is known to the analyzer, then the parameters Nominal Sensitivity, CCLD and Weight are set automatically. In the top line of the status field you can select which transducer is currently connected to the analyzer. This can also be done via the Setup screen by selecting Input, then selecting the transducer in the Transducer Used: field. In the first line of the status field you can select whether the transducer is connected to the top socket or the rear socket of the analyzer. This can also be done via the Setup screen by selecting Input, then selecting the socket in the Input: field.

47 CHAPTER 4 Calibration 33 For Type 2270 only: In the second line you also have a Channel Selector. To change which input the transducer uses to connect to the analyzer, tap the Main Menu icon and select Setup from the list, next tap the Input value field and finally, choose the required input from the drop-down list: Top socket or Rear Socket (Rear Socket refers to the Input socket on the connector panel of the analyzer). At the bottom of the parameter list you can select the calibration history for the currently selected transducer by tapping on the Calibration History link. See section 4.7 and Fig.4.2. You can delete a transducer by tapping on the Delete Transducer icon transducer to delete from the drop-down that appears. and selecting the Note: Only transducers that are not connected can be deleted. The calibration history will also be deleted. When you have finished, tap to return to the measurement screen. 4.9 Calibration Reminder The Calibration Reminder tab, see Fig.4.6, allows you to keep track of when you need to run your next Accredited/Traceable calibration, and shows you the date of your last calibration. Fig.4.6 Calibration Reminder tab The automatic calibration reminder facility will pop-up a reminder approximately 2 months before your next calibration and keep on reminding you every week until you do one of the following actions: Send your instrument for Accredited/Traceable Calibration and update the Last Calibration date Check the Do not ask/remind again checkbox in the reminder pop-up Disable the automatic calibration reminder

48 34 Hand-held Analyzers Types 2250 and 2270 User Manual An example of a reminder pop-up is shown in Fig.4.7: Fig.4.7 Reminder pop-up You can set the Calibration Interval parameter to either 12 months or 24 months depending on your local requirements. You can disable the facility by selecting the Automatic Calibration Reminder parameter to Off Charge Injection Calibration Theory of CIC If an external sound source is not available, for example during short or long term monitoring, you can check the calibration of the analyzer using the Charge Injection Calibration (CIC) facility. This is done automatically during a logging measurement (see section 11.2 and section 12.2). Unlike an internal calibration, the Brüel & Kjær patented CIC technique enables a complete measurement chain to be verified, including the microphone, preamplifier, cabling and analyzer. Each verification measurement is compared to an initial reference measurement. As the name implies, the CIC method injects an internally generated charge into the microphone and preamplifier input circuit, and the ratio between the measured signal and the injected signal is measured (CIC Ratio), see Fig.4.8. This method is based on the detection of changes in impedance at the input terminal. It was developed for monitoring of microphone channels and requires a preamplifier with a small, extremely stable built-in capacitor, which enables the application of an electrical signal to a preamplifier (and microphone) input terminal. A stable CIC Ratio means a healthy system and assures stable operation of the microphone, cable, preamplifier and remaining measurement system.
49 CHAPTER 4 Calibration 35 Fig.4.8 Charge Injection Calibration. Low-leakage resistance capacitor C c is set in parallel with the microphone and fed with voltage e i. The ratio e o /e i is constant when g, C c, C m and C i are constant. Changes to preamplifier gain (g), cable parameters, microphone capacitance (C m ), etc., will change e o /e i and, hence, indicate probable changes in calibration Microphone Preamplifier Cable Generator e o e i = g C ( c Cm ) + C i + C c C m C c g e o C i R 1 e i e Performing a Manual CIC Calibration with your Type 2250/2270 CIC is only available for microphones connected to the Top Socket of the Analyzer and with Logging Software BZ-7224 and Enhanced Logging Software BZ Tap the Main Menu icon and select Calibration from the list. Click the CIC tab to view the various CIC parameters that are available. The available parameters will include the results of the latest manual CIC, together with the reference, see Fig.4.9. The status field at the top of the screen informs you how to perform the CIC. Press the Start CIC button to start the CIC. After approx. 10 secs you will see the result. Normally, the CIC Reference Ratio is set the very first time a CIC is performed, however, you should update the CIC Reference Ratio if you change the microphone preamplifier. You do this by checking the Use as new Reference checkbox. The CIC Reference Ratio and CIC Ref. Date parameters display the results of the very first manual CIC, and this will be used as the reference for all subsequent CIC Ratio measurements. Note: Each microphone in the transducer database has a CIC Reference Ratio. If the CIC Ratio parameter deviates by more than 0.5 db from the CIC Reference Ratio, there may be a problem, and it should be investigated, see page 36.

50 36 Hand-held Analyzers Types 2250 and 2270 User Manual Fig.4.9 CIC tab The result of the Charge Injection Calibration consists of four parameters: CIC Ratio CIC Ratio Date Deviation from Reference CIC Result The CIC result can be either Passed, Background noise too high or CIC Ratio deviates from Ref.
51 37 Chapter 5 Getting to Know Your Analyzer 5.1 What is a Sound Level Meter? A Sound Level Meter (SLM) is an instrument that is designed to measure sound levels in a standardised way. A sound level meter comprises a microphone, a preamplifier, a main processor and a read-out unit. The microphone converts the sound signal into an equivalent electric signal. The electric signal that the microphone creates is at a very low level, so it is made stronger with the help of a preamplifier before it is processed by the main processor. Processing includes applying frequency and time weightings to the signal as specified by international standards, such as IEC , to which Type 2250 and Type 2270 conform. Frequency weighting adjusts how the sound level meter responds to different sound frequencies. This is necessary because the human ear s sensitivity to sound varies according to the sound s frequency. The most commonly used frequency weighting is A-weighting, which adjusts a signal in a way that best resembles the human ear s response at medium-range levels. It is the weighting required for nearly all environmental and workplace noise measurements, and is specified in international and national standards and guidelines. All of the analyzer s measurement parameters apply A- or B-weighting and a choice of C- or Z-weighting, except for the measurement of peak levels where a single weighting (typically the C frequency weighting) is applied. In this case, C-weighting is used to take into account the energy present at low frequencies even when they are not particularly annoying. Time weighting specifies how the sound level meter reacts to changes in sound pressure. It is an exponential averaging of the fluctuating signal, providing an easy-to-read value. The analyzer applies the Fast, Slow and Impulse (or F, S and I ) time weightings, which are the required weightings according to the vast majority of international and national standards and guidelines. Once the signal is processed through the weighting filters, the resulting sound pressure level is displayed in decibels (db) referenced to 20 µpa on the instrument s screen. In the analyzer, the sound pressure level values are updated at least once per second. Assessing a fluctuating noise level means getting a value for a level that is, in simple terms, the average level. The equivalent continuous sound level, L eq, is known around the world as the essential averaged parameter. L eq is the level that, had it been a steady level during the
52 38 Hand-held Analyzers Types 2250 and 2270 User Manual measurement period, would represent the amount of energy present in the measured, fluctuating sound pressure level. It is a measure of the averaged energy in a varying sound level. It is not a direct measure of annoyance, though extensive research has shown that L eq correlates well with annoyance. L eq is measured directly with a hand-held analyzer, such as the analyzer running Sound Level Meter Software BZ If an A-weighting filter is used, it is expressed as L Aeq, defined as the measurement of the equivalent continuous sound level using the A-weighted filter network. A full range of measurement parameters is given in Appendix B. 5.2 What is the Hand-held Analyzer? The hand-held analyzer is a versatile hardware platform suitable for covering a wide range of different applications. Together with Sound Level Meter Software BZ-7222, it is a Class 1 modular precision integrating-averaging sound level analyzer with an easy to use interface for quick and simple measurement setups Sound Level Meter Software Module BZ-7222 Sound Level Meter Software BZ-7222 allows you to measure a comprehensive set of parameters used for rating noise in terms of its impact on the environmental and working environments and on occupational noise evaluation. The more commonly used parameters, which cover a large range of applications, are either instantaneous measured parameters (available at any time) or timed measured parameters (measured within a controlled time interval): Timed Measured Parameters Equivalent Continuous Sound Levels (L eq example: L Aeq ) Peak Sound Levels (L peak example: L Cpeak ) Time for Peak Sound Level (example: T Cpeak ) Maximum Time-weighted Sound Levels (L max example: L AFmax ) Minimum Time-weighted Sound Levels (L min example: L AFmin ) Percentile Levels (L N example: L AF90.0 ) Sound Exposure Level (example: L AE ) Sound Exposure (example: E) Daily Noise Exposure Levels (example: L ep,d or L EX,8h ) Noise Dose (example: based on ISO standards: Dose, based on US standards: DoseS5) Number of Peaks (example: #CPeaks(>140 db)) Time Weighted Average (example: TWA) Level Average with Exchange Rates 4, 5 or 6 (example: L avs5 )
53 CHAPTER 5 Getting to Know Your Analyzer 39 Instantaneous Measured Parameters Instantaneous Time-weighted Sound Levels (L p example: L AF ) Sound Pressure Levels (max levels once per second example: L AF (SPL) Instantaneous Peak Sound Levels (example: L Cpeak,1s ) Note: See Appendix B for a comprehensive list of all parameters. Sound Level Meter software BZ-7222 incorporates a simple user interface which is easy to learn and uses intuitive data storage and recall. Comprehensive security features means no loss of data, even on accidental power-off. Smart features are built-in for field use, for example, allowing you to personalise your measurements. Sound Level Meter software BZ-7222 also provides connectivity between your PC and other sound analysis software. This highly versatile hand-held analyzer platform includes a range of optional software modules, that are enabled through easily activated software license keys. The combination of software modules and innovative hardware makes the instrument a dedicated solution for performing all your high-precision measurement tasks. The following optional software module is covered in this manual: Frequency Analysis Software Module BZ-7223 This software module allows real-time frequency measurements in 1/1- and 1/3-octave bands, making it a simple matter to, for example, select suitable hearing protection, qualify noise from heat and ventilation systems and assess tonality Logging Software Module BZ-7224 This software module allows logging of broadband and spectral data a to obtain a time history for later analysis, for example, for use in environmental noise as well as workplace noise assessment. It allows free selection of up to 10 parameters to log at periods from 1 s to 24 h. Results are logged directly to CF or SD memory cards Enhanced Logging Software Module BZ-7225 This software module is optimised for long-term monitoring. It has the functionality of the Logging and Frequency Analysis software, and in addition it can measure continuously, save data in manageable portions (every 24 hours), make periodic reports (i.e., every hour) and measure L dn and L den, etc Sound Recording Option BZ-7226 This option allows recording of sound during measurement. The sound recording can be controlled manually or by using an external trigger signal. The recording can also be triggered when a measured parameter exceeds a preset level (BZ-7224 and BZ-7225 only). The recorded sound can be played back and listened to using the supplied earphones, HT Sound is recorded directly to CF or SD memory cards. a. Requires Frequency Analysis Software BZ-7223
54 40 Hand-held Analyzers Types 2250 and 2270 User Manual Reverberation Time Software BZ-7227 This software module allows measurement of reverberation time using Impulsive excitation and backwards integration of the impulse, or using Interrupted Noise from the built-in noise generator. Measurements can be made in a number of positions in the room and the average reverberation time for the room is calculated Tone Assessment Option BZ-7231 This option allows the assessment of tones on-site, according to selected methods. The option described in this manual is based on the 1/3-octave method. (Please refer to User Manual BE 1778 for detailed information about tone assessment based on FFT spectra.) When used with BZ-7223 Frequency Analysis, BZ-7224 Logging and BZ-7225 Enhanced logging, it allows you to assess tones in a measured 1/3-octave spectrum according to ISO 1996:2007, Annex D, or, assess tones in a measured 1/3-octave spectrum according to Italian Law, Ministero dell'ambiente, Decreto 16 marzo Built-in Help If you need more detailed information at any time during operation, tap the Help icon on the instrument s screen. The resulting screen will explain that particular item in much more detail. You can scroll up and down the explanatory text using either the and pushbuttons, or the scrollbar on the screen. Return to the normal display screen by tapping. If you need to view any of the previous 10 screens you have visited in the help system, tap the icon at the top of the display. Software and Hardware Versions Once in the help system, you can access the list of installed software versions and licenses, together with information about the hardware. This information is always available and is accessed by selecting About from the top of the display. 5.3 What is Utility Software for Hand-held Analyzers BZ-5503? Utility Software for Hand-held Analyzers BZ-5503 functions as the link between the analyzer and reporting software on a PC, such as Noise Explorer Type 7815, Evaluator Type 7820/21, Protector Type 7825 or Qualifier Light Type The software enables you to do the following: Setup or control the analyzer from a PC Retrieve data from the analyzer Manage and archive data from the analyzer View data in archives Export data to Type 7815, Type 7820, Type 7825, Type 7831 or Microsoft Excel
55 CHAPTER 5 Getting to Know Your Analyzer 41 Update the software in the analyzer Install license for use of software modules in the analyzer Utility Software for Hand-held analyzer BZ-5503 is supplied on the Environmental Software DVD (BZ-5298), which is included with your analyzer. 5.4 Basic Principles when using the Analyzer Navigation Principles Star Navigation Concept The main principle is that all the main menus are accessible via a single tap of the stylus. The Main Menu icon forms the centre of the star navigation concept, see Fig.5.1.


56 42 Hand-held Analyzers Types 2250 and 2270 User Manual Fig.5.1 The Star navigation concept Shortcuts
57 CHAPTER 5 Getting to Know Your Analyzer 43 This configuration gives you immediate access to screens you need most, i.e., those you will need to perform, save and document your measurements. The Main Menu allows you to navigate to the following screens: Explorer Setup Preferences Transducers Calibration Add Note to Current Measurement Add Image to Current Measurement (Type 2270 only) Template Explorer Timer Setup In addition, the Main Menu Lock Keys and Screen Log Off also allows you to perform the following actions: Explorer The Explorer screen is accessed from the Main Menu or by tapping on the Project name, and gives you access to the instrument s Data/Project manager. This allows you to view the overall project structure, including job folders and projects, and to view all the individual measurements. When you have finished, tap to return to the measurement screen. You can tap any measurement file to view the saved measurement and if there are any voice text or image annotations attached, these can be viewed by tapping the paperclip icon visible next to all measurement files with attachments. When you have finished reading, listening or viewing the attachments, tap to return to the Explorer screen. Setup The Setup screen is accessed from the Main Menu and gives you access to the various setup parameters, such as frequency weightings, control of the measurement, bandwidth, statistics and the type of input currently connected. You can change these as required, see section The Full tab at the bottom of the screen allows you to view the complete list of setup parameters, while the Quick tab allows you to access the more frequently used parameters defined by yourself. When you have finished viewing or updating the parameters, tap to return to the measurement screen. Changes made to the setup will only be applied temporarily, i.e., until you select another project template or open another project to re-use the setup from that project. However, if you want the setup changes to be saved in the current template, select the Template Explorer option from the Main Menu and tap the Save icon. Note: If you make changes to the setup that you do not want to keep (and you have not yet saved the template), you can undo them by selecting the template again from the Project Template bar at the top of the screen.
58 44 Hand-held Analyzers Types 2250 and 2270 User Manual Preferences The Preferences screen is accessed from the Main Menu and gives you access to the instrument s preferences (if Multi User is disabled) or your own preferences (if Multi User is enabled). These include things such as regional settings, appearance of the screen, power management, user profiles and language. You can change these as required, see section For more information refer to section 8.1. When you have finished viewing or updating the parameters, press to return to the measurement screen. Transducers The Transducers screen is accessed from the Main Menu, you can view/set which transducer is connected to the instrument and add new ones if required. Details can be changed for existing transducers or entered for new ones, see section When you have finished viewing or updating the details, tap to return to the measurement screen. When a transducer is selected, you can tap the Calibration History link at the bottom of the transducer details and open the Calibration History screen, see Fig.5.1. This screen includes the calibration history for the transducer (i.e., microphone) that is currently selected. When you have finished viewing or updating the details, tap to return to the Transducers screen. Calibration The Calibration screen is accessed from the Main Menu, and gives you access to the instrument s calibration procedure. To calibrate the instrument, follow the instructions in the status field. For more information refer to section 4.2. When you have finished calibrating or viewing the details, tap to return to the measurement screen. The Calibration tab at the bottom of the calibration screen allows you to perform and monitor the calibration, while the Details tab allows you to view the details of the calibration and the calibrator that are being used to calibrate the instrument. While you are viewing the Details tab, you can tap the Calibration History link at the bottom of the calibration details and open the Calibration History screen, see Fig.5.1. This screen includes the calibration history for the currently selected transducer, tap to return to the Calibration screen. Add Note to Current Measurement The Notes screen is accessed from the Main Menu by selecting Add Note to Current Measurement. This screen allows you to create a text annotation that you can attach to your measurement. Text is inserted using a character keyboard, similar to the one covered in section When you have finished, tap to return to the measurement screen. Add Image to Current Measurement (Type 2270 only) The View Finder screen is accessed from the Main Menu by selecting Add Image to Current Measurement. This screen allows you to capture an image that you can attach to your measurement see Chapter 3. When you have finished, tap to return to the measurement screen.

59 CHAPTER 5 Getting to Know Your Analyzer 45 Template Explorer The Template Explorer is accessed from the Main Menu and gives you access to managing your project templates. When you have finished, tap to return to the measurement screen. Timer Setup The Timer Setup is accessed from the Main Menu and enables you to control the analyzer via one or more of the analyzer s timers. The purpose of a timer is to initiate measurements in the absence of an operator. When you have finished, tap to return to the measurement screen The Display Screen During normal operation, you will use the display screen to view your measurements and carry out a variety of functions, which are described in the following sections. CAUTION: The touch-sensitive screen is susceptible to damage from sharp objects, such as pencils, fingernails, etc. We therefore recommend you use the stylus provided to activate items on screen. See also section A typical screen is shown in Fig.5.2. Fig.5.2 Typical screen when making a measurement Project Template Status field View area View tabs Shortcut bar with icons The main areas, starting at the top of the screen, are: Project Template Status Field View Area (with View tabs) Shortcut Bar
60 46 Hand-held Analyzers Types 2250 and 2270 User Manual Project Template Bar This bar displays the name of the Project Template, which contains all the screen settings and measurement setup for the current project. Tap the text to open the Template Explorer screen containing all the available templates. If you make any changes to the setup in a template an * will appear next to the template name to indicate that the new settings have not been saved. Tap the Save icon in the Template Explorer to save the settings in the current template. Status Field The area just below the Project Template bar is called the Status field. Depending on the template, this field displays status information using up to three lines of text, as follows: First Line: Path and name of the current project. (section 6.1.1) Tap it to open the Explorer. To change the path, navigate to the desired job (path) and tap the icon to save this path as the default measurement path. As in the project template, an * will appear next to the project name to indicate that the project has not been saved. Press the Save pushbutton if you want to save the measurement or changed settings. Smiley (if applicable) The PC icon indicates connection to a PC The commentary icon indicates when a spoken commentary is being recorded, together with an indication of the available recording time The recording icon indicates when the measurement signal is being recorded A paperclip icon indicates that a spoken or written comment is attached to the project. Tap the icon to view, or listen to, the comment Second Line: Measurement state represented as icons: Stopped, Running and the Pause icon Elapsed time of the measurement Feedback on the action of pressing the following pushbuttons: Reset, Back-erase, Start/Pause and Save Indication that the measurement microphone is uncalibrated. In this case the word Uncal. appears in the Status Field When a microphone has been selected as input, then four icons are used to represent whether, or not, the windscreen is fitted and whether you are measuring in a free-field or diffuse field. For example, no windscreen fitted, measuring in a free-field ; no windscreen fitted, measuring in a diffuse field ; windscreen fitted, measuring in a free-field ; windscreen fitted, measuring in a diffuse field. An accelerometer icon is displayed if an Accelerometer is selected as input, and an input socket icon is displayed if Direct input is selected. For Type 2270, two icons are displayed - one for Ch. 1 and one for Ch. 2. If only one channel is used, then no icon is displayed for the unused channel Immediate textual feedback on overload situation and latched overload indicated with an overload icon Third Line:
61 CHAPTER 5 Getting to Know Your Analyzer 47 Used for Logging and Enhanced Logging, see section , or used for Reverberation Time, see section Central View Area The Central View Area contains the screens required for a particular measurement, such as bar graphs, result readouts and various frequently used setup parameters (e.g., Meas. mode). The template defines the content of this area. More than one screen can be used for displaying the information. Select the screen using the View Tabs at the bottom of the View area. Changes made to the screens will only be applied temporarily, i.e., until you select another project template or open another project to re-use the screen from that project. However, if you want the screen changes to be saved in the current template, tap the Project Template bar at the top of the screen to open the Template Explorer and tap the Save icon. Note: If you make changes to the screen that you do not want to keep (and you have not yet saved the template), you can undo them by selecting the template again from the Project Template bar at the top of the screen. Shortcut Bar The Shortcut Bar, at the bottom of the screen, displays a number of fixed icons that are always accessible. These include: Main Menu icon, giving access to the Main Menu. This allows you to navigate to a specific function, see description earlier under Navigation Principles Backlight icon, allows you to select a backlight level Help icon, a quick way to get context-sensitive help from any screen by tapping on the icon at the bottom. Closing the help window will return you to the previous screen Battery/power status icon, shows the condition of the battery. All green shows a fully charged battery, while red means power levels are low. Tap the icon to get more details of the battery condition. (When the Power Supply lead is connected, the icon will be displayed in place of the battery icon.) The clock in the lower right corner displays the current time. Tap the readout to get details of the time and date, or to set the clock Use of Pushbuttons for Controlling Measurements The design of the analyzer is such that the layout of the pushbuttons has been optimised for single-handed operation. Reset Pushbutton Use the Reset pushbutton to reset a measurement, i.e., to reset all detectors, averagers, maximum and minimum hold, etc. If the measurement is paused (i.e., Pause icon is displayed in the status field), then the measurement reverts to a stopped state after a reset, (i.e., stopped icon displayed with a zeroed readout). If the measurement is running, then the measurement will be automatically re-started after the reset.
62 48 Hand-held Analyzers Types 2250 and 2270 User Manual Start/Pause Pushbutton Use the Start/Pause pushbutton for controlling the measurement. The function of this key depends on the current measurement state, see Table 5.1. Table 5.1 Start/Pause pushbutton functions Current Measurement State Function of Start/Pause Pushbutton Next Measurement State Stopped Start the measurement Running Running Pause the measurement Pause Pause Continue the measurement Running Save Pushbutton Use the Save pushbutton to save the measurement data together with the current project template (including all the screen settings and setup information) and the calibration documentation. Pressing Save will affect the pause and running states. In both cases the measurement state will be stopped shortly after pressing the pushbutton (stopped icon displayed). Back-erase Pushbutton For BZ-7222 and BZ-7223 Software: Use the Back-erase pushbutton to erase the last 5 seconds completely from the measurement. (This includes, of course, overload indications you would like to erase.) If used when the current measurement is running, then the measurement will be paused. The status field displays Pause, Back erase briefly, and then displays the shortened elapsed time along with the Pause icon. For BZ-7224 and BZ-7225 Software: Pressing the Back-erase pushbutton will start drawing an Exclude Marker on the display, see section Pressing it again will stop drawing the marker on the display (toggle function) On-screen Feedback and Traffic Light Feedback is given on screen in the Status Field, see Fig.5.2, and the Traffic Light indicates important states of the instrument, see Table Use of Stylus and Navigation Pushbuttons The stylus and navigation pushbuttons are used for setting up the analyzer, navigating through the screens and managing the results. A number of items that appear on the screen (parameter values or icons) can be selected, updated and activated. For instance, a new parameter value can be selected from a drop-down list.
63 CHAPTER 5 Getting to Know Your Analyzer 49 Table 5.2 Traffic Light Indications State During power-on or loading template Stopped. Ready to measure Awaiting trigger, searching for calibration signal Running measurement, everything OK Pause. Measurement not saved Overload Nothing Light Scheme Short yellow flash every 5 s Short green flash every second Steady green light Slow yellow flash on 1/2 s, off 1/2 s Fast red flash The selection and activation of items on the screen can be done in two ways: Tapping once on the item on the screen will select and activate it, or Moving the field selector around using the navigation keys until the item you want is highlighted, then pressing the Accept pushbutton to activate it You can choose to use the stylus or the pushbuttons, depending on your preference and the measurement situation. For instance, if the amount of noise generated by the instrument needs to be kept to an absolute minimum, consider using the pushbuttons rather than the stylus this is because tapping of the stylus on the touch-sensitive screen may create extra noise. However, if speed is of major importance, the stylus can navigate through the setup and measurement screens quicker. Throughout the manual we have described how to perform the measurement procedures using the stylus only, but you may also use the alternative method (using the Navigation and Accept pushbuttons) if you prefer How to Change Parameter Values Most parameter values are changed by selecting a new value from a drop-down list, which appears when the parameter field is selected. See the example in Fig.5.3.
 to select the value you want and press the Accept pushbutton to activate it. Use the left arrow to cancel the selection.")
64 50 Hand-held Analyzers Types 2250 and 2270 User Manual Fig.5.3 Changing parameter values Stylus Usage Tap the value you want in the drop-down, or tap outside the list to cancel the selection. Pushbutton Usage Use the navigation pushbuttons (up arrow, or down arrow ) to select the value you want and press the Accept pushbutton to activate it. Use the left arrow to cancel the selection. Number Keyboard When activating a number, a number keyboard appears, see Fig.5.4. Fig.5.4 Number keyboard as it appears on the screen

65 CHAPTER 5 Getting to Know Your Analyzer 51 Tap the digits or use up arrow /down arrow to increment/decrement the number. Use left arrow /right arrow to select other digits if necessary. Press the Accept pushbutton or tap the button on the screen to enter the number for the parameter. Tap the button on the screen, or outside the number keyboard to cancel the change of value. Character Keyboard When activating a text value, a standard full character keyboard appears on the screen, see Fig.5.5. Fig.5.5 Character keyboard as it appears on the screen The character keyboard has all the functionality of a normal keyboard, enter text as required by tapping the individual keys with the stylus. Tap the Enter key to accept the changes, or tap outside the keyboard to cancel How to Personalise your Setup Setup contains all the settings for the measurement and some settings for post-processing. Select Setup from the Main Menu, and the Setup screen appears, see Fig.5.6.


66 52 Hand-held Analyzers Types 2250 and 2270 User Manual Fig.5.6 The Setup screen Edit Mode The Full tab at the bottom of the screen allows you to view the complete list of setup parameters, while the Quick tab allows you to access the more frequently used parameters defined by yourself. Press the Edit icon on top of the screen to enter Edit mode. This mode allows you to copy parameters from the Full View to the Quick View simply by tapping on the parameters in the Full View and to remove parameters from the Quick View by tapping on the parameters in the Quick View. When you have finished, tap the Edit icon again to exit Edit mode. Setup settings can be protected from accidental changes by tapping the padlock icon top of the screen. This will also protect the template from being deleted or renamed. on the When locking the template you get the option of password protecting the lock. If you choose this, then you enter a password (see Fig.5.7). Fig.5.7 Password protecting a template

67 CHAPTER 5 Getting to Know Your Analyzer 53 The password must consist of minimum two characters and/or digits. Note: the password is case sensitive. To unlock the setup settings and template, tap the padlock icon again. If the lock is password protected, you must enter the password. Note: It is important to remember the password; the template cannot be unlocked without the password. The only way of overwriting a locked template is to re-install the software using BZ The default templates will be overwritten by a standard installation. New or renamed templates will be deleted, if you install using the option "Install and reset settings to default" How to Manage the Project Templates The Project Templates containing all the display and measurement settings required to perform a measurement are selected in the Project Template Bar at the top of the display screen, see Fig.5.2. You can save changes to the project template, create new templates, rename templates or delete templates from the Template Explorer screen. Select Template Explorer by tapping on the Project Template Bar at the top of the screen or from the Main Menu, and the screen shown in Fig.5.8 will appear. Fig.5.8 Template Explorer The topmost line in the status area (SOUND LEVEL METER in Fig.5.8) contains the name of the current template. If you make any changes to the settings in the current template, an * will appear next to the template name to indicate that the new settings have not been saved. The next line contains icons for saving the settings. Tap the Save icon the current template. to save the settings in Tap the Save As icon to save the settings in a new template. Use the keyboard that pops up to define the name of the template.
68 54 Hand-held Analyzers Types 2250 and 2270 User Manual The rest of the screen is used for listing the defined templates with an icon, a template name and possibly an annotation icon (paper clip): 1) Tap the template icon to open and use the template. 2) Tap the template name to get a drop-down list with the options: Open (open and use the selected template) Clone (create a copy of the selected template) Delete (delete the selected template) Rename (rename the selected template) Add Note (or commentary) to the template View Annotations on the template 3) Tap the annotation icon to get the list of annotations attached to the project. The Full tab at the bottom of the screen allows you to view the complete list of Project Templates, while the Quick tab allows you to access the more frequently used Project Templates. Press the Edit icon on top of the screen to enter Edit mode. This mode allows you to copy Project Templates from the Full View to the Quick View simply by tapping on the Project Template in the Full View and to remove Project Templates from the Quick View by tapping on the Project Template in the Quick View. When you have finished, tap the Edit icon again to exit Edit mode. Note 1: Annotations on templates are for describing the template and will not be copied to the project, when starting or saving a measurement. Note 2: If you delete all templates of a certain type (for example, the Frequency analyzer) and you want a template of this type again, then you either have to open a project made with this template and save the template, or you have to use the BZ-5503 Utility Software for Hand-held analyzers to transfer a template of this type to the analyzer Locking the Pushbuttons and Display The pushbuttons and display can be locked to prevent inadvertent operation. To Lock: Select the Lock Keys and Screen option from the Main Menu. To Unlock: Press the left arrow pushbutton, followed by the right arrow pushbutton, then the Accept pushbutton. If you attempt to press a pushbutton, or tap the screen, while the instrument is locked, an information window pops up with instructions on how to unlock it.
69 55 Chapter 6 Data Management 6.1 Organising Measurements Description of Jobs and Projects When saving a set of measurement results, they are organised together with setup information, calibration information, annotations and sound recordings in a project. A project contains the following: Measurement results: Broadband values (for example, L Aeq, L AFmax, L AFmin, etc.) Frequency spectra (if Frequency Analysis Software BZ-7223 is enabled on your analyzer and you have selected a Frequency Analyzer template) Measurement Setup Display Setup (parameters you have selected) Information on the microphone Calibration Annotations Commentary (attached to measurements as required) Annotations Text (attached to measurements as required) Annotations Image (attached to measurements as required) Type 2270 only Sound Recordings (attached to measurements as required) The Project name is automatically created by combining the Project Name Prefix with a number (starting from 001), i.e., Project 001 for the first project, Project 002 for the next, etc. If preferred, the Project Name Prefix can be changed from the default name of Project. To do this, tap the Main Menu icon, then Preferences followed by Storage Settings to reveal the Project Name Prefix. Tap the current name to reveal a keyboard for you to type in the required name. Projects are saved in folders which are called jobs on your analyzer. These are similar to folders in the Windows filing system.

70 56 Hand-held Analyzers Types 2250 and 2270 User Manual Jobs can be created in the internal memory, on a Secure Digital (SD) Card or on a Compact Flash (CF) Card Navigating in Jobs On the analyzer, a results browser called Explorer is used to navigate through the jobs and projects. To view all jobs and projects, tap the Main Menu icon and select Explorer from the list of options or simply tap the Project Name on the measurement screen. A screen similar to Fig.6.1 will appear. Fig.6.1 The Explorer screen The example from Explorer in Fig.6.1 displays a list of jobs and then some projects which have not been stored under a job name. The topmost line in the status area (Internal Disk\ in the example in Fig.6.1) shows the location in the memory. The next line in the status area contains 4 icons for navigation. Tap the icon to go up one level in the job-levels. The top level is the Memory level, where physical memory devices can be selected. You can select between: Internal Disk SD Card (if available in SD Slot) CF Card (if available in CF Slot) If Multi-user is enabled (see Chapter 8), then each user can access data on the three devices. However, a user cannot see or access jobs for other users. To go down one level (i.e., exit the Memory level), you tap the job name (Internal Disk in this case) and select Open from the dropdown list or you simply tap the memory icon next to Internal Disk.
71 CHAPTER 6 Data Management 57 Tap the icon to create a new job folder. The first job folder name will be Job 01, subsequent job folders will be labelled Job 02, Job 03, etc. You can rename the job folder name by tapping on the name and selecting rename from the dropdown list. Use the keyboard to key in a new name accept by tapping on the Enter key. To go down one level (open a job), you tap the job name in the list and select Open from the dropdown list or you simply tap the job icon to the left of the job name. You can move a job/project (and its content) to another job by tapping the job name/project name and selecting Cut from the dropdown list. Then navigate to the job you want as the new holder of the moved job/project and tap the Paste icon, or navigate to the level above and tap the job name and select paste from the dropdown list. In order to copy a job/project do as described above, but use Copy instead of Cut from the dropdown list. Select Delete from the dropdown list in order to delete the job/project and all of its contents. You can select more than one job/project for copy, cut or delete by tapping and holding the stylus on a job/project name and then dragging the stylus up or down to select other jobs/projects. 6.2 Selecting Default Measurement Job/Path Tap the icon to select the current job as the default measurement job, where all projects will be saved when you press the Save pushbutton. The job name, followed by the current project name, will appear in the topmost line in the status area to confirm which job you have selected. 6.3 Recalling Measurements You can recall your measurement results in one of two ways: To display the measured results (and calibration details) only, use the results viewer this can be done during an ongoing measurement and is a convenient way of browsing several sets of measurement data, see below To re-use setups from previously saved projects or view logged data as a profile, use the Open command in Explorer this will recall the project template (display settings and measurement setup used on the saved results) along with the results. This will, however, stop and reset the current measurement Viewing Data Use Explorer to locate the project with the results you want to view, then tap the project name and select View from the dropdown that appears (or simply tap the project icon). This will open the Viewer (Fig.6.2).

72 58 Hand-held Analyzers Types 2250 and 2270 User Manual Fig.6.2 The Viewer for Sound Level Meter data The project name is displayed at the top of the Viewer, along with two buttons:. These are used to view results on the previous or next project in the job folder. and For Sound Level Meter and Frequency Analysis data the line below this shows the start time and elapsed time for the measurement. For Logging and Enhanced Logging data the second line shows the Result Selector (selects between Total, Logged, 100 ms and Report data) and the start time for the measurement, along with two buttons: and. These are used to view results on the previous or next interval in the project, see Fig.6.3. The Overview profile is also available. For Reverberation Time Data the second line shows the Position Selector. Fig.6.3 The Viewer for Logging and Enhanced Logging data All the measured values are displayed below the top two lines Sound Level Meter data on the Data tab and spectrum information (Frequency Analysis only) on the Spectrum tab. Tap the spectrum parameters or broadband parameters to select other parameters.
73 CHAPTER 6 Data Management 59 The Calibration tab allows you to view the calibration details for the measurement. You can view data on projects without disturbing the ongoing measurement. To exit the Viewer, tap the icon Re-using Setups from Projects Use Explorer to locate the project with the setup you want to re-use, then tap the project name and select Open from the dropdown that appears. This will stop and reset the current measurement and load the project including all setups and data. You are now using the same screens as the ones you were using just before you saved the data. Use the screens to browse the results. Pressing Start/Pause will start a new measurement using the setups from the project. You can save the setup information in a template by tapping the Template Bar on the top of the screen, see section Viewing or Listening to Annotations and Metadata Use Explorer to locate the project with the annotations you want to view/hear, then tap the project name and select Annotations from the dropdown that appears (or simply tap the annotations icon ) and select the Annotations tab. This will show all annotations attached to the project (see Fig.6.4.) Fig.6.4 Example of an annotation attached to a project The icon represents a verbal annotation, or commentary. Tap the annotation name and select Play from the dropdown that appears (or tap the icon) to play the commentary using the headphone output. Note: you can also rename or delete annotations, or copy or move annotations to other projects or jobs.
 to open the Notes Editor.")
74 60 Hand-held Analyzers Types 2250 and 2270 User Manual The Text icon represents written annotations, or notes. Tap the annotation name and select Open from the dropdown that appears (or tap the icon) to open the Notes Editor. View the comments and, if required, edit the comments using the simulated keyboard that appears at the bottom of the screen. Tap the icon to accept the changes and return to the previous screen. The Image icon represents image annotations. Tap the annotation name and select Open from the dropdown that appears (or tap the icon) to open the Image Viewer. Tap the icon to return to the previous screen. Select the Metadata tab to see all metadata attached to the project (Fig.6.5). You can change the metadata just by tapping on them and entering new values. You can also edit the settings for the metadata and reuse specific metadata on new projects by tapping on the Edit icon for the specific metadata (further information in section 8.6). Fig.6.5 Example of metadata Fig.6.6Inserting Annotations Using Explorer In addition to inserting commentary, text or image annotations on your current measurement, see section 3.5, you can insert commentary, text or image annotations on projects or jobs using Explorer. Tap a job or project name and select Add note, Add Comment or Add Image (Type 2270 only) from the drop-down that appears.
75 61 Chapter 7 Connection to PC or Mobile Phone 7.1 Introduction You can connect to your analyzer from a PC or mobile phone in a number of different ways using a wide range of different connection types: Use Utility Software for Hand-held Analyzers, BZ-5503 for full control of the analyzer see Section 7.2. Use an Internet Browser for On-line display and control of the analyzer - see Section 7.4 Three different methods are available for connecting to the Analyzer: USB: BZ-5503 connects to the analyzer through a USB cable Modem: BZ-5503 connects to the analyzer through modem (BZ-5503 uses two modems - one modem connected to the PC for dialling up, and another modem connected to the analyzer) Network: The analyzer is connected to a network (local or Internet). BZ-5503 or an Internet Browser will then be able to connect to the analyzer through TCP/IP using the analyzer s (global) IP address In addition to connecting to the analyzer, the analyzer itself can notify you by SMS, or E- mail, based on various conditions - see Section 8.4. Table 7.1 gives you an overview of the different connection possibilities including links to relevant chapters with more details.
76 62 Hand-held Analyzers Types 2250 and 2270 User Manual Table 7.1 Connection overview Connect from Connection Type Settings in Preferences BZ-5503 USB Modem = Disabled see Section 8.2. Available Notifications N.A. BZ-5503 Modem analogue (PSTN) Modem = Auto Answer see Section 8.2. N.A. BZ-5503 Modem GSM Modem = Auto Answer. see Section 8.2. SMS a see Section 8.4 BZ-5503 Modem GPRS/EDGE/HSPA Modem = Auto Answer. see Section 8.2. SMS a see Section 8.4 BZ-5503 or Internet Browser Mobile Phone with Internet Browser Network GPRS/EDGE/HSPA modem Modem = GPRS/EDGE/HSPA Dialup Settings in Dialup Networking. Network Settings. Possibly settings in DynDNS. see Sections 8.2 and see Section 8.4 BZ-5503 or Internet Browser Mobile Phone with Internet Browser Network Ethernet cable Modem = Disabled Possibly settings in DynDNS. Network Settings. see Sections 8.2 and see Section 8.4 BZ-5503 or Internet Browser Mobile Phone with Internet Browser Network CF WLAN Modem = Disabled Possibly settings in DynDNS. Network Settings. Settings in Wireless Network. see Sections 8.2 and see Section 8.4 BZ-5503 or Internet Browser Mobile Phone with Internet Browser Network DSL Modem/Router Modem = Disabled Possibly settings in DynDNS. Network Settings. see Sections 8.2 and see Section 8.4 a. SMS is also possible for the setting Modem = Disabled. Note: The on-line help for BZ-5503 contains additional information on how to connect an instrument using the different connection types.
77 CHAPTER 7 Connection to PC or Mobile Phone Transferring Measurement Data to Your PC Utility Software for Hand-held Analyzers BZ-5503 is used for communication between your PC and the analyzer. Connect the analyzer to your PC using the supplied USB Cable AO-1476, using a modem connection, or through a LAN connection (see Chapter 8). Use this software to: Transfer measurement data and templates from the analyzer to your PC, and vice versa View data Organise data on the analyzer Create users on the analyzer Upgrade software on the analyzer Install software licenses on the analyzer Using this software, measurements on the analyzer can be controlled from your PC and displayed on-line, using the same user interface on the PC as on the analyzer. Data transferred to the PC are organised in Archives. View the measurement data in the Archives or edit the project templates. Data in the archives can be exported to: Noise Explorer Type 7815 Evaluator Type 7820 Protector Type 7825 Qualifier Type 7831/31 Predictor Type 7810 Lima Type 7812 Acoustic Determinator Type 7816 Microsoft Excel for further post-processing and reporting Sound Recordings can be input to the Brüel & Kjær PULSE analyzer Platform for further analysis please contact your local Brüel & Kjær representative for further information. 7.3 Post-processing and Reporting The software modules are further enhanced by Brüel & Kjær s post-processing software suite, including Utility Software for Hand-held Analyzers BZ-5503 for data transfer, setup and remote display (included with your analyzer), Noise Explorer Type 7815 for viewing data, Evaluator Type 7820 for assessing environmental noise, Protector Type 7825 for assessing workplace noise and Qualifier Light Type 7831 for documenting reverberation time measurements. For further information, please refer to the on-line help included with the relevant PC Software. This software is supplied on the Environmental Software DVD (BZ-5298), which is included with your the analyzer.
.")
78 64 Hand-held Analyzers Types 2250 and 2270 User Manual 7.4 Internet Browser for On-line Display and Control of the Analyzer When the analyzer is connected to a network (see Fig.7.1) you can connect to the analyzer from a PC or mobile phone using an Internet Browser supporting Java scripts. Analyzer settings: You access preferences by tapping on the Main Menu icon and selecting Preferences from the list of options (the screen shown in Fig.8.1 will appear). Tap Web Server Settings, or select the plus icon next to Web Server Settings and set the Web Server Parameters to Enabled. Define sets of Usernames and Passwords: one set for guest use (view only) one set for administrator use of the instrument (view and full control) See Sections 8.5 and Appendix D, Section D.11 for more details. When you enter the IP address or Hostname of the analyzer (see Sections 8.2. and 8.3) in the address or location bar of the Internet Browser, the following screen appears: Fig home page Press the Help link to get more detailed help on using the web page. Press the View Instrument button to enter the web page for viewing the instrument only. You might be prompted for the Guest Username and Guest Password defined for the web server (see Section 8.5).


79 CHAPTER 7 Connection to PC or Mobile Phone 65 Press the View and Control Instrument button to enter the web page for full access to the instrument. You will be prompted for the Username and Password defined for the web server. Fig.7.2 Prompt for username and password The View Instrument Web Page Fig.7.3 shows the View Instrument web page, where you have an on-line display of the instrument. You can use the on-line display for monitoring the measurement only, you cannot change the display, or setup parameters, or start and stop measurements, etc. Fig.7.3 On-line display for monitoring only
80 66 Hand-held Analyzers Types 2250 and 2270 User Manual The instrument can be viewed by several people at the same time, however, the instrument response time will increase with the number of connected browsers. The View and Control Instrument Web Page Fig.7.4 shows the View and Control Instrument web page, where you have an on-line display and keyboard for full control of the instrument. The on-line display can be used for monitoring the measurement. The keyboard on the screen has the same functions as the instrument s keyboard. Click on the display with the cursor to control the instrument as you do when tapping on the screen of the instrument. Fig.7.4 On-line display and keyboard for full control of the instrument
81 67 Chapter 8 Advanced Use of the Analyzer Tips and Tricks 8.1 Setting your Preferences on the Analyzer You can specify a number of parameters controlling display settings, power settings, regional settings, storage settings and users. These parameters are grouped together under Preferences. You access preferences by tapping on the Main Menu icon and selecting Preferences from the list of options. The screen shown in Fig.8.1 will appear. Fig.8.1 The Preferences screen Display Settings Tap Display Settings, or next to Display Settings, to expand the list of available display settings (Fig.8.2). These parameters allow you to select a suitable display colour scheme. This may vary, depending on the lighting conditions at the time of the measurement.

82 68 Hand-held Analyzers Types 2250 and 2270 User Manual Fig.8.2 Display Settings screen The colour schemes are: Indoor scheme for everyday use Alhambra and Arcade schemes alternative colour schemes for everyday use Outdoor scheme for very bright conditions, where you need as much contrast as possible Night scheme for measuring under very dark conditions, where is needed night vision For each colour scheme, you can select the optimum choice of brightness for the traffic light (e.g., High for Outdoor in bright light conditions and Low for Night in dark conditions) and whether to have backlight on the keyboard. In very bright lighting conditions you will not be able to see the backlight, set it to Off to save some power. A link is also provided in Display Settings to adjust the touch-sensitive screen. Tap Adjust Touch Screen > to display a full screen with guidance on how to tap a cross five times at different places on the screen. At the end of the adjustment procedure you can save the values or cancel the adjustment. To change the number of decimal places on your db results readout tap Number of Decimal Places and set to either 1 or 2 decimal places, as required. This setting is for display only and has no effect on the measurement precision or resolution. Tap Display Settings, or, to collapse the list Power Settings The analyzer has an advanced power management function that takes care of supplying the different circuits with adequate power and switches off circuits that are not in use. These power management functions can be changed via the Power Settings screen (Fig.8.3). Tap Power Settings, or next to Power Settings, to expand the list of power settings: Turn Off Backlight Turn Off Backlight Dim Standby

83 CHAPTER 8 Advanced Use of the Analyzer Tips and Tricks 69 Fig.8.3 Power Settings screen The backlight will be switched on as soon as you operate the instrument, either by using the keyboard or stylus on the touch-sensitive screen. The backlight brightness will be one of the 6 levels set by tapping at the bottom of the screen. Select Minimum for minimum brightness and (power consumption), and Maximum for maximum brightness and (power consumption). Once you have chosen the level, select Close to save the settings. When the instrument has been left unused for the time specified in the Turn off Backlight parameter, the backlight level will change to the dim level (Minimum). This state will hold for the time specified in the Turn off Backlight Dim parameter (if still left unused). If the instrument has been left unused for the time specified in the Turn off Backlight parameter plus the Turn off Backlight Dim time period, then the backlight will be switched off completely (Fig.8.4). Use the keyboard or tap the screen to switch the backlight on again. Fig.8.4 Power Settings overview Standby Parameter Turn off Backlight Parameter Turn off Backlight Dim Parameter Backlight off Time /1 If the instrument is left unused, not measuring and not communicating over the USB interface, it will go to standby after the time specified in the Standby parameter. If in standby mode, you must press to switch the instrument on again. The instrument will automatically switch off when it has been in standby mode without external power for more than 30 hours. Note 1: If the instrument is powered externally the Standby After parameters are ignored and the instrument will never go to standby. However, if the instrument is left unused for more than Standby After time the Standby After setting will overrule the Backlight settings and the backlight will be switched off.

84 70 Hand-held Analyzers Types 2250 and 2270 User Manual Note 2: Please use the Display Settings in conjunction with the Power Settings to save power during measurements and extend the battery operating time. When you have made your choices, tap Power Settings, or, to collapse the list Regional Settings Tap Regional Settings, or regional settings, see Fig.8.5. next to Regional Settings, to expand the list of available Fig.8.5 Regional Settings screen Select your preferred settings for Decimal Point and Date Separator and select your preferred date/time format from the six different formats provided in the drop-down. Then select your time zone from the list. A number of different languages are available for your analyzer. Select your preferred language if it is not in the list, then it might be available for installation using BZ Built-in help is provided in the more commonly used languages if your particular language is not covered, English will be chosen automatically. Select a keyboard matching the one you prefer when using your PC. When you have made your choices, tap Regional Settings, or on the minus icon collapse the list., to Storage Settings Each time you save the results of a measurement, the analyzer suggests a project name and number for the project. The Project Name Prefix can be generated automatically (from the start date of the project as Year, Month, Date in the format YYMMDD, e.g., as 2005, November 12th) or you can specify a Project Name Prefix (max. 8 characters), using the standard full character keyboard that pops up when you tap the current name set as the
85 CHAPTER 8 Advanced Use of the Analyzer Tips and Tricks 71 project name prefix, see Fig.8.6. (The field where you type in the project name prefix will appear at the top or bottom of the pop-up keyboard, depending on how many settings you have expanded in the list.) The project suffix number will be generated automatically. Fig.8.6 Storage Settings screen Headphone Settings The headphone settings allow you to control the output to the headphone socket on the connector panel (see item 2 in Fig.2.2). Commentary annotations on measurements can always be heard on the headphones, regardless of the options chosen in Headphone Settings. In addition to the commentary annotations, you can listen to the measured signal for monitoring purposes. Select between A/B-weighted, C-weighted or Z-weighted. (A/Bweighting is determined by setting the parameter in Setup, Frequency Weightings, Broadband (excl. Peak)). The measured signal covers approx. 120 db (from approx. 20 db to 140 db with a Type 4189 or Type 4190 microphone of nominal sensitivity). The output of the headphone socket covers approx. 75 db. Use the gain settings for the measured signal to adjust the output level to suit the listening conditions. If the signal has a very high dynamic range (or the levels are unknown), you can set Automatic Gain Control to On this will convert the 120 db input range to 40 db output range enabling you to hear signals of any level clearly. Individual gain settings are provided for the commentary annotations and the measured signal. Tap the gain parameter and use the keypad to enter a new setting. to assign the new value for immediate response at the output or use the up/down navigation keys to increment/decrement the value. Note 1: A 0 db gain on the measurement signal means you get a 1 V output for a 1 V input (when the measured signal Automatic Gain Control is set to Off). Note 2: While playing back an annotation, you can use the up/down navigation keys to increase/decrease the gain of the annotation.
86 72 Hand-held Analyzers Types 2250 and 2270 User Manual Note 3: If you do not want to listen to the input signal, then set the Listen to Signal parameter to No, to economise on power Multi-user Facility The analyzer can handle more than one user of the instrument. Each user can have their own set of preferences, templates and jobs and projects completely invisible to other users. This can also be very useful in organising large measurement jobs, or cases you can separate the cases completely from each other by handling each case as a separate user. The transducers, the calibration setup and the calibration histories of the transducers are common to all users, as shown in the overview provided in Fig.8.7. Fig.8.7 Overview of Multi-user Facility Instrument Transducer Calibration History Calibration Setup User 1 User N Preferences Preferences Template Display Param. Setup Template Display Param. Setup Project Template Meas. Data Annotations Project Template Meas. Data Annotations Tap Users, or the plus icon, then select Yes in the Multi User Enabled drop-down to distinguish between different users. The instrument, when delivered, has one default user called 2250 (for Type 2250) or 2270 (for Type 2270). You require Utility Software for Hand-held Analyzers BZ-5503 (included with the analyzer) to set up new users on the instrument (see Section section 7.1).
87 CHAPTER 8 Advanced Use of the Analyzer Tips and Tricks Printer Settings You can make screen dumps on a printer connected to the analyzer using USB cable AO Use the Printer Settings to select your preferred printer. When a printer has been selected under the Printer Used parameter, then the Print Screen command in the Main Menu appears. Use this command to print a screen dump of any screen on the analyzer. The printer must either be an MPS type, or accept the PCL printer language (PCL: Printer Control Language developed by Hewlett-Packard see details on their Web site: MPS: Mobile Pro Spectrum thermal printer from AM-TECH, see details on Web site: PCL: printers accepting PCL printer language PCL Inkjet: suitable for Inkjet printers and supports colour printing PCL Laser: suitable for Laser printers For the PCL printers you can use the Top and Left Margin parameters to position the print on the paper, and use Width and Height parameters to set the size of the print. 8.2 Modem/DynDNS Settings You can use the analyzer for monitoring in remote places and control it using Utility Software for Hand-held Analyzers BZ-5503, via a telephone connection wired or wireless using suitable modems or via network connections. See the overview of possibilities in section Table 7.1, in Chapter 7. When you connect via a modem, or via a network connection, you will see the contents of the analyzer in the Instrument Task as if you had made the connection via USB. You then have the same possibilities for transferring data to the Archive and organising data on the analyzer, as if you were connected via the USB connector. Modems can be used for connection in two different ways: BZ-5503 connects to the analyzer through modem (BZ-5503 uses two modems, one modem connected to the PC for dialling up and another modem connected to the analyzer). The setup of the modem connected to the analyzer is described in section please refer to the BZ-5503 on-line manual for dial-up and connection details The analyzer is connected to the Internet through a modem. BZ-5503 or an Internet Browser will then be able to connect to the analyzer through TCP/IP using the analyzer s (global) IP address. The setup of the modem connected to the analyzer is described in section please refer to the BZ-5503 on-line manual for details of how to make a connection The modem connected to the analyzer should either be a Compact Flash modem, or a modem with an RS-232 serial interface, to be connected via a Compact Flash to Serial converter.
88 74 Hand-held Analyzers Types 2250 and 2270 User Manual Connection Through Modem Hayes compatible modems (serial GSM or standard serial analogue (PSTN) modems) are supported. To use the modem all you need to do is to set the Modem parameter to Auto Answer in the Modem/DtnDNS Settings. No other settings are necessary. The modem is initialized with the following command string: AT<cr>AT&FE0V1&C1&D2<cr> If your modem needs extra commands for initialization, they can be defined in Extra Init. If you are not familiar with the command strings for modems, then please consult the documentation from the manufacturer of the modem or web-sites such as or support.microsoft.com/default.aspx/kb/ Note: Before you connect or disconnect a modem (or switch it on or off), the Modem parameter should be set to Disabled, or the analyzer must be in standby mode or switched completely off the latter is recommended. Compact Flash Modems Compact flash modems can be inserted directly in the compact flash socket of the analyzer (see item 9 in Fig.2.2). Analogue Modems The following modems have been tested: CF 56 K Modem Card (V90 and V92) from Socket - see details on Web site: 56 K CompactModem (V92) from Pretec - see details on Web site: GSM Modems The following modems have been tested: Compact GPRS from Pretec - see details on Web site: Note: The SIM card should be usable without pin-code. Modems with RS 232 Serial interfaces Modems with an RS 232 serial interface can be connected using a Compact Flash to Serial converter inserted in the compact flash slot of the analyzer. Switch off the analyzer when connecting a serial I/O CF Card and modem to the analyzer. The following Compact Flash to Serial converter has been tested: Serial I/O CF Card - Ruggedized, from Socket - see details on Web site:
89 CHAPTER 8 Advanced Use of the Analyzer Tips and Tricks 75 Analogue Modems The following modems have been tested: MT5600ZDXe from MultiTech Systems (Brüel & Kjær order number: ZM-0069) see details on Web site: Hayes Accura 56k speakerphone, model 5670NL GSM Modems The following modems have been tested: GSM Module M1 from Siemens WMOD2B-G900/1800 Dual Band Modem from Wavecom M1306B FASTRACK Dual Band Modem from Wavecom FASTRACK Supreme 10 and 20 GSM/GPRS/EDGE Modem from Wavecom Airlink Fastrack Xtend GPRS, EDGE and HSPA from Sierra Wireless see details on Web site: GSM Small from INSYS Note: The SIM card should be usable without pin-code. Modems Incompatible with the Analyzer The following modems don't work correctly together with the analyzer: Fujitsu - Siemens/CONNECT2AIR GSM/GPRS Compact Flash Card Audiovox RTM-8000P GSM/GPRS CF modem Enfora GSM 0110 Modem Modems with USB Interface Modem to USB interface is currently not supported Connection to Network using GPRS/EDGE/HSPA Modem GPRS/EDGE/HSPA modems are supported. The modem is initialized with the same command string as described in Section section Note: The SIM card account should include a Data subscription and should be usable without a pin-code. To use the modem you need to set up the parameters in Dialup Networking (listed below) and set the Modem parameter to GPRS/EDGE/HSPA Dialup. Parameters in Dialup Networking: APN (Access Point Name) is an identifier required by the Network Operator. Examples are Internet, public and Username, Password and possibly Domain should be set as required by the Network Operator.
90 76 Hand-held Analyzers Types 2250 and 2270 User Manual When the Modem perameter is set to GPRS/EDGE/HSPA Dialup, then a connection is made using the settings in Dialup Networking. The Status parameter reflects the current status of the network connection eg. Connected or Disconnected. If the connection fails, then the analyzer will try to reconnect until it succeeds, or the Modem parameter is set to Disabled. If the connection succeeds, then the instrument will automatically get an IP address, which is readable (but not accessible) in Network Settings for more details see Section section 8.3. The IP address is the address on the WAN (Wide Area Network) or Internet. Use this address in BZ-5503 or an Internet Browser to connect to the analyzer. Note: In some cases you might be able to get a static IP address from the Network Operator, which means that the analyzer will always get the same IP address, when connected to the network. However, typically the IP address will be renewed each time the analyzer connects to the network. In order to deal with this in BZ-5503 or an Internet Browser you need to use DynDNS - see Section section Compact Flash Modems Compact flash modems can be inserted directly in the compact flash socket of the analyzer (see item 9 in Fig.section 2.2). The following modem has been tested: Compact GPRS from Pretec see details on Web site: Modems with RS 232 Serial Interfaces Modems with an RS 232 serial interface can be connected using a Compact Flash to Serial converter inserted in the compact flash slot of the analyzer. Switch off the analyzer when connecting a serial I/O CF Card and modem to the analyzer. The following Compact Flash to Serial converter has been tested: Serial I/O CF Card Ruggedized, from Socket see details on Web site: The following modems have been tested: FASTRACK Supreme 10 and 20 GSM/GPRS/EDGE Modem from Wavecom Airlink Fastrack Xtend GPRS, EDGE and HSPA from Sierra Wireless see details on Web site: Modems with USB Interface Modem to USB interface is currently not supported DynDNS If the analyzer is connected to: the Internet through a GPRS/EDGE/HSPA modem, or a local network with access to the Internet through a DSL modem/router
91 CHAPTER 8 Advanced Use of the Analyzer Tips and Tricks 77 and you want to connect to the instrument from a place outside the local network, then you need to know: global IP address of the instrument or the global IP address of the DSL modem/router (and ensure that correct port forwarding in has been set the router details in the on-line help for BZ-5503) In some cases the global IP address is static and will never change, so you connect to the instrument using BZ-5503 or an Internet Browser by using this IP address. Normally when you browse to addresses using an Internet Browser you don't use the IP address itself, but a hostname for it (e.g. you would use the hostname instead of ). This requires a DNS (Domain Name System) provider, which is a kind of Internet phone book that translates hostnames to IP addresses for you. However, for a GPRS/EDGE/HSPA or even a DSL router then often the global IP address is renewed at each new connection or at certain time-intervals (e.g., every two weeks). In this case you will have to change the IP address in BZ-5503 or the Internet Browser accordingly. To avoid this, a service like DDNS (Dynamic Domain Name System) can be used. DDNS is a network service that provides the capability for a modem/router/computer system to notify a domain name system provider to change, in real time (ad-hoc), the active DNS configuration of its configured hostnames and IP addresses. This will ensure that the hostname you use will always be updated to reflect the correct IP-address. The analyzer supports DDNS provided by the world-wide DDNS service provider DynDNS.com. The analyzer can then be configured to notify DynDNS.com each time the global IP address is set or changed. When BZ-5503 or an Internet Browser connects to the analyzer it then uses a hostname defined by DynDNS.com. From DynDNS.com it then gets the updated IP address. You need to make an account at DynDNS.com, specifying a user name and a password for the account and a hostname (e.g., 'MyBK2250.dyndns.org') identifying the analyzer. In the analyzer you need to specify the Hostname, Username and Password and set Active to Yes in Preferences, under Modem/DynDNS settings. Each time the analyzer detects a change in the IP address it notifies DynDNS.com. Note: To avoid too much traffic at DynDNS.com, the analyzer ensures that this service doesn't allow updates of settings more frequently than every 10 minutes. So you may experience up to a 10 minute wait for DynDNS settings to update. 8.3 Network Settings The analyzer can be connected to a LAN (Local Area Network) through an Ethernet interface or to WLAN (Wireless Local Area Network) using equipment conforming to the IEEE a/b/g standard. This connection can be used to synchronise measurement and setup data with a host PC using BZ-5503.
92 78 Hand-held Analyzers Types 2250 and 2270 User Manual Type 2270 has a built-in LAN Socket on the Connector Panel (Fig.2.2). Type 2250 (and Type 2270) accepts the following Compact Flash LAN and WLAN Cards: 10/100 Ethernet Ruggedized CF Card (Brüel & Kjær order number: UL-1016) see Go Wi-Fi! P500 CF WLAN, rev. B and rev. C see Use a straight-through (standard) Ethernet cable with RJ45 connectors at both ends to connect the analyzer to the network (via a hub, switch or router). Use a crossover Ethernet cable with RJ45 connectors at both ends to connect the analyzer directly to a PC. The analyzer supports TCP/IP (Transmission Control Protocol/Internet Protocol) on the LAN and WLAN. This requires the analyzer to have a unique address on the network. This address is called an IP address and consists of four sets of 3-digit numbers, e.g The IP address can be obtained in different ways: Automatically Using DHCP A DHCP (Dynamic Host Configuration Protocol) Server on the network assigns automatically an IP address to the analyzer when connected to the network. This is the most common way of setting up IP addresses. Using Link-local If no address is automatically assigned by the DHCP Server, then after a few seconds the analyzer will use an address from the Link-local address range x.x. This will most likely be the case when connecting the analyzer directly to a PC using an Ethernet Crossover cable Manually You setup the IP address manually. This will typically be the case in a private network without a DHCP Server Parameters in Network Settings Location Use the Location parameter to specify a text up to 20 character long identifying the analyzer or location of the analyzer. The Location will be displayed on the PC as well as the serial number of the analyzer when browsing for analyzers in BZ-5503 and when connected using the on-line display. Note: The location parameter is useful for both USB and LAN connections. Network Connection (Type 2270) LAN Socket: Use the built-in LAN socket as connection CF Socket: Use an Ethernet CF Card in the Compact Flash Socket. This setting is only available if an Ethernet CF Card is present. The LAN Socket is disabled, if an Ethernet
93 CHAPTER 8 Advanced Use of the Analyzer Tips and Tricks 79 CF Card is present Network Connection (Type 2250) None: If no Ethernet CF Card is present CF Socket: If an Ethernet CF Card is present Set IP Address Automatically: This will obtain an IP address from a DHCP server if no server available, then a Link-local address will be set Manually: You have to set the IP Address, Subnet Mask and Default Gateway IP Address The IP address of the instrument Selectable if Set IP Address = Manually Subnet Mask The Subnet Mask combined with the IP address identifies the network segment the analyzer is on Selectable if Set IP Address = Manually Default Gateway Address to a gateway for routing to another network Selectable if Set IP Address = Manually Set DNS Automatically: This will automatically obtain the DNS Manually: You have to set the DNS Preferred DNS The IP address of the primary DNS server Alternate DNS The IP address of the secondary DNS server MAC Address The MAC Address of the network adaptor (LAN or WLAN) in use. MAC (Media Access Control) Address is a unique identifier assigned to the network adaptor. This field is for information only Status The status of the network connection, either Operational or Non-operational: Operational: the network adaptor can be used for a connection Non-Operational: the network adaptor cannot be used Parameters for Wireless LAN Only Name
94 80 Hand-held Analyzers Types 2250 and 2270 User Manual Name (SSID) of the network you want to connect to. Update the name either by: entering a name directly, or tapping on the Available Networks and selecting a name from the list Available Networks Tap the line to get a list of available networks. Tap a name in the list to connect to this network. The name is inserted in the Name line above this line. Each network name is preceeded with Signal Strength information, ranging from Excellent (displayed as ) down to No Signal (displayed as no dots at all) Security Select the security as required by the network: Open, Shared, WPA PSK or WPA2 PSK. Open and Shared are for WEP (Wired Equivalent Privacy) Infrastructure mode. WPA PSK is for WPA (Wi-Fi Protected Access) with Pre-shared Key (also called Personal mode). WPA2 is an enhanced version of WPA Encryption Select the encryption as required by the network: None, WEP Enabled, AES Enabled or TKIP Enabled. None is for Open security. WEP Enabled is for Open and Shared security. AES and TKIP Enabled are for WPA PSK and WPA2 PSK security Encryption Key Insert the encryption key required by the network. The key will be displayed until you press Enter, then it will be replaced by ' *** ' 8.4 Notifications The analyzer can notify you if disk space is getting low or external power has disappeared, etc. This is done via SMS or , as described in this section. The SMS/ notification contains a short status report for the analyzer. This facility is especially useful if the analyzer is left for unattended monitoring. Alarm Settings If one or more of the following alarms occur, then a notification will be issued as either an SMS or an , depending on your equipment and settings. If the notification fails (e.g. the connection has been lost), then the analyzer will retry to send the notification once more after 5 minutes.
95 CHAPTER 8 Advanced Use of the Analyzer Tips and Tricks 81 Table 8.1 Alarm Settings Alarm Type Condition Comment Power On Measurement State CIC Internal Battery Trigger Input Voltage Disk Space Level Trigger When analyzer is switched on or reboots When a measurement starts or stops When Charge Injection Calibration fails When Internal Battery is entering a specified state: High, Low or Critical. When voltage at Trigger Input drops to or below a specified level When remaining disk space drops to or below a specified percentage of the total disk space When level trigger conditions are fulfilled Indicates start from a timer, or a power failure, or unexpected behaviour Indicates measurement finished or unexpected behaviour Indicates possible measurement problem Indicates internal battery getting low. Internal Battery will be in one of the states: Full, High, Low, Critical, Charging or Unknown. You can set alarm to High, Low or Critical in Preferences, Notification Settings, Alarm Settings, Internal Battery. Note: The internal battery will typically be in one of the states Full or Charging if externally powered. Entering one of the set states might then indicate a power failure Indicates no external power, or external battery getting low. Set the Setup, Input, Trigger Type to Voltage for Monitoring. Set the voltage limit in Preferences, Notification Settings, Alarm Settings, Trigger Input Voltage. Connect the external battery or external power to this input (in addition to the External Power Socket) to get an alarm if the voltage drops to or below the specified level Indicates disk space getting low needs to be swapped with an empty disk. Set the percentage in Preferences, Notification Settings, Alarm Settings, Disk Space Indicates sound level exceeds trigger level specified in Logging or Enh. Logging template
96 82 Hand-held Analyzers Types 2250 and 2270 User Manual Table 8.2 Content of Notification Information Type Reason for notification Time of notification Instrument ID Status of current Disk Status of Internal Battery Trigger Input Voltage (if available) Measurement Status (if available) No. of Sound Recordings (if available) Latest CIC Result (if available) Current value of LAF (if available) Content Test or Alarm followed by a short description Date and Time Serial No. and Location Free memory / Total memory Full, High, Low, Critical, Charging or Unknown The voltage Running, Paused or Stopped The number Passed, Background noise too high, Ratio outside tolerances, Ratio deviates from Ref., Undefined Ref., or Undefined The value Note: some of the information listed above may not be available, depending on the conditions when the notification was sent, e.g., no measurement values will be available immediately after a power on. SMS Notifications SMS notifications can be used if you have connected a GSM/GPRS/EDGE/HSPA serial modem to the analyzer (see section 8.2.1). In addition to sending SMS notifications initiated by alarms, you can send an INFO SMS to the analyzer and ask for an SMS notification, after which you will get a notification within 5 minutes. You need to setup a Phone Number in Preferences, Notifications, SMS and set Active to Yes for the SMS. You can also add a Name for the number for easier identification. You can setup two individual SMS phone numbers for sending the SMS notification to two recipients. Set Notification to SMS and a notification will be sent by SMS to the active phone numbers, when any of the alarm conditions are met, or if the analyzer receives an INFO SMS. You can test the system by tapping on the Main Menu icon Notification via SMS". and selecting "Send Note 1: Two to three SMS's will be used to send the complete notification depending on the content and language settings.
97 CHAPTER 8 Advanced Use of the Analyzer Tips and Tricks 83 Note 2: SMS's cannot be sent or received while the analyzer is connected to BZ-5503 or On-line display. Note 3: If you don't want the ability to connect to the analyzer using BZ-5503 and prefer to use the SMS Notification facility, then you can set Modem = Disabled, in which case the SMS Notification functionality will still be available. After having sent an INFO SMS to the analyzer a notification will be sent out within 30 seconds. Notifications notifications can be used if the analyzer is connected to a network with access to a mail server. This can typically be done if the analyzer is connected through LAN or by a GPRS/EDGE/HSPA serial modem (see section and 8.3). Go to Preferences, Notifications, and setup details for the account under the To parameter. The details consist of the SMTP server name, the SMTP port used, whether SSL/TLS is required or not, the Account, the Username and Password for the account please consult Appendix D Section D.10 and your provider for more details. Set Notification to and a notification will be sent by when any of the alarm conditions are met. and selecting Send Notifi- You can test the system by tapping on the Main Menu icon cation via . Example of Subject: from Abbey Road Test: Manual Test: Manual :51:16 Instrument Abbey Road SD-Card 383 MB / 483 MB Internal Battery Charging Trigger Input Voltage 13.5V Measurement Status Running No. of Sound Recordings 13 CIC Result Passed LAF 45.8dB 8.5 Web-server To connect to the instrument using an Internet Browser, the following conditions must be fulfilled: The instrument must be connected to a network as described in Sections section 8.2.2, section and section 8.3 The Internet Browser must support Java scripts
98 84 Hand-held Analyzers Types 2250 and 2270 User Manual The web page of the instrument has been tested on the following Internet Browsers: Microsoft Internet Explorer, from version 7 Mozilla Firefox, from version 3 Google Chrome, from version 2 Apple Safari, from version 4 You may also be able to connect to the instrument using Internet Browsers on mobile phones and iphones. Password Protection Connection to the instrument is password protected. There are two levels of protection: Guest - for viewing only Administrator - for viewing and controlling the instrument Username and Password Under Preferences you set the Username and Password individually for the Guest and for Administrator accounts. You need to specify Username and Password for the administrator, however, you can specify whether the guest requires a login or not. 8.6 Preparing your Measurements You can prepare your measurements in advance by making job folders, setting up the correct measurement parameters in the templates, defining settings for metadata and by making checklists (see example in Fig. 8.8) either as memos containing addresses and phone numbers of relevant people, or notes that have been partly filled-in beforehand, where you just have to fill in the final information on location. The notes can be attached to jobs as annotations, and can be copied onto projects, when necessary.

99 CHAPTER 8 Advanced Use of the Analyzer Tips and Tricks 85 Fig.8.8 Example notes screen When you have finished typing in your note, tap the icon to accept the changes and save it as a text annotation. See section 3.5 for more details on annotations Metadata For easy and convenient use of metadata, it is an advantage to define the settings for the metadata entered and displayed on the Annotations screen (see section 3.5) in advance. Define settings for each of the 10 metadata. Tap the Edit icon in front of the metadata you want to edit (Fig.8.9) to define: Metadata: Enabled (visible and editable on the Annotations screen) or Disabled (invisible on the Annotations screen) Name: Insert a name preceding the metadata value when displayed on the annotations screen Type: Select a type suitable for your medatadata. Select between: Text: The metadata is the text you enter or edit using the alphanumeric keyboard Pick List: The metadata are selected from a list of up to 15 user-defined texts Number: The metadata number is entered using the numeric keyboard Index: The metadata number is automatically incremented after creating the project Not defined: The metadata are removed from the project. This will be the initial state of metadata for old projects without metadata. Entry No.: For Type = Pick List. The entry number for the text to be defined in the pick list. Select the required number and enter text in the Entry Text field

100 86 Hand-held Analyzers Types 2250 and 2270 User Manual Entry Text: For Type = Text: The text For Type = Pick List: The text for the selected Entry No. Current No.: For Type = Number: The number Current Index: For Type = Index: The index. Step: For Type = Index. The Current Index is incremented with Step after creation of a project. The index wraps around when exceeding Upper Limit or getting below Lower Limit. Note: Step can be negative Upper Limit: For Type = Index: The upper limit of the index Lower Limit: For Type = Index: The lower limit of the index At the top of the screen you can set a checkmark to use the settings for this metadata on new projects when closing the display. The checkmark is disabled for changes to the definition of the metadata currently in use because this will always be used for new projects, however, when you are editing or looking at metadata from a previously saved project you can decide whether to use the settings on new projects too or keep the changes to the project only. Fig.8.9 Edit metadata Timers and Automatic Measurements Automatic control of the analyzer is available via one or more of the analyzer s timers (up to ten).
101 CHAPTER 8 Advanced Use of the Analyzer Tips and Tricks 87 The purpose of a timer is to initiate measurements in the absence of an operator. Basically, a timer will: Switch on the analyzer at a preset time Load a preselected template Start a measurement as specified in the template Stop the measurement after a preset time defined by the Timer Setup Save the measurement Switch the analyzer off Repeat the above a preset number of times at preset intervals For a timer to work, the analyzer must be in the switched off state. A timer will never interrupt the analyzer if it is already in use manually. If a switch-on time is during the time the analyzer is in use, the timer opportunity is lost. You can control the analyzer during a timer-initiated measurement as long as this does not affect the measurements. If you try to change any parameters affecting the measurement you will be warned of this. If you persist, the analyzer will revert to manual control and timer control cannot be resumed. The Timer Setup lists the timers that have been defined previously on the analyzer (i.e., added by you or previous users). Fig.8.10 Example Timer Setup In the topmost line you can add other timers by tapping on the Add New Timer icon. You can delete a timer from the list by tapping on the Delete Timer icon. Only timers created by the current user can be deleted to delete a timer defined by another user, you have to logon as the other user and then delete the timer.
102 88 Hand-held Analyzers Types 2250 and 2270 User Manual For each timer you can specify: State: Enable or disable the timer Name: Name the timer Template: Select the template you want to use for the measurement. Note: Reverberation Time templates are not available for timer control Start Time: Set the start time at least 3 minutes ahead of current time Preset Time: Set the preset time for the measurement regardless of the settings in the template used by the timer Stop Time: The time when the measurement stops for information only No. of Starts: Set to the total number of times you want to start the measurement Start Every: The time interval between the start of each successive measurement. This interval must be greater than Preset Time + 3 minutes User: The user who specified the timer. Cannot be changed
103 89 Chapter 9 Updating and Upgrading Applications, Maintenance, Calibration and Troubleshooting 9.1 How to Install New Applications Sound Level Meter Software BZ-7222, Frequency Analysis Software BZ-7223, Logging Software BZ-7224, Enhanced Logging Software BZ-7225, Sound Recording Option BZ-7226, Reverberation Time Software BZ-7227, Building Acoustics Software BZ-7228, FFT Software BZ-7230, Tone Assessment Option BZ-7231 and Noise Monitoring Software BZ-7232 are preinstalled on Types 2250 and In addition Dual-channel Building Acoustics Software BZ-7229 are pre-installed on Type However, a valid license is required to run the software. If you have purchased the instrument together with the software application(s), then the relevant license(s) will come pre-installed on the instrument. If you purchase a separate software application for your analyzer, then you have to install the license on the instrument. This is done using Utility Software for Hand-held Analyzers, BZ-5503, please consult the on-line help included with the BZ-5503 software for instructions on how to install a license. Tap, on the instrument s screen, then About to get a list of installed software and licenses. 9.2 How to Update/Upgrade Applications and Install New Languages When new versions of the analyzer software become available, you may want to install the software on your instrument. This is done using the Utility Software for Hand-held Analyzers, BZ-5503, or if the analyzer is connected to the Internet, by the analyzer itself. Some software versions will be free updates, and some will be upgrades requiring that a new license is purchased.
104 90 Hand-held Analyzers Types 2250 and 2270 User Manual Update/Upgrade using BZ-5503 BZ-5503 can be used for updating or upgrading new software applications on your analyzer. It can even downgrade to specific software versions if required by type approving authorities. Using BZ-5503 you can also install your preferred language and you can install licenses for the specific applications. Installation requires a USB connection between BZ-5503 and the analyzer. The BZ-5503 software will clearly indicate if the new software version is an update (free of charge) or an upgrade (license fee). Please consult the on-line help included with the BZ-5503 software for instructions on how to install upgrades/updates of the software, together with your preferred language. Tap, on the instrument's screen, then About to get a list of installed software and licenses Update Through the Internet The analyzer can update software by itself, if it is connected to the Internet see section 7.1. This method is particularly useful if the analyzer is used for long term monitoring, and you don't want to go to the measurement site for servicing (ie., you want to disturb the measurement as little as possible). Note: The method is used for updating the software with the latest version available from the Brüel & Kjær web-site. The languages already installed will be updated at the same time, but you cannot install new languages or licenses to do this use BZ The update procedure is as follows: 1) Tap, on the instrument's screen, then About to get a list of installed software and licenses. Scroll down to the bottom of the screen and tap the Check for updates on the web > link, the Software Update screen appears see Fig.9.1and Fig.9.2. Note: This can be done remotely if you connect to the on-line display using either BZ-5503 or an Internet Browser. 2) Click on the Check for Updates button to check for the latest updates. This will connect to the Brüel & Kjær update server if a new software version is available the build version will be displayed and you can start the update (you will be warned, if the new version requires a new license) or decline the update. If the versions that are available are not later than those already installed you will be told so and the update will be terminated. 3) If you choose to update the analyzer will start downloading the new software on the CF- or SD-card (required) already inserted in the analyzer. You need at least 100 MByte of free space on the memory card. Depending on the speed and quality of the Internet connection, this can take from a few minutes to several hours. If the connection is lost, then the download will automatically continue when connection is established again. Note: The analyzer can continue measuring during the download period. 4) When download is complete, the measurement is paused and normal use of the instrument is prevented. Connections to the instrument are terminated and the upgrade of the


105 CHAPTER 9 Updating and Upgrading Applications, Maintenance, Calibration and Troubleshooting 91 instrument will start. This will take minutes and the analyzer will reboot when finished. Any unsaved logging data will be saved and the analyzer is ready to use again. 5) Connect to the instrument again and verify the new software version by tapping, on the instrument's screen, then About. To continue the measurement, press the Start pushbutton. Note: If you have set up your instrument for notifications (see Section 8.4), then you will get an in step 4), when the analyzer is paused, and you will get a new in step 5), when the analyzer has rebooted and is ready for connection again. Fig.9.1 About screen - Showing the Check for updates on the Web link Fig.9.2 Software update screen - Showing the Check for updates button Downgrade to an Earlier Version It is possible to downgrade to an earlier version of the software:
106 92 Hand-held Analyzers Types 2250 and 2270 User Manual 1) Change the latest part of the server address (see Fig.9.2) to the requested software package, e.g., SW22 2) Press Check for updates. 3) Follow the procedure described in section or section Note: Only software packages equal to or above SW24 can downgrade to another package. Software packages down to SW21 are available for update through internet. 9.3 How to Move a License If you have more than one analyzer, you may want to share application software between the instruments. You can do this by moving the license from one analyzer to another by using Utility Software for Hand-held Analyzers BZ-5503, together with the License Mover VP If you lend out your analyzer, you may want to temporarily un-install applications not needed. This can be achieved by moving the license of the application to License Mover VP When needed again, you move the license back to your analyzer. Please consult the on-line help included with the BZ-5503 software for instructions on how to move a license. 9.4 Troubleshooting Analyzer Measurements If your analyzer measurement seems to be wrong, then: Check the cabling, if any Check that the microphone, including preamplifier, is correctly mounted in the top socket (or correctly connected to the extension cable) Check that the Input parameter is set to Top Socket/Rear Socket in agreement with how you are going to use the input. This is found by tapping the Main Menu icon, then Setup, followed by Input Check that the transducer you have mounted on your analyzer is selected as the Transducer Used parameter, this is also found in the Setup menu Check whether the parameters for the selected transducer (Transducer Used) are set correctly, especially the Microphone Type and Polarization Voltage parameters. These are found by tapping the Main Menu icon, then Transducers Check that the Sound Field and Windscreen Correction parameters have been set correctly These are found by tapping the Main Menu icon, then Setup, followed by Input Check if the calibration is OK (make a new calibration using an external calibrator)
107 CHAPTER 9 Updating and Upgrading Applications, Maintenance, Calibration and Troubleshooting SD and CF Cards The Logging, Enhanced Logging and Sound Recording software requires that measurements are saved on SD or CF memory cards. If you experience problems in storing or recalling data on memory cards, you can check and repair the integrity of the file system on the memory card or even re-format it, by doing the following: 1) Insert the memory card in the correct slot of the connector panel of the analyzer, see Fig ) You will be notified that a memory card has been inserted select Yes to change the default measurement path to the memory card. 3) Tap the Main Menu icon and then Explorer. 4) Tap the icon to go up folder levels until you have reached the topmost level with a list of the available memory devices. 5) Tap the name of the memory card (not the icon) to get a list of available commands. 6) Select Check and Repair to start the procedure. If any errors are found in the file system, they are fixed. When finished, you will be informed whether the memory device was OK or that errors have been fixed. Note: the checking procedure can take several minutes, depending on the size of the memory card. Formatting a memory card: 7) Select Format to start the formatting procedure. WARNING: All data on the memory card will be erased during the formatting process. Note: the formatting procedure can take several minutes depending on the size of the memory card. WARNING: Do not remove the memory card or switch off the instrument during the procedure this might damage the file system and data and make the card unusable. Note: The read/write performance of SD and CF memory cards varies a lot. The performance depends on the manufacturer of the card, the type of card, the size of card and even on the day of production of the card two identical cards can have a different performance because the manufacturer has changed the internal technology without notice. In general, as a rule of thumb, you should select cards aimed for the industrial or professional photographer market. The cards delivered by Brüel & Kjær have all been tested for their read/write performance in the analyzer and can be used for the applications available in the analyzer. If you need more (or other) types of card, please consult your local Brüel & Kjær representative. Remember to regularly re-format the card (especially before a long unattended measurement) this will ensure the best performance of the card.
108 94 Hand-held Analyzers Types 2250 and 2270 User Manual Battery Pack and Recalibration of Battery Charge Indicator The software keeps the capacity of the battery pack updated. Over time the total capacity of the battery pack decreases. If you find that the Time Remaining estimate (tap the battery icon to get this information) does not match the real time remaining (e.g., the instrument switches off automatically because of lack of power while the Time Remaining estimate indicates at least ½ hour), then you should manually re-calibrate the capacity of the battery pack. This is done using the following method: Drain all the power from the battery: Switch the instrument on Disconnect external power Disconnect the instrument from the PC In the Preferences menu, under Power Settings, set Standby After to Never You may want to set Backlight On to Always (in the same menu) and select the maximum level of display backlight in order to drain the battery faster (use the Backlight icon at the bottom of the screen) Leave the instrument until the battery voltage becomes so low that the instrument switches itself off Charge the battery fully (at least 10 hours): Connect the Mains Power Supply ZG-0426 to the instrument Switch the instrument on (and leave it on) and remember to reset the Standby After and Backlight On to your preferred settings Tap the battery icon and a pop-up appears, giving details of the battery condition. This will indicate Calibrating Battery initially. Let the battery charge until the battery charge indicator just below the power socket starts flashing and the Calibrating Battery indication has disappeared from the pop-up window Touch Screen If tapping with the stylus on the screen seems to be getting more inaccurate, you can adjust the touch sensitive screen, as follows: In the Preferences menu, under Display Settings activate the link Adjust Touch Screen. This displays a full screen with guidance on how to tap a cross five times at different places on the screen. The adjustment procedure ends with saving the values or canceling the adjustment Reset Options Reset Button WARNING: Unsaved data or setups will be lost when you reset the instrument. If your analyzer stops responding to pushbutton presses, or stylus taps: Reset and reboot the instrument by pressing the reset button (located on the connector panel see Fig.2.2 in Chapter 2) with the point of the stylus
 and 2270 (for Type 2270), the project template is set to SOUND LEVEL METER and No Transducer is selected.")
 Press and hold down the Commentary and Save pushbuttons while switching on the")
109 CHAPTER 9 Updating and Upgrading Applications, Maintenance, Calibration and Troubleshooting 95 Instrument Reset If you still experience problems: Reset the instrument to a default state, where the user is set to 2250 (for Type 2250) and 2270 (for Type 2270), the project template is set to SOUND LEVEL METER and No Transducer is selected. The existing SOUND LEVEL METER project template will be overwritten, as will the preferences for user 2250 (for Type 2250) and 2270 (for Type 2270). To reset the instrument to the default state: Press and hold the power-on pushbutton for at least 5 seconds (power off) Press and hold down the Commentary and Save pushbuttons while switching on the instrument. The display in Fig.9.3 will be shown. Fig.9.3 Maintenance Mode initial screen Within a few seconds the display in Fig.9.4 will be shown. Fig.9.4 Update 2250 software screen
110 96 Hand-held Analyzers Types 2250 and 2270 User Manual Press any other pushbutton than the Accept pushbutton to continue. Fig.9.5 Reset to default settings screen Press the Accept pushbutton to reset to default settings. If the instrument now functions normally, you should select the correct transducer again in the Transducers menu, make your preferred settings in the Preferences menu, adjust the touch screen again and make necessary changes to Setup (all accessed via the Main Menu ). If you experience problems selecting the correct transducer again, or selecting another template or you login as another user, then note which step causes the problem. You might need to delete a transducer, or delete/reconfigure templates or users. WARNING: If you delete a transducer, the calibration history will be lost. You can delete a transducer from the transducer database by tapping the Delete Transducer icon (see section 4.8). To delete/reconfigure templates or users you can use Utility Software for Hand-held Analyzers BZ-5503, with the instrument connected to the PC using the USB interface cable (AO-1476) or a modem connection. Please consult the on-line help included with the BZ-5503 software for instructions on how to configure the analyzer. Re-installing Software If the instrument still does not work normally after performing the Reset to Default Settings procedure, then the software might need to be re-installed. This can be done in two ways: 1) If the connection to Utility Software for Hand-held Analyzers BZ-5503 works with the instrument connected to the PC using a USB cable, then the software can be re-installed and re-configured through the USB cable. Please consult the on-line help included with the BZ-5503 software for instructions on how to re-install software on the analyzer. 2) If the connection to the PC does not work, then you need a Compact Flash card (size at least 64 Mbytes) and a Compact Flash card reader for the PC. You can then use Utility
111 CHAPTER 9 Updating and Upgrading Applications, Maintenance, Calibration and Troubleshooting 97 Software for Hand-held Analyzers BZ-5503 to update the Compact Flash card with the necessary files. Please consult the on-line help included with the BZ-5503 software for instructions on how to update a Compact Flash card with installation files for the analyzer. Power off the analyzer and insert the compact flash card in the CF slot on the instrument. Then press and hold down the Commentary and Save pushbuttons while switching on the instrument. The Maintenance Mode initial screen will be displayed, and then within a few seconds the screen shown in Fig.9.4 will appear. Press the Accept pushbutton to update the software. This will take approx. 5 minutes. WARNING: Do not remove the CF-card while updating the analyzer software! When the analyzer software has been updated, you will get the option of resetting to the default settings. If the problem still persists, then you should contact your local Brüel & Kjær representative. 9.5 Care, Cleaning and Storage The analyzer is a delicate precision instrument. When handling, storing or cleaning your instrument, please take the following precautions Handling the Instrument Do not try to remove the microphone grid as you can easily damage the microphone in this way Do not attempt to open the instrument. There are no user-serviceable parts inside. If you think your instrument requires service, please contact your Brüel & Kjær representative Do not allow the instrument to get wet Protect the instrument from impact. Do not drop it. Transport it in the supplied carrying pouch Cleaning the Instrument If the instrument casing becomes dirty, then wipe it with a lightly dampened cloth. Do not use abrasive cleansers or solvents. Do not allow moisture to enter the microphone, connectors or casing Storing the Instrument Keep the sound level meter in a dry place, preferably within its carrying pouch For long-term storage, remove the battery pack Do not exceed storage temperature limits of 25 to +70 C ( 13 to +158 F)
112 98 Hand-held Analyzers Types 2250 and 2270 User Manual 9.6 Services at Brüel & Kjær for Types 2250 and Accredited Calibration For Types 2250 and 2270, you can order accredited calibration and choose between DANAK, A2LA, UKAS, Eichamt (Austria), RvA, ENAC, NATA and Inmetro. For Spain, Primitiva is available. The calibration will be performed in an ISO certified laboratory Initial Calibration To start the measurement history from day one if this is required, for example, for measurement use in public, for customer audit or quality procedures we recommend you order accredited calibration together with the new instrument Regular Re-calibration To fulfil requirements for public measurements and to minimise the cost of errors due to faulty or inaccurate measurements, we can arrange for calibration every year in an ISO certified laboratory at Brüel & Kjær. With annual data, you will have an unbroken history to use as reference, either for internal requirements, for audit required by authorities or at the request of your customers. And not least, you can follow the history of sensitivity for your instruments over time Filter Calibration You can order calibration of filters. Please specify at the time of ordering. Calibration of filter response for octave and 1/3-octave filters according to IEC Service and Repair The hand-held analyzer is designed and constructed to provide many years of reliable operation. However, if a fault occurs that impairs the analyzer s correct function, then remove the battery pack and disconnect any external power supply to prevent risk of further damage. For more information about preventing faults or damage to your sound level meter, see section Hardware Maintenance and Repair You can minimise the risk of unexpected costs by purchasing the hardware maintenance with a five years warranty. Minor repairs, such as those resulting from damage caused by unauthorised use of the instrument, can be performed at the same time as the instrument is being calibrated at Brüel & Kjær. This will save you time. If any other errors are detected by the technician during calibration, repair will be performed before returning the instrument to you. Repair is available at a fixed price, which includes a Conformance Test Certificate upon the return of your instrument (no measurement data included).
113 CHAPTER 9 Updating and Upgrading Applications, Maintenance, Calibration and Troubleshooting Rental To ensure optimal uptime, you can rent a substitute Hand-held Analyzer a while yours is being calibrated. To arrange rental, please contact your local Brüel & Kjær representative Training Basic knowledge on sound and vibration measurement, instrument training and application training are a few examples of what local training or consultancy hours a can do for you. To find out more about training and consultancy hours, please contact your local Brüel & Kjær representative. a Providing this service is available from your local Brüel & Kjær office
114 100 Hand-held Analyzers Types 2250 and 2270 User Manual
115 101 Chapter 10 1/1- or 1/3-octave Frequency Analysis (Optional Module) Frequency Analysis Software BZ-7223 enables you to make 1/1-octave or 1/3-octave measurements and broadband sound level measurements simultaneously. Check the About Menu to see whether you have the license to run the frequency analyzer. The About Menu is accessed from the built-in help tap on the shortcut bar, then select About. See Chapter 9 for instructions on installing the license for the frequency analyzer Setting up the Instrument The frequency analyzer measures the following spectrum parameters together with full spectral statistics during timed measurements: L Xeq L XFmax L XSmax L XFmin L XSmin where X is the frequency weighting A, B, C or Z. These spectra and the spectral statistics are saved in the project together with the measured sound level meter (broadband) parameters. The spectral statistics can be viewed as L XYN percentile spectra, where Y is the time weighting F or S and N can be one of 7 defined percentiles. In addition, the instantaneous spectra L XF and L XS are always available. 1) Select the FREQUENCY ANALYZER Project Template. (See section for more details on templates.) The Project Template is displayed at the top of the screen, if it does not display FREQUENCY ANALYZER, tap the black bar at the top of the screen and select FREQUENCY ANALYZER from the drop-down that appears.
.")
116 102 Hand-held Analyzers Types 2250 and 2270 User Manual 2) Tap the Main Menu icon and select Setup from the list of options. Set the Broadband and Spectrum parameter to A, B, C or Z, as required. (A/B-weighting is determined by setting the parameter in Setup, Frequency Weightings, Broadband (excl. Peak). Then, under Bandwidth, set the Bandwidth parameter to 1/1-octave or 1/3-octave before making the measurement. To exit the screen, tap the icon. Fig.10.1 Setting the frequency weighting and bandwidth parameters 10.2 Controlling the Measurement The measurement is controlled in the same way you would control a normal sound level meter measurement, using Start/Pause, Continue, Back-erase and Reset pushbuttons, see Chapter 3 for more details. The measurement can control a generator connected to the Output Socket on the Connector Panel (see Fig.2.2). Enable the generator by setting the Source parameter to Generator in Setup, Output Socket Signal, then set up the generator settings in Setup, Generator. The generator will be controlled using Escape Time and Build-up Time, as described in Fig Displaying the Results The frequency analyzer measurement screen includes three tabs at the bottom: Spectrum, Broadband and XL View (Extra Large View). The tabs allow you to choose different ways of displaying the measurement results. All but the Spectrum tab have been covered in Chapter 3. However, a quick recap is provided below. The Broadband view shows an instantaneous L AF readout, with associated bar graph and four measurement parameters, followed by two measurement setup parameters. (The first measurement parameter is displayed in a larger font size for better readability.)
, shows two different spectra parameters being measured simultaneously. In the example in Fig.10.")
117 CHAPTER 10 1/1- or 1/3-octave Frequency Analysis (Optional Module) 103 The XL View increases the size of the first parameter readout to a 4 digit, full-screen display (including decimal point). The Spectrum view, (which only appears as a tab if Frequency Analysis Software BZ-7223 is enabled), shows two different spectra parameters being measured simultaneously. In the example in Fig.10.2, L ZFmax and L ZF are being viewed at the same time. Note the Reference Spectrum and Main Spectrum icons, indicating which spectrum belongs to which parameter. 1) Select which spectra to view by tapping the parameter fields in the two lines above the spectrum display. These lines also include readouts of the spectrum values highlighted by the spectrum cursor. Tap the spectrum at the frequency of interest - or just tap anywhere in the spectrum area and then move the cursor to the position of interest using the left and right arrow pushbuttons. To the right of the spectrum, two broadband bars (of the same parameters) are also displayed. Fig.10.2 Displaying the results spectrum screen 2) Scale the Y-axis (left-hand vertical scale of the graphical display) by tapping on the scale and accessing the drop-down menu, see Fig (You can also select the spectrum cursor and press the Accept pushbutton.)
 Select Zoom In/Zoom Out to adjust the zoom.")
118 104 Hand-held Analyzers Types 2250 and 2270 User Manual Fig.10.3 Scaling the Y-axis on the Spectrum display 3) Select Auto Zoom to adjust the range of the Y-axis for best fit of the measured spectrum. 4) Select Zoom In/Zoom Out to adjust the zoom. 5) Select Scale Up/Scale Down to adjust the full scale value on the Y-axis or select Auto Scale to select the best scaling for viewing the spectra without adjusting the zoom. 6) Spectrum Table displays the spectrum in tabular form as in Fig Press the Table Format icon at the top of the screen to select between three different viewing formats: Two Parameters: for displaying values from both spectra One Parameter: for displaying values from the main spectrum only (available for Reverberation Time Software only) One Parameter (wrap): for displaying values from the main spectrum only, but with the columns wrapped on the display to allow as many values as possible on the screen Fig.10.4 Spectrum table
119 CHAPTER 10 1/1- or 1/3-octave Frequency Analysis (Optional Module) 105 7) To exit the Spectrum Table, tap the icon. 8) Auto Zoom and Auto Scale automatically close the drop-down menu, otherwise, select Close, tap outside the drop-down list or use the left arrow pushbutton to close the menu. Hint: a quick way of auto zooming is to tap anywhere in the spectrum and then press the Accept pushbutton twice. Some parameters are calculated based on the spectra: SIL, PSIL, SIL3 and L Xeq (f1-f2) are calculated during the measurement and saved together with the other measurement data The Noise Parameters NC, NR, RC, NCB, Loudness and Loudness Level are for display only and calculated based on measured L Xeq spectra. This means that whenever you have a L Xeq spectrum you can also calculate and display these parameters NC, NR, RC and NCB are defined for 1/1-octave L Zeq spectra, however, NC, NR, RC and NCB are calculated for any frequency weighting and any octave bandwidth. A-, B- and C-weighted spectra are converted to Z-weighted spectra and 1/3-octave spectra are converted to 1/1-octave spectra before the calculation Loudness and Loudness Level are calculated for 1/3-octave spectra with any frequency weighting. A, B and C weighted spectra are converted to Z-weighted spectra before the calculation If 1/1-octave L Zeq spectra have been measured, then you can display a Noise Curve together with the L Zeq spectrum, see example in Fig Fig.10.5 Displaying a Noise Curve together with the L Zeq spectrum For RC and NCB you also have the possibility of displaying the limit curves for Rumble and Hiss, and for Rattle and Vibration together with the 1/1-octave L Zeq spectrum.
120 106 Hand-held Analyzers Types 2250 and 2270 User Manual Smileys A smiley will be shown to the right of the project name if there are any issues with calculating noise parameters, or displaying noise curves (see the overview in Table 10.1). Table 10.1 Overview of Smileys Smiley Explanation Description No Loudness for 1/1-octaves Select 1/3-octave No L eq parameter logged Sound Field Mismatch for Loudness Frequency bands outside Noise Curves Noise Curves require use of Mic. Display Noise Curve with L Zeq Noise Curve for 1/1-octaves only Select a L eq spectrum for logging Set the Loudness parameter in Input in accordance with the Sound Field Correction Levels are lower or higher than any noise curve band Select a microphone Noise parameters are calculated but Noise Curves can only be displayed together with L Zeq Noise parameters are calculated but Noise Curves can only be displayed for 1/1-octaves 10.4 Saving Results Measurements are saved and can be viewed later, in the same way as described for the Sound Level Meter Project in Chapter 3.
121 107 Chapter 11 Logging (Optional Module) Logging Software BZ-7224 enables you to measure and save data periodically on SD- or CF- Cards. The module is optimised for attended use, which means that while measuring you can annotate any sound on-line, as well as mark up to five different sound categories on-line. The main benefit is that data is documented on-site and is therefore ready for post-processing and reporting back at the office using Utility Software for Hand-held Analyzers BZ-5503 or other post-processing software such as Noise Explorer Type 7815, Evaluator Type 7820, Protector Type 7825 or Microsoft Excel. In addition to measuring broadband parameters (see Chapter 3) and spectra a (see Chapter 10), the logging module allows you to simultaneously log the following parameters: Broadband Parameters (including broadband statistics) Spectra a (including spectral statistics) Broadband Parameters every 100 ms Record the measured signal b An overview showing the options available during a typical logging task has been provided in Table a. Requires Frequency Analysis Software BZ-7223 b. Requires Sound Recording Option BZ-7226
122 108 Hand-held Analyzers Types 2250 and 2270 User Manual Table 11.1 Overview of options available during a typical logging task Selection Period Broadband Parameters Broadband Statistics Spectral Parameters Spectral Statistics Logged 1 s 24 h 1 to 10 or All (32) None or Full 0 3 or All (5) None or Full Logged (100 ms) 100 ms None, L Aeq, L AF and/or L AS None available None available None available Total Elapsed Time All (45) Full All (5) Full Check the About Menu to see whether you have the right license to run the Logging module. (The About Menu is accessed from built-in help tap, on the shortcut bar, then About.) See Chapter 9 for instructions on installing the license for the Logging Module Setting up the Instrument 1) Select the LOGGING Project Template. (3.3.1 for more details on templates.) The Project Template is displayed on the black banner at the top of the screen. If this banner does not display LOGGING, tap the banner and select LOGGING from the drop-down that appears. Note: The Logging Project Template assumes you have a license for the Frequency Analysis Software. If not, then select the LOGGING SLM Project template instead. 2) Insert an SD or CF memory card in the slot for SD or CF cards (see items 9 and 10 in Fig.2.2). You will be notified that a memory card has been inserted select Yes to change the default measurement path to the memory card. 3) Tap the Main Menu icon and select Explorer from the list of options. Create a job folder for the measurements and set the default measurement job/path as described in Chapter 6. Note: You cannot log data on the internal disk. 4) Tap the Main Menu icon and select Setup from the list of options. The Setup screen will appear, see Fig Set the Input, Frequency Weightings, Bandwidth a and Statistics parameters as required for the Sound Level Meter and Frequency Analyzer 1 measurement, see Chapter 3 and Chapter 10 respectively. These settings are common to both the logging and the total measurement. a. Requires Frequency Analysis Software BZ-7223

123 CHAPTER 11 Logging (Optional Module) 109 Fig.11.1 The Setup screen 5) Under the Measurement Control parameters, set the Measurement Time and Logging Period as required. Set Synchronize with clock to Yes if you want the logging to synchronise with whole minutes or hours. For example, if Logging Period is set to 1 minute and you start the measurement at 8:12:33, then the first logging interval will be from 8:12:33 to 8:12:59 (27 seconds), the second will be from 8:13:00 to 8:13:59 (60 seconds), etc. Set Synchronize with clock to No if you want every logging interval to be the specified Logging Period exactly. Set Charge Injection Calibration to On if you want to validate the complete measurement chain by performing CIC at the start and end of the logging measurement, refer to ) Under the Logged Broadband parameters, choose which broadband parameters you want to log in accordance with the Measurement Control parameters. You can choose to log Full Statistics per Logging Period or not. You can also choose to log all the measured Broadband Parameters or a Selected number of parameters. If you choose Selected then you can specify up to 10 parameters. 7) The Logged Broadband (100 ms) parameter allows you to log L Aeq, with an elapsed time of 100 ms and a logging period of 100 ms, L AF and/or L AS, with a logging period of 100 ms, irrespective of the other logging parameters. 8) The Logged Spectrum a parameter allows you to choose which spectra to log. You can specify to log All, None or up to 3 Selected spectra. You can also choose to log Full Spectral Statistics per Logging Period or not. 9) Under Markers you can specify the names of the five available markers. The markers are predefined as follows: Marker 1: Exclude can be controlled by pressing the Back-erase pushbutton Marker 2: Manual can be controlled by pressing the Manual Event pushbutton Marker 3: Level can be controlled by the Level Trigger detection Marker 4: Marker 4 a. Requires Frequency Analysis Software BZ-7223
124 110 Hand-held Analyzers Types 2250 and 2270 User Manual Marker 5: Marker 5 Marker 6: Sound is set when recording sound (requires Sound Recording Software BZ- 7226) All markers can be controlled by the stylus in the Profile display. You can set a Pre-marker Time between 0 and 5 seconds. This will start markers 1, 2 or 3 the set number of pre-marker seconds before the point where the Back-erase pushbutton, the Manual Event pushbutton, or the Level Trigger, respectively, are pressed. See ) Under the Level Trigger parameters, choose the settings for triggering the number 3 marker Level, for starting a sound recording and for sending an SMS or see Chapters 8.4 and 12: Set Level Trigger Control to On to enable the level trigger facility or Off to disable the facility Set Trigger Parameter to the parameter you want to monitor, e.g., L Aeq see Appendix A for the total list of parameters Set Start Slope to Rising if you want to start when the Trigger Parameter exceeds Start Level (and stop when it goes below Stop Level) or to Falling if you want to start when the Trigger Parameter goes below Start Level (and stop when it exceeds Stop Level) Set Start Duration for the number of seconds the Trigger Parameter must fulfill the trigger condition before the trigger point is acknowledged Set Stop Duration for the number of seconds the Trigger Parameter doesn t fulfill the trigger condition anymore to acknowledge the end point of the trigger. (See the relationship between the trigger parameters in Fig.11.2)
125 CHAPTER 11 Logging (Optional Module) 111 Fig.11.2 Relationship between trigger parameters L Aeq 100 db 90 db 80 db 70 db Trigger Parameter = L Aeq Start Slope = Rising Start Duration 60 db Stop Duration 50 db 40 db 30 db Start Level = 50 db 2s Trigger Point Stop Level = 40 db Trigger Point 3s 20 db 10 db 0 Pre-recording (BZ 7226 only) Time in secs. Post-recording (BZ 7226 only) /1 11) Under the Sound Recording parameters, choose the settings for recording sound while making a logging see Chapter ) Under Input specify Trigger Input if you want to start the sound recording using an external trigger signal. See details in Appendix A. To exit the screen, tap the icon Controlling the Measurement The measurement is controlled in the same way you would control a normal sound level meter measurement, using Start/Pause, Continue, Reset and Save pushbuttons, see Chapter 3 for more details. If you have set the Charge Injection Calibration parameter to On, then CIC is performed at the start of the measurement and at the end of the measurement. An Exclude marker is set on the logging profile at the point where CIC is being performed. The update of the Total parameters is stopped while CIC is being performed. You can see the results of the CIC under Total parameters, CIC Result 1 and CIC Result 2.
126 112 Hand-held Analyzers Types 2250 and 2270 User Manual Annotating a Project While using the logging software you can annotate measurements using the normal method of adding annotations to a project, before or after a measurement, or while the measurement is paused. The annotations can then be viewed by tapping on the paperclip icon or tapping the Main Menu and selecting Explorer from the list of options However, if you choose to annotate the profile during the measurement, the annotation icon will appear below the profile, not as a paperclip icon in the status field or attached to a project in Explorer, as described previously. In this case, you view the annotation using the method described under Recording Sound You can record sound during the measurement a by pressing the Manual Event pushbutton (Manual Event marker), the Back-erase pushbutton (Exclude Marker) or when the level of a specific parameter exceeds a certain level or you can record sound through the whole measurement depending on the Sound Recording setting in the Setup details in Chapter Displaying the Results The Logging measurement screen (or Profile View) includes three tabs at the bottom: Profile, Spectrum and Broadband View (the Logging SLM includes the tabs: Profile, Broadband and XL View). The tabs allow you to choose different ways of displaying the measurement results. All but the Profile tab have been covered previously in Chapters 3 and 10, however a quick recap is provided below. The Broadband view shows an instantaneous L AF readout, with associated bar graph and a number of measurement parameters. (The first measurement parameter is displayed in a larger font size for better readability.) The XL View increases the size of the first parameter readout to a 4 digit, full-screen display (including decimal point). The Spectrum view shows two different spectra parameters being measured simultaneously The Profile View The Profile view displays a profile of a logged broadband parameter (db versus time). This is very convenient when marking sound categories on-line or annotating the measurement. See Fig a. Requires License for Sound Recording Software BZ-7226
 113")
127 CHAPTER 11 Logging (Optional Module) 113 Fig.11.3 Profile View (showing extended status field) Status Field The Status Field has been extended to include an extra line of information below the two existing lines of information covered previously in the Sound Level Meter and Frequency Analyzer (see Fig.11.3). This extra line of information allows you to: Select whether the results of the Total measurement from the Logged measurement, or from the Logged(100 ms) measurement are displayed. Select Total to display the measurement parameters of the Total measurement in all the views the Broadband and Spectrum views will then display parameters or spectra similar to the Sound Level Meter or Frequency Analyzer. (The Profile View will be empty, because the Total measurement contains only a single set of parameters). Select Logged to display the measurement parameters from the logging intervals. The cursor in the profile selects which logging interval is displayed in all the views. Select Logged(100 ms) to display the L Aeq, L AF or L AS in the profile from the 100 ms logging intervals. This setting does not display spectra or parameters in other views View the start time of the measurement (for Total) or the start time of the current logging interval (for Logged or Logged(100 ms) if measuring and the profile is not frozen) or the start time of the logging interval pointed out by the cursor. Tap the start time in any of the views to select data from another logging interval View whether the display of the profile during the measurement is frozen or not. When the icon is animated the display is being updated with new logged data during the measurement. You can freeze the display update by tapping on the icon. This also freezes the icon. Tap the icon again to unfreeze the display Step forwards or backwards through the logging intervals on all displays, using the and icons. (The icons are also connected to the profile cursor, so that any corresponding movement backwards or forwards through the intervals in one display will be reproduced in the other)
128 114 Hand-held Analyzers Types 2250 and 2270 User Manual Some interaction with the display will automatically freeze and unfreeze the display (only while measuring): Tap the stylus on the profile. This will set the profile cursor and freeze the display update of the profile. You can move the cursor to any point in the profile by using the left and right arrow pushbuttons. The profile will be scrolled automatically, if necessary. Unfreeze by tapping on the icon Tap and hold the stylus on the profile display and drag it to the left or right. This will freeze the display and show two cursors. Next, remove the stylus from the display and a drop-down menu appears with the possibility of setting or editing a marker or annotation (see below). Select the required function from the drop-down menu. When the function has been carried out, the profile unfreezes automatically and progresses as it did before you tapped on the screen The logged data are displayed as two profiles. The Profile Overview with the entire profile and the Profile with 100 logging samples. The Profile Overview An overview of the entire profile is displayed across the screen on the topmost part of the graph area. The overview is based on L Xeq,1s (X = A or B depending on the Broadband (excl. Peak) Frequency Weightings parameter). The Y-axis is auto-zoomed. When you have logged for more than 4 minutes, then each pixel on the X-axis will cover more than 1 s. The overview will then display from the minimum L Xeq,1s to the maximum L Xeq,1s within the interval covered by the pixels on the X-axis. Tap in the Profile Overview to select the part of the entire profile to display in the Profile below. The Profile The Profile displays a hundred samples of the logged data. Select which parameter to view by tapping the parameter field in the line above the profile. Markers are displayed between the profile and the profile parameter. Marker 1 (Exclude) is the topmost positioned marker. The name of the marker is displayed if the marker overlaps the cursor position. If a sound has been recorded, then a Sound Marker (Marker 6) is displayed above the profile the marker covers exactly the time of the sound recording. You can browse through markers using the buttons in the profile. The whole, or any part of the sound recording can be played back, once or repetitively see Chapter 12 for details. To the right of the profile, the broadband parameter L AF is displayed and updated regardless of the measurement status and the display freeze status. Annotations are displayed below the profile as icons. To select an annotation, tap and hold the stylus at one side of the icon, just above it, then drag the stylus to the opposite side of the icon (so it looks like the example in Fig.11.4) and remove the stylus from the display.
129 CHAPTER 11 Logging (Optional Module) 115 Fig.11.4 Selecting Annotations A drop-down menu appears, select the required function: Open note or play commentary Delete annotation Move annotation (to the position on the display where the stylus was removed from the display) Scale the Y-axis (left-hand vertical scale of the graphical display) by tapping on the scale and accessing the drop-down menu (as in the Spectrum display): Select Auto Zoom to adjust the range of the Y-axis for best fit of the measured spectrum Select Zoom In/Zoom Out to adjust the zoom Select Scale Up/Scale Down to adjust the full scale value on the Y-axis - or select Auto Scale to select the best scaling for viewing the spectra without adjusting the zoom Auto Zoom and Auto Scale automatically close the drop-down menu, otherwise, select Close, tap outside the drop-down list or use the left arrow pushbutton to close the menu Marking Sound Categories Use this facility to categorise the sound while you are measuring, or while you are observing the different kinds of sound on the display. This will make it much easier to do the post-processing and reporting back in the office. You can mark up to five sound categories on-line. The markers are displayed as horizontal lines above the sound profile, see Fig There are two main types of marker: An Exclude Marker this allows you to mark a sound you want to exclude from your measurement later during post-processing or reporting. (It does not remove any data from your measurement) An Event Marker this allows you to mark a particular sound of interest during your measurement
130 116 Hand-held Analyzers Types 2250 and 2270 User Manual On the analyzer, Marker 1 is used as an Exclude Marker, while Markers 2 to 5 are used as Event Markers. All four event markers can be user-defined. You can define a marker by tapping on the Main Menu icon and selecting Setup, followed by Markers. Marker 2 is set to a Manual Event marker by default it can be controlled by the Manual Event pushbutton and the stylus. Marker 3 is set to a Level Event marker by default it can be controlled by the level trigger facility and the stylus. Marker 6 is used as a Sound Marker and shows the size of the sound recording. The analyzer allows you to view the markers at a later date by recalling the data and viewing the desired profile. (This can also be done if you have transferred the data to BZ-5503 or Type 7815 Noise Explorer). If required, Type 7820 Evaluator and Type 7825 Protector can use the markers in their calculations. Marker number 1 (the Exclude Marker) will always be used as an Exclude Marker, while markers 2 to 5 will be used as defined in Type 7820 Evaluator/Type 7825 Protector software. The marker names, however, will be transferred from the analyzer. Marker 6 will be used as sound marker. Marking During the Measurement The measurement parameter is displayed as a progressing profile. Use of Pushbuttons Press the Back-erase pushbutton to start an Exclude Marker (marker number 1). The marker is displayed above the profile. Press the button once more to stop the Exclude Marker. Press the Manual Event pushbutton to start a Manual Event Marker (marker number 2). The marker is displayed above the profile. Press the button once more to stop the Manual Event Marker. Use of Stylus Tap and hold the stylus on the profile display at the position where you want the marker to start. This will freeze the display and show a cursor at the position of the stylus. Then drag the stylus left or right to the position where you want the marker to end. This will display a second cursor. Next, remove the stylus from the display and a drop-down menu appears showing the five markers you have specified in the setup. Select the marker you require. The marker is displayed above the profile, the cursors disappear and the profile unfreezes and progresses as it did before you tapped on the screen. Note: If you select Sound Marker, then the sound for this part will be recorded see Chapter 12 for details. Marking Measurement While it is Paused The measurement parameter is displayed as a profile while the measurement is paused.
131 CHAPTER 11 Logging (Optional Module) 117 You can use the Stylus to Mark the Sound Categories Tap and hold the stylus in the profile display at the position where you want the marker to start. This will display a cursor at the position of the stylus. Then drag the stylus left or right to the position where you want the marker to end. This will display a second cursor. Next, remove the stylus from the display and a drop-down menu appears showing the five markers you have specified in the setup. Select the marker you require. The marker is displayed above the profile and the cursors disappear Editing Markers on Profiles To widen a marker: 1) Tap and hold the stylus on the profile display at a position within the marker range. 2) Drag the stylus left or right to the position where you want the marker to end. 3) Remove the stylus from the display and a drop-down menu appears. 4) Select the marker you want to widen from the drop-down menu. To narrow a marker: 1) Tap and hold the stylus on the profile display at the position inside the marker range where you want it to stop. 2) Drag the stylus left or right to a position outside the marker range. 3) Remove the stylus from the display and a drop-down menu appears. 4) Select Delete for the marker you want to narrow from the drop-down menu. The part where the marker overlaps the gap between the two cursors will be deleted. To delete a marker: 1) Tap and hold the stylus in the profile display at a position to the left of the marker you want to delete. 2) Drag the stylus to a position to the right of the marker. 3) Remove the stylus from the display and a drop-down menu appears. 4) Select Delete for the marker you want to delete from the drop-down menu. Note: Sound markers cannot be edited. Marking the whole sound marker (or part of it) and selecting Delete will delete the whole sound marker and sound recording Annotate Sound Categories You can annotate the measurement on-line with a spoken comment or a written note or (Type 2270 only) an image. The annotation is displayed as an icon below the sound profile. Annotating During the Measurement The measurement parameter is displayed as a progressing profile.
132 118 Hand-held Analyzers Types 2250 and 2270 User Manual Use of Pushbuttons Press and hold down the Commentary pushbutton and talk to the instrument to make your comment. Release the button when finished. This will insert a comment annotation in the profile at the time when the button was pressed. Use of Stylus Tap and hold the stylus in the profile display at the position where you want the annotation to start. This will freeze the display and display a cursor at the position of the stylus. Then drag the stylus a little to the left or right and raise it again. A drop-down menu appears and below the five markers you can select Add Comment or Add Note or Add Image to add a spoken comment or write a note or capture an image. When finished, the Comment or Note or Image is inserted in the profile, the cursors disappear and the profile unfreezes and progresses as before tapping on the screen. Annotating While the Measurement is Paused The measurement parameter is displayed as a profile while the measurement is paused. Use of Stylus to Annotate the Sound Tap and hold the stylus in the profile display at the position where you want the marker to start. This will display a cursor at the position of the stylus. Next, drag the stylus a little to the left or right and remove the stylus from the display. A drop-down menu appears and below the five markers you can select Add Comment, Add Note or Add Image (Type 2270 only) to add a spoken comment, write a note or capture an image. When finished the Comment, Note or Image is inserted in the profile and the cursors disappear. Use of Pushbuttons Using the Commentary pushbutton during a pause means that the comment annotation will be added to the project instead of the profile. (The annotations can be viewed by tapping on the paperclip icon or tapping the Main Menu and selecting Explorer from the list of options. See 3.5.) Editing Annotations on Profiles To move an annotation: 1) Tap and hold the stylus on the profile display at a position on one side of the annotation icon. 2) Drag the stylus through the annotation icon to the position where you want the annotation moved to. 3) Remove the stylus from the display and a drop-down menu appears. 4) Select Move Comment (or Move Note, or Move Image) from the drop-down menu.
133 CHAPTER 11 Logging (Optional Module) 119 To delete an annotation: 1) Tap and hold the stylus on the profile display at a position to the left of the annotation icon you want to delete. 2) Drag the stylus to a position to the right of the annotation. 3) Remove the stylus from the display and a drop-down menu appears. 4) Select Delete for the annotation you want to delete from the drop-down menu Saving and Recalling Results Measurements are saved and can be viewed later, in the same way as described for the Sound Level Meter Project in Chapters 3 and 6. Note: The viewer only displays the results as one set of data per logging interval (you can browse through all data). To display the data as a profile and see or hear annotations or even edit the markers or insert new markers and annotations you must Open the saved project instead of Viewing it.
134 120 Hand-held Analyzers Types 2250 and 2270 User Manual
135 121 Chapter 12 Enhanced Logging (Optional Module) Enhanced Logging Software BZ-7225 enables you to measure and save data periodically on SD or CF cards. The module is optimised for unattended use, which means that the module will measure and save data in an efficient way, without the requirement for an operator to be present. In addition to measuring broadband parameters (see Chapter 3) and spectra a (see Chapter 10), it simultaneously logs the following parameters (see Chapter 11): Broadband Parameters (including broadband statistics) Broadband Parameters every 100 ms Spectra a (including spectral statistics) Record the measured signal b Finally, the Enhanced Logging module can also log with a different period (periodic reports for example, every hour) for reporting: Broadband Parameters (including broadband statistics) Spectra a (including spectral statistics) The Enhanced Logging module can measure continuously, limited only by data memory and power supply. An overview showing the options available during a typical enhanced logging task has been provided in Table a. Requires Frequency Analysis Software BZ-7223 b. Requires Sound Recording Option BZ-7226
136 122 Hand-held Analyzers Types 2250 and 2270 User Manual Table 12.1 Overview of options available during a typical enhanced logging task Selection Period Broadband Parameters Broadband Statistics Spectral Parameters Spectral Statistics Logged 1 s 24 h 1 to 10 or All (32) None or Full 0 3 or All (5) None or Full Logged (100 ms) 100 ms None, L Aeq, L AF and/or L AS None available None available None available Periodic Reports 1 m 24 h All (45) Full All (5) None or Full Total Elapsed Time All (50) Full All (5) Full Check the About Menu to see whether you have the right license to run the Enhanced Logging module. (The About Menu is accessed from built-in help tap, on the shortcut bar, then About.) See Chapter 9 for instructions on installing the license for the Enhanced Logging Module Setting up the Instrument 1) Select the ENHANCED LOGGING Project Template. (section for more details on templates.) The Project Template is displayed on the black banner at the top of the screen. If this banner does not display ENHANCED LOGGING, tap the banner and select ENHANCED LOGGING from the drop-down that appears. 2) Insert an SD or CF memory card in the slot for SD or CF cards (see items 9 and 10 in Fig.2.2). You will be notified that a memory card has been inserted select Yes to change the default measurement path to the memory card. 3) Tap the Main Menu icon and select Explorer from the list of options. Create a job folder for the measurements and set the default measurement job/path as described in Chapter 6. Note: You cannot log data on the internal disk. 4) Tap the Main Menu icon and select Setup from the list of options. Set up the measurement as described for Logging in Chapter 11, steps 4 to 12. 5) Under the Measurement Control parameters: set the Save Project Data at, Continuous Logging and Report Period as required select whether or not you want to save the Full Spectral Statistics for Reports Note: all other measured broadband and spectral parameters are logged automatically per report period.
137 CHAPTER 12 Enhanced Logging (Optional Module) 123 Then you can select: Number of CICs Desired time periods for calibration 6) Under the Logged Spectrum parameters, you can choose to log Full Spectral Statistics per Logging Period or not. Note: Logging the full spectral statistics at a short logging period (e.g., every second) takes up a lot of space on the memory card. 7) Under Triggers you can specify a Timer Trigger for periodically starting a sound recording (e.g., 5 minutes per hour) and you can specify up to four independent Level Triggers to be active at four different times during the day. Each level trigger works as specified in section In addition, you can specify a Hold Off period this means that during this period, new triggers are inhibited. You also have the ability to trigger L Xeq (f1- f2). Note: you can trigger on a specific frequency band by setting f1 = f2. 8) Under L den Periods parameters you can set up the day, evening and night periods and the penalties in accordance with your local legislation. To exit the screen, tap the icon Controlling the Measurement The measurement is controlled in the same way you would control a normal sound level meter measurement, using Start/Pause, Continue, Reset and Save pushbuttons, see Chapter 3 for more details. However, during the measurement, data are automatically saved in projects, one per day. The projects are automatically saved at the time specified in the Save Project Data at parameter in the Setup, Measurement Control menu. The next project is (automatically) started immediately after the first one, without any data loss. Note: When Preset Logging Time has elapsed, or you pause the measurement, then the project will not be saved automatically. This has to be done manually. In the case of power failure, or other failures, the software is rebooted automatically. This means that the measurement data collected up until the time of the reboot is saved in a project and a new measurement is started. The new measurement is started in a new project. The projects are named as specified in the Preferences, Storage Settings. Example: If you select Auto-naming of Projects, and start the measurement on the 13th of November, then your projects for measuring 48 hours (assuming you have started in the middle of the day, and have set Save Project Data at parameter to 00:00:00) will be: (containing data from the middle of the day November 13th until midnight) (containing data for a whole day November 14th)
138 124 Hand-held Analyzers Types 2250 and 2270 User Manual (containing data from midnight to the middle of the day on November 15th) If you didn't select Auto-naming of Projects then you would have the following projects (assuming the Project Name Prefix parameter was set to Project and no projects had been saved before in the directory): Project 001 Project 002 Project 003 If you have set the Charge Injection Calibration parameter to On, then a CIC Calibration is performed at specified times of the day. An Exclude marker is set on the logging profile at the point where the CIC is being performed. The update of the Total parameters and the Periodic Reports is stopped while the CIC is being performed. You can see the results of the CIC calibration under Total parameters, CIC Result 1 to 4. The CIC result can be either Passed, Background noise too high or CIC Ratio deviates from Ref. (The Ref. mentioned here is the reference created by the very first manual CIC, and is the one used as the reference to all subsequent CIC Ratio measurements, see section 4.10.) Note: If a Level Trigger is active when the CIC is due to start, then the CIC will not be done Annotating a Project Measurements can be annotated in the same way as you annotate Logging measurements. See section Recording Sound Sound Recording can be done in the same way as described under Logging measurements. See section Displaying the Results The Enhanced Logging measurement screen includes three tabs at the bottom: Profile, Spectrum and Broadband View as the Logging measurement screen does. You view the data in the same way as in the Logging module. You mark and annotate sound categories and edit markers and annotations in the same way as in the Logging module please see Chapter 11. The Result Selector (first item in the third line of the status field) determines whether results from the Total, Logged, Logged (100 ms) or Report measurement are displayed. If you need to display data from another day of the measurement, then use Explorer to select and open the project from that day The Profile View The Profile view displays a profile of a logged broadband parameter (db versus time). See Fig.12.1.


139 CHAPTER 12 Enhanced Logging (Optional Module) 125 Fig.12.1 Profile View in Enhanced Logging Displaying Noise Indicators The L den and L dn parameters are displayed in the Broadband View when selecting Total in the Result Selector. Then select the Noise Indicators from the L eq parameter group. See Fig Fig.12.2 Noise Indicators Saving and Recalling Results Measurements are saved and can be viewed later, in the same way as described for the Sound Level Meter Project in Chapter 3 and Chapter 6. Note: The viewer only displays the results as one set of data per logging interval (you can browse through all data). To display the data as a Profile and see or hear annotations or even edit the markers or insert new markers and annotations you must Open the saved project instead of Viewing it.
140 126 Hand-held Analyzers Types 2250 and 2270 User Manual
141 127 Chapter 13 Sound Recording (Optional Module) Sound Recording Option BZ-7226 allows you to record sound during measurement. The sound recording can be controlled manually or by using an external trigger signal. The recording can also be triggered when a measured parameter exceeds a preset level (BZ-7224 and BZ-7225 only). The recorded sound can be played back and listened to using the supplied earphones, HT Sound is recorded directly to CF or SD memory cards. The main benefit is that data is documented on-site and is therefore ready for post-processing and reporting back at the office using Utility Software for Hand-held Analyzers BZ-5503 or other post-processing software such as Noise Explorer Type 7815, Evaluator Type 7820, Protector Type 7825 or Microsoft Excel. Check the About Menu to see whether you have the right license to run the Sound Recording module. (The About Menu is accessed from built-in help tap on the shortcut bar, then select About.) See Chapter 9 for instructions on installing the license for the Sound Recording Module Sound Level Meter and Frequency Analysis Software You can use the Sound Recording facility together with the Sound Level Meter Software and the Frequency Analysis Software. You can record the sound for the whole measurement period or you can record sound for controlled parts of the measurement. The recordings are attached to the project as annotations, named Soundrec N, where N is the number of the recording for the project. (section 3.5 and section for a description of how to use annotations.) Note 1: Sound recordings can only be done during measurements. Note 2: Sound recordings can only be done on projects saved on SD or CF cards Setting up the Instrument 1) Select a Sound Level Meter Project Template or a Frequency Analyzer Project Template. (see section for more details on templates.)
142 128 Hand-held Analyzers Types 2250 and 2270 User Manual 2) Insert an SD or CF memory card in the slot for SD or CF cards (see items 9 and 10 in Fig.2.2). 3) Tap the Main Menu icon and select Explorer from the list of options. Navigate to the memory card, create a job folder for the measurements and set the default measurement job/path as described in Chapter 6. Note: You cannot record sound on the internal disk. 4) Tap the Main Menu icon and select Setup from the list of options. Set all the parameters as required for the Sound Level Meter or Frequency Analyzer measurement, see Chapter 3 and Chapter 10 respectively. 5) Under Sound Recording you can specify the Recording Control parameters as follows: Automatic, if you want to start the recording when you start the measurement and stop when you pause the measurement, and to limit the recording to Maximum Duration, if Duration Limit is set to On Manual Event, if you want to start and stop the recording using the Manual Event pushbutton during the measurement and to limit the duration of the recording, if Duration Limit is set to On. In this case the recording will be at least Minimum Duration long, but no longer than the Maximum Duration. Use Pre-recording Time and Post-recording Time to specify how much extra you want to be recorded before and after the event External Event, if you want to start and stop the recording using an external trigger signal, connected to the Trigger Input. See details in Appendix A Image Event (Type 2270 only), if you want to make a short recording together with capturing an image. The recording will be "Pre-recording Time + Post-recording Time + 1" second long. See details in Appendix A Off, if you don t want to record sound 6) Set Recording Quality to High, Medium, Fair or Low in accordance with your needs. Note, however, that high quality requires more disk space than low quality details in Appendix A. 7) Set Recorded Signal to either Input A/B-weighted, Input C-weighted or Input Z-weighted (A/B-weighting is determined by setting the parameter in Setup, Frequency Weightings, Broadband (excl. Peak)). Input C-weighted is suitable for recordings used afterwards to identify the sound source it contains all the audible content of the signal, but reduces the low-frequency noise from wind, etc. 8) Set Automatic Gain Control to On if you don t know the dynamic of the signal beforehand, or the dynamic is very high, then the 120 db dynamic range (from max. input level and down) will be converted to 40 db. Otherwise, set it to Off and specify the Peak Recording Level. 9) Under Input you specify Trigger Input if you want to start the sound recording using an external trigger signal. See details in Appendix A. To exit the screen, tap the icon.
143 CHAPTER 13 Sound Recording (Optional Module) Controlling the Recording The measurement is controlled in the same way you would control a normal sound level meter measurement, using Start/Pause, Continue, Reset and Save pushbuttons, see Chapter 3 for more details. When the measurement signal is being recorded, the recording icon is displayed in the status field. The recording is attached to the project as an annotation. The paperclip icon is then displayed to indicate that the project has been annotated. When Recording Control is set to Automatic, the recording will start when the measurement is started and last for the Maximum Duration or the Elapsed Time, whichever is smallest. If you continue a paused measurement, then a new recording is started. When Recording Control is set to Manual Event, the recording will start the first time you press the Manual Event pushbutton during the measurement, and stop the second time you press it; if you press it a second time before the Minimum Duration has elapsed, then the recording will continue until Minimum Duration has elapsed; if you press it a second time after Maximum Duration has elapsed, then the recording has already been stopped when Maximum Duration elapsed and the pushbutton will initiate a new recording instead. When Recording Control is set to External Event, and Trigger Input is set to Voltage Level, then recording is started when the voltage level is high and stopped when voltage level is low (details in Appendix A). Duration Limit has no effect on this setting. When Recording Control is set to Image Event (Type 2270 only), then you will record 1s plus the Pre- and Post-recording Time If Pre-recording Time has been set, then the recording will start this time before you hit the Manual Event pushbutton. This is possible because the recording is done continuously in an internal buffer, ready to be saved as a wave file. The Pre-recording Time is limited by this buffer size and the Recording Quality details in Appendix A. Note: Very long sound recordings will be split into wave files containing maximum 10 minutes, i.e., a 35 minute sound recording will consist of 4 wave files, three with 10 minutes of sound and one with 5 minutes of sound Playing the Recording Sound recordings are attached to the measurement project as annotations. The paperclip icon is displayed in the status field to indicate this. Tap the paperclip to open the list of annotations. Tap the annotation to play it back details in Chapter 3 and Chapter Logging and Enhanced Logging Software You can use the Sound Recording facility together with the Logging and Enhanced Logging Software. You can record the sound for the whole measurement period or you can record sound for controlled parts of the measurement. The recordings are attached to the profile as sound markers. The sound recordings can be controlled by the Manual Event pushbutton, the
144 130 Hand-held Analyzers Types 2250 and 2270 User Manual Back-erase pushbutton, an external trigger signal, or by the level of the measured signal. You can also control the sound recording using the stylus to mark the interesting part on the profile. Note 1: Sound recordings can only be done during measurements. Note 2: Sound recordings can only be done on projects saved on SD or CF cards Setting up the Instrument 1) Select a Logging, Logging SLM or Enhanced Logging Project Template. (see section for more details on templates.) 2) Insert an SD or CF memory card in the slot for SD or CF cards (see items 9 and 10 in Fig.2.2). 3) Tap the Main Menu icon and select Explorer from the list of options. Navigate to the memory card, create a job folder for the measurements and set the default measurement job/path as described in Chapter 6. Note: You cannot record sound on the internal disk. 4) Tap the Main Menu icon and select Setup from the list of options. Set all the parameters as required for the Logging or Enhanced Logging measurement, see Chapter 11 or 12, resp. 5) Under Sound Recording you can specify the Recording Control parameters as follows: Automatic, if you want to start the recording when you start the measurement and stop when you pause the measurement, and to limit the recording to Maximum Duration, if Duration Limit is set to On Manual Event, if you want to start and stop the recording using the Manual Event pushbutton during the measurement Exclude Event, if you want to start and stop the recording using the Back-erase pushbutton during the measurement External Event, if you want to start and stop the recording using an external trigger signal, connected to the Trigger Input Level Event, if you want to start and stop the recording based on the level trigger settings during the measurement All Events, if you want to start and stop the recording based on any of the events Note: When Recording Control set to any of the events, you can limit the duration of the recording, if Duration Limit is set to On. In this case the recording will be at least Minimum Duration long, but no longer than the Maximum Duration. Use Prerecording Time and Post-recording Time to specify how much extra you want to be recorded before and after the event Image Event (Type 2270 only), if you want to make a short recording together with capturing an image. The recording will be "Pre-recording Time + Post-recording Time + 1" seconds long. See details in Appendix A Off, if you don t want to record sound
145 CHAPTER 13 Sound Recording (Optional Module) 131 6) Set Recording Quality to High, Medium, Fair or Low in accordance with your needs, note, however, that the high quality requires more disk space than low quality details in Appendix A. 7) Set Recorded Signal to either Input A/B-weighted, Input C-weighted or Input Z-weighted (A/B-weighting is determined by setting the parameter in Setup, Frequency Weightings, Broadband (excl. Peak)). Input C-weighted is suitable for recordings used afterwards to identify the sound source it contains all the audible content of the signal, but reduces the low-frequency noise from wind, etc. 8) Set Automatic Gain Control to On if you don t know the dynamic of the signal beforehand, or the dynamic is very high, then the 120 db dynamic range (from max. input level and down) will be converted to 40 db. Otherwise, set it to Off and specify the Peak Recording Level. Under Input you specify Trigger Input if you want to start the recording using an external trigger signal. See details in Appendix A. To exit the screen, tap the icon Controlling the Recording The measurement is controlled in the same way you would control a normal logging measurement, using Start/Pause, Continue, Reset and Save pushbuttons, see Chapter 11 for more details. When the measurement signal is being recorded, then the recording icon is displayed in the status field. The recording is attached to the profile as a Marker 6 (Sound). If you set Recording Control to Automatic, the recording will start when the measurement is started and last for Maximum Duration or Elapsed Time, whichever is smallest. If you continue a paused measurement, then a new recording is started. If you set Recording Control to Manual Event, the recording will start the first time you press the Manual Event pushbutton during the measurement (this starts a Manual Event marker and a Sound marker), and stop the second time you press it; if you press it a second time before Minimum Duration has elapsed, then the recording will continue until Minimum Duration has elapsed; if you press it a second time after Maximum Duration has elapsed, then the recording has already stopped when Maximum Duration elapsed, and the pressing the button will have no effect on the sound recording (the Manual Event marker, however, is stopped). If you set Recording Control to Exclude Event, the recording will start the first time you press the Back-Erase pushbutton during the measurement (this starts an Exclude Event marker and a Sound marker), and stop the second time you press it the behaviour will be similar to control by the Manual Event pushbutton. When Recording Control is set to External Event, and Trigger Input is set to Voltage Level, then recording is started when the voltage level is high and stopped when voltage level is low (details in Appendix A). Duration Limit has no effect on this setting.
146 132 Hand-held Analyzers Types 2250 and 2270 User Manual If you set Recording Control to Level Event, the recording will start, controlled by the level trigger see Chapter 11 for details. When Recording Control is set to Image Event (Type 2270 only), then you will record 1s plus the Pre- and Post-recording Time If you set Recording Control to All Events, the recording will start when any of the events above become active, and stop when all events are inactive again. If Pre-recording Time has been set, then the recording will start this time before the Event appears. This is possible because the recording is done continuously in an internal buffer, ready to be saved as a wave file. The Pre-recording Time is limited by this buffer size and the Recording Quality details in Appendix A. Note: Very long sound recordings will be split into wave files containing maximum 10 minutes, i.e., a 35 minute sound recording will consist of 4 wave files, three with 10 minutes of sound and one with 5 minutes of sound Control Recording using the Stylus If Recording Control is set to any of the events, or to All Events, the recording can also be controlled using the stylus directly on the profile, in the same way as you mark sound categories details in Chapter 11. Fig.13.1 Example Logging display (showing internal buffer marker) The small triangle above the profile indicates the amount of sound you have in the internal buffer ready for storage in a wave-file. You will have sound from this triangle to the righthand side of the profile. The triangle is updated every second. To make a sound recording using the stylus, you tap and hold the stylus on the profile display and drag it to the position where the sound recording should end, then you remove the stylus and get a drop-down menu with the possibility of setting one of the six markers.
 will be stored and the sound marker will only indicate this part.")
147 CHAPTER 13 Sound Recording (Optional Module) 133 If you select Sound, then a sound marker is made and the sound for the marked interval is stored in a wave file. Only the portion of the sound available in the internal buffer (to the right of the small triangle) will be stored and the sound marker will only indicate this part. Note: when selecting an interval for storing (or setting a marker), the profile display freezes, but the sound recording is still updated in the internal buffer. The part of the buffer available on the screen will decrease and you will see the small triangle move to the right. Be sure not to wait too long in selecting the Sound marker from the drop-down menu otherwise the sound recording will disappear from the internal buffer Playing the Recording You play-back the sound simply by selecting part of the marker as described in section and choose Play Sound from the resulting drop-down menu. The following dropdown menu will then appear, see Fig Fig.13.2 Playing the recording the drop-down menu Select one of the four ways of playing a sound: Selection will play the part you have selected; Repeat Selection will play the selected part until you press Cancel on the pop-up menu; To End will play the sound from the position you selected the sound marker to the end; and finally All will play the entire sound recording, regardless of your selection point.


148 134 Hand-held Analyzers Types 2250 and 2270 User Manual Fig.13.3 Playing the recording output level pop-up When you have selected the method of play-back, a pop-up appears explaining how to adjust the output level in the headphone and how to stop the play-back. Tap the Minimize button to reduce this to a small blue bar at the top of the screen allowing you to watch the profile underneath you will notice that the profile cursor is updated every second to the position of the sound that is currently being played. Fig.13.4 Playing the recording minimizing the pop-up The small blue button bar at the top can be maximized again by tapping the can close it and stop playing back by tapping the icon. icon, or you
149 CHAPTER 13 Sound Recording (Optional Module) Sound Recordings on the PC When projects including sound recording have been transferred into an Archive on a PC using Utility Software BZ-5503, then sound recordings on Sound Level Meter projects or Frequency Analysis Projects can be played back directly from BZ Sound recordings on profiles can be played back when the Logging or Enhanced Logging projects have been transferred to Noise Explorer, Evaluator or Protector the sound recording will appear in the profiles as Sound markers. Sound Recordings can be input to the Brüel & Kjær PULSE Analyzer Platform for further analysis please contact your local Brüel & Kjær representative for further information. Note: When recording sound for further analysis in PULSE, be sure to record the Z-weighted signal and select Automatic Gain Control to Off under the Sound Recording parameters and select the Recording Quality to match your needs for frequency content see details on sampling frequency in Appendix A. When Automatic Gain Control is set to Off, then the calibration information is stored in the wave files allowing PULSE to analyse the sound recordings, taking the calibration into account.
150 136 Hand-held Analyzers Types 2250 and 2270 User Manual
151 137 Chapter 14 Reverberation Time Software (Optional Module) 14.1 Introduction Reverberation Time Software BZ-7227 enables you to measure reverberation time in 1/1- octave or 1/3-octave. Check the About Menu to see whether you have the license to run the reverberation time software. (The About Menu is accessed from built-in help tap, on the shortcut bar, then About.) See Chapter 9 for instructions on installing the license for the Sound Recording Module Definition Reverberation Time (RT) is the most important parameter describing the acoustic quality of a room or space. It is important for sound levels, speech intelligibility and the perception of music. In addition, it is used to correct for the effects of RT on building acoustics and sound power measurements. RT is the decay time for sound in a room after the excitation stops. It is the time for a 60 db drop in level, but the decay is usually evaluated over a 10, 20 or 30 db drop, using the measurements within these ranges to make a regression line, which is then extrapolated to the 60 db range, see Fig RT may be labelled EDT, T20 and T30 respectively for those three evaluation ranges. EDT is used in room acoustics only, while T20 and T30 may be used for Building Acoustics, Sound Power and Absorption Coefficient measurements as well. RT is measured in 1/1- or 1/3-octave frequency bands, some of which may be averaged to provide a single-number result for the most significant bands. RT may range from 0.1 seconds (or less) in anechoic chambers, to 10 or more seconds in large public spaces.
152 138 Hand-held Analyzers Types 2250 and 2270 User Manual Fig.14.1 Definition of Reverberation Time (RT). Evaluation range of 30 db for calculation of T30 indicated db Excitation Level Regression Line 0dB 5 db Evaluation Range 35 db Background Noise Level 60dB Time Reverberation Time RT varies between positions in a room, so it is usually measured at several positions. The spatial average (Room average) for all positions gives an overall assessment, and the position results may be used to indicate the acoustic quality as a function of location. The Room average can either be made as an average of the RT spectra, or calculated for the averaged decays (ensemble average), that is: the decays for each frequency band are averaged over all positions and the RT spectrum is then calculated for the averaged decays How Do We Measure Reverberation Time? RT can be measured using either Interrupted Noise, with the built-in noise generator, or by using Impulsive Excitation (Schroeder Method), such as from a pistol or balloon burst. Interrupted Noise Method When using a power amplifier and loudspeaker sound source, see Fig.14.2, Type 2250-F/2270-F/ BZ-7227 will turn its noise generator on and off, then measure and display the RT spectrum and decays.
153 CHAPTER 14 Reverberation Time Software (Optional Module) 139 Fig.14.2 Typical RT measurement setup using a loudspeaker source 4292-L OmniPower Power Amplifier Type 2734-A 2250/2270 AQ-0673 Cable (10m) AO-1442 Interface Cable AO-0523 Cable (10m) 3207 Tapping Machine Fig.14.3 Typical RT measurement cycle for the interrupted noise method db Sound Level Start Time Escape Time Build-up Time About 1s Decay time Decay measurement Generator On Fig.14.3 shows a typical RT measurement cycle automatically performed by the Analyzer, where the different steps are described as follows: 1) After Start, there is a chosen Escape Time which allows for vacating the measurement site. 2) The noise generator is then switched on and waits for the chosen Build-up time to allow for a steady state to be reached. 3) The decay measurement starts. The level for the first second, or so, (labelled About 1s on Fig.14.3) is used to identify the excitation sound level as the 0 db reference level. 4) The noise generator is switched off and the Decay time starts
154 140 Hand-held Analyzers Types 2250 and 2270 User Manual 5) The decay measurement ends when only the background noise level is measured (automatically detected by Type 2250/2270). 6) Steps 2) to 5) are automatically repeated a chosen number of times and the measured decays are averaged together to reduce the uncertainty of the measurement. 7) The reverberation time spectra EDT, T20 and T30 are calculated and displayed on the screen. The measurement can be in octaves or 1/3-octaves in parallel over a selectable frequency range, allowing you to focus sound power on the relevant range. In each frequency band, the decay is sampled 200 times each second, for reverberation times as long as 20 seconds. Impulsive Excitation Method With Impulsive Excitation, all you need to carry is Type 2250-F/2270-F, a tripod and a balloon (or other impulsive source, such as a starting pistol). After you start the analyzer and pop the balloon, the analyzer will start measuring, analyse the decay and display the RT spectrum and decay. The single input range means that trial measurements are not necessary when using the impulsive excitation method. Fig.14.4 Typical RT measurement cycle for the interrupted noise method db Sound Level Trigger Level Start Impulse Excitation Await Level to exceed Trigger Level 1s Decay Time Impulse measurement Time Fig.14.4 shows a typical RT measurement cycle performed by the analyzer, where the different steps are described as follows: 1) After Start, the analyzer waits for the level to exceed the Trigger Level (indicated on the analyzer in 3 places by the Traffic Light giving a short green flash every second). 2) The impulse excitation is made, e.g., a pistol is fired or a balloon is burst. Caution: the use of hearing protection is highly recommended.
155 CHAPTER 14 Reverberation Time Software (Optional Module) 141 3) The impulse measurement is started 1 s before the level exceeds the Trigger Level. 4) The impulse measurement stops after the analyzer detects the background noise level again (automatically measured by the analyzer). 5) The analyzer performs backward integration of the impulse measurement. 6) The reverberation time spectra EDT, T20 and T30 are calculated and displayed on the screen. The measurement can be in octaves or 1/3-octaves in parallel over a selectable frequency range. In each frequency band, the decay is sampled 200 times each second. The impulse response is backward integrated (according to the Schroeder method). In theory, the resulting decay will be equivalent to the average of a large number of decays made with the interrupted noise method. Therefore, the decays will be smooth using just one single shot Setting up the Instrument 1) Select the REVERBERATION TIME Project Template. (see section for more details on templates.) The Project Template is displayed at the top of the screen, if it does not display REVERBERATION TIME, tap the black bar at the top of the screen and select REVERBERATION TIME from the drop-down menu that appears. 2) Tap the Main Menu icon and select Setup from the list of options. Set the Bandwidth and Bottom and Top Frequency of the measurement as required. 3) Set Map Based Measurement = No in the Measurement Control setup the reverberation decays will then be numbered from Pos. 1 to N see how to measure with position management in next section. 4) Set Automatic Save = No, if you want to inspect the reverberation time and decays before manually saving the measurement otherwise select Yes to automatically save the decays after each measurement. 5) The analyzer automatically detects the decay time and stops the measurement at the end of the decay however, under special conditions (for example, when measuring with high background noise) the decay time cannot be detected and the measurement will run up to 20 s. To minimise the measurement time and memory requirement for the measurement, you can limit the measurement by setting the Max Decay Time. 3 s is adequate for most ordinary rooms, but should be increased for larger halls or reverberation rooms. 6) Set Excitation to Impulse if you want to measure using the impulse method (go to step 14) otherwise select Interrupted Noise.
156 142 Hand-held Analyzers Types 2250 and 2270 User Manual Interrupted Noise Method 7) Set the number of decays you want to measure per position the analyzer automatically controls the generator, measurement of the decays and averaging the decays. 8) Set the Generator as required set Generator Type = External if you want to control an external generator (details in Appendix A) otherwise leave it at Internal to use the internal generator. 9) Select Noise Type for the internal generator. Pink noise is typically used. 10) Adjust the level of the internal generator output to match the input of the power amplifier used by setting Level [re. 1 V]. Note: You can manually turn the generator on and off by tapping on the loudspeaker icon in the status field. 11) Set the Escape Time allowing you to leave the room before the generator is turned on during the measurement see Fig ) Set Build-up Time to allow the excitation noise to reach a steady level before the measurement starts. 1 s is adequate in most ordinary rooms, but should be increased for larger halls or reverberation rooms. 13) Select the Sound Source used, to optimise the frequency response of the internal generator output for either a flat power response or optimum power difference between adjacent 1/1- or 1/3-octave bands thereby eliminating the need for an equalizer to smooth the response in most cases. Select a type matching your sound source select Unknown if you are using a non Brüel & Kjær sound source, or don't want to make a correction to the frequency response. Go to step 16) Impulsive Method 14) Set Trigger Level low enough to be sure the impulse will be triggered, but high enough to avoid triggering on the background noise. A level between 80 and 100 db is normally adequate. 15) If you have selected Automatic Save = yes, then Trigger Repeat can be set to yes to automatically start a new measurement when a measurement has been saved. This allows you to go to another position and make a new impulse, without the need for controlling Type 2250/2270 between the measurements. Observe how the Traffic Light indicates the status of the measurement (see Table 5.2 and Fig.14.4) making it easy for you to change position and generate the impulse synchronised with the measurement procedure. Press the Start/Pause pushbutton to stop the measurement when the last measurement has been saved.
157 CHAPTER 14 Reverberation Time Software (Optional Module) Sound Recording 16) Set Recording Control = Automatic if you want to record the sound during the measurement. The recordings can be played back afterwards for identifying the cause of measurements differing from each other or (if Excitation = Impulse) for further analysis of the measured impulse response by post-processing software like DIRAC Room Acoustics Software Type The recordings will contain the signal from when you press the Start pushbutton until the measurement stops. The recording will be attached to the measurement as an annotation. Note: Sound Recording requires a license for the Sound Recording Option BZ To exit the setup screen, tap the icon Controlling the Measurement The measurement is controlled in the same way you would control a normal sound level meter measurement, using Start/Pause, Continue, Reset and Save pushbuttons, see Chapter 3 for more details. Note the following exceptions: Pressing Start initiates a measurement cycle slightly more complex than a standard SLM measurement see Fig.14.3 and Fig.14.4 for details. The results are the same, however, a set of measurement data in this case the reverberation decays at one position Creating a new Reverberation Time Project The measured data is stored at a position and you can have several positions in one project. Therefore, starting a complete new project cannot be done by pressing Reset and then Start (as when measuring using the SLM template), because this will measure the decays at a single position within the Project a new project is initiated by selecting a new project template (or the same again). This will create a new project Annotating Projects and Positions While using the reverberation time software you can annotate the reverberation time project using the normal method of adding annotations to a project. The annotations can then be viewed by tapping on the paperclip icon or tapping the Main Menu icon and selecting Explorer from the list of options. See section 3.5. However, your project can contain a lot of measurements, one per position, so you can annotate any position in the project. Sound recordings are automatically attached as annotations to the positions. Annotations at positions are managed in the Overview display described in the next section.

158 144 Hand-held Analyzers Types 2250 and 2270 User Manual 14.3 Displaying the Results The Reverberation Time measurement screen includes three tabs at the bottom: Overview, Spectrum and Decay. The tabs allow you to choose different ways of displaying the measurement results: Overview: Shows the measurement positions in a table one position per row. Use this to get an overview of your measurements, to include/exclude positions from the spatial average of all positions in the room, and to manage annotations/sound recordings at the positions Spectrum: Shows the reverberation spectra graphically, or as a table, for one position, or for the room average. Alternatively, it can show the instantaneous sound pressure level while measuring Decay: Shows the reverberation decay at a single frequency, for one position, or for the room average Overview The Overview tab shows the measurement positions in a table one position per row. Fig.14.5 Overview tab Status Field The Status Field consists of three lines (see Fig.14.5) the first two lines of information are common to the status lines in the Sound Level Meter and Frequency Analyzer (see Chapter 5, page 32). Note: The first line of the status field might also contain a smiley, indicating the quality of the Room (the spatial average of all positions), see the description of smiley's in the following paragraph and at the end of this chapter.
159 CHAPTER 14 Reverberation Time Software (Optional Module) 145 The third line of information allows you to: Select the measured position. The selected position is the one highlighted in the table. The selected position will be the one displayed when selecting the Spectrum or Decay view Step forwards or backwards through the positions on all displays, using the and icons Get information on the quality of the measurement through a Quality Indicator (Smiley) displayed as an icon: : means results should be used with caution : means results may be suspect or missing No icon means Type 2250/2270 found no measurement quality issues Tap the Smiley to get more detailed information about the quality indication. (See the description of smiley s at the end of this chapter.) Table The header row of the table contains (from left to right): The RT selector (EDT, T20 or T30), which determines which RT to display in the table rows below. It is also linked to the main Spectrum selector and main Decay selector The Frequency selector (which includes decrement and increment buttons), determines the frequency of the readouts in the table rows below. The frequency selector is linked to the Spectrum cursor and the frequency of the selected decay Readout of the RT value for the current measurement, before it is saved to a position Each row of the table contains (from left to right): A checkmark controlling whether the position is included or excluded from the Room average. Tap it to include (check) or exclude (uncheck) the position. All positions are by default included in the Room average The position. Tap it to get a drop-down with two options, Select and View Annotations. Use Select to select the position and View Annotations to view the list of annotations for the position. You can add annotations on the position from this view as described in Chapter 6 Possible annotation indicated by. Tap it to view the list of annotations for the position The readout of the RT parameter at the frequency determined by the RT selector and Frequency selector in the table header row. There might be a smiley to the right of the readout warning about the quality of the readout. Tap the smiley to get more detailed information about the warning
160 146 Hand-held Analyzers Types 2250 and 2270 User Manual Spectrum The Spectrum tab shows the reverberation time spectrum from a position, or the Room average reverberation time, or both. The sound level is displayed during measurements. Fig.14.6 Spectrum tab Status Field The Status field on the Spectrum tab is the same as on the Overview tab. Spectrum Graph The Spectrum Graph is the same as in the Frequency Analysis software: Two 1/1-octave, or 1/3- octave spectra, superimposed with cursor readouts. The displayed frequency range is automatically adjusted for the measured frequency range. Small Smiley s are set below each frequency band with a potential problem. The Smiley s are also available at the cursor readouts. Tap the Smiley at the cursor readout to get detailed information about the warning. The Spectrum Parameter Selectors above the graph selects which spectra to display. You can choose to display: T20@Pos, T30@Pos, EDT@Pos, T20, T30 or EDT. If you only want one graph you can set the other to Off. In addition to choosing which parameter to display, you can choose to Display Sound Level this will display the Z-weighted spectrum LZF together with the A- and C-weighted broadband levels see Fig When displaying LZF you can tap the LZF selector and select Display Reverberation Time to display the reverberation time spectra. When starting a measurement the graph will automatically display the sound level spectrum, when finished it will display the reverberation time spectrum.
 147")
161 CHAPTER 14 Reverberation Time Software (Optional Module) 147 Fig.14.7 Spectrum view when measuring The Main Spectrum Graph on the display (the one with bars) is selected using the parameter selector on the second line of the two shown above the graph (LZF in Fig.14.7). The Smiley s below the spectra (if there are any) belong to the main spectrum. The parameter selector for the main spectrum is linked to the selector on the Overview tab and the parameter selector for the main decay on the Decay tab. The Reference Spectrum on the display (the one displayed as small lines above the bars in Fig.14.6) is selected using the parameter selector on the first line of the two shown above the graph (T30 in Fig.14.6). The parameter selector for the reference spectrum is linked to the parameter selector for the reference decay curve in the Decay view. The cursor is linked to the frequency selectors on the Overview and Decay tabs. Tap the Y-axis to select: Auto Zoom to adjust the range of the Y-axis for best fit of the measured spectrum Zoom In/Zoom Out to adjust the zoom Spectrum Table to display the spectrum in a table, see an example in Fig.14.8
162 148 Hand-held Analyzers Types 2250 and 2270 User Manual Fig.14.8 Spectrum table Decay Auxiliary Parameters Below the graphics are two lines containing parameters for displaying the Wide Band Reverberation Times for the current position, or the Room Average. You are also able to display the L CF and L AF broadband values. The Decay tab shows the reverberation time decay from a position or the Room average or both, see Fig Status Field The Status field on the Decay tab is the same as on the Overview and Spectrum tabs. Decay Graph The Decay Graph shows the decay of one frequency band for the selected position and/or the decay of the same frequency band for the Room Average (requires Ensemble Averaging). The Decay Parameter Selectors above the graph select which decay to display: T20@Pos, T30@Pos or EDT@Pos. Each of these selections show the decay for the measurement at the selected position together with the readout of T20@Pos, T30@Pos and EDT@Pos resp. T20, T30 and EDT show the decay for the Room Average together with the readout of T20, T30 and EDT resp. If you only want one graph you can set the other selector to Off.
. The parameter selector for the main decay is linked to the selector on the Overview tab and the parameter selector for the main spectrum on the Spectrum tab.")
163 CHAPTER 14 Reverberation Time Software (Optional Module) 149 Fig.14.9 Decay view The Main Decay on the display (displayed as a continuous line) is selected using the parameter selector in the second line of the two shown above the display (T30@Pos in Fig.14.9). The parameter selector for the main decay is linked to the selector on the Overview tab and the parameter selector for the main spectrum on the Spectrum tab. The Reference Decay on the display (displayed as a dashed line) is selected using the parameter selector in the first line of the two shown above the display (T20@Pos in Fig.14.9). The parameter selector for the reference decay is linked to the parameter selector for the reference spectrum on the Spectrum tab. The Frequency selector (with decrement and increment buttons as well), determines the frequency of the decay curves. The frequency selector is linked to the spectrum cursor and the frequency selector on the Overview tab. In the upper right corner of the view area, the value of a single quality indicator is displayed: C: xx%. The Curvature indicator if above 10%, then the quality indicator %, meaning Decay is bent, is set For more details of the quality indicators, see section Tap the Y-axis to select: Auto Zoom to adjust the range of the Y-axis for best fit of the measured spectrum Zoom In/Zoom Out to adjust the zoom Auto Scale to select the best scaling for viewing the spectra without adjusting the zoom Scale Up/Scale Down to adjust the full scale value on the Y-axis Show/Hide Regression Line to show/hide the regression line and the evaluation range for the main decay, together with the two quality indicators C and

164 150 Hand-held Analyzers Types 2250 and 2270 User Manual 14.4 Measurements with Graphical Position Management Type 2250/2270 can keep track of the source and receiver positions in a graphical way together with the measurements. To do this, make the following settings in the Setup: 1) Set Map Based Measurement = Yes in the Measurement Control setup the reverberation decays will then be placed graphically on the map shown on the Overview tab, and numbered as source-receiver relations (for example, S1R2 means the decay measurement with noise from Source 1 and measured at Receiver position 2). 2) Set Meas. All Pos. for Each Source = Yes for measuring all combinations of source and receiver positions. Set to No, if you want to measure at a specific number of receiver positions per source. 3) Set No. of Positions per Source to the number of receiver positions you want to measure per source. 4) Set Increment to Sources First, Receivers First or Manual. Typically Sources First is best for Impulsive excitation (you can then walk between the source positions and generate the impulses while Type 2250/2270 is placed on a tripod at one receiver position); Receivers First is best for Interrupted Noise excitation (you can move Type 2250/2270 between the receiver positions, while the sound source remains in the same place). The Overview tab will then look like Fig.14.10: Fig Overview tab showing one source and one receiver position Note the Add Source and Add Receiver icons on the headline for the map. Tap to add new sources, and tap to add new receivers on the map.
 151 Fig.14.")

165 CHAPTER 14 Reverberation Time Software (Optional Module) 151 Fig Overview tab showing two sources and three receiver positions You can move the sources or receivers on the map by tapping on the source/receiver (see Fig.14.12), select Move from the drop-down menu that appears, then tap at the position where you want the source/receiver (see Fig.14.13). Fig Tap a source to get a drop-down with options

166 152 Hand-held Analyzers Types 2250 and 2270 User Manual Fig Sources and receivers moved to places on the map in accordance with their physical position in a room The dark-green fields on the map indicate the selected Source-Receiver relation. The next measurement will be saved at this position. Results from the measurements at the receiver positions are displayed in the boxes at the receiver positions determined by the parameter and frequency selector in the headline of the map. Fig Example display showing a measurement in progress The example in Fig shows the state when four measurements have been made and saved and the position at S1R3 is selected, ready for the next measurement. Note the small smileys at some of the receiver positions you can tap them and get more detailed information. You can attach text or commentaries at source or receiver positions by selecting View Annotations (see Fig.14.12) and add new annotations as described in Chapter 6. Note the two small paperclips at S1 and R2 they indicate annotations at these positions.


167 CHAPTER 14 Reverberation Time Software (Optional Module) 153 Tap Map just above the Add Source and Add Receiver icons, and select Table to display the measurements in a table (see Fig.14.15). The table contains the same information as the table described in the previous section when measuring without position management (Fig.14.5). Fig Map-based measurements displayed in a table Note: You can move the data from one position to another: Tap a position you want to move and select Cut from the drop-down, then tap the position where you want to paste it and select Paste. This can be done on the map as well as in the table. If you want to measure at a specific number of receiver positions per source, then the map for one receiver position per source, for example, will look like Fig Fig Map-based measurement showing one receiver per source Note: there is only an Add Source icon automatically when adding a source. because the specified number of receivers is added
168 154 Hand-held Analyzers Types 2250 and 2270 User Manual The Spectrum and Decay views function in the same way as when measuring without position managing. The only difference is the indication of the position in the status field this is now a Source-Receiver selector instead of a position number selector Quality Indicators There are Quality Indicators for each frequency band in each reverberation time spectrum and for each reverberation time spectrum. (These include letters, symbols or smileys, see Table 14.1 for an overview). One of the quality indicators are recommended in ISO Annex B, as a measure of how good the slope of the decay can be approximated to a straight line: C: xx%. The Curvature indicator if above 10%, then the quality indicator %, meaning Decay is bent, is set Table 14.1 Overview of Quality Indicators and Smileys Quality Indicator N Smiley Explanation Description No decay end found The end of the decay cannot be determined because it doesn t end in the background noise Background noise too high Background noise is above the upper y evaluation point t No decay start found No decay start found Y T Background noise too high Max. Decay Time too short Background noise is above the lower evaluation point The lower evaluation point is beyond the decay time No decay found The slope of the decay is positive, i.e., the Z reverberation time is negative P Reverberation time too short Less than 2 points in Evaluation Range O Excitation sound level too high Overload Reverberation time too short B T below 16 (B = filter bandwidth and T = F reverberation time of detector) required by ISO 3382 R T20 used (T30 unavailable) T20 used (T30 unavailable) High background noise Background noise too close to level at lower n evaluation point p Short reverberation time Less than 4 points in Evaluation Range % k Decay is bent Decay is non-linear The difference between T20 and T30 is greater than 10%. (Recommended quality indicator from ISO Annex B) Correlation coefficient in linear regression is too low
169 CHAPTER 14 Reverberation Time Software (Optional Module) 155 The Quality Indicators (first column) are shown in the spectrum table only. The Smileys are shown on: all readouts of reverberation time results on the position selector as the sum of all quality indicators from each frequency band on the Room (Project) as the sum of all quality indicators from each frequency band in the Room reverberation time spectrum The explanation is shown if you tap a smiley (except on the small smileys below the frequency bands in the spectrum select the frequency band with the cursor and tap the smiley in the cursor readout) Saving and Recalling Results Measurements are saved at position numbers (for example, Pos. 1) or Source-Receiver relations (for example, S1R1) within the Project. This means there are more measurements stored in the Reverberation Time Projects than the Sound Level Meter, Frequency Analyzer or Logging Projects, which all contain only one measurement within each project. The saved project can be opened using Open in Explorer, then you can view all the measured data, and even continue measuring at new positions. If you view the data using View in Explorer, then you can only view the Room Average of the project.
170 156 Hand-held Analyzers Types 2250 and 2270 User Manual
171 157 Chapter 15 Tone Assessment Option BZ /3-octave Method 15.1 General Tone Assessment Option BZ-7231 includes tone assessment according to selected methods. The software module includes an FFT based as well as a 1/3-octave based method. It allows assessment of tones on-site. The result of the tone assessment is the adjustment to be added to the L Aeq as described in the relevant standards for calculating rating level. BZ-7231, when used with BZ-7223 Frequency Analysis, BZ-7224 Logging and BZ-7225 Enhanced logging, allows you to: Assess tones in a measured 1/3-octave spectrum according to ISO 1996:2007, Annex D Assess tones in a measured 1/3-octave spectrum according to Italian Law, Ministero dell'ambiente, Decreto 16 marzo 1998, hereafter referred to as Italian Law BZ-7231, when used with BZ-7230 FFT Analysis Software, allows you to: Assess tones in a measured FFT spectrum according to ISO 1996:2007, Annex C Use the Generate tone at cursor feature to generate a pure tone on the headphone output of the Hand-held Analyzer, for comparison to the actual noise This section will focus on tone assessment based on the 1/3-octave method. Please refer to User Manual BE 1778: FFT Analysis Software BZ-7230 and Tone Assessment Option BZ-7231, for use with Hand-held Analyzers Types 2270 and 2250 for detailed information about tone assessment based on FFT spectra. Tone Assessment Option BZ-7231 brings results to the user on-site as well as preparing for post-processing and reporting back at the office. Documentation can be completed using Utility Software for Hand-held Analyzers BZ-5503, or the measured data can be exported for postprocessing by Evaluator Type 7820 or other post-processing software such as Microsoft Excel.
172 158 Hand-held Analyzers Types 2250 and 2270 User Manual Check the About Menu to see whether you have the right license to run the Tone Assessment Option. (The About Menu is accessed from built-in help tap the Help icon on the shortcut bar, then select About.) If you have purchased Type 2250/2270 together with the software application(s), then the relevant license(s) comes pre-installed on the instrument. If you purchased a separate software application for your Type 2250/2270, then you have to install the license on the instrument. This is done using Utility Software for Hand-held Analyzers, BZ-5503, please consult the on-line help included with the BZ-5503 software for instructions on how to install a license Tone Assessment According to ISO , Annex D When assessing noise, it is generally recognised that noise containing audible pure tones is more annoying than noise with the same A-weighted broadband level that does not contain audible tones. When assessing noise that contains tones or narrow bands of noise, an adjustment shall be added to the A-weighted time averaged level, L Aeq. The first evaluation of audible tones in noise is most often carried out by the human ear. But for comparative analysis results, and documentation, an objective analysis may be needed. Tone Assessment can be performed using the ISO :2007 standard Determination of environmental noise levels, Annex D: Objective method for assessing the audibility of tones in noise Simplified method. This method uses 1/3-octave measurements. The selection of method depends on local legislation which may refer to ISO or a local method. Find more information about rating level and assessment of environmental noise in ISO and in Brüel & Kjær s Environmental Booklet ISO , Annex D Tone Assessment Calculations The ISO method searches a measured, time averaged (L eq ) spectrum, for level differences between adjacent 1/3-octave bands. If the level difference between a 1/3-octave band and the band either side of it are higher than a certain limit, an adjustment for audible tones may be added to the L Aeq level when calculating the rating level, L r. In ISO , Annex D, the spectrum is divided into three frequency ranges: Low, Middle and High. In each frequency range a specific limit for the level differences leading to an adjustment is defined, see Fig.15.1.
173 CHAPTER 15 Tone Assessment Option BZ /3-octave Method 159 Fig.15.1 Definition of frequency ranges and level differences db 16 Low Level differences can be defined in Low, Middle and High frequency range: Proposed level difference limits for adjacent bands [db] 8 6 Middle High Hz khz 1/3 - octave bands [Hz] The proposed frequency ranges and level differences between adjacent bands are: Low frequency range: includes the 1/3-octave bands from 25 Hz to 125 Hz with a level difference for a detected tone greater than 15 db Middle frequency range: includes the 1/3-octave bands from 160 Hz to 400 Hz with a level difference for a detected tone greater than 8 db High frequency range: includes the 1/3-octave bands from 500 Hz to 10 khz with a level difference for a detected tone greater than 5 db With BZ-7231 software, frequency ranges and the limit for the level differences in low, middle and high range can be set by the user. Tone assessment is carried out for all the measured frequency bands (including those below 25 Hz and above 10 khz). The level difference limit is extrapolated from the low and high range to cover the complete measurement range. If tones are detected outside the range from 25 Hz to 10 khz the quality indicator (yellow smiley) indicates Tone out of ISO range detected. ISO , Annex D does not specify the size of the adjustment. In the default setting of the BZ-7231, Brüel & Kjær has chosen to set the value to 5 db. Calculating the Level Difference Between one Band and the Adjacent Bands BZ-7231 software calculates the level difference between a 1/3-octave band and two adjacent 1/3-octave bands with lower levels. The difference is calculated between the band in the middle and the highest of the adjacent bands.
, in case of doubt.")
174 160 Hand-held Analyzers Types 2250 and 2270 User Manual 15.3 Tone Assessment according to Italian Law Tone Assessment in Italy is performed on normal 1/3-octave spectra but with an option to use narrow bands (such as FFT), in case of doubt. The method described in the Italian Decreto 16 marzo 1998 states that the 1/3-octave L ZFmin spectrum is used for evaluation of tones in noise. The analysis must be performed in the frequency range from 20 Hz to 20 khz and a tone is present if the level of a band is more than 5 db higher than the levels in the adjacent bands. The adjustment K t, which should be added to the measured L Aeq, will only be applied if the band with the tone touches or exceeds a loudness level contour touched by another frequency value of the spectrum. (Examples of loudness level contours from Evaluator Type 7820/7821 are shown in Fig.15.2.) The size of the adjustment K t is defined as 3 db. Fig.15.2 Example display from Evaluator Type 7820/7821 showing an L LFmin spectrum and loudness level contours An equal loudness curve is a frequency response curve. Equal loudness curves are the experimental results of presenting pure tones and levels at different frequencies to young people with no hearing impairment. Along a contour line the young, average, normal listener will judge tones presented with different combinations of frequency and db to be equally loud. Equal loudness level curves are defined by ISO 226 Acoustics Normal equal-loudness-level contours. The Italian Decreto 16 marzo 1998 " refers to ISO 226 (1987), but the ISO 226 standard has been thoroughly revised in the latest version from Your Type 2250/2270, with BZ-7231 software installed, uses by default the free-field curves from the 1987 version. But the diffuse-field contours from the ISO 226(1987), as well as the free-field curves from ISO 226(2003) have been implemented and may be selected Setting up the Instrument Selecting the Tone Assessment Option Tap the Main Menu icon and select Setup from the list of options. Under the Tone Assessment parameters (on the full list of options) tap the Tone Assessment option and set it to On, see Fig.15.3.

, then you have accepted the default setup for that standard, and the only parameter you can change is the ISO 226 parameter.")
175 CHAPTER 15 Tone Assessment Option BZ /3-octave Method 161 Fig.15.3 Setting Tone Assessment option on From the Setup menu, select either the ISO 1996: or the Italian Law DM method: Fig.15.4 Setting the Tone Assessment method If you select the tone assessment method according to the ISO , Annex D standard, you can accept the default setup according to that standard. You can then change the various tone parameters according to your needs (apart from the ISO 226 parameter which is greyed-out) and proceed directly to the measurement. If you select the tone assessment method according to Italian Law (i.e., you select DM ), then you have accepted the default setup for that standard, and the only parameter you can change is the ISO 226 parameter. Select one of the diffuse- or free-field contour options available from the parameter drop-down (which appears when you tap the parameter). For more details and for information on how to set up individual tone assessment parameters, see the following section.

 Fig.15.5 Left: Setting the Low Freq.")
176 162 Hand-held Analyzers Types 2250 and 2270 User Manual Setting up a Measurement Manually ISO , Annex D When tone assessment according to ISO , Annex D is selected, you can set the division between the Low and Middle frequency range, the division between the Middle and High frequency range, and also the limits for the level differences between adjacent bands see Fig (You can also refer to Fig.15.1 for a definition of the frequency ranges and level differences.) Fig.15.5 Left: Setting the Low Freq. Last Band parameter Right: Setting the Level Difference Low parameter You set the division between the Low/Middle frequency range by selecting the required value for the last (or highest) band in the Low frequency range (from 12.5 Hz to 315 Hz), and set the division between the Middle/High frequency range by selecting the required value for the last (or highest) band in the Middle frequency range (from 160 Hz to 20 khz). The ISO method does not state which frequency weighting should be used, so in the default setup, A-weighing is selected. However, this is not described in the ISO method, so no warnings will be generated if you select other frequency weightings. Italian Law When tone assessment according to Italian Law is selected, the analyzed spectrum must be the Z-weighted minimum level measured in each 1/3-octave band, L ZFmin. The L ZFmin parameter is automatically selected on the measurement page when you select DM The test for loudness contours is set by default to the 1987 Free-field option of the ISO 226 contour parameters. You can also select the 1987 Diffuse-field and 2003 Free-field options from the ISO 226 contour parameters, if required. See Fig.15.6.


177 CHAPTER 15 Tone Assessment Option BZ /3-octave Method 163 Fig.15.6 Setting the loudness contour options Setting up the Measurement using the Default Setup Select the Tone parameter above the spectrum and start the measurement by pressing the Start/ Pause pushbutton. If the selected setup parameters do not comply with the selected tone assessment method, the following pop-up window will be displayed: Fig.15.7 Pop-up window for tone measurement setup check The pop-up window can be de-activated for the rest of the measurement session. To activate it again, you will have to reload the template or restart your instrument. This automatic check is deactivated when the Tone Assessment parameter is set to Off in the Setup menu. To reset all the relevant parameters to the default setup, tap the OK button. (The default setup includes preset parameters that comply with the selected standard. These are described in Table 15.1.) To measure with the settings you set up manually, tap the Cancel button.
178 164 Hand-held Analyzers Types 2250 and 2270 User Manual Table 15.1 Default parameters used by the automatic measurement setup check Setup Parameter Default Value Selected standard: ISO , Annex D Adjustment 3 db Last band in low frequency range Last band in middle frequency range Level difference low Level difference middle Level difference high 125 Hz 400 Hz 15 db 8 db 5 db Selected standard: Italian Law (DM ) ISO Free-field Note 1: Even if you have set the Tone Assessment parameter to On (Setup menu), the calculation is not carried out until the Tone parameter is selected above the spectrum. Note 2: You may find the Template Explorer (accessed from the Main Menu save your own measurement setup. ) useful to Sound Recording If a valid license for the Sound Recording Option BZ-7226 is present, it is possible to record the sound while measuring. (Refer to Chapter 13 for information about the Sound Recording Option.) Note: When Type 2250/2270 recordings are to be used for re-analysis on a PC, be sure to select Automatic Gain Control parameter to Off, under the Sound Recording parameters, and select the Recording Quality parameter to High Measuring Result Display Tone assessment is not performed until the Tone parameter is selected above the spectrum. (This is done by tapping one of the parameter fields in the two lines above the spectrum display and choosing Tone from the drop-down menu.) Once selected, tone assessment is carried out on the selected spectrum. The results are updated during the measurement.
 in the tone parameter panel above the spectrum, see Fig.15.9.")

179 CHAPTER 15 Tone Assessment Option BZ /3-octave Method 165 Fig.15.8 Selecting the Tone parameter above the spectrum display On the results display, a blue marker is set at the top of each detected band with a tone. Differences to the left and right of the frequency band selected by the main cursor are shown (on the left and right) in the tone parameter panel above the spectrum, see Fig The main cursor is moved using either the hard keys or the stylus. Fig.15.9 The differences to the left and right of the selected frequency band are shown in the tone parameter panel in this example, there is a 11.4 db difference to the left and a 3.9 db difference to the right The information shown in value panel can be changed by tapping in the field. From the tone parameters, the adjustment and the selected tone standard can be selected. See Fig Results from the tone assessment can also be found by tapping on the Broadband tab and browsing the Broadband view in a similar way.

180 166 Hand-held Analyzers Types 2250 and 2270 User Manual Fig Changing the information shown in the value panel 15.6 Logging Software BZ-7224 Template The results from the tone assessment can be found in the spectrum view of the logging template. Tone assessment is performed for each logging period, as well as for the total measurement time, see Fig Fig Viewing results on the logging template Please find more information about setting up a logging measurement in Chapter 11.

 When Tone is selected on the tone parameter panel, the list of status codes is updated.")
181 CHAPTER 15 Tone Assessment Option BZ /3-octave Method Enhanced Logging Software BZ-7225 Template The tone parameter can be shown, for both the logging and the report periods, in the spectrum view of the enhanced logging template, see Fig Fig Viewing results on the enhanced logging template Please find more information about setting up the enhanced logging in Chapter Status Codes (Smiley s) When Tone is selected on the tone parameter panel, the list of status codes is updated. Tap a smiley to get an explanation of the status code, and for a tip on how to remedy or improve the settings on the instrument, see an example in Fig Fig Example of a status code explanation
182 168 Hand-held Analyzers Types 2250 and 2270 User Manual If you have selected 1/1-octave, an accelerometer as transducer, or a Direct input, tone assessment will be performed, but a smiley will be displayed. When you tap the smiley it will advise you to use a microphone. For an overview of all the remedies associated to the various smileys, please refer to Table 15.2 Table 15.2 Overview of Smiley Indicators and associated remedies Smiley Colour Explanation Remedy Tip for Solution Red No tone assessment on 1/1 octaves There is no method for assessing tones when the spectrum is analysed in 1/1-octave bands, select 1/3-octave instead Red Analysis on Accelerometer The analysis is carried out on an accelerometer input, select a microphone Red Spectrum must be L ZFmin When Italian Law is selected the analysed spectrum must be L ZFmin Red No tone assessment on inst. parameters It is not possible to make tone assessments on instantaneous parameters ( Fast or Slow ) Yellow Analysis on Direct The analysis is carried out on a Direct input, select a microphone Yellow Setup different from ISO standard The ISO is selected and the measurement setup deviates from the proposals in the ISO standard Yellow Min or Max spectrum When the ISO standard is selected the analyzed spectrum should be L eq Yellow Yellow Tone freq outside proposed ISO range Tone freq out of proposed DM range In the ISO standard the defined frequency range for tone assessment is from 25 Hz to 10 khz. A tone is detected outside this frequency range In the standard according to Italian Law the tone assessment must be performed in the range from 20 Hz to 20 khz. A tone is detected outside this frequency range Note: The ISO method does not specify the weighting filter to be used. The A-weighting filter is selected by default, but all selectable broadband filters may be applied without warnings Recalling Saved Measurements Saved measurements using the FREQUENCY ANALYZER, LOGGING and ENHANCED LOGGING templates can be opened and the Tone Assessment can be applied. Please refer to section 3.4 and section 6.3 for information on how to save and recall measurements, respectively.
183 169 Chapter 16 Specifications This chapter comprises the specifications that are needed for evaluation of instrument performance characteristics and proper use of the instrument. Some of the applicable sound level meter standards require additional technical documentation, in particular for pattern evaluation (type approval) purposes, but have no bearing on normal use. The additional technical documentation is given in a separate Brüel & Kjær instruction manual (BE-1712).
184 170 Hand-held Analyzers Types 2250 and 2270 User Manual Type 2250/2270 Platform Specifications apply to Type 2250/2270 fitted with Microphone Type 4189 and Microphone Preamplifier ZC-0032 SUPPLIED MICROPHONE Type 4189: Prepolarized Free-field ½ Microphone or Type 4190: Free-field ½ Microphone Nominal Open-circuit Sensitivity: 50 mv/pa (corresponding to 26 db re 1 V/Pa) ± 1.5 db Capacitance: 14 pf (at 250 Hz) MICROPHONE PREAMPLIFIER ZC-0032 Nominal Preamplifier Attenuation: 0.25 db Connector: 10-pin LEMO Extension Cables: Up to 100 m in length between the microphone preamplifier and Type 2250/2270, without degradation of the specifications Accessory Detection: Windscreen UA-1650 can be automatically detected when fitted over ZC-0032 MICROPHONE POLARIZATION VOLTAGE Selectable between 0 V and 200 V SELF-GENERATED NOISE LEVEL Typical values at 23 C for nominal microphone opencircuit sensitivity: Weighting Microphone Electrical Total A 14.6 db 12.4 db 16.6 db B 13.4 db 11.5 db 15.6 db C 13.5 db 12.9 db 16.2 db Z 5 Hz 20 khz 15.3 db 18.3 db 20.1 db Z 3 Hz 20 khz 15.3 db 25.5 db 25.9 db KEYBOARD Pushbuttons: 11 keys with backlight, optimised for measurement control and screen navigation ON-OFF BUTTON Function: Press 1 s to turn on; press 1 s to enter standby; press for more than 5 s to switch off STATUS INDICATORS LEDs: Red, amber and green DISPLAY Type: Transflective back-lit colour touch screen dot matrix Colour Schemes: Five different optimised for different usage scenarios (day, night, etc.) Backlight: Adjustable level and on-time USER INTERFACE Measurement Control: Using pushbuttons on keyboard Setup and Display of Results: Using stylus on touch screen or pushbuttons on keyboard Lock: Keyboard and touch screen can be locked and unlocked USB INTERFACE USB 1.1 OTG Mini B socket MODEM INTERFACE Hayes compatible GSM or standard analogue modems connected through the Compact Flash slot. Connection to Internet through GPRS/EDGE/HSPA modem connected through the Compact Flash slot. Supports DynDNS for automatic update of IP address of hostname COMPACT FLASH SOCKET For connecting CF memory card, CF modem, CF LAN Interface or CF WLAN Interface LAN INTERFACE SOCKET (TYPE 2270 ONLY) Connector: RJ45 Speed: 10 Mbps Protocol: TCP/IP INPUT SOCKET (2 - TYPE 2270 ONLY) Connector: Triaxial LEMO Input Impedance: 1M Direct Input: Max. input voltage: ± V peak CCLD Input: Max. input voltage: ± 7.07 V peak CCLD Current/voltage: 4mA/25V TRIGGER SOCKET Connector: Triaxial LEMO Max. Input Voltage: ±20V peak Input Impedance: > 47 k Precision: ± 0.1 V OUTPUT SOCKET Connector: Triaxial LEMO Max. Peak Output Level: ± 4.46 V Output Impedance: 50 HEADPHONE SOCKET Connector: 3.5 mm Minijack stereo socket Max. Peak Output Level: ± 1.4 V Output Impedance: 32 in each channel MICROPHONE FOR COMMENTARY Microphone, which utilises Automatic Gain Control (AGC), is incorporated in underside of instrument. Used to create voice annotations for attaching to measurements
185 CHAPTER 16 Specifications 171 CAMERA (TYPE 2270 ONLY) Camera with fixed focus and automatic exposure is incorporated in underside of instrument. Used to create image annotations for attaching to measurements Image Size: 640 x 480 pixels Viewfinder size: 212 x 160 pixels Format: jpg with exif information EXTERNAL DC POWER SUPPLY REQUIREMENTS Used to charge the battery pack in the instrument Voltage: 8 24 V DC, ripple voltage < 20 mv Current Requirement: min. 1.5 A Power Consumption: < 2.5 W, without battery charging, < 10 W when charging Cable Connector: LEMO Type FFA.00, positive at centre pin EXTERNAL AC MAIN SUPPLY ADAPTOR Part No.: ZG-0426 Supply Voltage: / VAC; Hz Connector: 2-pin IEC 320 BATTERY PACK Part No.: QB-0061 Rechargeable Li-Ion battery Voltage: 3.7 V Capacity: 4800 mah nominal Typical Operating Time: > 8 hours Battery Cycle Life: > 500 complete charge/discharge cycles Battery Indicator: Remaining battery capacity and expected working time may be read out in % and in time Battery Fuel Gauge: The battery is equipped with a built-in fuel gauge, which continuously measures and stores the actual battery capacity in the battery unit Charge Time: In instrument, typically 10 hours from empty at ambient temperatures below 30 C. To protect the battery, charging will be terminated completely at ambient temperatures above 40 C. At 30 to 40 C charging time will be prolonged. With external charger ZG-0444 (optional accessory), typically 5 hours Note: It is not recommended to charge the battery at temperatures below 0 C (32 F) or over 50 C (122 F). Doing this will reduce battery lifetime CLOCK Back-up battery powered clock. Drift < 0.45 s per 24 hour period WARM-UP TIME From Power Off: < 2 minutes From Standby: < 10 seconds for prepolarized microphones TEMPERATURE IEC & IEC : Environmental Testing. Cold and Dry Heat. Operating Temperature: 10 to + 50 C (14 to 122 F), <0.1dB Storage Temperature: 25 to +70 C ( 13 to +158 F) HUMIDITY IEC : Damp Heat: 90% RH (non-condensing at 40 C (104 F)). Effect of Humidity: < 0.1 db for 0% < RH < 90% (at 40 C (104 F) and 1 khz) MECHANICAL Environmental Protection: IP44 Non-operating: IEC : Vibration: 0.3 mm, 20 m/s 2, Hz IEC : Shock: 1000 m/s 2 IEC : Bump: 4000 bumps at 400 m/s 2 WEIGHT AND DIMENSIONS 650 g (23 oz.) including rechargeable battery mm ( ) including preamplifier and microphone USERS Multi-user concept with login. Users can have their own settings with jobs and projects totally independent of other users PREFERENCES Date, Time and Number formats can be specified per user LANGUAGE User Interface in Catalan, Chinese (People s Republic of China), Chinese (Taiwan), Croatian, Czech, Danish, English, Flemish, French, German, Hungarian, Japanese, Italian, Korean, Polish, Portuguese, Romanian, Serbian, Slovenian, Spanish, Swedish and Turkish HELP Concise context-sensitive help in Chinese (People s Republic of China), English, French, German, Italian, Japanese, Korean, Polish, Portuguese, Romanian, Serbian, Slovenian and Spanish UPDATE OF SOFTWARE Update to any version using BZ-5503 through USB or update to SW21 latest version through Internet WEB PAGE Connect to the instrument using an Internet Browser supporting Java scripts. The connection is password protected Two levels of protection: Guest level: for viewing only Administrator level: for viewing and full control of the instrument
186 172 Hand-held Analyzers Types 2250 and 2270 User Manual Software Specifications Sound Level Meter Software BZ-7222 Conforms with the following National and International Standards: IEC ( ) Class 1 IEC (1979) plus Amendment 1 ( ) and Amendment 2 ( ), Type 1 IEC ( ), Type 1 DIN ( ) ANSI S plus ANSI S1.4A 1985 Amendment, Type 1 ANSI S , Type 1 Note: The International IEC Standards are adopted as European standards by CENELEC. When this happens, the letters IEC are replaced with EN and the number is retained. Type 2250/2270 also conforms to these EN Standards CHANNELS (Type 2270 only) All measurements are made from either Ch.1 or Ch.2 TRANSDUCERS Transducers are described in a transducer database with information on Serial Number, Nominal Sensitivity, Polarization Voltage, Free-field Type, CCLD required, Capacitance and additional information. The analogue hardware is set up automatically in accordance with the selected transducer CORRECTION FILTERS For microphone Types 4189, 4190, 4191, 4193, 4950, 4952 and 4184-A, BZ-7222 is able to correct the frequency response to compensate for sound field and accessories: Sound Field: Free-field or Diffuse-field (for Types 4952 and 4184-A only: 0 (Top) reference direction and 90 (Side) reference direction) Accessories (Types 4189 and 4190 only): None, Windscreen UA-1650 or Outdoor Microphone Kit UA Accessories (Types 4191 and 4193 only): None or Windscreen UA-1650 Accessories (Type 4950 only): None or Windscreen UA-0237 For Accelerometer Types 4397-A, 4513, , , 4514, , , 8341, 8324 and 6233C-10 the lower frequency limit will be optimized to match the specifications for the accelerometer DETECTORS Parallel Detectors on every measurement: A- or B-weighted (switchable) broadband detector channel with three exponential time weightings (Fast, Slow, Impulse), one linearly averaging detector and one peak detector C- or Z-weighted (switchable) as for A- or B-weighted Overload Detector: Monitors the overload outputs of all the frequency weighted channels MEASUREMENTS X = frequency weightings A or B Y = frequency weightings C or Z V = frequency weightings A, B, C or Z U = time weightings F or S Q = exchange rate 4, 5 or 6 db N = number between 0.1 and 99.9 For Storage Full statistics For Display and Storage Start Time Stop Time Overload % Elapsed Time L Xeq L Yeq L XE L YE L Ceq -L Aeqk L XSmax L XFmax L XImax L YSmax L YFmax L YImax L XSmin L XFmin L XImin L YSmin L YFmin L YImin L XIeq L YIeq L AIeq -L Aeq L AFTeq L AFTeq -L Aeq Time Remaining L ep,d L ep,dv E Dose Proj. Dose L vpeak #VPeaks (>NNNdB) #VPeaks (>137dB) #VPeaks (>135dB) T Vpeak L avuq TWA TWAv DoseUQ Proj. DoseUQ Only for Display as Numbers or Quasi-analogue Bars L XS L XF L XI L YS L YF L YI L XS(SPL) L XF(SPL) L XI(SPL) L YS(SPL) L YF(SPL) L YI(SPL) L XN1 or L XUN1 L XN2 or L XUN2 L XN3 or L XUN3 L XN4 or L XUN4 L XN5 or L XUN5 L XN6 or L XUN6 L XN7 or L XUN7 L Vpeak,1s Trig. Input Voltage Std.Dev. MEASURING RANGES When using Microphone Type 4189: Dynamic Range: From typical noise floor to max. level for a 1 khz pure tone signal, A-weighted: 16.6 to 140 db Primary Indicator Range: In accordance with IEC 60651, A-weighted: 23.5 db to db Linearity Range: In accordance with IEC 60804, A-weighted: 21.4 db to db
187 CHAPTER 16 Specifications 173 Linear Operating Range: In accordance with IEC 61672, A-weighted: 1 khz: 24.8 db to db Peak C Range: In accordance with IEC 61672, 1 khz: 42.3 db to db SAMPLING FOR STATISTICS The Statistics can be based on either L XF, L XS or L Xeq : Statistics L XFN1-7 or L XSN1-7 are based on sampling L XF or L XS, resp., every 10 ms into 0.2 db wide classes over 130 db Statistics L XN1-7 are based on sampling L Xeq every second into 0.2 db wide classes over 130 db Full distribution saved with measurement The Std.Dev. (Standard Deviation) parameter is calculated from the statistics MEASUREMENT DISPLAYS SLM: Measurement data displayed as numbers of various sizes and one quasi-analogue bar Measured data are displayed as db values, housekeeping data as numbers in relevant format. Instantaneous measurement L XF is displayed as a quasi-analogue bar MEASUREMENT CONTROL Manual: Manually controlled single measurement Automatic: Pre-set measurement time from 1 s to 24 hours in 1 s steps Manual Controls: Reset, Start, Pause, Back-erase, Continue and Store the measurement manually Auto-start: A total of 10 timers allow set up of measurement start times up to a month in advance. Each timer can be repeated. Measurements are automatically stored when completed BACK-ERASE The last 5 s of data can be erased without resetting the measurement MEASUREMENT STATUS On Screen: Information such as overload and running/ paused are displayed on screen as icons Traffic Lights: Red, yellow and green LEDs show measurement status and instantaneous overload as follows: Yellow LED flash every 5 s = stopped, ready to measure Green LED flashing slowly = awaiting calibration signal Green LED on constantly = measuring Yellow LED flashing slowly = paused, measurement not stored Red LED flashing quickly = intermittent overload, calibration failed CALIBRATION Initial calibration is stored for comparison with later calibrations Acoustic: Using Sound Calibrator Type 4231 or custom calibrator. The calibration process automatically detects the calibration level when Sound Calibrator Type 4231 is used Electrical: Uses internally generated electrical signal combined with a typed-in value of microphone sensitivity Calibration History: Up to 20 of the last calibrations made are listed and can be viewed on the instrument SIGNAL MONITORING The input signal can be monitored using an earphone/ headphones connected to the headphone socket, or it can be fed to the output socket Output Signal: Input conditioned; A-, B-, C- or Z- weighted Gain Adjustment: 60 db to 60 db L XF output (every ms) as a DC voltage between 0 V and 4 V. DC output for calibration purposes: 0 db ~ 0 V and 200 db ~ 4 V Headphone Signal: Input signal can be monitored using this socket with headphones/earphones Gain Adjustment: 60 db to 60 db VOICE ANNOTATIONS Voice annotations can be attached to measurements so that verbal comments can be stored together with the measurement Playback: Playback of voice annotations can be listened to using an earphone/headphones connected to the headphone socket Gain Adjustment: 60 db to 0 db TEXT ANNOTATIONS Text annotations can be attached to measurements so that written comments can be stored with the measurement IMAGE ANNOTATIONS (TYPE 2270 ONLY) Image annotations can be attached to measurements. Images can be viewed on the screen. DATA MANAGEMENT Metadata: Upto 10 Metadata annotations can be set per project (text from keyboard or text from pick list, number from keyboard or auto generated number) Project Template: Defines the display and measurement setups. Setups can be locked and password protected Project: Measurement data stored with the Project Template Job: Projects are organised in Jobs Explorer facilities for easy management of data (copy, cut, paste, delete, rename, view data, open project, create job, set default project name)
188 174 Hand-held Analyzers Types 2250 and 2270 User Manual NOTIFICATIONS Sends an SMS or if an alarm condition is fulfilled. Alarm Conditions: Disk Space below set value Trig. Input Voltage below set value Internal Battery enters set state Change in Measurement State Reboot of instrument Software Specifications Frequency Analysis Software BZ-7223 The specifications for BZ-7223 include the specifications for Sound Level Meter Software BZ BZ-7223 adds: STANDARDS Conforms with the following National and International Standards: IEC ( ) plus Amendment 1 ( ), 1/1-octave Bands and 1/3-octave Bands, Class 0 ANSI S , 1/1-octave Bands and 1/3-octave Bands, Order 3, Type 0 C ANSI S , 1/1-octave Bands and 1/3-octave Bands, Class 0 CHANNELS (TYPE 2270 ONLY) All measurements are made from either Ch.1 or Ch.2 CENTRE FREQUENCIES 1/1-octave Band Centre Frequencies: 8 Hz to 16 khz 1/3-octave Band Centre Frequencies: 6.3 Hz to 20 khz MEASUREMENTS X = frequency weightings A, B, C or Z, Y = time weightings F or S Data for Storage Full Spectral Statistics Spectra for Display and Storage L Xeq L XSmax L XFmax L XSmin L XFmin Spectra for Display Only L XS L XF L XYN1 L XYN2 L XYN3 L XYN4 L XYN5 L XYN6 L XYN7 Single Values SIL PSIL SIL3 L Xeq (f1-f2) a NR NR Decisive Band RC RC Classification NCB NCB Classification NC NC Decisive Band Loudness Loudness Level a. where f1 and f2 are frequency bands in the spectrum. MEASURING RANGES When using Microphone Type 4189: Dynamic Range: From typical noise floor to max. level for a pure tone signal at 1 khz 1/3-octave: 1.1 to 140 db Linear Operating Range: In accordance with IEC 61260, 1/3-octave: 20.5 db to 140 db SAMPLING FOR OCTAVE OR 1/3-OCTAVE STATISTICS X = frequency weightings A or B The Statistics can be based on either L XF or L XS : Statistics L XFN1-7 or L XSN1-7 are based on sampling L XF or L XS, respectively, every T ms into 1 db wide classes over 150 db; T = 100 for frequency range set to khz T = 200 for frequency range set to khz Full distribution can be saved with measurement MEASUREMENT DISPLAYS Spectrum: One or two spectra superimposed + A/B and C/Z broadband bars Table: One or two spectra in tabular form Y-axis: Range: 5, 10, 20, 40, 60, 80, 100, 120, 140 or 160 db. Auto zoom or auto scale available Cursor: Readout of selected band INTERNAL GENERATOR Built-in pseudo-random noise generator Spectrum: Selectable between Pink and White Crest Factor: Pink Noise: 4.4 (13 db) White Noise: 3.6 (11 db) Bandwidth: Selectable: Lower Limit: 50 Hz (1/3-oct.) or 63 Hz (oct.) Upper Limit: 10 khz (1/3-oct.) or 8 khz (oct.) Output Level: Independent of bandwidth
189 CHAPTER 16 Specifications 175 Max.: 1 Vrms (0 db) Gain Adjustment: 60 to 0 db When bandwidth is changed, the level for all bands is automatically adjusted to comply with the set output level Correction Filters for sound sources Type 4292, Type 4295 and Type 4296: Flat or Optimum Repetition Period: 175 s Output Connector: Output Socket EXTERNAL GENERATOR Selectable as alternative to Internal Generator To control external noise generator, set: Levels: 0 V (Generator off), 4.5 V (Generator on) Rise-time and Fall-time: 10 s The noise generator is turned on and off automatically during the measurement Escape Time: 0 to 60 s Build-up Time: 1 to 10 s The generator can be turned on and off manually for checking equipment and sound levels Software Specifications Logging Software BZ-7224 The specifications for BZ-7224 include the specifications for Sound Level Meter Software BZ BZ-7224 adds: MEASUREMENTS Logging: Measurement data logged at pre-set periods into files on external SD- or CF-cards Logging Period: From 1 s to 24 hours with 1 s resolution Fast Logging: L AF, L AS and L Aeq can be logged every 100 ms, irrespective of logging period Broadband Data Stored at each Logging Interval: All, or up to 10 selectable broadband data incl. Trig. Input Voltage Broadband Statistics Stored at each Logging Interval: Full distribution, or none Spectrum Data Stored at each Logging Interval: All, or up to 3 selectable spectra (license for BZ-7223 required) Spectral Statistics Stored at each Logging Interval: Full distribution, or none (license for BZ-7223 required) Logging Time: From 1 second to 31 days with 1 s resolution Measurement Total: For the logging time, in parallel with logging: All broadband data, statistics and spectra (license for BZ-7223 required) MARKERS One data exclusion marker and four user-definable markers for on-line marking of sound categories heard during the measurement Events can be set manually TRIGGERS Markers can be set and sound recordings can be started (license for BZ-7226 required) when a broadband level is above or below a specified level ANNOTATIONS On-line annotations with spoken comments, written notes or images (Type 2270 only) CIC (CHARGE INJECTION CALIBRATION) Injects an internally generated electrical signal in parallel with the microphone diaphragm. A manual CIC can be performed whenever there is no measurement in progress An automatic CIC can be performed at the start and end of a logging measurement MEASUREMENT DISPLAYS Profile: Graphical display of selectable measurement data versus time. Fast display of next or previous marker, Profile Overview of entire measurement Y-axis: Range: 5, 10, 20, 40, 60, 80, 100, 120, 140 or 160 db. Auto zoom or auto scale available X-axis: Scroll facilities Cursor: Readout of measurement data at selected time NOTIFICATIONS Alarm Conditions (in addition to those specified for BZ-7222): CIC failed Trigger Level exceeded Software Specifications Enhanced Logging Software BZ-7225 The specifications for BZ-7225 include the specifications for Logging Software BZ-7224, BZ-7225 adds: MEASUREMENTS For Display and Storage L dn, L den, L day, L evening and L night
190 176 Hand-held Analyzers Types 2250 and 2270 User Manual Selectable Day, Evening and Night periods and penalties Periodic Reports: Measurement data logged at a preset report period into files on external SD- or CF-cards Report Period: From 1 min to 24 hours with 1 min resolution Broadband Data and Statistics Stored at each Reporting Interval: All Spectrum Data Stored at each Reporting Interval: All (license for BZ-7223 required) Spectral Statistics Stored at each Reporting Interval: Full distribution, or none (license for BZ-7223 required) Logging Time: From 1 second to 31 days with 1 s resolution or Continuous Data are saved in separate projects for every 24 hrs of logging at a user-defined time of day Automatic reboot and resume of operation in case of power failure TRIGGERS Timer Trigger For periodically starting a sound recording (license for BZ-7226 required) Level Triggers Markers can be set and sound recordings can be started (license for BZ-7226 required) when a broadband or frequency band level is above or below a specified level. Hold off time between triggers can be set. You can specify up to four independent Level Triggers to be active at four different times during the day. CIC (CHARGE INJECTION CALIBRATION) Injects an internally generated electrical signal in parallel with the microphone diaphragm. A manual CIC can be performed whenever there is no measurement in progress An automatic CIC can be performed at the start and end of a logging measurement. The CIC can be set to occur up to 4 times in each 24 hour period CIC Duration: 10 s Software Specifications Sound Recording Option BZ-7226 Sound Recording Option BZ-7226 is enabled with a separate license. It works with all the software for Type 2250/2270: Sound Level Meter, Frequency Analysis, Logging Software, Enhanced Logging Software and Reverberation Time Software Sound Recording requires a CF- or SD-Card for data storage RECORDED SIGNAL A-, B-, C- or Z-weighted signal from the measurement transducer AUTOMATIC GAIN CONTROL The average level of the signal is kept within a 40 db range, or the gain can be fixed SAMPLING RATE AND PRE-RECORDING Sound is buffered for the pre-recording of sound. This allows the beginning of events to be recorded even if they are only detected later. Sampling Rate (khz) Maximum Prerecording (s) Sound Quality Memory (KB/s) Low Fair Medium High 96 FUNCTIONS WITH BZ-7222 AND BZ-7223 Manual Control of Recording: Recording can be manually started and stopped during a measurement using a pushbutton or an external signal Automatic Control of Recording: Start of recording when measurement is started. Minimum and Maximum recording time can be preset FUNCTIONS WITH BZ-7224 AND BZ-7225 Manual Control of Recording (using Manual Event or Back-erase pushbutton, or an external signal): Recording during all of the event, or for preset minimum and maximum duration. A Sound marker is set while recording. Selectable pre- and post-recording time Manual Control of Recording (using touch screen): Recording for the selected time period (subject to the limitations of the pre-recording buffer). A Sound marker is set for the selected time period Automatic Control of Recording: An event can be triggered when a broadband level is above or below a specified level. Recording during all of the event or for preset minimum and maximum duration. Selectable pre- and post-recording time FUNCTIONS WITH BZ-7227 Automatic Control of Recording: Start of recording when measurement is started
191 CHAPTER 16 Specifications 177 PLAYBACK Playback of sound recordings can be listened to using the earphone/headphones connected to the headphone socket RECORDING FORMAT The recording format is 16-bit wave files (extension.wav) attached to the data in the project, easily playedback afterwards on a PC using Type 7815, 7820 or Calibration information is stored in the wav file, allowing PULSE to analyse the recordings Software Specifications Reverberation Time Software BZ-7227 Conforms with the relevant parts of the following: IEC ( ) Class 1 IEC (1979) plus Amendment 1 ( ) and Amendment 2 ( ), Type 1 ANSI S plus ANSI S1.4A 1985 Amendment, Type 1 IEC ( ) plus Amendment 1 ( ), 1/1-octave Bands and 1/3-octave Bands, Class 0 ANSI S , 1/1-octave Bands and 1/3-octave Bands, Order 3, Type 0 C ANSI S , 1/1-octave Bands and 1/3-octave Bands, Class 0 ISO 140 ISO 3382 ISO 354 CORRECTION FILTERS For Microphone Types 4189, 4190, 4191, 4193, 4950, 4952 and 4184-A, BZ-7227 is able to correct the frequency response to compensate for sound field and accessories Broadband Measurements DETECTORS A- and C-weighted broadband detectors with F exponential time weighting Overload Detector: Monitors the overload outputs of all the frequency weighted channels MEASUREMENTS L AF and L CF for Display as Numbers or Quasianalogue Bars MEASURING RANGES When using Microphone Type 4189: Dynamic Range: From typical noise floor to max. level for a 1 khz pure tone signal, A-weighted: 16.6 to 140 db Primary Indicator Range: In accordance with IEC 60651, A-weighted: 23.5 db to db Linear Operating Range: In accordance with IEC 61672, A-weighted: 1 khz 24.8 db to db Frequency Analysis CENTRE FREQUENCIES 1/1-octave Band Centre Frequencies: 63 Hz to 8kHz 1/3-octave Band Centre Frequencies: 50 Hz to 10 khz MEASUREMENTS L ZF spectrum for display only L Zeq spectra sampled at 5 ms intervals MEASURING RANGES When using Microphone Type 4189: Dynamic Range: From typical noise floor to max. level for a pure tone signal at 1 khz 1/3-octave: 1.1 to 140 db Linear Operating Range: In accordance with IEC 61260, 1/3-octave: 20.5 db to 140 db Internal Generator Built-in pseudo-random noise generator Spectrum: Selectable Pink or White Crest Factor: Pink noise: 4.4 (13 db) White noise: 3.6 (11 db) Bandwidth: Follows measurement frequency range Lower Limit: 50 Hz (1/3-oct.) or 63 Hz (oct.) Upper Limit: 10 khz (1/3-oct.) or 8 khz (oct.) Output Level: Independent of bandwidth Max.: 1V rms (0 db) Gain Adjustment: 60 to 0 db When bandwidth is changed, the level for all bands is automatically adjusted to comply with the set output level Correction Filters for sound sources Type 4292, Type 4295 and Type 4296: Flat or Optimum Turn-on time and Turn-off Time: Equivalent to RT = 70 ms Repetition Period: 175 s Output Connector: Output Socket Control: See Measurement Control External Generator Selectable as alternative to Internal Generator
192 178 Hand-held Analyzers Types 2250 and 2270 User Manual For controlling external noise generator Levels: 0 V (Generator off), 4.5 V (Generator on) Rise-time and Fall-time: 10 s Control: See Measurement Control Reverberation Time EDT, T20 and T30 in octave or 1/3-octave bands Decays: Measured and stored using averaging time of 5ms Evaluation Range: 0 to 10 db for EDT, 5 to 25 db for T20 and 5 to 35 db for T30 Measurement Time: Automatic selection of measurement time for the decays based on the actual reverberation time of the room Maximum Measurement Time: from 2 to 30 s Averaging: EDT, T20 and T30 measurements can be averaged (arithmetic averaging or ensemble averaging) EDT, T20 and T30 Calculation: From slope in evaluation range Slope Estimation: Least squares approximation Quality Indicators: Quality Indicators with status information like Overload, Curvature in %, etc.; extensive list of Status information Quality Indicators are available on reverberation time spectra for each frequency band, and as overall quality indicators for each measurement position and for the total project (room) Reverberation Time Range: Max. 50 s, min s, depending on bandwidth and centre frequency Wide Band Reverberation Time: The arithmetic average of the Reverberation Time within a selectable frequency range is calculated Measurement Displays OVERVIEW MAP Map of Source and Receiver positions with reverberation time readout for a selectable frequency band on each measurement position together with quality indicator. Organisation of Source and Receiver Positions: measure at all receiver positions for each source or measure in a number of positions (1 to 10) for each source Source and Receiver positions can be added, moved or deleted OVERVIEW TABLE Table of measurement positions with reverberation time readout for selectable frequency band on each position together with quality indicator. Positions can be included/excluded from Room average SOUND LEVEL SPECTRUM LZF spectrum plus A and C broadband bars Y-axis: Range: 5, 10, 20, 40, 60, 80, 100, 120, 140 or 160 db. Auto zoom or auto scale available Cursor: Readout of selected band Quality indicator for each frequency band REVERBERATION TIME SPECTRUM One or two spectra can be displayed Y-axis: Range: 0.5, 1, 2, 5, 10 or 20 s. Auto zoom available Cursor: Readout of selected band Quality Indicator for each frequency band REVERBERATION TIME SPECTRUM TABLE One or two spectra can be displayed in tabular form DECAY Decay curve for a position or the room average available for each frequency band Display of evaluation range and regression line Readout of Curvature in % Y-axis: Range: 5, 10, 20, 40, 60, 80, 100, 120, 140 or 160 db. Auto zoom or auto scale available MEASUREMENT CONTROL Measurement Sequence: Supports measuring: at all receiver positions before using another source at a receiver position for all sources before measuring at a new position at subsequent receiver positions without source information, or at manually selected source and receiver positions During measurement, the instantaneous sound level spectrum is displayed. After measurement, the reverberation time is displayed Interrupted Noise Excitation: Measurements are started manually and can be automatically stored on completion of measurement. The noise generator is turned on and off automatically Escape Time: 0 to 60 s Build-up Time: 1 to 10 s Number of Decays per Measurement: 1 to 100, ensemble averaged into one decay The generator can be turned on and off manually for checking equipment and sound levels Impulse Excitation: Manual start of first measurement. When level (say from starter pistol) exceeds the user-selected trigger level, the decay is recorded and backwards integration performed (Schroeder method). The trigger can then be armed automatically for measuring at the next position Sound Recording: Recording of the Z-weighted measured signal can be done at each position Sound Recording requires a CF- or SD-Card for data storage
193 CHAPTER 16 Specifications 179 Sound Recording requires license for Sound Recording Option BZ-7226 Measurement Status On Screen: Information such as overload, awaiting trigger and running/paused are displayed on screen as icons Traffic Light: Red, yellow and green LEDs show measurement status and instantaneous overload as follows: Yellow LED flashing every 5 s = stopped, ready to measure Green LED flashing slowly = awaiting trigger or calibration signal Green LED on constantly = measuring Yellow LED flashing slowly = paused, measurement not stored Red LED flashing quickly = intermittent overload, calibration failed Calibration Initial calibration is stored for comparison with later calibrations Acoustic: Using Sound Calibrator Type 4231 or custom calibrator. The calibration process automatically detects the calibration level when Sound Calibrator Type 4231 is used Electrical: Uses internally generated electrical signal combined with a typed-in value of microphone sensitivity Calibration History: Up to 20 of the last calibrations made are listed and can be viewed on the instrument Signal Monitoring Input signal A, C or Z-weighted can be monitored using an earphone/headphones connected to the headphone socket Headphone Signal: Input signal can be monitored using this socket with headphones/earphones Gain Adjustment: 60 db to 60 db Voice Annotations Voice annotations can be attached to the Reverberation Time Project, to Sources, to Receivers and to measurements at each Position Playback: Playback of voice annotations or sound recordings can be listened to using earphone/ headphones connected to the headphone socket Gain Adjustment: 60dB to 0dB Text & Image Annotations Text and image (Type 2270 only) annotations can be attached to the Reverberation Time Project, to Sources, to Receivers and to measurements at each Position Data Management Project Template: Defines the display and measurement setups Project: Measurement data for all positions defined in a room are stored with the Project Template Job: Projects are organised in Jobs Explorer facilities for easy management of data (copy, cut, paste, delete, rename, view data, open project, create job, set default project name) Note: For specifications and details on Type 7831 and Type 7830, please refer to Product Data BP 1691 Software Specifications Tone Assessment Option BZ-7231 LICENSE Tone Assessment Option BZ-7231 is enabled with a separate license and can be used with the FFT template (BZ-7230) or with 1/3-octave and logging template (BZ-7223, BZ-7224 and BZ-7225) FFT Based Tone Assessment (Together with BZ-7230 Only) STANDARD Tone assessment is based on the measured FFT spectrum in accordance with ISO 1996:2007 Acoustics Description, assessment and measurement of environmental noise part 2: Determination of environmental noise levels. Annex C (informative) Objective method for assessing the audibility of tones in noise Reference method SPECTRA ASSESSED Any displayed sound FFT spectrum (FFT, Ref or MAX) may be assessed Assessment is made as post-processing, i.e., when measurement is paused or stopped SETUP ACCORDING TO STANDARD Setups in violation of the standard are indicated as such on the display, you may then accept to apply the default setup Tone assessment will be made if possible, in spite of standard violations Tone Seek Criterion: 0.1 to 4.0 db in 0.1 db steps
194 180 Hand-held Analyzers Types 2250 and 2270 User Manual TONE AT CURSOR A sinusoidal tone is available at the Headphone output, to help confirm identified tones Frequency: the frequency is selected by the Main cursor Gain: 70 db to +10 db Options: The generated tone can be mixed with the input signal TONE ASSESSMENT CURSOR All tones found are indicated in the display. The Tone cursor is initially placed at the most prominent tone, and can then be stepped through the tones found You can also use the Main cursor to step through the tones RESULTS Results are displayed in the Tone panel and in the Value panel They are not saved with the measurement All Tones: Frequency, Tone level L pti, Masking noise level L pn, Audibility L ta, Critical Band CB Most Prominent Tone: Tone Level L pt, Adjustment K t QUALITY INDICATORS On the display, a quality indicator (smiley) will indicate that a hint is available for tone assessment quality. Click on the indicator to see the hint 1/3-octave Based Tone Assessment (Together with BZ-7223/24/25 Only) Tone assessment is based on the measured 1/3- octave spectrum in accordance with either the international ISO 1996:2007 Acoustics Description, assessment and measurement of environmental noise part 2: Determination of environmental noise levels. Annex D (informative) Objective method for assessing the audibility of tones in noise Simplified method or the Italian law DM : Ministero dell'ambiente, Decreto 16 marzo 1998 SPECTRA ASSESSED The displayed 1/3-octave spectrum (L eq, L max or L min ) may be assessed. Assessment is made as postprocessing, i.e., when measurement is paused or stopped SETUP ACCORDING TO STANDARD Setups in violation of the standard are indicated as such on the display. You can then accept to apply the default setup. Tone assessment will be made if possible, in spite of standard violations. For tone assessment according to ISO , Annex D, you can set the division between the Low and Middle frequency range, the division between the Middle and High frequency range, and the limits for the level differences between adjacent bands. For tone assessment according to DM , the tones are tested against loudness contours. Select between ISO 226: 1987 Free-field, 1987 Diffuse-field and 2003 Free-field RESULTS Tones are indicated above the spectrum when Tone is selected as spectrum parameter. The resulting adjustment can be viewed on the Value panel. It is not saved with the measurement QUALITY INDICATORS On the display, a quality indicator (smiley) will indicate that a hint is available for tone assessment quality. Click on the indicator to see the hint Software Specifications Utility Software for Hand-held Analyzers BZ-5503 BZ-5503 is included with Type 2250/2270 for easy synchronisation of setups and data between PC and Type 2250/2270. BZ-5503 is supplied on DVD BZ-5298 ON-LINE DISPLAY OF TYPE 2250/2270 DATA Measurements on Type 2250/2270 can be controlled from the PC and displayed on-line with the PC, using the same user interface on the PC as on Type 2250/ 2270
195 CHAPTER 16 Specifications 181 DATA MANAGEMENT Explorer: Facilities for easy management of Instruments, Users, Jobs, Projects and Project Templates (copy, cut, paste, delete, rename, create) Data Viewer: View measurement data (content of projects) Template Editor: Editor for changing setups in Project Templates Synchronisation: Project Templates and Projects for a specific user can be synchronised between PC and Type 2250/2270 USERS Users of Type 2250/2270 can be created or deleted EXPORT FACILITIES Excel: Projects (or user specified parts) can be exported to Microsoft Excel Type 7810/12/15/16/20/25/30/31: Projects can be exported to Predictor Type 7810, Lima Type 7812, Noise Explorer Type 7815, Acoustic Determinator Type 7816, Evaluator Type 7820, Protector Type 7825 or Qualifier (Light) Type 7830 (7831) TYPE 2250/2270 SOFTWARE UPGRADES AND LICENSES The utility software controls Type 2250/2270 software upgrades and licensing of the Type 2250/2270 applications INTERFACE TO TYPE 2250/2270 USB ver. 1.1 or Hayes compatible GSM or standard analogue modem LICENCE MOVER To move a license from one analyzer to another use BZ-5503, together with the License Mover VP-0647: see Section 9.3 for details PC REQUIREMENT Operating System: Windows 7, Vista or XP (all in 32 bit or 64 bit versions), Microsoft.NET 3.5 Recommended PC: Pentium III (or equivalent) processor, 2048 Mbyte RAM, SVGA graphics display/ adaptor, sound card, DVD drive, mouse, USB, Windows 7 Ordering Information SOFTWARE MODULES AVAILABLE SEPARATELY BZ-7223 Frequency Analysis Software BZ-7224 Logging Software BZ-7225 Enhanced Logging Software BZ-7225-UPG Upgrade from Logging Software BZ to Enhanced Logging Software BZ-7225 (does not include memory card) BZ-7226 Sound Recording Option BZ-7227 Reverberation Time Software BZ-7229 Dual-Channel Building Acoustics Software (Type 2270 only) BZ-7228 Building Acoustics Software BZ-7230 FFT Software BZ-7231 Tone Assessment Option COMPONENTS INCLUDED WITH TYPE 2250/2270 HAND-HELD ANALYZER Type /2 Prepolarized Free-field Microphone or Type /2 Free-field Microphone ZC-0032 Microphone Preamplifier AO-1476 USB Standard A to USB Mini B Interface Cable, 1.8 m (6 ft) BZ-5298 Environmental Software, including BZ-5503 Utility Software for Handheld Analyzers UA mm dia. Windscreen with AutoDetect UA-1651 Tripod Extension for Hand-held Analyzer UA-1673 Adaptor for Standard Tripod Mount DH-0696 Wrist Strap KE-0440 Travel Bag KE-0441 Protective Cover FB-0679 Hinged Cover (Type 2250 only) FB-0699 Hinged Cover (Type 2270 only) HT-0015 Earphones UA Extra Styli QB-0061 Battery Pack ZG-0426 Mains Power Supply
196 182 Hand-held Analyzers Types 2250 and 2270 User Manual COMPONENTS INCLUDED WITH LOGGING SOFTWARE BZ-7224 AND ENHANCED LOGGING SOFTWARE BZ-7225 Memory Card for Hand-held Analyzers. Note: the upgrade from Logging Software BZ-7224 to Enhanced Logging Software BZ (BZ-7225-UPG) does not include memory card ACCESSORIES AND COMPONENTS AVAILABLE SEPARATELY ANALYZER ZG-0444 Charger for QB-0061 Battery Pack CALIBRATION Type 4231 Sound Calibrator (fits in KE-0440) Type 4226 Multifunction Acoustic Calibrator Type 4228 Pistonphone 2250 CAI Accredited Initial Calibration of Type CAF Accredited Calibration of Type CTF Traceable Calibration of Type TCF Conformance Test of Type 2250, with certificate 2270 CAI Accredited Initial Calibration of Type CAF Accredited Calibration of Type CTF Traceable Calibration of Type TCF Conformance Test of Type 2270, with certificate MEASURING Type 3592 Outdoor Measuring Gear (see Product Data BP 1744) AO-0440-D-015 Signal cable, LEMO to BNC, 1.5 m (5 ft) AO-0441-D-030 Microphone Extension Cable, 10- pin LEMO, 3 m (10 ft) AO-0441-D-100 Microphone Extension Cable, 10- pin LEMO, 10 m (33 ft) AO-0646 Sound Cable, LEMO to Minijack, 1.5 m (5 ft) AO-0697-D-030 Microphone Extension Cable, 10-pin LEMO, length 3m (10 ft) AO-0697-D-100 Microphone Extension Cable, 10-pin LEMO, length 10 m (33 ft) AO-0727-D-015 Signal cable, LEMO to BNC Female, length 1.5 m (5 ft) JP-1041 Dual 10-pole Adaptor UA-0587 Tripod UA-0801 Small Tripod UA-1317 Microphone Holder UA-1404 Outdoor Microphone Kit UA-1672 AutoDetect Insert for UA-1650 UL-1009 SD Memory Card for Hand-held Analyzers UL-1013 CF Memory Card for Hand-held Analyzers UL-1017 SDHC Memory Card for Hand-held Analyzers MEASURING WITH REVERBERATION TIME SOFTWARE BZ-7227 Type 2734-A Power Amplifier Type 2734-B Power Amplifier with built-in UL-0256 Wireless Audio System UL-0256 Wireless Audio System Type 4292 OmniPower Sound Source KE-0449 Flight Case for Type 4292 KE-0364 TripodCarrying Case for Type 4292 Type 4224 Sound Source Type 4295 Omnidirectional Sound Source KE-0392 Carrying Case for Type 4295 AO-0523-D-100 Cable from Type 2250/2270 to Power Amplifier, 10 m (33 ft.) AO-0524-D-100 Cable from Type 2250/2270 to Type 4224, 10 m (33 ft.) AQ-0673 Cable from Power Amplifier to sound source, 10 m (33 ft.) UA-1476 Wireless Transmission Kit Type 7831 Qualifier Light Type 7830 Qualifier Note: For sound sources, please see separate Product Data BP 1689 INTERFACING Type 7815 Noise Explorer data viewing software Type 7820 Evaluator data viewing and calculation software Type 7825 Protector software for calculation of Personal Noise Exposure UL /100 Ethernet CF Card UL-1019 CF WLAN Card for Hand-held Analyzers
197 CHAPTER 16 Specifications 183 Service Products HARDWARE MAINTENANCE: 2250-EW1 Extended Warranty, one year extension 2250-REF Hand-held Analyzer Type 2250 Repair including Conformance Test with Certificate (No measurement data included) 2270-EW1 Extended Warranty, one year extension 2270-REF Hand-held Analyzer Type 2270 Repair including Conformance Test with Certificate (No measurement data included) ACCREDITED CALIBRATION: 2250-CAI Initial Accredited Calibration, Hand- Held Analyzer Type CAF Accredited Calibration, Hand-Held Analyzer Type CAI Initial Accredited Calibration, Hand- Held Analyzer Type CAF Accredited Calibration, Hand-Held Analyzer Type 2270 Compliance with Standards CE-mark indicates compliance with the EMC Directive and Low Voltage Directive. C-Tick mark indicates compliance with the EMC requirements of Australia and New Zealand. Safety EMC Emission EMC Immunity EN/IEC , ANSI/UL and CSA C22.2 No : Safety requirements for electrical equipment for measurement, control and laboratory use. EN/IEC : Generic emission standard for residential, commercial and light industrial environments. CISPR 22: Radio disturbance characteristics of information technology equipment. Class B Limits. FCC Rules, Part 15: Complies with the limits for a Class B digital device. IEC , IEC 61260, IEC and IEC 60804: Instrumentation standards. Complies with Canadian standard ICES 001 EN/IEC : Generic standard Immunity for industrial environments. EN/IEC 61326: Electrical equipment for measurement, control and laboratory use EMC requirements. IEC , IEC 61260, IEC and IEC 60804: Instrumentation standards
198 184 Hand-held Analyzers Types 2250 and 2270 User Manual
199 185 Appendix A Setup Parameters This appendix describes all the setup parameters included in a template. A.1 Input (for Type 2250) Table A.1 Input parameters (Type 2250) Parameter Values Comment Input Sound Field Correction Top Socket Rear Socket Free-field Diffuse-field Determines whether the input is taken from the top socket or the rear socket ( Input on connector panel). Connect your transducer to this socket Note: Sound Field and Windscreen corrections can be added to both the Top Socket and the Rear Socket (Input parameters). However, be careful that you don t add a double correction - for instance, if you have recorded the signal from the Output socket on a tape recorder, and later want to re-analyse the recording via the Rear Input. In this case you should set Microphone Type to Unknown on the Transducer menu for the used transducer, when using Rear Input Select a correction matching the sound field of your measurements. i.e., you can make correct measurements in a diffuse-field using a Type 4189 or Type 4190 free-field microphone, by selecting Diffuse-field correction. Even free-field correction of a free-field microphone will enhance the overall frequency response of the system. Generally, ISO requires free-field conditions and ANSI requires diffuse-field conditions.check your local standards for the setting you require. No correction is made for unknown transducers
200 186 Hand-held Analyzers Types 2250 and 2270 User Manual Table A.1 Input parameters (Type 2250) Parameter Values Comment Loudness Free-field Diffuse-field Auto Determines whether Loudness and Loudness Level are calculated based on Free-field or Diffuse-field conditions. Set to Auto to follow the setting of Sound Field Correction. For an unknown microphone type, you can set Loudness to the condition matching your request. For outdoor measurements, it is often necessary to mount a windscreen on the microphone to reduce the measured wind noise. This has, however, a small impact on the overall frequency response of the analyzer. To compensate for this, use the built-in windscreen correction. Table A.2 Input parameters, with windscreen correction Parameter Values Comment Windscreen Auto Detect Windscreen Correction On Off None UA-1650 UA-1404 Automatic detection of UA-1650 windscreen when mounted on the ZC-0032 microphone preamplifier. The preamplifier should be connected to the top socket, if necessary using a microphone extension cable. This parameter is available for microphone types using ZC-0032 only If Windscreen Auto Detect is set to Off, you can manually select a windscreen correction suitable for the windscreen in use. Correction is automatically made for the windscreen on Types 4952 and 4184-A. No correction is made for unknown transducers
201 APPENDIX A Setup Parameters 187 Table A.2 (Cont.) Input parameters, with windscreen correction Parameter Values Comment Extended Low Frequency a Trigger Input a On Off None MATRON Handswitch Voltage Level Voltage for Monitoring Use this parameter to extend the low frequency of the broadband measurements and the frequency analysis. However, be aware that the measurements will be more sensitive to very low frequency noise such as wind noise. Extended Low Frequency Off: Broadband Z-weighting: 6.3 Hz to 22.4 khz ( 2 db limits) Frequency analysis b : 1/1-octave: 16 Hz 16 khz 1/3-octave: 12.5 Hz 20 khz Extended Low Frequency On: Broadband Z-weighting (using Type 4189 or 4190 microphone): 4.2 Hz to 22.4 khz ( 2 db limits) Broadband Z-weighting (without microphone): approx. 1 Hz to 22.4 khz ( 2 db limits) Frequency analysis b : 1/1-octave: 8 Hz 16 khz 1/3-octave: 6.3 Hz 20 khz This parameter should be set to match the equipment connected to the Trigger Input Socket on the connector panel of the analyzer. Set it to None, if not used. Set Trigger Input to MATRON Handswitch if the analyzer is being used in the MATRON system. This setting should also be used if you want to use the handswitch ZH-0680 for manually triggering sound recordings. Note: This can only be used together with instruments with serial numbers above Set Trigger input to Voltage Level if you want to control sound recording by a voltage level generated by external equipment. The Voltage Level should generate at least 2 V for On and less than 1 V for Off. The duration of the steady level should be at least 1 s, so it can be recognised by the analyzer. Set Trigger Input to Voltage for Monitoring if you want to monitor the voltage at this input. This setting can be used together with Notifications - see Section 8.4 This setting cannot be combined with MATRON Handswitch or Voltage Level. a. Not available in Reverberation Time Software BZ b. Requires Frequency Analysis Software BZ-7223.
202 188 Hand-held Analyzers Types 2250 and 2270 User Manual A.2 Input (for Type 2270) Table A.3 Input parameters (Type 2270) Parameter Values Comment Input Channel Ch. 1 Ch. 2 Determines whether Input Ch. 1 or Input Ch. 2 is used for the measurement Loudness Extended Low Frequency a Free-field Diffuse-field Auto On Off Determines whether Loudness and Loudness Level are calculated based on Free-field or Diffuse-field conditions. Set to Auto to follow the setting of Sound Field Correction. For an unknown microphone type, you can set Loudness to the condition matching your request. Use this parameter to extend the low frequency of the broadband measurements and the frequency analysis. However, be aware that the measurements will be more sensitive to very low frequency noise such as wind noise. Extended Low Frequency Off: Broadband Z-weighting: 6.3 Hz to 22.4 khz ( 2 db limits) Frequency analysis b : 1/1-octave: 16 Hz 16 khz 1/3-octave: 12.5 Hz 20 khz Extended Low Frequency On: Broadband Z-weighting (using Type 4189 or 4190 microphone): 4.2 Hz to 22.4 khz ( 2 db limits) Broadband Z-weighting (without microphone): approx. 1 Hz to 22.4 khz ( 2 db limits) Frequency analysis b : 1/1-octave: 8 Hz 16 khz 1/3-octave: 6.3 Hz 20 khz
203 APPENDIX A Setup Parameters 189 Table A.3 Input parameters (Type 2270) Parameter Values Comment Trigger Inputa. a none MATRON Handswitch Voltage Level Voltage for Monitoring This parameter should be set to match the equipment connected to the Trigger Input Socket on the connector panel of the analyzer. Set it to None, if not used. Set Trigger Input to MATRON Handswitch if the analyzer is being used in the MATRON system. This setting should also be used if you want to use the handswitch ZH-0680 for manually triggering sound recordings. Note: This can only be used together with instruments with serial numbers above Set Trigger input to Voltage Level if you want to control sound recording by a voltage level generated by external equipment. The Voltage Level should generate at least 2 V for On and less than 1 V for Off. The duration of the steady level should be at least 1 s, so it can be recognised by the analyzer Set Trigger Input to Voltage for Monitoring if you want to monitor the voltage at this input. This setting can be used together with Notifications - see Section 8.4. This setting cannot be combined with MATRON Handswitch or Voltage Level. a. Not available in Reverberation Time Software BZ-7227 b. Requires Frequency Analysis Software BZ-7223 A.3 Input Ch. 1 (for Type 2270) Table A.4 Input Ch. 1 parameters (Type 2270) Parameter Values Comment Input Top Socket Rear Socket Determines whether the input is taken from the top socket or the rear socket ('Input' on connector panel). Connect your transducer to this socket Note: Sound Field and Windscreen corrections can be added to both the Top Socket and the Rear Socket (Input parameters). However, be careful that you don't add a 'double' correction for instance, if you have recorded the signal from the Output socket on a tape recorder, and later want to re-analyse the recording via the Rear Input. In this case you should set Microphone Type to Unknown on the Transducer menu for the used transducer, when using Rear Input
204 190 Hand-held Analyzers Types 2250 and 2270 User Manual Table A.4 Input Ch. 1 parameters (Type 2270) Parameter Values Comment Sound Field Correction Windscreen Auto Detect Windscreen Correction Free-field Diffuse-field On Off None UA-1650 UA-1404 Select a correction matching the sound field of your measurements. i.e., you can make correct measurements in a diffuse-field using a Type 4189 or 4190 free-field microphone, by selecting Diffuse-field correction. Even free-field correction of a free-field microphone will enhance the overall frequency response of the system. Generally, ISO requires free-field conditions and ANSI requires diffuse-field conditions. Check your local standards for the setting you require. No correction is made for unknown transducers Automatic detection of UA-1650 windscreen when mounted on the ZC-0032 microphone preamplifier. The preamplifier should be connected to the top socket, if necessary using a microphone extension cable. This parameter is available for microphone types using ZC-0032 only If Windscreen Auto Detect is set to Off, you can manually select a windscreen correction suitable for the windscreen in use. Correction is automatically made for the windscreen on Types 4952 and 4184-A. No correction is made for unknown transducers A.4 Input Ch. 2 (for Type 2270) Table A.5 Input Ch. 2 parameters (Type 2270) Parameter Values Comment Input Top Socket Rear Socket Determines whether the input is taken from the top socket or the rear socket ('Input' on connector panel). Connect your transducer to this socket Note: Sound Field and Windscreen corrections can be added to both the Top Socket and the Rear Socket (Input parameters). However, be careful that you don't add a 'double' correction for instance, if you have recorded the signal from the Output socket on a tape recorder, and later want to re-analyse the recording via the Rear Input. In this case you should set Microphone Type to Unknown on the Transducer menu for the used transducer, when using Rear Input
205 APPENDIX A Setup Parameters 191 Table A.5 Input Ch. 2 parameters (Type 2270) Parameter Values Comment Sound Field Correction Windscreen Auto Detect Windscreen Correction Free-field Diffuse-field On Off None UA-1650 UA-1404 Select a correction matching the sound field of your measurements. i.e., you can make correct measurements in a diffuse-field using a Type 4189 or 4190 free-field microphone, by selecting Diffuse-field correction. Even free-field correction of a free-field microphone will enhance the overall frequency response of the system. Generally, ISO requires free-field conditions and ANSI requires diffuse-field conditions.check your local standards for the setting you require. No correction is made for unknown transducers Automatic detection of UA-1650 windscreen when mounted on the ZC-0032 microphone preamplifier. The preamplifier should be connected to the top socket, if necessary using a microphone extension cable. This parameter is available for microphone types using ZC-0032 only If Windscreen Auto Detect is set to Off, you can manually select a windscreen correction suitable for the windscreen in use. Correction is automatically made for the windscreen on Types 4952 and 4184-A. No correction is made for unknown transducers A.5 Frequency Weightings Table A.6 Frequency weighting parameters a Parameter Values Comment Broadband (excl. Peak) Broadband Peak AC AZ BC BZ X C Z All broadband parameters (except L peak ) are measured simultaneously with two different frequency weightings select the weightings here One broadband peak parameter L peak is measured, select the frequency weighting here. Note: X = frequency weighting A or B. A requires that the Broadband (excl. Peak) parameter is set to AC or AZ. B requires that the Broadband (excl. Peak) parameter is set to BC or BZ
206 192 Hand-held Analyzers Types 2250 and 2270 User Manual Table A.6 Frequency weighting parameters a Parameter Values Comment Spectrum b X C Z The frequency analysis (1/1-octave or 1/3-octave) will be frequency weighted in accordance with this parameter Note: X = frequency weighting A or B. A requires that the Broadband (excl. Peak) parameter is set to AC or AZ. B requires that the Broadband (excl. Peak) parameter is set to BC or BZ a. Not available in Reverberation Time Software BZ b. Requires Frequency Analysis Software BZ A.6 Bandwidth Table A.7 Bandwidth parameters Parameter Values Comment Bandwidth a Bottom F. for Special Leq b Top Freq. for Special Leq b 1/1-octave 1/3-octave 6.3 Hz to Top Frequency Bottom Frequency to 20 khz Bandwidth of frequency analysis 1/1-octave: 8 Hz 16 khz 1/3-octave: 6.3 Hz 20 khz Note: The lower limit of the parameter depends on Extended Low Frequency 1/1-octave: 8 Hz 16 khz 1/3-octave: 6.3 Hz 20 khz a. Requires Frequency Analysis Software BZ-7223 or Reverberation Time Software BZ b. For BZ-7223, BZ-7224 and BZ-7225 only. A.7 Statistics Table A.8 Statistics parameters a Parameter Values Comment Broadband Statistics based on L Xeq L XF L XS The broadband statistics are based on sampling the broadband parameter L XF or L XS each 10 ms or L Xeq each second. Note: X = frequency weighting A or B. A requires that the Broadband (excl. Peak) parameter is set to AC or AZ. B requires that the Broadband (excl. Peak) parameter is set to BC or BZ
207 APPENDIX A Setup Parameters 193 Table A.8 (Cont.) Statistics parameters a Parameter Values Comment Spectral Statistics based on b LXF LXS The statistics are based on sampling the instantaneous spectrum every 100 ms (200 ms for Extended Low Frequency set to On). The time weighting for the spectrum is either F or S. The frequency weighting X is determined by the Frequency Weighting, Spectrum parameter Percentile N1 0.1 to 99.9 User-defined percentile level where the value of L XN1 is exceeded for N1% of the elapsed time Percentile N2 0.1 to 99.9 User-defined percentile level where the value of L XN2 is exceeded for N2% of the elapsed time Percentile N3 0.1 to 99.9 User-defined percentile level where the value of L XN3 is exceeded for N3% of the elapsed time Percentile N4 0.1 to 99.9 User-defined percentile level where the value of L XN4 is exceeded for N4% of the elapsed time Percentile N5 0.1 to 99.9 User-defined percentile level where the value of L XN5 is exceeded for N5% of the elapsed time Percentile N6 0.1 to 99.9 User-defined percentile level where the value of L XN6 is exceeded for N6% of the elapsed time Percentile N7 0.1 to 99.9 User-defined percentile level where the value of L XN7 is exceeded for N7% of the elapsed time a. Not available for Reverberation Time Software BZ b. Requires Frequency Analysis Software BZ The percentile levels N1 to N7 are common to broadband and spectral statistics, and can be changed after the measurement has been done. A.8 Measurement Control for BZ-7222 to BZ-7225 Table A.9 Measurement Control parameters for BZ-7222 to BZ-7225 Parameter Values Comment Measurement Mode a Manual Automatic Determines whether the measurement is under Manual control (fully controlled by the Reset and Start/Pause pushbuttons), or Automatic control (start of measurement controlled by the Reset and Start/Pause pushbuttons, end of measurement automatically controlled by the instrument when preset time has elapsed) Preset Time a 00:00:01 to 24:00:00 Fixes the duration of a measurement from start to automatic stop (in hours, minutes and seconds). Any pauses made during the measurement via the Start/ Pause pushbutton are not counted in the preset time
208 194 Hand-held Analyzers Types 2250 and 2270 User Manual Table A.9 (Cont.) Measurement Control parameters for BZ-7222 to BZ-7225 Save Project Data at b Continuous Logging b Preset Logging Time c Logging Period c Report Period b Full Spectral Stat. for Reports b Synchronize with Clock c Charge Injection Calibration c Daily CIC b First Check b Second Check b Third Check b Parameter Values Comment 00:00:00 to 23:59:59 On Off 0.00:00:01 to 31.00:00:00 00:00:01 to 24:00:00 00:01:00 to 24:00:00 Yes No Yes No On Off None Once, Twice, Three times, Four times 00:00:00 to 23:59:59 00:00:00 to 23:59:59 00:00:00 to 23:59:59 Determines the time for automatic save of the project and start of a new project. Determines whether the logging will run continuously, or for a time set by Preset Logging Time Fixes the duration of a measurement from start to automatic stop (in days, hours, minutes and seconds) Sets the period of the logging (in hours, minutes and seconds) Sets the period of the reports (in hours and minutes) Determines whether the full spectral statistics are logged in the report or not Select Yes to synchronise the logging and reporting intervals with whole minutes or hours, e.g., if Logging Period is set to 00:01:00 (1 minute) and Report Period is set to 01:00:00 and you start the measurement at 8:12:33, then the first logging interval will be from 8:12:33 to 8:12:59 (27 seconds), the second will be from 8:13:00 to 8:13:59 (60 seconds), etc., and the first Report interval will be from 8:12:33 to 8:59:59 (48 min and 27 seconds), the second will be from 9:00:00 to 9:59:59 (1 hour), etc. Select No if you want every logging and reporting interval to be exactly the specified Logging Period Set to On for making a CIC at the start and end of Logging. An Exclude marker is set on the profile and Total parameters are not updated during the CIC Determines whether a Charge Injection Calibration is performed one to four times a day or not. An Exclude marker is set on the profile and Periodic Reports and Total parameters are not updated during the calibration. The results are saved together with the Total parameters Set time of day for first CIC check Set time of day for second CIC check Set time of day for third CIC check
209 APPENDIX A Setup Parameters 195 Table A.9 (Cont.) Measurement Control parameters for BZ-7222 to BZ-7225 Parameter Values Comment Fourth Check b 00:00:00 to 23:59:59 Set time of day for fourth CIC check Note: The Check times must be separated from each other by at least one minute. They should also differ by at least one minute from the time set in the Save Project Data at parameter a. For Sound Level Meter (BZ-7222) and Frequency Analyzer (BZ-7223) templates only. b. For Enhanced Logging (BZ-7225) templates only. c. For Logging (BZ-7224) and Enhanced Logging (BZ-7225) templates only. A.9 Measurement Control for Reverberation Time Software BZ-7227 Table A.10 Measurement Control parameters for Reverberation Time Software BZ-7227 Parameter Values Comment Map Based Measurement No Yes If Map Based Measurement = Yes you can define the source positions and receiver positions graphically on a map otherwise the measurements are just numbered from position number one (Pos. 1) onwards Meas. All Pos. for Each Source No Yes Parameter only available if Map Based Measurement = Yes. Set to Yes for measuring all positions for each source position. Set to No for measuring a specific number of receiver positions per source position No. of Positions per Source 1 to 10 Parameter only available if Meas. All Pos. for Each Source = No Set number of receiver positions you want to measure per source Increment Automatic Save Sources First Receivers First Manual No Yes Parameter only available if Map Based Measurement = Yes. Allows you to select the quickest method of measurement, when positioning your analyzer in relation to source and receiver positions. (Typically, Sources First is best for Impulsive Excitation and Receivers First is best for Interrupted Noise excitation) Set to Yes to automatically save the decay after each measurement
210 196 Hand-held Analyzers Types 2250 and 2270 User Manual Table A.10 (Cont.) Measurement Control parameters for Reverberation Time Software BZ-7227 Max. Decay Time 1 to 30 s Sets the maximum duration of the decay measurement. If the decay finishes in a shorter time, decay measurement stops automatically Note: If you set Max. Decay Time above 20 s, then the measurement will not stop before this time has elapsed. Excitation Impulsive Interrupted Noise Select Impulsive to excite the room with an impulse. The analyzer triggers on the impulse, measures the impulse as a sequence of spectra with 5 ms intervals, and finally backwardly integrates the measurements to decay curves. Select Interrupted Noise to excite the room with noise, interrupt the noise and measure the decays all controlled by the analyzer Number of Decays 1 to 99 Parameter only available if Excitation = Interrupted Noise. Specify the number of decays to be measured automatically and averaged together per position Trigger Level 0 to 200 db Parameter only available if Excitation = Impulsive. Specify the trigger level for the sound level in any frequency band the measurement starts as soon as this level is exceeded. The measurement has a pre-trigger of 1 s Trigger Repeat Parameter Values Comment Off On Set to On to start a new measurement automatically, after saving the previous measurement (and after fulfilling the trigger conditions). Parameter only available if Excitation = Impulsive and Automatic Save = Yes A.10 Logged Broadband (100 ms) Table A.11 Logged Broadband (100 ms) parameters a Parameter Values Comment L Aeq L AF On Off On Off Select On to log L Aeq (with an elapsed time of 100 ms and a logging period of 100 ms) Note: Logging L Aeq every 100 ms requires Broadband (excl. Peak) parameter set to AC or AZ Select On for logging of L AF every 100 ms Note: Logging L AF every 100 ms requires Broadband (excl. Peak) parameter set to AC or AZ
211 APPENDIX A Setup Parameters 197 Table A.11 (Cont.) Logged Broadband (100 ms) parameters a Parameter Values Comment L AS On Off Select On for logging of L AS every 100 ms Note: Logging L AS every 100 ms requires Broadband (excl. Peak) parameter set to AC or AZ a. For Logging (BZ-7224) and Enhanced Logging (BZ-7225) templates only. A.11 Logged Broadband Table A.12 Logged Broadband parameters a Parameter Values Comment Full Statistics Broadband Parameters Yes No All Selected Determines whether the full broadband statistics are logged or not Determines whether all broadband parameters are logged or a selected part is logged (up to 10 parameters)
212 198 Hand-held Analyzers Types 2250 and 2270 User Manual Table A.12 Logged Broadband parameters a Parameter Values Comment Parameter 1 to Parameter 10 L Xeq L Yeq L Ceq -L Aeq L XE L YE L Vpeak L XFmax L XSmax L XImax L YFmax L YSmax L YImax L XFmin L XSmin L XImin L YFmin L YSmin L YImin L XIeq L YIeq L AIeq -L Aeq L AFTeq L AFTeq -L Aeq L avuq SIL PSIL SIL3 L Weq (f1-f2) Overload Trig. Input Voltage This parameter can be set if Broadband Parameters = Selected. X = frequency weightings A or B (controlled by Setup Frequency Weightings Broadband (excl. Peak) parameter). Y = frequency weightings C or Z (controlled by Setup Frequency Weightings Broadband (excl. Peak) parameter). V = frequency weightings A, B, C or Z (controlled by Setup Frequency Weightings Broadband Peak parameter) U = time weightings F or S (controlled by Setup Occupational Health Time Weighting for Lav parameter) Q = exchange rate 4, 5 or 6 db (controlled by Setup Occupational Health Exchange Rate for Lav parameter) W = frequency weightings A, B, C or Z (controlled by Setup Frequency Weightings Spectrum parameter) f1 = Bottom frequency band (controlled by Setup Bandwidth Bottom F. for Special Leq) f2 = Top frequency band (controlled by Setup Bandwidth Top Freq. for Special Leq) a. For Logging (BZ-7224) and Enhanced Logging (BZ-7225) templates only. A.12 Logged Spectrum Table A.13 Logged Spectrum parameters a Parameter Values Comment Full Spectral Statistics Yes No Determines whether the full spectral statistics are logged or not
213 APPENDIX A Setup Parameters 199 Table A.13 Logged Spectrum parameters a Parameter Values Comment Spectrum Parameters Spectrum 1 to Spectrum 3 All Selected None L Xeq L XFmax L XSmax L XFmin L XSmin Off Determines whether all spectrum parameters are logged, a selected part of the parameters are logged (up to 3 parameters) or none are logged These parameters can be set if Spectrum Parameters = Selected X = frequency weightings A, B, C or Z (controlled by Setup Frequency Weightings Spectrum parameter) a. For Logging (BZ-7224) and Enhanced Logging (BZ-7225) templates only, requires Frequency Analysis Software BZ A.13 Markers Table A.14 Markers a Parameter Values Comment Marker 1 Text string Default set to Exclude. This marker can be set using the stylus in the profile or the Backerase pushbutton during a measurement Marker 2 Text string Default set to Manual. This marker can be set using the stylus in the profile or the Manual Event pushbutton during a measurement Marker 3 Text string Default set to Level. This marker can be set using the stylus in the profile, or if the conditions for the Level Trigger are met during a measurement Marker 4 and Marker 5 Text string These markers can be set using the stylus in the profile display Marker 6 Text String Default set to Sound. This marker is set if a sound recording is made during a measurement Pre-marker Time 0 to 5 s Specifies number of seconds marker 1, marker 2 or marker 3 will be set ahead of the point where the Back-erase or the Manual Event pushbuttons are pressed or the level trigger conditions are fulfilled a. For Logging (BZ-7224) and Enhanced Logging (BZ-7225) templates only.
214 200 Hand-held Analyzers Types 2250 and 2270 User Manual A.14 Level Trigger Table A.15 Level Trigger parameters a Parameter Values Comment Level Trigger Control Start Slope On Off Rising Falling Set to On for setting Marker 3 (Level) when the Trigger Parameter fulfils the Level Trigger conditions (see below). The conditions are checked every second. Sound Recording b can also be controlled by these settings, see Setup Sound Recording Recording Control Set to Rising to start when level goes above Start Level (and then stop when level goes below Stop Level). Set to Falling to start when level goes below Start Level (and stop when level goes above Stop Level) Start Level 100 to 200 db Start trigger conditions are fulfilled, when level crosses Start Level (in accordance with Start Slope) for at least Start Duration seconds set Start Level here Start Duration 0 to 15 s Start trigger conditions are fulfilled, when level crosses Start Level (in accordance with Start Slope) for at least Start Duration seconds set Start Duration here Stop Level 100 to 200 db Stop trigger conditions are fulfilled, when level crosses Stop Level (in accordance with Start Slope) for at least Stop Duration seconds set Stop Level here Stop Duration 0 to 15 s Stop trigger conditions are fulfilled, when level crosses Stop Level (in accordance with Start Slope) for at least Stop Duration seconds set Stop Duration here
215 APPENDIX A Setup Parameters 201 Table A.15 (Cont.) Level Trigger parameters a Parameter Values Comment Trigger Parameter L Xeq L Yeq L Vpeak L XFmax L XSmax L XImax L YFmax L YSmax L YImax L XFmin L XSmin L XImin L YFmin L YSmin L YImin L XF(SPL) L XS(SPL) L XI(SPL) L YF(SPL) L YS(SPL) L YI(SPL) L avuq Select which parameter to monitor for the level trigger. The parameter is based on 1 second measurements and checked every second regardless of the logging period and logged parameters X = frequency weightings A or B (controlled by Setup Frequency Weightings Broadband (excl. Peak) parameter). Y = frequency weightings C or Z (controlled by Setup Frequency Weightings Broadband (excl. Peak) parameter). V = frequency weightings A, B, C or Z (controlled by Setup Frequency Weightings Broadband Peak parameter) U = time weightings F or S (controlled by Setup Occupational Health Time Weighting for Lav parameter) Q = exchange rate 4, 5 or 6 db (controlled by Setup Occupational Health Exchange Rate for Lav parameter) a. For Logging (BZ-7224) templates only. b. Requires license for Sound recording BZ A.15 Triggers Table A.16 Trigger parameters a Timer Trigger Parameter Values Comment Trigger Timer Period Synchronize with Clock On Off 00:01:00 to 12:00:00 Yes, No Set to On to periodically generate a Timer Event. Note: Set Sound Recording, Recording Control to Timer Event or All Events The sound recording is triggered with Timer Period intervals Select Yes to synch. the start of sound recordings with whole minutes or hours. Select No if you want the first sound recording Timer Period after start
216 202 Hand-held Analyzers Types 2250 and 2270 User Manual Table A.16 (Cont.) Trigger parameters a Duration Level Trigger 1 bc Trigger Start Time Stop Time Hold Off Start Slope Parameter Values Comment 00:00:01 to 01:00:00 On Off 00:00:00 to 23:59:59 00:00:00 to 23:59:59 00:00:00 to 01:00:00 Rising Falling Specifies the duration of the trigger for the sound recording. Note: The total time of the sound recording will be Pre-recording Time + Duration + Postrecording Time Set to On for setting Marker 3 (Level) when the Trigger Parameter fulfils the Level Trigger conditions (see below). The conditions are checked every second. Sound Recordings c can also be controlled by these settings, see Setup, Sound Recording, Recording Control Start Time defines when the level trigger is enabled. Triggering is limited to the enabled time Stop Time defines when the level trigger is disabled. Triggering is limited to the enabled time Hold Off specifies a time after a level trigger, where level triggering is disabled. Can be useful in reducing the number of triggers Set to Rising to start when level goes above Start Level (and then stop when level goes below Stop Level). Set to Falling to start when level goes below Start Level (and stop when level goes above Stop Level) Start Level 100 to 200 db Start trigger conditions are fulfilled when level crosses Start Level (in accordance with Start Slope) for at least Start Duration seconds set Start Level here Start Duration 0 to 15 s Start trigger conditions are fulfilled when level crosses Start Level (in accordance with Start Slope) for at least Start Duration seconds set Start Duration here Stop Level 100 to 200 db Stop trigger conditions are fulfilled when level crosses Stop Level (in accordance with Start Slope) for at least Stop Duration seconds set Stop Level here
217 APPENDIX A Setup Parameters 203 Table A.16 (Cont.) Trigger parameters a Parameter Values Comment Stop Duration 0 to 15 s Stop trigger conditions are fulfilled when level crosses Stop Level (in accordance with Start Slope) for at least Stop Duration seconds set Stop Duration here Trigger Parameter L Xeq L Yeq L Vpeak L XFmax L XSmax L XImax L YFmax L YSmax L YImax L XFmin L XSmin L XImin L YFmin L YSmin L YImin L XF(SPL) L XS(SPL) L XI(SPL) L YF(SPL) L YS(SPL) L YI(SPL) L avuq L Weq (f1-f2) Select which parameter to monitor for the level trigger. The parameter is based on 1 second measurements and checked every second regardless of the logging period and logged parameters X = frequency weightings A or B (controlled by Setup Frequency Weightings Broadband (excl. Peak) parameter) Y = frequency weightings C or Z (controlled by Setup Frequency Weightings Broadband (excl. Peak) parameter) V = frequency weightings A, B, C or Z (controlled by Setup Frequency Weightings Broadband Peak parameter) U = time weightings F or S (controlled by Setup Occupational Health Time Weighting for Lav parameter) Q = exchange rate 4, 5 or 6 db (controlled by Setup Occupational Health Exchange Rate for Lav parameter) W = frequency weightings A, B, C or Z (controlled by Setup Frequency Weightings Spectrum parameter) f1 = Lower freq. range (controlled by Setup Bandwidth Bottom F. for Special Leq) f2 = Upper freq. range (controlled by Setup Bandwidth Top Freq. for Special Leq) Level Trigger 2: Exactly the same parameters as Level Trigger 1 Level Trigger 3: Exactly the same parameters as Level Trigger 1 Level Trigger 4: Exactly the same parameters as Level Trigger 1 a. For Enhanced Logging (BZ-7225) templates only. b. Up to four individual trigger settings can be set for non-overlapping time periods of the day. c. Requires license for Sound recording BZ-7226.
218 204 Hand-held Analyzers Types 2250 and 2270 User Manual A.16 Sound Recording Table A.17 Sound Recording parameters a Parameter Values Comment Recording Control Off Automatic Manual Event Exclude Event b External Event Level Trigger Event b Timer Event c All Events b Image Event Determines how recording of the measured signal is controlled Set to Automatic to start the recording when the measurement is started and record throughout the measurement, only limited by the Maximum Duration Set to Manual Event to start recording manually while measuring when the Manual Event pushbutton is pressed, and record until pressing the pushbutton again, however, take Maximum and Minimum Duration into account Set to Exclude Event to start recording manually while measuring when the Backerase pushbutton is pressed, and record until pressing the pushbutton again, however, take Maximum and Minimum Duration into account Set to External Event to start recording using external equipment connected to the Trigger Input Socket Set to Level Trigger Event to record while the level trigger conditions are fulfilled, however, take Maximum and Minimum Duration into account Set to Timer Event (BZ-7225 only) to record while the timer trigger conditions are fulfilled, however, take Maximum and Minimum Duration into account Set to All Events to record while any of the events above are active, however, take Maximum and Minimum Duration into account If you don t want to record the input signal, then set Recording Control to Off, to economise on power For Reverberation Time Software BZ-7227 the values are limited to Off and Automatic. Set to Automatic to make sound recordings during the measurements Set to Image Event (Type 2270 only) to make a recording of 1 s + Pre-recording Time + Post-recording Time
219 APPENDIX A Setup Parameters 205 Table A.17 (Cont.) Sound Recording parameters a Parameter Values Comment Recording Quality Recorded Signal b Automatic Gain Control b Low Fair Medium High Input X-weighted Input C-weighted Input Z-weighted On Off This setup determines the quality of the recording by adjusting the sampling rate. The amount of space required for the recording on the memory card will depend on the selected quality: Quality Sampling Upper Memory freq. freq. Low 8 khz 3 khz 16 KB/s Fair 16 khz 6 khz 32 KB/s Medium 24 khz 10 khz 48 KB/s High 48 khz 20 khz 96 KB/s Use this parameter to select the frequency weighting of the recorded signal Note 1: The frequency weighting of the recorded signal can be selected independently of the frequency weighting of the measurement, the signal at the output socket and the signal at the earphone socket Note 2: X = frequency weighting A or B. A requires that the Broadband (excl. Peak) parameter is set to AC or AZ. B requires that the Broadband (excl. Peak) parameter is set to BC or BZ To ease identification of sound sources, the gain can be automatically adjusted to keep the average level within a 40 db range. When playing back the recorded signal, you will then hear clearly the whole signal content, whether the level has been 20 db or 140 db. Set Automatic Gain Control to On to convert the recorded signal. Set Automatic Gain Control to Off for recording the signal with a fixed gain then set Peak Recording Level to fit the signal Note: If the sound contains very high levels at low frequency, then a fixed gain is recommended
220 206 Hand-held Analyzers Types 2250 and 2270 User Manual Table A.17 (Cont.) Sound Recording parameters a Peak Recording Level 140 db 130 db 120 db 110 db 100 db 90 db 80 db 70 db The recorded signal is stored as a 16-bit wave file, which has a dynamic range of up to 96 db. When playing back on the analyzer, the dynamic range of the output is approx. 75 db. When playing back on a PC it might be even lower. Set Peak Recording Level to fit the signal. The values for Peak Recording Level take the sensitivity of the attached transducer into account. The values shown in the list here are nominal values for a Type 4189 or 4190 microphone. Hint: Monitor the L peak value during a trial measurement before selecting the Peak Recording Level Pre-recording Time b 0 to 110 s Recording is started the Pre-recording Time before the trigger conditions are fulfilled (e.g., 5 s means the recording will be started 5 s before you hit the Manual Event pushbutton). This is possible because the recording is done continuously in an internal buffer, ready to be saved as a wave file. The Pre-recording Time is limited by this buffer size and the Recording Quality: Quality Pre-recording Time limit Low 110 s Fair 50s Medium 30s High 10s Post-recording Time b 0 to 300 s Use this parameter to specify how much extra you want to be recorded after the trigger conditions are no longer fulfilled Duration Limit b Parameter Values Comment Minimum Duration b On Off 00:00:00 to 01:00:00 Use this parameter to enable the Minimum Duration and Maximum Duration parameters for overruling the duration of the sound recording determined by the trigger condition parameters When Duration Limit is On, then Minimum Duration will determine the minimum recording time regardless of the trigger conditions The total record length will then (as a minimum) be the sum of Minimum Duration, Pre-recording Time and Post-recording Time
221 APPENDIX A Setup Parameters 207 Table A.17 (Cont.) Sound Recording parameters a Parameter Values Comment Maximum Duration b 00:00:00 to 01:00:00 a. Requires license for Sound Recording Option BZ b. For Logging (BZ-7224) and Enhanced Logging (BZ-7225) templates only. c. For Enhanced Logging (BZ-7225) templates only. When Duration Limit is On, then Maximum Duration will determine the maximum recording time regardless of the trigger conditions. The total record length will then (as a maximum) be the sum of Maximum Duration, Pre-recording Time and Post-recording Time. Note: If Maximum Duration = 00:00:00, then it is disabled and doesn't limit the duration A.17 Output Socket Signal Table A.18 Output Socket Signal parameters a Parameter Values Comment Source Off Input X-weighted Input C-weighted Input Z-weighted L XF DC Voltage Generator Output to the Output socket on the connector panel. Select between Off and the input signal for monitoring purposes. The L AF setting will output the X-weighted sound level as a voltage between 0 V and 4 V. Use the DC Voltage parameter to calibrate the connected equipment by setting the DC Output. Use Generator parameter to output the signal specified by the Generator settings. Note 1: If you do not want to output the signal, then select Off to economise the power. Note 2: X = frequency weighting A or B. A requires that the Broadband (excl. Peak) parameter is set to AC or AZ. B requires that the Broadband (excl. Peak) parameter is set to BC or BZ. Note 3: The Generator setting is only available for Frequency Analysis templates DC Output (20 mv/db) 0.0 to db Source = DC Voltage will output: 0V for DC Output = 0dB and 4V for DC Output = 200 db
222 208 Hand-held Analyzers Types 2250 and 2270 User Manual Table A.18 (Cont.) Output Socket Signal parameters a Parameter Values Comment Output Gain Input 60.0 db to 60.0 db Output gain of the input signal. Key in a gain value (0.1 db resolution) for the input signal. to assign the new value for immediate response at the output or use the up/down navigation keys to increment/ decrement the value in steps of 1 db. Note: 0 db means 1 V output for 1 V input. a. Not available for Reverberation Time Software BZ A.18 L den Periods Table A.19 L den Periods parameters a Parameter Values Comment Day Start 00:00:00 to 23:59:59 Determines the start of the day period for the L day calculation Evening Start 00:00:00 to 23:59:59 Determines the start of the evening period for the L evening calculation Night Start 00:00:00 to 23:59:59 Determines the start of the night period for the L night calculation Evening Penalty 0 to 20 db The Evening Penalty will be added to L evening when calculating L den Night Penalty 0 to 20 db The Night Penalty will be added to L night when calculating L den a. For Enhanced Logging (BZ-7225) templates only. Note: If Evening Start is set between Night Start and Day Start, then the L evening parameter will be undefined. A.19 Occupational Health Table A.20 Occupational Health Parameters a Parameter Values Comment Exposure Time 00:01:00 to 1.00:00:00 Set the Exposure Time to the actual time that you are exposed to noise during a workday. Used for calculation of L ep,d and L ep,d,v. Note: Exposure Time can be changed after the measurement has been done
223 APPENDIX A Setup Parameters 209 Table A.20 (Cont.) Occupational Health Parameters a Parameter Values Comment Reference Time 00:01:00 to 5.00:00:00 Set the Reference Time as required for calculation of Sound Exposure Level or Time Weighed Average with a reference time other than 8 hours. Used for calculation of L ep,d,v and TWA v Threshold Level 0 to 140 db Any sound levels below the threshold value do not contribute to the Dose measurement data. The time resolution for this calculation is 1 s for calculation of Dose and ProjDose and 10 ms for calculation of TWA, TWA v, DoseUQ and ProjDoseUQ. Used for calculation of Dose, ProjDose, TWA, TWAv, DoseUQ, ProjDoseUQ. U = Time Weighting for Lav: F or S Q = Exchange Rate for Lav: 4, 5 or 6 db Criterion Level 0 to 140 db Criterion Level is the sound level allowed for an 8-hour period and would yield a 100% dose. The criterion level must be set according to the legislation with which you will have to comply. Used for calculation of Dose, ProjDose, DoseUQ, ProjDoseUQ. U = Time Weighting for Lav: F or S Q = Exchange Rate for Lav: 4, 5 or 6 db PeaksOver Level 0 to 200 db Any peak levels that exceed the level set here will be counted. Used for calculation of #XPeaks(>NNNdB) X = A, B, C or Z, set by Setup Input Broadband Peak, NNN is the PeaksOver Level Note: Two other peak counters are preset to count peaks over 135 db and 137 db, respectively Exchange Rate for Lav 4 db 5dB 6dB The increase in noise level that corresponds to a doubling of the noise level is determined by Exchange Rate for Lav. Set Exchange Rate for Lav as required by your local standards. Used for calculation of LavUQ, TWA, TWA v DoseUQ, ProjDoseUQ. U = Time Weighting for Lav: F or S Q = Exchange Rate for Lav: 4, 5 or 6 db Note: TWA and TWA v requires U = S and Q = 5
224 210 Hand-held Analyzers Types 2250 and 2270 User Manual Table A.20 (Cont.) Occupational Health Parameters a Parameter Values Comment Time Weighting for Lav F S Lav will be time weighted in accordance with this parameter. Used for calculation of LavUQ, TWA, TWA v DoseUQ, ProjDoseUQ. U = Time Weighting for Lav: F or S Q = Exchange Rate for Lav: 4, 5 or 6 db Note: TWA and TWA v requires U = S and Q = 5 a. Not available for Reverberation Time Software BZ A.20 Generator Table A.21 Generator Parameters a Parameter Values Comment Generator Type Noise Type Internal External Pink White Set to Internal to use the internal noise generator as specified below. Set to External to switch an external generator on/off using a logic signal: On = 4.5 V; Off = 0 V. The generator signal appears at the Output Socket. Note 1: For Reverberation Time Software BZ-7227, set Measurement Control, Excitation = Interrupted Noise to enable the generator parameters. Note 2: For Frequency Analysis Software BZ-7223, set Output Socket Signal, Source = Generator to enable the generator parameters The type of noise from the internal generator. The bandwidth of the noise will be adjusted to the frequency range from Bottom Frequency to Top Frequency Level [re. 1 V] 60.0 to 0.0 db This sets the internal noise generator attenuation in db, referenced to 1 V. This level stays at the set level irrespective of the frequency range
225 APPENDIX A Setup Parameters 211 Table A.21 (Cont.) Generator Parameters a Parameter Values Comment Sound Source Unknown Type 4292 Optimum Type 4295 Optimum Type 4296 Optimum Type 4292 Flat Type 4295 Flat Type 4296 Flat This setting optimises the frequency response of the internal generator output to the connected sound source. The Flat setting optimises the output for a flat power response, the Optimum setting optimises the power difference between adjacent 1/1- or 1/3-octave bands, while maintaining a boost at low frequencies. Select a type matching your sound source: Type 4292 or 4296 OmniPower Sound Source, or Type 4295 OmniSource Sound Source. Select Unknown if you are using another sound source, or don't want to correct the frequency response Escape Time 0 to 60 s Set the Escape Time to allow the operator to leave the room before the generator is turned on and the measurement starts Build-up Time 1 to 20 s Set the Build-up Time to allow the sound pressure in the room to settle after the sound source is switched on Bottom Frequency b Top Frequency b 50 Hz to Top Frequency Bottom Frequency to 10 khz 1/1-octave: 63 Hz 8 khz 1/3-octave: 50 Hz 10 khz Note: The settings of Bottom and Top Frequency control the bandwidth of the noise from the internal noise generator 1/1-octave: 63 Hz 8 khz 1/3-octave: 50 Hz 10 khz a. Available for Frequency Analysis Software BZ-7223 and Reverberation Time Software BZ-7227 only. b. Available for Frequency Analysis Software BZ-7223 only.
226 212 Hand-held Analyzers Types 2250 and 2270 User Manual A.21 Post-processing Table A.22 Post-processing Parameters a Parameter Values Comment Ensemble Averaging Wide Band RT Bottom Wide Band RT Top No Yes 50 Hz to Wide Band RT Top Wide Band RT Bottom to 10 khz Set to Yes to average each of the position decays into an average decay (called the ensemble average or Room average). The averaged decays of the room can then be displayed in the Decay View. T30 Room, T20 Room and EDT Room will be calculated from the Room average. Set to No for no ensemble averaging. There will be no decays available for the room. T30 Room, T20 Room and EDT Room will be calculated as averages of the T30, T20 and EDT resp. for all the positions b 1/1-octave: 63 Hz 8 khz 1/3-octave: 50 Hz 10 khz The settings of Wide Band RT Bottom and Wide Band RT Top control the range of frequency bands used in the averaging of the wide band parameters available below the Spectrum and Decay graphs. Example: Set Wide Band RT Bottom to 100 Hz and Top to 2 khz, then the average of the frequency bands from 100 Hz to 2 khz will be calculated for the current position as: T30 (100 Hz 2 khz) T20 (100 Hz 2 khz) EDT (100 Hz 2 khz) and for the Room as: T30 Room (100 Hz 2 khz) T20 Room (100 Hz 2 khz) EDT Room (100 Hz 2 khz) 1/1-octave: 63 Hz 8 khz 1/3-octave: 50 Hz 10 khz a. Requires Reverberation Time Software BZ-7227.
227 APPENDIX A Setup Parameters 213 A.22 Tone Assessment Table A.23 Tone Assessment Parameters a Parameter Values Comment Tone Assessment On Off Set Tone Assessment to On to enable tone assessment functionality, then select the Tone parameter above the spectrum to display the results Tone Standard ISO 1996: DM Set the Tone Standard in accordance with your requirements: ISO 1996:2-2007, Annex D is the objective method for assessing the audibility of tones in noise simplified method. This method uses 1/3-octave spectra DM assesses tone using 1/3-octave spectra according to Italian Law: Ministero dell Ambiente, Decreto 16 marzo 1998 Adjustment 0.0 to 20 db This is the adjustment you should add to L Aeq if audible tones are found in the spectrum. The resulting adjustment can be read below the spectrum Note: the adjustment is fixed to 5 db in the DM standard Low Freq. Last Band 12.5 Hz to 315 Hz Set the frequency for the last band of the low frequency range of the assessment. Default is 125 Hz The low frequency range is from the lowest measured frequency band to the value of the Low Freq. Last Band parameter Note: Only available if Tone Standard parameter is set to ISO 1996: Middle Freq. Last Band 160 Hz to 20 khz Set the frequency for the last band of the middle frequency range of the assessment. Default is 400 Hz The middle frequency range is from one band higher than the Low Freq. Last Band parameter to the value of the Middle Freq. Last Band parameter Note: Only available if Tone Standard parameter is set to ISO 1996:2-2007
228 214 Hand-held Analyzers Types 2250 and 2270 User Manual Table A.23 Tone Assessment Parameters a Parameter Values Comment Level Difference Low 0.1 to db Set the required level difference for detecting a tone in the low frequency range. Default is 15 db Note: Only available if Tone Standard parameter is set to ISO 1996: Level Difference Middle 0.1 to db Set the required level difference for detecting a tone in the middle frequency range. Default is 8 db Note: Only available if Tone Standard parameter is set to ISO 1996: Level Difference High 0.1 to db Set the required level difference for detecting a tone in the high frequency range. Default is 5 db Note: Only available if Tone Standard parameter is set to ISO 1996: ISO Free-field 1987 Diffuse-field 2003 Free-field The tone is checked against levels in other frequency bands using normal equal loudness level contours defined by ISO 226. Select here which version of the standard to use Note: Only available if Tone Standard parameter is set to DM a. Requires Tone Assessment Option BZ-7231.
229 215 Appendix B Measurement Parameters This appendix describes the measurement parameters. They are measured in accordance with the setup parameters. Please refer to the Glossary in Appendix E for a description of the parameters. The following letters are substituted in the parameters that follow to represent the wide range of frequency weightings, time weightings and percentile levels available: V = frequency weightings A, B, C or Z (controlled by Setup Frequency Weightings Broadband Peak parameter) X = frequency weightings A or B (controlled by Setup Frequency Weightings Broadband (excl. Peak) parameter) Y = frequency weightings C or Z (controlled by Setup Frequency Weightings Broadband (excl. Peak) parameter) W = frequency weightings A, B, C or Z (controlled by Setup Frequency Weightings Spectrum parameter) U = time weightings F or S (controlled by Setup Statistics Spectral Statistics based on parameter) R = time weightings F or S (controlled by Setup Occupational Health Time Weighting for Lav parameter) Q = exchange rate 4, 5 or 6 db (controlled by Setup Occupational Health Exchange Rate parameter) N = number between 0.1 and 99.9 (controlled by Setup Statistics Percentile N parameter)
230 216 Hand-held Analyzers Types 2250 and 2270 User Manual B.1 Total Measurement B.1.1 For Sound Level Meter Software BZ-7222, Frequency Analysis Software BZ-7223, Logging Software BZ-7224 and Enhanced Logging Software BZ-7225 The following parameters are measured within the Elapsed Time: Equivalent Continuous Sound Levels L Xeq L Yeq L Ceq -L Aeq Sound Exposure Level L XE L YE Peak Sound Level L Vpeak T Vpeak Maximum Time-weighted Sound Levels L XFmax L XSmax L XImax L YFmax L YSmax L YImax Minimum Time-weighted Sound Levels L XFmin L XSmin L XImin L YFmin L YSmin L YImin ISO/EU Occupational Health Parameters L ep,d L ep,d,v E Dose ProjDose #VPeaks (>xxx db)
231 APPENDIX B Measurement Parameters 217 #VPeaks (>137 db) #VPeaks (>135 db) US Occupational Health Parameters L avrq TWA TWA v DoseRQ ProjDoseRQ General Parameters Overload in % Start time Stop Time Elapsed Time (excl. pauses) Time Remaining (for the current measurement, taking available diskspace into account) Special Parameters L XIeq (also called L XIm ) L YIeq L AIeq -L Aeq L AFTeq (also called L AFTm5 ) L AFTeq -L Aeq SIL (average of L Zeq octave band levels: 500 Hz, 1000 Hz, 2000 Hz and 4000 Hz) a PSIL (average of L Zeq octave band levels: 500 Hz, 1000 Hz and 2000 Hz) a SIL3 (average of L Zeq octave band levels: 1000 Hz, 2000 Hz and 4000 Hz) a L Weq (f1-f2) (average of power values for L Weq frequency bands from f1 Hz to f2 Hz) a Noise Indicators b L day L evening L night L den L dn Statistics to Calculate Percentile Levels and Std.Dev. Spectrum Parameters c L Weq L WFmax a. These parameters require license for BZ-7223 and measurement of spectra. b. These parameters are available for Enhanced Logging BZ-7225 only. c. These parameters require license for BZ-7223 and measurement of spectra.
232 218 Hand-held Analyzers Types 2250 and 2270 User Manual L WSmax L WFmin L WSmin Statistics to Calculate Percentile Levels as Spectra a CIC Results CIC 1 Result b CIC 1 Dev. from Reference b CIC 2 Result b CIC 2 Dev. from Reference b CIC 3 Result c CIC 3 Dev. from Reference c CIC 4 Result c CIC 4 Dev. from Reference c B.2 Periodic Reports B.2.1 For Enhanced Logging Software BZ-7225 Parameters measured within a Periodic Report interval: Equivalent Continuous Sound Levels L Xeq L Yeq L Ceq -L Aeq Sound Exposure Level L XE L YE Peak Sound Level L Vpeak T Vpeak Maximum Time-weighted Sound Levels L XFmax L XSmax L XImax L YFmax a. These parameters require license for BZ-7223 and measurement of spectra. b. These parameters are available for Logging BZ-7224 and Enhanced Logging BZ-7225 only. c. These parameters are available for Enhanced Logging BZ-7225 only.
233 APPENDIX B Measurement Parameters 219 L YSmax L YImax Minimum Time-weighted Sound Levels L XFmin L XSmin L XImin L YFmin L YSmin L YImin ISO/EU Occupational Health Parameters L ep,d L ep,d,v E Dose ProjDose #VPeaks (>xxx db) #VPeaks (>137 db) #VPeaks (>135 db) US Occupational Health Parameters L avrq TWA TWA v DoseRQ ProjDoseRQ General Parameters Overload in % Start time Stop Time Elapsed Time (excl. pauses) Special Parameters L XIeq (also called L XIm ) L YIeq L AIeq -L Aeq L AFTeq (also called L AFTm5 ) L AFTeq -L Aeq SIL (average of L Zeq octave band levels: 500 Hz, 1000 Hz, 2000 Hz and 4000 Hz) a PSIL (average of L Zeq octave band levels: 500 Hz, 1000 Hz and 2000 Hz) a
234 220 Hand-held Analyzers Types 2250 and 2270 User Manual SIL3 (average of L Zeq octave band levels: 1000 Hz, 2000 Hz and 4000 Hz) a L Weq (f1-f2) (average of power values for L Weq frequency bands from f1 Hz to f2 Hz) a Statistics to Calculate Percentile Levels and Std.Dev. Spectrum Parameters a L Weq L WFmax L WSmax L WFmin L WSmin The Statistics can be logged in Periodic Reports to Calculate Percentile Levels as spectra a. B.3 Logged Measurement B.3.1 For Logging Software BZ-7224 and Enhanced Logging Software BZ-7225 Parameters measured within a logging interval up to ten (or all) of the following parameters can be logged: Equivalent Continuous Sound Levels L Xeq L Yeq L Ceq -L Aeq Sound Exposure Level L XE L YE Peak Sound Level: L Vpeak Maximum Time-weighted Sound Levels L XFmax L XSmax L XImax L YFmax L YSmax L YImax Minimum Time-weighted Sound Levels a. These parameters require license for BZ-7223 and measurement of spectra.
235 APPENDIX B Measurement Parameters 221 L XFmin L XSmin L XImin L YFmin L YSmin L YImin US Occupational Health Parameters L avrq Special Parameters L XIeq (also called L XIm ) L YIeq L AIeq -L Aeq L AFTeq (also called L AFTm5 ) L AFTeq -L Aeq SIL (average of L Zeq octave band levels: 500 Hz, 1000 Hz, 2000 Hz and 4000 Hz) a PSIL (average of L Zeq octave band levels: 500 Hz, 1000 Hz and 2000 Hz) a SIL3 (average of L Zeq octave band levels: 1000 Hz, 2000 Hz and 4000 Hz) a L Weq (f1-f2) (average of power values for L Weq frequency bands from f1 Hz to f2 Hz) a Voltage updated at approx. 5 s intervals and logged with Logging Period intervals Trig. Input Voltage (requires Trigger Input is set to Voltage for Monitoring) The following parameters are available per set of logged parameters Overload in % Start time Stop Time Elapsed Time (excl. pauses) The Statistics can be logged to calculate Percentile Levels and Std.Dev. per logging interval. Up to three (or all) of the following Spectrum parameters can be logged and displayed on the spectrum display a L Weq L WFmax L WSmax L WFmin L WSmin The Statistics can be logged in Periodic Reports to Calculate Percentile Levels as spectra a. a. These parameters require license for BZ-7223 and measurement of spectra.
236 222 Hand-held Analyzers Types 2250 and 2270 User Manual B.4 Logged (100 ms) Measurement B.4.1 For Logging Software BZ-7224 and Enhanced Logging Software BZ-7225 The following Broadband parameters can be logged every 100 ms L Aeq L AF L AS B.5 Instantaneous Measured Parameters (available at any time) Instantaneous Time-weighted Sound Levels L XF L XS L XI L YF L YS L YI Sound Pressure Levels (maximum time-weighted sound levels once per second) L XF(SPL) L XS(SPL) L XI(SPL) L YF(SPL) L YS(SPL) L YI(SPL) Peak Sound Levels (maximum peak sound level once per second) L Vpeak,1s Voltage updated at approx. 5 s intervals Trig. Input Voltage (requires Trigger Input is set to Voltage for Monitoring) Instantaneous Measured Spectra: a L WF L WS a. These parameters require license for BZ-7223 and measurement of spectra.
237 APPENDIX B Measurement Parameters 223 B.5.1 Processed Parameters for Display Only If Statistics are available, then Std.Dev. and 7 percentile levels can be calculated and displayed: LXN1 or LXUN1 to LXN7 or LXUN7. B.5.2 If spectral statistics are available, then 7 percentile levels as spectra can be calculated and displayed: LWUN1 to LWUN7. If L Weq spectrum is available, then NC, NC Decisive Band, NR, NR Decisive Band, RC, RC Classification, NCB, NCB Classification can be calculated and displayed. If L Weq 1/3-octave spectrum is available, then Loudness and Loudness Level can be calculated and displayed. Relationship Between Setup and Measurement Parameters The measurement parameters are measured in accordance with the setup parameters. The following tables describe the relationship between the setup and measurement parameters: Table B.1 General Parameters Parameter LXeq LXE LXIeq LAFTeq LVpeak TVpeak LXYmax LXYmin Sound Field Correction Windscreen Correction Extended Low Frequency Broadband (excl. Peak) A Broadband Peak Table B.2 Noise Indicators and Statistics Parameter L day L evening L night L den L dn LXYN Sound Field Correction Windscreen Correction Extended Low Frequency Broadband (excl. Peak) A A A A A
238 224 Hand-held Analyzers Types 2250 and 2270 User Manual Table B.2 (Cont.) Noise Indicators and Statistics Parameter L day L evening L night L den L dn LXYN Broadband Statistics based on Percentile N% Day Start Evening Start Night Start Evening Penalty Night Penalty Table B.3 Occupational Health Parameters Parameter L ep,d L ep,d,v E Dose ProjDose #VPeaks (>NNNdB) Sound Field Correction Windscreen Correction Extended Low Frequency LavRQ TWA TWA v Dose- RQ Proj- DoseRQ Broadband (excl. Peak) Broadband Peak A A A A A A A A A A Exposure Time Reference Time Threshold Level
239 APPENDIX B Measurement Parameters 225 Table B.3 Occupational Health Parameters Parameter L ep,d L ep,d,v E Dose ProjDose #VPeaks (>NNNdB) LavRQ TWA TWA v Dose- RQ Proj- DoseRQ Criterion Level Peaks- Over Level Exchange Rate for Lav Time Weighting for Lav 5 5 S S B.6 Reverberation Time Measurement B.6.1 For Reverberation Time Software BZ-7227 The following parameters are measured or calculated at each position: Decays Reverberation Decays (for each frequency band from Bottom Frequency to Top Frequency) based on sampling L Zeq spectra at 5 ms intervals Spectra T30 Spectrum T20 Spectrum EDT Spectrum Single Number Values T30 (Wide Band RT Bottom Wide Band RT Top) T20 (Wide Band RT Bottom Wide Band RT Top) EDT (Wide Band RT Bottom Wide Band RT Top) The following parameters are calculated for the room as an average of all positions: Decays Ensemble Averaged Reverberation Decays (for each frequency band from Bottom Frequency to Top Frequency) Spectra T30 Spectrum T20 Spectrum
240 226 Hand-held Analyzers Types 2250 and 2270 User Manual EDT Spectrum Single Number Values T30 (Wide Band RT Bottom Wide Band RT Top) T20 (Wide Band RT Bottom Wide Band RT Top) EDT (Wide Band RT Bottom Wide Band RT Top) Quality Indicators are given for each frequency band, in each reverberation time spectrum, and for each reverberation time spectrum. Instantaneous Measured Parameters (available at any time) Instantaneous Time-weighted Sound Levels: L AF L CF Instantaneous Measured Spectra: L ZF
241 227 Appendix C Instrument Parameters This appendix describes the parameters that are common to all users of the instrument. C.1 Current Transducer Table C.1 Current Transducer parameters Parameter Values Comment Transducer Used (i.e., connected to Top Socket) (Ch. 1 for Type 2270) Transducer Used (i.e., connected to Top Socket) (Ch. 2 for Type 2270) Name and serial number of transducer Name and serial number of transducer This parameter selects which transducer is connected to the Top Socket (displayed in Setup Input (Type 2250) or Setup Input Ch. 1 (Type 2270) and at the top of Transducers database) Type 2270 only. This parameter selects which transducer is connected to the Top Socket Ch. 2 (displayed in Setup Input Ch. 2 and at the top of Transducers database) Transducer Used (i.e., connected to Rear Socket) (Ch. 1 for Type 2270) Name and serial number of transducer Type 2270 only. This parameter selects which transducer is connected to the Top Socket Ch. 1 (displayed in Setup Input Ch. 1 and at the top of Transducers database)
242 228 Hand-held Analyzers Types 2250 and 2270 User Manual Table C.1 Current Transducer parameters Parameter Values Comment Transducer Used (i.e., connected to Rear Socket) (Ch. 2 for Type 2270) Input (no text is displayed) Name and serial number of transducer Top Socket Rear Socket This parameter selects which transducer is used at Rear Socket (displayed in Setup Input (Type 2250) or Setup Input Ch. 2 (Type 2270) and at the top of Transducers database) Determines whether the input is taken from the top socket, or the rear socket ( Input on connector panel). Connect your transducer to this socket. This parameter is displayed in Setup Input and on the second line of the Transducers database C.2 Transducer Database The Transducer Database consists of a Transducer Setup and a Calibration History one set per transducer. C.2.1 Transducer Setup Table C.2 Transducer Setup parameters Parameter Values Comment Serial No. Text string Insert unique ID for transducer Name Text string Insert name of transducer to display together with serial number Description Text string Insert description of transducer Preamplifier ID No. Text string Document the preamplifier here (Transducer) Family Microphone (Transducer) Family is set to Microphone in this version of the software
243 APPENDIX C Instrument Parameters 229 Table C.2 (Cont.) Transducer Setup parameters Parameter Values Comment Microphone Type A A 90 Unknown If microphone is a known type, then the rest of the parameters of the transducer are set automatically. Sound Field Correction and Windscreen Correction are possible for known microphone types only. Note: Microphone Types 4952 and 4184-A can be used with 0 reference direction or 90 reference direction. For unknown microphone types, set the rest of the parameters no corrections can be made for unknown types Note: If you are unsure which microphone to use, please refer to Overview of Type 2250/ 2270 Microphones, which gives an overview of the microphones, where they can be used and their specifications Nominal Sensitivity Double Set automatically for known type, otherwise set the nominal sensitivity of the microphone in mv/pa Sensitivity Unit mv/pa Can only be mv/pa Polarization Voltage Free-field Type Yes No Yes No Set to No if microphone is prepolarized, otherwise set to Yes for polarization voltage of 200 V (Top Socket only). Set automatically for known Microphone Type Set to Yes for Free-field types, otherwise set to No. Set automatically for known Microphone type Capacitance Double Insert capacitance of microphone in pf. Set automatically for known Microphone type CCLD Yes No Set to Yes for CCLD (Constant Current Line Drive) transducers, otherwise set to No. Set automatically for known Microphone Type. Note: Set Input to Rear Socket. The CCLD input at the Rear socket will automatically be enabled when selecting a transducer requiring CCLD input
244 230 Hand-held Analyzers Types 2250 and 2270 User Manual C.2.2 Calibration History Table C.3 Calibration History parameters Parameter Values Comment 1. Calibration date & Time YYYY-MM-DD hh:mm:ss Initial 1. Sensitivity Double Initial mv/pa 1. Preamplifier ID No. Text string Initial 1. User Text string Initial 1. Input Top Socket, Rear Socket Initial 1. Calibration Type External,Internal Initial 1. Calibrator Serial No. Text string Initial 1. Comment Text string Initial 1. Analyzer Serial No. Text string Initial 2. Calibration date & Time YYYY-MM-DD hh:mm:ss 2. Sensitivity Double 2. Preamplifier ID No. Text string 2. User Text string 2. Input Top Socket, Rear Socket 2. Calibration Type External,Internal 2. Calibrator Serial No. Text string 2. Comment Text string 2. Analyzer Serial No. Text string : : : N. Calibration date & Time YYYY-MM-DD hh:mm:ss Current N. Sensitivity Double Current N. Preamplifier ID No. Text string Current N. User Text string Current N. Input Top Socket, Rear Socket Current N. Calibration Type External,Internal Current N. Calibrator Serial No. Text string Current N. Comment Text string Current N. Analyzer Serial No. Text string Current
245 APPENDIX C Instrument Parameters 231 C.3 Calibration Setup Table C.4 Calibration Setup parameters Parameter Values Comment (Sound Level) Calibrator 4231 Custom Select which calibrator to use Calibration Level (for Custom Sound Level Calibrator) 0.00 to db re 20 µpa Set calibration level for custom calibrator Serial No. for 4231 Text string Serial number will be documented in calibration history Serial No. for Custom Sound Level Calibrator Text string Serial number will be documented in calibration history (Acceleration) Calibrator 4294 Custom Select which calibrator to use Calibration Level (for custom Acceleration Calibrator) 0 to 1000 m/s2 Set calibration level for custom calibrator. Note: When displaying acceleration levels as db the reference will be 1 µm/s2 Serial No. for 4294 Text string Serial number will be documented in calibration history Serial No. for Custom Acceleration Calibrator Text string Serial number will be documented in calibration history Calibration Level (for Direct Input) 0 to 1000 V Set calibration level for Direct Input Note: When displaying voltage levels as db the reference will be 1 µv Serial No. for Direct Input Calibrator Text string Serial number will be documented in calibration history C.4 Type 2250/2270 Microphones Table C.5 Overview of Type 2250/2270 Microphones Microphone Application Optimised For Dynamic Range a Free-field ±1 db Frequency Range Free-field ±2 db Frequency Range 4184-A Weatherproof 200 V Free-field 0 or 90 and Diffuse-field db(a) 3.6 Hz 15.0 khz b 6.6 Hz 22.4 khz 2.5 Hz 16.5 khz b 5.6 Hz 22.4 khz 4189 Standard Prepolarized Free-field and Diffuse-field db(a) 6.8 Hz 22.4 khz b 7.8 Hz 22.4 khz 4.2 Hz 22.4 khz b 6.3 Hz 22.4 khz
246 232 Hand-held Analyzers Types 2250 and 2270 User Manual Table C.5 (Cont.) Overview of Type 2250/2270 Microphones Microphone Application Optimised For Dynamic Range a Free-field ±1 db Frequency Range Free-field ±2 db Frequency Range 4190 Standard 200 V Free-field and Diffuse-field dB(A) 4.0Hz 22.4kHz b 6.7 Hz 22.4 khz 2.6 Hz 22.4 khz b 5.7 Hz 22.4 khz 4191 High Levels 200 V Free-field and Diffuse-field dB(A) 3.6Hz 22.4kHz b 6.6 Hz 22.4 khz 2.5 Hz 22.4 khz b 5.6 Hz 22.4 khz 4193 Low Frequencies Low Frequencies db(a) 0.56 Hz 22.4 khz b db(z) b 6.3 Hz 22.4 khz 0.45 Hz 22.4 khz b 5.5 Hz 22.4 khz 4950 Standard Prepolarized Free-field and Diffuse-field db(a) 4.3 Hz 19.0 khz b 6.3 Hz 19.0 khz 3.2 Hz 20.0 khz b 5.6 Hz 20.0 khz 4952 Outdoor Prepolarized Free-field 0 or 90 and Diffuse-field dB(A) 4.3Hz 14.0kHz b 6.3 Hz 14.0 khz 3.2 Hz 14.5 khz b 5.6 Hz 14.5 khz a. From the typical total inherent noise level for the microphone and Type 2250/2270, to the overload limit for a sinusoidal signal at 1 khz. b. Type 2250/2270 Extended Low Frequency set to On. Detailed specifications for the analyzer together with the different microphones are available. Please contact your local Brüel & Kjær representative if you need more information. The analyzer has correction filters to optimise the frequency response of each microphone. The relevant filter is automatically applied when you select the microphone for input, be it via the top socket, or the rear input socket. Note for Microphone Type 4193: Microphone Type 4193 is delivered with the UC-0211 Adaptor. Do not use UC-0211 together with the analyzer. The adaptor can be used together with other equipment to extend the low frequency range, but when using Microphone Type 4193 together with the analyzer the correction filters are used to do the job. This results in a better dynamic range specification. Using the Adaptor together with the analyzer results in a corrupted low-frequency response and a reduced sensitivity of approximately 16 db
247 233 Appendix D Preferences This appendix describes the unique set of parameters that can be set for each user on the instrument. D.1 Display Settings Table D.1 Display Settings Parameter Values Comment Colour Scheme Arcade Alhambra Indoor Outdoor Night Select between five colour schemes, one optimised for outdoor use in bright conditions and one optimised for very dark conditions For each colour scheme select the optimum choice of brightness for the traffic light and whether the backlight for the pushbuttons should be on or off. In addition, you can also change the number of decimal places on your db results readout. Parameter Values Comment Traffic Light Brightness Key Backlight Off Low Normal High Off On
248 234 Hand-held Analyzers Types 2250 and 2270 User Manual Parameter Values Comment Backlight Brightness Minimum Level 2 Level 3 Level 4 Level 5 Maximum Select backlight brightness using the backlight icon at the bottom of the screen. Maximum level uses the most power Number of Decimal Places 1 2 Select how many decimal places you want in the db results readout, 1 or 2. Note: The setting is for display only and has no effect on the measurement precision or resolution D.2 Power Settings Table D.2 Power Settings Parameter Values Comment Turn off Backlight Turn off Backlight Dim Standby After 10 sec. After 30 sec. After 1 min. After 2 min. After 5 min. Never After 1 min. After 2 min. After 5 min. After 10 min. After 30 min. Never After 1 min. After 2 min. After 5 min. After 10 min. After 30 min. Never Select optimum value for full backlight on (brightness determined by Backlight Brightness) Select optimum value for Backlight Dim period running after the Backlight On period has elapsed. The Backlight Brightness will be at Minimum in the dim period. When Backlight Dim period has elapsed, the backlight is switched off Select optimum value for on period before the instrument is set automatically to standby Note: If the instrument is externally powered, then the settings will be ignored.
249 APPENDIX D Preferences 235 D.3 Regional Settings Table D.3 Regional Settings Parameter Values Comment Decimal Point., Date separator - /. Select your preferred decimal point Select your preferred date separator Date Format Time Zone yyyy-mm-dd HH:mm:ss dd-mm-yyyy HH:mm:ss MM-dd-yyyy HH:mm:ss yy-mm-dd hh:mm:ss XX dd-mm-yy hh:mm:ss XX MM-dd-yy hh:mm:ss XX GMT-12 GMT GMT+13 Select your preferred date format: HH = 24 hour, hh = 12 hour, XX = AM or PM Select the time zone of your region Language English,... A number of different languages are available for your the analyzer. Select your preferred language if it is not in the list, then it might be available for installation using BZ Keyboard United Kingdom, different keyboards. Select your preferred keyboard D.4 Storage Settings Table D.4 Storage Settings Parameter Values Comment Auto-naming of Projects Yes No Select Yes for automatically naming projects from the start date of the project as Year, Month, Date in the format YYMMDD, (e.g., as 2005, November 12th) or No for using the name defined in the Project Name Prefix parameter Project Name Prefix Text string Prefix for automatically generated project name. Maximum 8 characters
250 236 Hand-held Analyzers Types 2250 and 2270 User Manual D.5 Headphone Settings Table D.5 Headphone Settings Parameter Values Comment Listen to signal Automatic Gain Control No Input X-weighted Input C-weighted Input Z-weighted On Off In addition to the commentary annotations, you can listen to the input signal for monitoring purposes. Select one of the A-weighted, B-weighted, C-weighted or Z-weighted signals. Note 1: The frequency weighting of the signal you listen to can be selected independently of the frequency weighting of the measurement, the signal at the output socket and the signal used for sound recording Note 2: X = frequency weighting A or B. A requires that the Broadband (excl. Peak) parameter is set to AC or AZ. B requires that the Broadband (excl. Peak) parameter is set to BC or BZ To ease identification of sound sources, the gain can be automatically adjusted to keep the average level within a 40 db range. When playing back the recorded signal, you will then hear clearly the whole signal content, whether the level has been 20 db or 140 db. Set Automatic Gain Control to On to convert the signal at the headphone output. Set Automatic Gain Control to Off for listening to the signal with a fixed gain
251 APPENDIX D Preferences 237 Parameter Values Comment Gain for Meas.Signal 80.0 db to 60.0 db for Automatic Gain Control set to Off 60.0 db to 0.0 db for Automatic Gain Control set to On Key in a gain value (0.1 db resolution) for the measurement input signal. to assign the new value for immediate response at the output or use the up/down navigation keys to increment/ decrement the value in steps of 1dB. Note: 0 db means 1 V output for 1 V input (Automatic Gain Control set to Off) Gain for Annotations 94.5 db to 0.0 db Key in a gain value (1.5 db resolution) for the commentary annotations. to assign the new value for immediate response at the output or use the up/down navigation keys to increment/ decrement the value in steps of 1.5 db D.6 Users Table D.6 Users Parameter Values Comment Multi User Disabled Enabled Set to Enabled to enable the Multi-user facility, set to Disabled if you are the only user
252 238 Hand-held Analyzers Types 2250 and 2270 User Manual D.7 Printer Settings Table D.7 Printer Settings Parameter Values Comment Printer Used None MPS PCL PCL Inkjet PCL Laser Select None if you don t have a printer connected to the analyzer. Select MPS for a Mobile Pro Spectrum thermal printer from AM-TECH. Select PCL for a printer accepting PCL printer language. Select PCL Inkjet for an inkjet printer accepting PCL language. Select PCL Laser for a laser printer accepting PCL language. See Chapter 8 for more details Top Margin 0.0 to 20.0 cm Use Top Margin to position the print on the paper Left Margin 0.0 to 20.0 cm Use Left Margin to position the print on the paper Width 1.0 to 15.0 cm Use Width to set the size of the print Height 1.4 to 20.0 cm Use Height to set the size of the print D.8 Modem/DynDNS Settings Table D.8 Modem/DynDNS Settings Parameter Values Comment Modem Disabled Auto Answer GPRS/EDGE/HSPA Dialup Set to Disabled if you don't have a modem connected - or when you physically connect or disconnect the modem. Set to Auto Answer if you have a analogue (PSTN), a GSM or a GPRS/EDGE/HSPA modem connected to the Compact Flash socket and you want to dial up the instrument for connection by using BZ Set to GPRS/EDGE/HSPA Dialup if you have a GPRS/EDGE/HSPA modem connected to the Compact Flash socket and you want the instrument to be connected to the Internet. See Chapters 7 and 8 for more details
253 APPENDIX D Preferences 239 Parameter Values Comment Extra Init. <string of characters> If your modem needs extra commands for initialization, they can be defined in Extra Init. Dialup Networking APN <string of characters> Access Point Name is an identifier required by the Network Operator. Examples are Internet, public and Please consult your network operator User Name <string of characters> Set User Name as required by your network operator. Typically this can be left empty Password <string of characters> Set Password as required by your network operator. Typically this can be left empty Domain <string of characters> Set Domain as required by your network operator. Typically this can be left empty DynDNS Active No Yes Set to Yes to make the update of IPaddress at DynDNS.com active. Set to No if you don't use this service. Hostname <string of characters> Set the Hostname defined in your account at DynDNS.com User Name <string of characters> Set the User Name for your account at DynDNS.com. Password <string of characters> Set the Password for your account at DynDNS.com. The password will be displayed until you press Enter, then it will be replaced by ***
254 240 Hand-held Analyzers Types 2250 and 2270 User Manual D.9 Network Settings Table D.9 Network Settings Parameter Values Comment Location Up to 20 characters Use Location to specify a text identifying the analyzer or location of the analyzer. The Location will be displayed on the PC together with the serial number of the analyzer when browsing for analyzers in BZ-5503, and when connected using the on-line display Network Connection Set IP Address None, CF Socket, LAN Socket Automatically, Manually Set to None if no Ethernet CF Card is present in CF Socket (Type 2250 only) Set to CF Socket if Ethernet CF Card is present in CF Socket Set to LAN Socket if you want to use the built-in LAN Socket (Type 2270 only) Set to Automatically to obtain an IP address from a DHCP server - if no server available, then a Link-local address will be set Set to Manually to set the IP address, Subnet Mask and Default Gateway manually IP Address xxx.xxx.xxx.xxx The IP address of the instrument Selectable if Set IP Address = Manually Subnet Mask xxx.xxx.xxx.xxx The Subnet Mask combined with the IP address identifies the network segment the analyzer is on Selectable if Set IP Address = Manually Default Gateway xxx.xxx.xxx.xxx Address to a gateway for routing to another network Selectable if Set IP Address = Manually Set DNS Automatically, Manually Set to Automatically to automatically obtain the DNS Set to Manually to set the DNS Preferred DNS xxx.xxx.xxx.xxx The IP address of the primary DNS server
255 APPENDIX D Preferences 241 Parameter Values Comment Alternate DNS xxx.xxx.xxx.xxx The IP address of the secondary DNS server Name Up to 32 characters Name (SSID) of network you want to connect to. Update the name either by entering a name directly, or by tapping on the Available Networks and selecting a name from the list Security Encryption Open Shared WPA PSK WPA2 PSK None WEP Enabled AES Enabled TKIP Enabled Select security as required by the network Open and Shared are for WEP (Wired Equivalent Privacy) Infrastructure mode WPA PSK is for WPA (Wi-Fi Protected Access) with Pre-shared Key (also called Personal mode) WPA2 PSK WPA2 is an enhanced version of WPA Select Encryption as required by the network None is for Open security WEP Enabled is for Open and Shared security. AES and TKIP Enabled are for WPA PSK and WPA2 PSK Encryption Key Up to 32 characters Insert the encryption key required by the network. The key will be displayed until you press Enter, then it will be replaced by *** D.10 Notification Settings Table D.10 Notification settings Parameter Values Comment Notification Alarm Settings Internal Battery Disabled, , SMS High, Low, Critical Set to Disabled to disable notifications. Set to to send notifications as when an alarm occurs. Set to SMS to send notifications as SMS when an alarm occurs. See Section 8.4 for the list of alarm types A notification is sent, if internal battery enters the set state
256 242 Hand-held Analyzers Types 2250 and 2270 User Manual Parameter Values Comment Trigger Input Voltage 20.0 V to V A notification is sent, if voltage level at trigger input drops to or below this setting. Note: This alarm requires Setup, Input, Trigger Input is set to Voltage for Monitoring Disk Space 0 % to 100 % A notification is sent, if free disk space drops to or below this setting Level Trigger Events Disabled Enabled A notification is sent, if Level Trigger (specified in Setup, Level Trigger in Logging or in Setup, Triggers in Enh. Logging) is exceeded To <string of characters> The address of the recipient of the . Example: recipient@gmail.com SMTP <string of characters> Name of SMTP (Simple Mail Transfer Protocol) Server. *) Examples: gmail: smtp.gmail.com hotmail: smtp.live.com SMTP Port 0 to Port used by SMTP Server. *) Typically this is 25, but for gmail and hotmail it is 587 SSL/TLS No, Yes Secure Socket Layer/Transport Layer Security. Set to Yes if required by provider *), otherwise No. SSL/TLS is required by gmail and hotmail Account <string of characters> The account is typically the address of the used for sending the . *) Examples: myaddress@gmail.com myaddress@hotmail.com User Name <string of characters> The User Name is typically the address of the used for sending the . *) Examples: myaddress@gmail.com myaddress@hotmail.com If the account is part of a domain, then it might be necessary to specify the domain as part of the user name Example: Domain\UserName Password <string of characters> Insert the password required for the account.*) The password will be displayed until you press <Enter>, then it will be replaced by ***
257 APPENDIX D Preferences 243 SMS Parameter Values Comment Active No, Yes Set to Yes to activate the first phone number, otherwise set to No Name <string of characters> Name identifying first phone number Phone Number Number The number of the first SMS recipient Active No, Yes Set to Yes to activate the second phone number, otherwise set to No Name <string of characters> Name identifying second phone number Phone Number Number The number of the second SMS recipient *) Please consult your provider D.11 Web Server Settings Table D.11 Web Server Settings Parameters Parameter Values Comment Web Server Disabled Enabled Set Web Server to Enabled to enable display and control of the analyzer on a web page - see Section 7.4. Set to Disabled to disable the web server functionality User Name <string of characters> Define the user name required for full access to the web page, i.e., view and control of the instrument. Default: admin Password <string of characters> Define the password required for full access to the web page. The password will be displayed until you press <Enter>, then it will be replaced by ***. Default: admin Guest Login Required Yes No Set to Yes to require user name and password for login to the guest web page. Set to No for free access to the guest web page. Guest User Name <string of characters> Define the user name required for limited access to the web page, i.e. view of the instrument only Default: guest
258 244 Hand-held Analyzers Types 2250 and 2270 User Manual Parameter Values Comment Guest Password <string of characters> Define the password required for limited access to the web page. The password will be displayed until you press <Enter>, then it will be replaced by *** Default: guest Note: The web server parameters are common to all users of the instrument. D.12 Image Settings (Type 2270 only) Table D.12 Image Settings (Type 2270 only) Parameter Values Comment Image Control View Finder Manual Event Set to View Finder to use the View Finder together with the Manual Event key to capture an image. The image can then be saved or rejected after capture Set to Manual Event to capture and save the image each time you press the Manual Event key
259 245 Appendix E Glossary A-weighting filter: B-weighting filter: C-weighting filter: Criterion Level: Decibel (db): Frequency weighting corresponding approximately to the 40 db equal loudness curve, that is to say, the human ear s response at low to medium sound levels. It is by far the most commonly applied frequency weighting and is used for all levels of sound. Frequency weighting corresponding approximately to the 70 db equal loudness curve, that is to say, the human ear s response at medium sound levels. Frequency weighting corresponding to the 100 db equal loudness curve, that is to say, the human ear s response at fairly high sound levels. Mainly used when assessing peak values of high sound pressure levels. Criterion Level is the maximum averaged sound level allowed for an 8-hour period. Used for calculation of Dose, ProjDose, DoseUQ and ProjDoseUQ, where U = F or S and Q = 4, 5 or 6 db. The measurement unit for expressing the relative intensity of sound. A direct application of linear scales (in Pa) to the measurement of sound pressure leads to large and unwieldy numbers. As the ear responds logarithmically rather than linearly to stimuli, it is more practical to express acoustic parameters as a logarithmic ratio of the measured value to a reference value. This logarithmic ratio is called a decibel or db. The advantage of using db can be clearly seen in the below illustration. Here, the linear scale with its large numbers is converted into a manageable scale from 0 db at the threshold of hearing (20 Pa) to 130 db at the threshold of pain ( 100 Pa).
 using Exchange Rate = 3 for an 8")
260 246 Hand-held Analyzers Types 2250 and 2270 User Manual Our hearing covers a surprisingly wide range of sound pressures a ratio of over a million to one. The db scale makes the numbers manageable Dose, ProjDose: The Noise Dose is the equivalent averaged A-weighted Noise Level (taking the Threshold Level into account) using Exchange Rate = 3 for an 8 hour period (reference duration) relative to the maximum allowed (the Criterion Level) expressed in percentage. Example: If the Criterion Level is 85 db and a person is exposed to a constant sound pressure level of 85 db for 8 hours, then the Dose is 100%. A constant level 88 db results in a Dose of 200% and a constant level of 82 db results in a dose of 50%. The Projected Dose is the Noise Dose based on measurement duration less than 8 hours, assuming the sound level for the remaining time stays the same.
USER MANUAL. Hand-held Analyzer Types 2250 and 2270
 USER MANUAL Hand-held Analyzer Types 2250 and 2270 With Sound Level Meter Software BZ-7222, Frequency Analysis Software BZ-7223, Logging Software BZ-7224, Enhanced Logging Software BZ -7225, Signal Recording
Technical Documentation
 Technical Documentation Microphone Type 4964 for Hand-held Analyzer Types 2250, 2250-L and 2270 Supplement to Instruction Manual BE 1712 English BE 1864 11 Microphone Type 4964 for Hand-held Analyzer
Technical Documentation
 Technical Documentation Building Acoustics Software BZ-7228 and Dual-channel Building Acoustics Software BZ-7229 for use with Hand-held Analyzer Type 2250 and Hand-held Analyzer Type 2270 User Manual English
Precision Integrating Sound Level Meter
 Precision Integrating Sound Level Meter Type 2236 A 009 Type 2236 B 009 Type 2236 C 009 Type 2236 D 009 With software version 2.1 or higher Revision November 1996 Brüel & Kjær BB0909 13 Trademarks IBM
2260 INVESTIGATOR MODULAR PRECISION SOUND ANALYZER WITH APPLICATION SOFTWARE BZ 7210, BZ 7203, BZ 7204, BZ 7205, BZ 7206, BZ 7207, BZ 7208
 BF0213-11_Original_26-35.qxd 16-12-2003 08:52 Page 30 2260 INVESTIGATOR MODULAR PRECISION SOUND ANALYZER WITH APPLICATION SOFTWARE BZ 7210, BZ 7203, BZ 7204, BZ 7205, BZ 7206, BZ 7207, BZ 7208 Where Do
USER MANUAL. Building Acoustics Software BZ for use with Hand-held Analyzer Types 2250 and BE English
 USER MANUAL Building Acoustics Software BZ-7228 for use with Hand-held Analyzer Types 2250 and 2270 BE 1799 18 English Building Acoustics Software BZ-7228 for use with Hand-held Analyzer Types 2250 and
PRODUCT DATA. Hand-held Sound Intensity System Type 2270-G Sound Intensity Software BZ-7233 Sound Intensity Probe Kit for 2270 Type 3654
 PRODUCT DATA Hand-held Sound Intensity System Type 2270-G Sound Intensity Software BZ-7233 Sound Intensity Probe Kit for 2270 Type 3654 Portable and battery operated, Hand-held Sound Intensity System Type
QUANTUM Qflash T2 / X2 OPERATING INSTRUCTIONS
 QUANTUM Qflash T2 / X2 OPERATING INSTRUCTIONS 1.0 DESIGNATIONS T2 AND X2 1. Removable Reflector, two positions Normal and Wide angle. 2. Flash-tube 2A. Modeling Lamp (for Model X2 only) 3. Bounce Head,
PRODUCT DATA. FFT Analysis Software BZ-7230 and Tone Assessment Option BZ-7231 for use with Hand-held Analyzers Types 2270 and 2250
 Frequency analysis based on the Fast Fourier Transform (FFT) algorithm is the tool of choice for measurement and diagnostics of machinery noise and vibration. The frequency profile of a machine is its
Nikon D7100 Camera Kit. -Checklist and Operations Manual-
 Airborne Digital Reconnaissance System (ADRS) Nikon D7100 Camera Kit -Checklist and Operations Manual- V4.2 October 21, 2014 National Headquarters, Civil Air Patrol 2 1.0 Equipment Pre-Mission Check 1.1
GFL-1000 User Manual Ground Fault Locator
 GFL-Series User Manual V1.1 GFL-1000 User Manual Ground Fault Locator Contents Contents... 1 1 Declaration of Conformity... 3 2 Introduction... 3 3 Equipment Information... 3 3.1 Safety Precautions...
QUANTUM Qflash MODEL T OPERATING INSTRUCTIONS
 QUANTUM Qflash MODEL T OPERATING INSTRUCTIONS 1.0 DESIGNATIONS 1. Removable Reflector, two positions Normal and Wide angle. 2. Flash-tube 3. Bounce Head, Rotates 180º 4. Swivel Head, Rotates ± 90º 5. Sensor
PRODUCT DATA. Noise Monitoring Terminal Types 3639-A and 3639-B
 PRODUCT DATA Noise Monitoring Terminal Types 3639-A and 3639-B Noise Monitoring Terminal Types 3639-A and B are optimised for outdoor use. With a small, customdesigned enclosure, the NMTs are designed
PRODUCT DATA. Uses, Benefits and Features
 PRODUCT DATA Hand held Analyzer Type 2270 S for Sound Intensity Measurements with Sound Intensity Software BZ 7233 and Sound Intensity Probe Kit for 2270 Type 3654 Portable and battery operated, Hand held
PRODUCT DATA. PULSE Multichannel Sound Power Type 7748 Version 1.2
 PRODUCT DATA PULSE Multichannel Sound Power Type 7748 Version 1.2 Multichannel Sound Power offers the easiest way yet to measure sound power and other important sound characteristics of products according
P R O D U C T D A T A
 P R O D U C T D A T A PULSE Acoustic Material Testing in a Tube Type 7758 PULSE Acoustic Material Testing in a Tube Type 7758 is software for determining the acoustical properties of noise control materials
BATTERY GRIP INSTRUCTION MANUAL
 BG-D700 BG-D90 BATTERY GRIP INSTRUCTION MANUAL Product Diagram 1- Contact Cap 2- Holder for Nikon dslr Signal Contact Cover 3- Signal Contacts 4- Auto-Focus Button 5- Main Control Dial 6- Multi-Selector
OWNER S MANUAL FM HANDHELD TRANSCEIVER
 , OWNER S MANUAL RPU4200A FM HANDHELD TRANSCEIVER NOTE, OWNER S MANUAL RPU4200A FM HANDHELD TRANSCEIVER We are very grateful for your purchasing brand twoway radios produced by Relm Wireless Corporation.
Table 1. Placing the Sensor in the Sensor Cradle. Step Instruction Illustration
 Table 1. Placing the Sensor in the Sensor Cradle Step Instruction Illustration 1. A. Check "U-shaped" Positioner. The number pointing towards the Sensor (1 or 2) must correspond with the Sensor's size.
HP Designjet HD Scanner and T1200 HD Multifunction Printer
 HP Designjet HD Scanner and T1200 HD Multifunction Printer Introductory information USB 2.0 high-speed certified Introductory Information Other sources of information The User s Guide for your scanner
impact VC-500LR Monolight INSTRUCTIONS
 impact lighting equipment and accessories VC-500LR Monolight INSTRUCTIONS Congratulations on your purchase of the Impact VC-500LR Monolight. We feel that it will contribute much to your photographic skill
PRODUCT DATA. Noise Monitoring Terminals Types 3597 C, 3637 A/B and 3631
 PRODUCT DATA Noise Monitoring Terminals Types 3597 C, 3637 A/B and 3631 Brüel & Kjær Noise Monitoring Terminal (NMT) Type 3597 is for external use, in all climatic environments, and is a component of an
PRODUCT DATA. Sound Intensity Calibrator Type Uses and Features
 PRODUCT DATA Sound Intensity Calibrator Type 4297 Sound Intensity Calibrator Type 4297 is used for on site sound pressure calibration and pressure residual intensity index verification. Its most important
1. ASSEMBLING THE PCB 2. FLASH THE ZIP LEDs 3. BUILDING THE WHEELS
 V1.0 :MOVE The Kitronik :MOVE mini for the BBC micro:bit provides an introduction to robotics. The :MOVE mini is a 2 wheeled robot, suitable for both remote control and autonomous operation. A range of
The ideal K-12 science microscope solution. User Guide. for use with the Nova5000
 The ideal K-12 science microscope solution User Guide for use with the Nova5000 NovaScope User Guide Information in this document is subject to change without notice. 2009 Fourier Systems Ltd. All rights
PRODUCT DATA. Noise Monitoring Terminal Plus Type 3639-E Noise Monitoring Terminal Advanced Type 3639-G. Uses and Features
 PRODUCT DATA Noise Monitoring Terminal Plus Type 3639-E Type 3639-G Noise Monitoring Terminals Type 3639 are a range of powerful, modular, noise monitoring terminals, optimised for outdoor use. With a
Fluke 123/124 Industrial ScopeMeter
 Fluke 123/124 Industrial ScopeMeter Getting started GB Sep 2002 2002 Fluke Corporation, All rights reserved. Printed in The Netherlands All product names are trademarks of their respective companies. 1
PRODUCT DATA. Noise Monitoring Terminal Plus Type 3639-E Noise Monitoring Terminal Advanced Type 3639-G
 PRODUCT DATA Noise Monitoring Terminal Plus Type 3639-E Type 3639-G Noise Monitoring Terminals Type 3639 are a range of powerful, modular, noise monitoring terminals, optimised for outdoor use. With a
DS1000E, DS1000D Series Digital Oscilloscope
 Quick Guide RIGOL Publication Number QGA07115-1110 May 2013 DS1000E, DS1000D Series Digital Oscilloscope DS1102E, DS1052E, DS1102D, DS1052D 2008 RIGOL Technologies, Inc. All Rights Reserved Copyright
SC420. Sound Level Meter Spectrum Analyser USER MANUAL. M_SC420_v0014_ _ENG
 SC420 Sound Level Meter Spectrum Analyser USER MANUAL M_SC420_v0014_20150522_ENG Since its beginnings in Barcelona in 1969, has been devoted to manufacturing sound equipment and instrumentation through
Portable Multi-Channel Recorder Model DAS240-BAT
 Data Sheet Portable Multi-Channel Recorder The DAS240-BAT measures parameters commonly found in process applications including voltage, temperature, current, resistance, frequency and pulse. It includes
PRODUCT DATA. Uses and Features
 PRODUCT DATA Sound Sources for Building Acoustics: OmniPower Sound Source Type 4292, OmniSource Sound Source Type 4295, Tapping Machine Type 3207, and Power Amplifiers Type 2734-A and 2734-B For proper
Register your product and get support at AE5430. EN User manual
 Register your product and get support at www.philips.com/welcome AE5430 User manual Concents 1 Important 4 Hearing Safety 4 English 2 Your FM/DAB+ radio 5 Introduction 5 What s in the box 5 Overview of
reference guide reference guide reference guide
 hp photosmart 240 series reference guide reference guide reference guide contents 1 welcome..................................... 1 find more information.............................. 1 what s in the box.................................
Fluke 125. Getting Started. Industrial ScopeMeter
 Fluke 125 Industrial ScopeMeter Getting Started GB Dec 2006, Rev. 1, 09/2009 2006, 2009 Fluke Corporation, All rights reserved. Printed in The Netherlands All product names are trademarks of their respective
PRODUCT DATA. Sound Intensity Probe Kit Type 3599 including Sound Intensity Microphone Pair Type 4197 and Dual Preamplifier Type 2683
 PRODUCT DATA Sound Intensity Probe Kit Type 3599 including Sound Intensity Microphone Pair Type 4197 and Dual Preamplifier Type 2683 Type 3599 is a two-microphone probe kit for measuring sound intensity.
PRODUCT DATA. Sound Intensity Probe Kit for 2260 Type 3595 Sound Intensity Microphone Pair Type 4197 Dual Preamplifier Type 2683
 PRODUCT DATA Sound Intensity Probe Kit for 2260 Type 3595 Sound Intensity Microphone Pair Type 4197 Dual Preamplifier Type 2683 Type 3595 is a two-microphone probe kit for measuring sound intensity. Specially
PRODUCT DATA. Sound Intensity Calibrator Type 4297
 PRODUCT DATA Sound Intensity Calibrator Type 4297 Sound Intensity Calibrator Type 4297 is used for on-site sound-pressure calibration and pressure-residual intensity-index verification. Its most important
Two-Way Radios. Quick Start Guide. XT460 Display model
 Two-Way Radios Quick Start Guide XT460 Display model CONTENTS Contents..................................... 1 Safety....................................... 2 Batteries and Chargers Safety Information........
INSTALLATION, OPERATION AND MAINTENANCE GUIDE
 INSTALLATION, OPERATION AND MAINTENANCE GUIDE FOR INDOOR/OUTDOOR SINGLE PHASE ENCAPSULATED TRANSFORMERS Indoor/Outdoor Encapsulated Transformers The pictures used in this guide are only a representation
FAST TRACK READ ME FIRST! FAST TRACK E300 A Quick-Start Guide to Installing and Using Your COOLPIX 300. Contents. Nikon View... 25
 READ ME FIRST! FAST TRACK FAST TRACK E300 A Quick-Start Guide to Installing and Using Your COOLPIX 300 Contents Checklist Before you begin... 2 Using the COOLPIX 300... 4 GETTING TO KNOW YOUR COOLPIX 300...
SoundCheck 11 Quick Start Guide
 Software Install Basics Upgrading From an Earlier Version If you are upgrading from an earlier version of SoundCheck 11.1 (or Beta version) you should copy the old installation folder and name it "SoundCheck
Electrical Safety Tester
 Electrical Safety Tester GPT-9600 Series QUICK START GUIDE GW INSTEK PART NO. 82PT-96030MA1 ISO-9001 CERTIFIED MANUFACTURER This manual contains proprietary information, which is protected by copyright.
TMP40. User Manual.
 TMP40 User Manual www.audac.eu ADDITIONAL INFORMATION This manual is put together with much care, and is as complete as could be on the publication date. However, updates on the specifications, functionality
PRODUCT DATA. Applications. Uses
 PRODUCT DATA Impedance Tube Kit (50 Hz 6.4 khz) Type 4206 Impedance Tube Kit (100 Hz 3.2 khz) Type 4206-A Transmission Loss Tube Kit (50 Hz 6.4 khz) Type 4206-T Brüel & Kjær offers a complete range of
Headset Intercom System. Operating Instructions
 Headset Intercom System Model C1025 Operating Instructions Headset and Transceiver Pack Base Station Model C1025 Table of Contents Intended Use...iii FCC Information...iii Service...iii System Descriptions...1
CEL63x Sound Level Meter CEL630, CEL631, CEL632, CEL633 Class 1 or Class 2. Integrating. Advanced Logging. Audio Recording
 CEL63x Sound Level Meter CEL630, CEL631, CEL632, CEL633 Class 1 or Class 2. Integrating. Advanced Logging. Audio Recording Environmental Noise Boundary noise assessments Noise nuisance complaints Measurements
MRI SIMULATOR PST OPERATOR MANUAL
 MRI SIMULATOR PST-100355 OPERATOR MANUAL MRI Simulator Operator Manual PST-100444 Rev 7 Copyright Copyright 2012 Psychology Software Tools, Inc. All rights reserved. The information in this document is
DS1000B Series Digital Oscilloscope
 Quick Guide RIGOL Publication number QGA04116-1110 Aug. 2016 DS1000B Series Digital Oscilloscope DS1074B, DS1104B, DS1204B All Rights Reserved Copyright All Rights Reserved. RIGOL products are protected
MXL USB.006.
 MXL USB.006 www.mxlmics.com Congratulations on your purchase of the MXL USB.006 which uses a large 32mm gold diaphragm capsule for added warmth. MXL microphones are the result of world-class engineering
A510S Operation Manual
 A510S Operation Manual REV 1.1 1 Table of Contents 1 General Information 1-1 Description 1-2 Potential Operational Hazards 1-3 Technical Specifications 1-4 Instrument Overview 1-5 Function Summary 2 How
Jarvis standing desk. Assembly instructions. For assembly assistance, visit fully.com/howtojarvis or call or
 Jarvis standing desk Assembly instructions For assembly assistance, visit fully.com/howtojarvis or call 888-508-3725 or email support@fully.com Thank you for choosing a Jarvis desk from Fully. Cautions
RIGOL. Quick Guide. DG2000 Series Function/Arbitrary Waveform Generator. Sept RIGOL Technologies, Inc.
 Quick Guide DG2000 Series Function/Arbitrary Waveform Generator Sept. 2010 RIGOL Technologies, Inc. Guaranty and Declaration Copyright 2010 RIGOL Technologies, Inc. All Rights Reserved. Trademark Information
Always there to help you. Register your product and get support at AJ7045D. Question? Contact Philips.
 Always there to help you Register your product and get support at www.philips.com/welcome Question? Contact Philips AJ7045D User Manual Contents 1 Important 3 Risk of swallowing batteries 3 2 Your clock
Installing and Upgrading Internal Modules in Cisco 1800 Series Routers (Modular)
") CHAPTER Installing and Upgrading Internal Modules in Cisco 800 Series Routers (Modular) This chapter describes how to install or upgrade modules that are located internally within the Cisco 800 series
CHAPTER Installing and Upgrading Internal Modules in Cisco 800 Series Routers (Modular) This chapter describes how to install or upgrade modules that are located internally within the Cisco 800 series
Professional UHF Rechargeable Wireless Microphone System POWER ON/OFF BATTERY CHARGE. Green Light (Full) Better Music Builder DOWN VOLUME
 Better Music Builder DOWN VOLUME") Green Light (Full) KARAOKE Professional UHF Rechargeable Wireless Microphone System VM-93C Operating Instructions UHF Frequency 64 Selectable POWER ON/OFF CHARGE Better Music Builder VM-93C CHARGER UHF
Green Light (Full) KARAOKE Professional UHF Rechargeable Wireless Microphone System VM-93C Operating Instructions UHF Frequency 64 Selectable POWER ON/OFF CHARGE Better Music Builder VM-93C CHARGER UHF
User s Guide. RP7000 Series Active Probe. Dec RIGOL Technologies, Inc.
 User s Guide RP7000 Series Active Probe Dec. 2012 RIGOL Technologies, Inc. Guaranty and Declaration Copyright 2011 RIGOL Technologies, Inc. All Rights Reserved. Trademark Information RIGOL is a registered
F400 QUICK-START GUIDE
 F400 QUICK-START GUIDE PLEASE READ THIS DOCUMENT BEFORE OPERATING YOUR PRINTER Revision 10-1/31/18 Page 1 Table of Contents 1. Introduction... 3 2. What s in the Box... 3 3. Unboxing Your F400... 4 4.
Comfort Contego User Manual
 hearing Comfort Contego User Manual Please read the user manual before using this product. UK Comfort Contego T800 Transmitter Comfort Contego R800 Receiver Contents Page Introduction - 5 This is included
Start Here. Installing your Microtek ScanMaker 9800XL Plus PC:
 Start Here Installing your Microtek ScanMaker 98XL Plus Step : Unpack Contents. Optional package items depend on the scanner configuration that you purchased. Unpack your scanner package and check for
PRODUCT DATA. 16-channel DeltaTron Conditioning Amplifiers Types 2694-A/B/C/D. Features and Uses
 PRODUCT DATA 16-channel DeltaTron Conditioning Amplifiers s -A/B/C/D The family of 16-channel DeltaTron conditioning amplifiers comprises of general signal- conditioning amplifiers for voltage and DeltaTron
PRODUCT DATA. Sound Intensity Probe Kit Type 3599 Sound Intensity Microphone Pair Type 4197 Dual Preamplifier Type 2683
 PRODUCT DATA Probe Kit Type 3599 Microphone Pair Type 4197 Dual Preamplifier Type 2683 Type 3599 is a two-microphone probe kit for measuring sound intensity. Specially designed for use with Brüel & Kjær
Advanced Test Equipment Rentals ATEC (2832)
") Established 1981 Advanced Test Equipment Rentals www.atecorp.com 800-404-ATEC (2832) A.H. Systems Model Active Monopole Antennas Active Monopole Antenna Series Operation Manual 1 TABLE OF CONTENTS INTRODUCTION
Established 1981 Advanced Test Equipment Rentals www.atecorp.com 800-404-ATEC (2832) A.H. Systems Model Active Monopole Antennas Active Monopole Antenna Series Operation Manual 1 TABLE OF CONTENTS INTRODUCTION
HP Photosmart R740 series Digital Camera. User Guide
 HP Photosmart R740 series Digital Camera User Guide Legal and notice information Copyright 2007 Hewlett-Packard Development Company, L.P. The information contained herein is subject to change without notice.
Enlarging Meter - Timer Instruction Manual DLGelectronics.com. Enlarging Meter - Timer
 Enlarging Meter - Timer 1 1 CONTENTS 1 Contents... 2 2 Important Note... 3 3 Introduction... 4 4 Setting Up the Enlarging Meter-Timer... 5 4.1 Precautions... 5 4.2 Connections... 5 4.2.1 Power Connections...
EPA152/252/502. User Manual.
 EPA152/252/502 User Manual www.audac.eu ADDITIONAL INFORMATION This manual is put together with much care, and is as complete as could be on the publication date. However, updates on the specifications,
Brunata Optuna H Ultrasonic energy meter Type 775 Installation Guide Edition 1.2
 Ultrasonic energy meter Type 775 Installation Guide Edition 1.2 UK-QB101575 / 29.05.2012 Brunata a/s is a Danish owned company. We have more than 90 years of experience within developing and producing
SL-6 Powering and Wireless System for the 688. User Guide
 SL-6 Powering and Wireless System for the 688 User Guide Legal Notices Product specifications and features are subject to change without prior notification. Copyright 2015 Sound Devices, C. All rights
Table of Contents. HP Z3100 Printer Installation Guide. Contact information... 2
 Table of Contents Contact information... 2 Introduction to HP Z3100... 3 Safety Precautions... 3 Overview of the printer s Features... 3 Installation... 3 Unpacking the Printer... 3 Mounting the Printer...
CAST Application User Guide
 CAST Application User Guide for DX900+ Electromagnetic Multilog Sensor U.S. Patent No. 7,369,458. UK 2 414 077. Patents Pending 17-630-01-rev.b 05/24/17 1 Copyright 2017 Airmar Technology Corp. All rights
Harmony Remote Repair
 Harmony Remote Repair harmonyremoterepair.com How to install your new Harmony One Front Cover/Touch Screen Important! Before you begin working on your Harmony One, you must discharge any static electricity
Iphone 5 Glass/Lcd REPAIR GUIDE. Version Edition
 Iphone 5 Glass/Lcd REPAIR GUIDE Version 1 2016 Edition IPhone 5 Glass/LCd REPAIR GUIDE RiAna Soto Repair Training Specialist rsoto@cellairis.com FOR EVERY REPAIR MAKE SURE TO COMPLETE, INITIAL, AND HAVE
ROTATING SYSTEM T-12, T-20, T-50, T- 150 USER MANUAL
 ROTATING SYSTEM T-12, T-20, T-50, T- 150 USER MANUAL v. 1.11 released 12.02.2016 Table of contents Introduction to the Rotating System device 3 Device components 4 Technical characteristics 4 Compatibility
INSTRUCTION MANUAL FM HANDHELD TRANSCEIVER
 INSTRUCTION MANUAL PT558 FM HANDHELD TRANSCEIVER NOTE INSTRUCTION MANUAL PT558 FM HANDHELD TRANSCEIVER We are very grateful for your purchasing brand twoway radios produced by Kirisun Electronics (Shenzhen)
ID station Photomatic
 Version 7.3 Last change : August 2016 Page 1 Introduction This is the of, the most reliable and fastest biometric passport photo system. This user guide helps you in everyday use. Please check www.idstation.eu
Vinyl Cutter Instruction Manual
 Vinyl Cutter Instruction Manual 1 Product Inventory Inventory Here is a list of items you will receive with your vinyl cutter: Product components (Fig.1-4): 1x Cutter head unit complete with motor, plastic
User guide ProHead Plus
 User guide ProHead Plus For other languages visit: /support ProHead Plus 2 Congratulations on your new Profoto product! Thanks for showing us your confidence by investing in a ProHead unit. For more than
Safety Warnings Features Specifications Instrument Layout Operation Preparation AC Current Measurement How to Use Peak Hold Function How to Use The
 Safety Warnings Features Specifications Instrument Layout Operation Preparation AC Current Measurement How to Use Peak Hold Function How to Use The Frequency Selector Switch How to Use Data Hold Function
2015 RIGOL TECHNOLOGIES, INC.
 Service Guide DG000 Series Dual-channel Function/Arbitrary Waveform Generator Oct. 205 TECHNOLOGIES, INC. Guaranty and Declaration Copyright 203 TECHNOLOGIES, INC. All Rights Reserved. Trademark Information
STRUCTURE SENSOR QUICK START GUIDE
 STRUCTURE SENSOR 1 TABLE OF CONTENTS WELCOME TO YOUR NEW STRUCTURE SENSOR 2 WHAT S INCLUDED IN THE BOX 2 CHARGING YOUR STRUCTURE SENSOR 3 CONNECTING YOUR STRUCTURE SENSOR TO YOUR IPAD 4 Attaching Structure
Always there to help you. Register your product and get support at AJ3200. Question? Contact Philips.
 Always there to help you Register your product and get support at www.philips.com/support Question? Contact Philips AJ3200 User manual Contents 1 Important 2 Safety 2 2 Your clock radio 3 Introduction
PRODUCT DATA. BZ-7229 software turns Type 2270 into a dual-channel building acoustics analyzer (2270-K).
.") PRODUCT DATA Hand-held Analyzers Type 2250 and Type 2270, with Building Acoustics Software BZ-7228, Dual-channel Building Acoustics Software BZ-7229 and Qualifier Type 7830 Building Acoustics is the assessment
PRODUCT DATA Hand-held Analyzers Type 2250 and Type 2270, with Building Acoustics Software BZ-7228, Dual-channel Building Acoustics Software BZ-7229 and Qualifier Type 7830 Building Acoustics is the assessment
PRODUCT DATA. BZ-7229 software turns Type 2270 into a dual-channel building acoustics analyzer (2270-K).
.") PRODUCT DATA Building Acoustics Software BZ-7228 and Dual-channel Building Acoustics Software BZ-7229 for Hand-held Analyzers Types 2250 and 2270 PULSE Reflex Building Acoustics Type 8780 Building Acoustics
PRODUCT DATA Building Acoustics Software BZ-7228 and Dual-channel Building Acoustics Software BZ-7229 for Hand-held Analyzers Types 2250 and 2270 PULSE Reflex Building Acoustics Type 8780 Building Acoustics
SoundCheck 12.0 Quick Start Guide
 Software Install Basics Upgrading From an Earlier Version If you are upgrading from an earlier version of SoundCheck 12.0 (or Beta version) you should copy the old installation folder and name it "SoundCheck
General Help. Last revised: Winter When I try to print something on the computer, it appears to work, but nothing comes out of the printer.
 General Help Last revised: Winter 2015 Problem Solution When I try to print something on the computer, it appears to work, but nothing comes out of the printer. See the next item. When I try to print something
ALM473 DUAL MONO \ STEREO AUDIO LEVEL MASTER OPERATION MANUAL IB
 ALM473 DUAL MONO \ STEREO AUDIO LEVEL MASTER OPERATION MANUAL IB6408-01 TABLE OF CONTENTS GENERAL DESCRIPTION 2 INSTALLATION 2,3,4 CONNECTION AND SETUP 4,5,6,7 FUNCTIONAL DESCRIPTION 8,9 MAINTENANCE 9
4830B accelerometer simulator Product overview
 4830B accelerometer simulator Product overview 2015 Product overview Simulates the electrical output signals generated by common measurement transducers (vibration, pressure, acoustics, etc.) Portable,
Energate Foundation Meter Data Collector Installation Guide
 Energate Foundation Meter Data Collector Installation Guide The Meter Data Collector works with Foundation s built-in Meter Data Receiver. The collector attaches to the meter provided by your electricity
SETUP and OPERATING MANUAL ADVANCED MULTI-CHANNEL VEHICLE INTERCOM SYSTEM (AMCVIS)
") SETUP and OPERATING MANUAL Sept 23, 2010 Rev D ADVANCED MULTI-CHANNEL VEHICLE INTERCOM SYSTEM (AMCVIS) with DIGITAL CREW CONTROL and RADIO BRIDGING The AMCVIS was designed, manufactured and is supported
SETUP and OPERATING MANUAL Sept 23, 2010 Rev D ADVANCED MULTI-CHANNEL VEHICLE INTERCOM SYSTEM (AMCVIS) with DIGITAL CREW CONTROL and RADIO BRIDGING The AMCVIS was designed, manufactured and is supported
SLM-52N INSTRUCTION MANUAL
 ISO-TECH Sound Level Meter SLM-52N INSTRUCTION MANUAL Un Un Ov Ov CONTENTS Title Page 1. INSTRUMENT CARE... 1 2. FEATURES... 2 3. MEASUREMENT PARAMETERS... 2 4. SPECIFICATIONS... 2 5. CONTROLS AND FUNCTIONS...
TEMPO USB MICROPHONE
 TEMPO USB MICROPHONE Congratulations on your purchase of the MXL Tempo USB microphone. MXL microphones are the result of worldclass engineering and manufacturing capabilities. They are designed to provide
32 CHANNEL SELECTABLE CH MHZ DOWN VOLUME
 KARAOKE Professional UHF Wireless Microphone System VM-92U Operating Instructions UHF Frequency 64 Selectable Better Music Builder UHF MIC WIRELESS SYSTEM VM-92U 32 CHANNEL SELECTABLE 248 13.10 CH MHZ
Model 4210-MMPC-L. Multi-measurement Prober Cable Kit. Overview. Quick start guide topics. Related documents
 Model 0-MMPC-L Keithley Instruments, Inc. Multi-measurement Prober Cable Kit 877 Aurora Road Quick Start Guide Cleveland, Ohio 9-888-KEITHLEY http://www.keithley.com Overview The Keithley Instruments Model
ProHead. User s Guide
 ProHead User s Guide 2Profoto ProHead Profoto ProHead Thank you for choosing Profoto. Thanks for showing us your confidence by investing in a ProHead unit. For more than four decades we have sought the
EPA104/254. User Manual.
 EPA104/254 User Manual www.audac.eu ADDITIONAL INFORMATION This manual is put together with much care, and is as complete as could be on the publication date. However, updates on the specifications, functionality
Important safety instructions
 MMR-88 Version 1 Important safety instructions 1. 2. 3. 4. 5. 6. 7. 8. 9. Please read these instructions carefully. Please keep these instructions for future reference. Heed all warnings Follow all instructions
DM 800H Twin Handheld UHF System (863.0Mhz-865.0Mhz)
") DM 800H Twin Handheld UHF System (863.0Mhz-865.0Mhz) User Manual Order code: MIC78 Safety advice WARNING FOR YOUR OWN SAFETY, PLEASE READ THIS USER MANUAL CAREFULLY BEFORE YOUR INITIAL START-UP! Before
DM 800H Twin Handheld UHF System (863.0Mhz-865.0Mhz) User Manual Order code: MIC78 Safety advice WARNING FOR YOUR OWN SAFETY, PLEASE READ THIS USER MANUAL CAREFULLY BEFORE YOUR INITIAL START-UP! Before
PC: A. Place the Microtek CD-ROM into the CD- ROM drive. B. Follow the on-screen instructions to install the driver and software.
 Start Here Installing your Microtek ScanMaker s450/s350 Step 1: Unpack Contents Unpack your scanner package and check for major components. 1 1. Scanner with built-in transparency adapter 2. Software CD
iphone 6 Chargeport REPAIR GUIDE Version Edition
 iphone 6 Chargeport REPAIR GUIDE Version 1 2016 Edition IPHONE 6 CHARGEPORT REPAIR GUIDE LCD AND DIGITIZER REPLACEMENT RiAna Soto Repair Training Specialist rsoto@cellairis.com FOR EVERY REPAIR MAKE SURE
User Guide (Clarett USB Edition)
") User Guide (Clarett USB Edition) Version 1.0 www.focusrite.com TABLE OF CONTENTS INTRODUCTION... 3 System Requirements....4 Software Installation...4 The Clarett USB Mixer basic principles...5 MIXING &
User Guide (Clarett USB Edition) Version 1.0 www.focusrite.com TABLE OF CONTENTS INTRODUCTION... 3 System Requirements....4 Software Installation...4 The Clarett USB Mixer basic principles...5 MIXING &