Linear Collider Collaboration Tech Notes
|
|
|
- Coral Edwards
- 5 years ago
- Views:
Transcription

1 LCC-0123 Rev. 3 August 2003 Rev. June 2004 Linear Collider Collaboration Tech Notes Design Guideline Summary Based on the GEOVISION Report of Stanford Linear Accelerator Tunnel Vibration Measurements Parsons Pasadena, CA For Stanford Linear Accelerator Center Stanford University Stanford, CA Abstract: This summary report is provided in order to suggest how the measurement data from the GEOVision report might be used by SLAC for their proposed Next Linear Collider facility. See the referenced report Stanford Linear Accelerator Tunnel Vibration Measurements, Conducted at MTA Universal Subway Station, North Hollywood, California, by GEOVision dated July 28, The following discussions are an attempt to determine an upper bound methodology that can be used for design purposes. The data in the GEOVision report remains as a source of actual measurements and can always be used directly. However, it is very evident that there are many different phenomena influencing the transmission of the vibratory waves through the concrete tunnels and the rock materials. This report will suggest some upper bound curves that can be used for design and also discuss some of the possible reasons for the variability in the measured data. In general the most important cause of the variability in the data is the result of the multiple paths that the vibratory waves travel. That is, the waves can travel longitudinally in the tunnels either as compression waves or beam bending waves. The vibrations in the tunnel can travel around the circumference of the tunnels as well. It is possible that the vibrations travel out of the tunnel into the surrounding rock material and then re-enter the tunnels at some greater distance. This summary report is divided into three sections. These sections are: Transmissibility From Tunnel A To Tunnel B; Transmissibility Along Tunnel A; and Transmissibility From Ground Surface To Tunnel A.
2 DESIGN GUIDELINE SUMMARY Based On The GEOVISION REPORT OF MTA UNIVERSAL SUBWAY STATION, NORTH HOLLYWOOD, CALIFORNIA TUNNEL VIBRATION MEASUREMENTS Revision 3 By Parsons Pasadena, California May 5, 2004
3 INTRODUCTION This summary report is provided in order to suggest how the measurement data from the GEOVision report might be used by SLAC for their proposed Next Linear Collider facility. See the referenced report Stanford Linear Accelerator Tunnel Vibration Measurements, Conducted at MTA Universal Subway Station, North Hollywood, California, by GEOVision dated July 28, The following discussions are an attempt to determine an upper bound methodology that can be used for design purposes. The data in the GEOVision report remains as a source of actual measurements and can always be used directly. However, it is very evident that there are many different phenomena influencing the transmission of the vibratory waves through the concrete tunnels and the rock materials. This report will suggest some upper bound curves that can be used for design and also discuss some of the possible reasons for the variability in the measured data. In general the most important cause of the variability in the data is the result of the multiple paths that the vibratory waves travel. That is, the waves can travel longitudinally in the tunnels either as compression waves or beam bending waves. The vibrations in the tunnel can travel around the circumference of the tunnels as well. It is possible that the vibrations travel out of the tunnel into the surrounding rock material and then re-enter the tunnels at some greater distance. This summary report is divided into three sections. These sections are: TRANSMISSIBILITY FROM TUNNEL A TO TUNNEL B; TRANSMISSIBILITY ALONG TUNNEL A; and TRANSMISSIBILITY FROM GROUND SURFACE TO TUNNEL A. The most unique data obtained by GEOVision in these measurements is contained in the first section describing the results of the vibration transmissions from Tunnel A to the adjacent Tunnel B. The tunnels are separated by 39 feet, centerline to centerline. The tunnels are concrete lined and are approximately 20 feet in diameter. The tunnels are approximately 90 feet below the surface of the ground to the elevation of the track bed in the tunnels, and the depth below ground increases considerably along the tunnel measurement locations. Special thanks are given to Dr. Robert Nigbor, Professor at the University of Southern California, and Fred Asiri and Andrei Seryi at Stanford/SLAC for their assistance in preparing and reviewing this report. 2
4 TRANSMISSIBILITY FROM TUNNEL A TO TUNNEL B From Test 4 in the GEOVision report, a simple enveloping curve fit of the transmissibility curves shown in Figure 10 of the GEOVision report results in the following upper bounds to the measured data for transmission from tunnel A to tunnel B at 0 feet, 100 feet, and 300 feet along tunnel B from the source in tunnel A. These straight-line limits are shown in the following graph: Attenuation (Response in Tunnel B/Source in Tunnel A) FIG10-REV-2.PDW 0 Feet 100 Feet 300 Feet Frequency (Hz) The following equations can be used to describe these upper bounds for the attenuation functions in terms of the frequency, f, in Hz. Note, T AB00 refers to the attenuation between the source in tunnel A and the measurement in tunnel B, directly across from the source in tunnel A; T AB100 refers to the attenuation between the source in tunnel A and the measurement in tunnel B, 100 feet along tunnel B from the source in tunnel A; T AB300 refers to the attenuation between the source in tunnel A and the measurement in tunnel B, 300 feet along tunnel B from the source in tunnel A. T AB00 = exp[-(1.527x10⁻² )( f )] T AB100 = exp[-(3.258x10⁻² )( f ) 0.696] T AB300 = exp[-(3.586x10⁻² )( f ) 2.580] 3
5 For reference, Figure 10 from the GEOVision report is reprinted in the following graph: Reprint of Figure 10, from the GEOVision Report, Revision 4 The straight-line curves in the semi-log plots are essentially upper bounds of the measured attenuation data. The straight-line curves are plotted from 10 Hz to 120 Hz since the data is not reliable below 3 Hz and there is considerable scatter in the data between 3 Hz and 10 Hz. It is also interesting to note that the attenuation in Tunnel A at 48 feet is similar to the attenuation in Tunnel B at 0 feet (actually 39 feet apart, centerline to centerline). Also the attenuation at 95 feet in tunnel A is similar to the attenuation at 100 feet in tunnel B. This indicates that the two tunnels are experiencing similar vibration levels at similar distances from the vibratory source. These comparisons also give an indication to the variability that might be expected. An alternative to using the straight-line curves for estimating the transmissibility between the two tunnels would be to use the GEOVision plots directly. This may be more representative in the frequency range from 3 Hz to 25 Hz. In this frequency range there is a tendency for the attenuation to decrease with decreasing frequency for the tunnel B transmissibility at 0 feet. This phenomenon may be related to the difficulty in transmitting and developing very long wavelength vibrations near the vibration source. It is expected that the shear wave velocity of the ground is about 3,000 to 4,000 feet per second and the shear wave velocity of concrete is expected to be similar. Thus at 3 Hz 4
6 the wavelength would be 1000 feet and at 30 Hz the wavelength would be 100 feet. Since the tunnels are only 39 feet apart, it is not surprising that long wavelengths cannot be represented by simple transmissibility curves. Effect of Changes in Shear Wave Velocity The following discussion attempts to formulate an intuitive prediction for the effect of changing the shear wave velocity of the rock in which the tunnels may be located. The equations proposed in this discussion require further analytical investigation and/or testing to validate their accuracy, but they represent a first step in developing an insight into the possible effect of the change of rock properties associated with different tunnel sites. Note that the relationship between frequency, wave velocity, and wavelength is: f = Vs/L Where f = Frequency (Hz); Vs = Shear Wave Velocity (Feet/Second); L = Wave Length (Feet) Although no tunnel vibrations were measured using different shear wave velocity media in these tests, it is likely that longer wavelength conditions produced by higher shear wave velocities would be similar to shifting the frequency so that the effective wavelength was maintained. L 1 = L 2, Vs 1 /f 1 = Vs 2 /f 2, or f 1 =f 2 [Vs 1 /Vs 2 ] Thus the straight-line curves in the semi-log plots might become as follows, where Vs 2 and f 2 represent the new site conditions relative to the 3000 feet/second shear wave velocity of the MTA tunnel rock: T B00 = exp[-(1.527x10⁻² )(3000/Vs)( f )] T B100 = exp[-(3.258x10⁻² )(3000/Vs)( f ) 0.696] T B300 = exp[-(3.586x10⁻² )(3000/Vs)( f ) 2.580] 5
7 A comparison of the transmissibility functions is made in the following figure for Vs equal to 3000 feet/second and Vs = 6000 feet/second. Attenuation (Response in Tunnel B/Source in Tunnel A) FIG10A-REV-2.PDW 0 Feet 100 Feet 300 Feet Frequency (Hz) One would expect that higher shear wave velocities would result in flatter transmissibility (decreased slope) functions as shown in the above figure, but it is uncertain whether this effect is as dramatic as is estimated in the proposed equations. Further analysis and/or testing is needed to determine whether this intuitive solution to the effect of variations of shear wave velocity are correct. 6
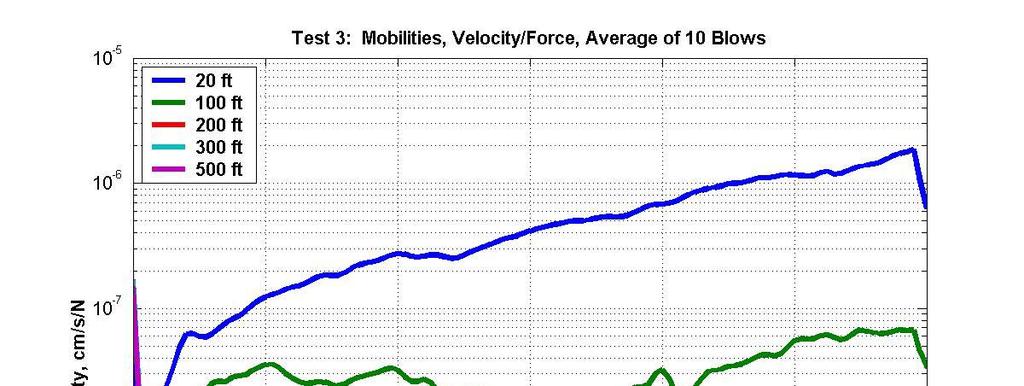
8 Mobility Function Estimate The mobility function for Test 4 could not be plotted since the transducer on the hammer mechanism failed. However, the mobility function at the 20-foot location for Test 3 should be essentially identical to the mobility function for the 17-foot location in Test 4. From Test 3 in the GEOVision report, a simple curve fit of the mobility curve as shown in Figure 9 of the GEOVision report results in the following upper bounds to the data for the mobility function at 20 feet from the vibration source. This straight-line limit is shown in the following graph: FIG-9-REV-1.PDW Mobility [Velocity/Force - (cm/sec)/n] Feet From Source Frequency (Hz) The following equation can be used to describe the upper bound of the straight-line mobility curve shown above. The mobility function 20 feet from the source in tunnel A is denoted as M AA00 refers to the mobility function of the source in tunnel A and the measurement 20 feet away in tunnel A. M AA00 = exp[+(2.682x10⁻² )( f ) ] The mobility plots for Test 3 are reprinted from the GEOVision report in the following graph: 7
9 Reprint of Figure 9, from the GEOVision Report, Revision 4 Therefore, the above graphs could be used to determine the transmission from vibratory sources in adjacent tunnels. The first step would be to determine the source vibration velocity from the mobility curve at a given force and frequency at the 20 feet from the source. Then the transmission of vibrations from the source tunnel to the adjacent tunnel would be determined using the transmissibility graph at the given frequency. Note that it is assumed that the data measured from the frequency content of an impulsive hammer test is applicable to steady-state vibratory sources. This assumption may require further verification. 8
10 TRANSMISSIBILITY ALONG TUNNEL A From Test 3 in the GEOVision report, a simple enveloping curve fit of the transmissibility curves shown in Figure 8 of the GEOVision report results in the following upper bounds to the data for transmission from the source in tunnel A to the instrumentation at various locations along tunnel A. These straight-line limits are shown in the following graph: Attenuation (Response in Tunnel A/Source in Tunnel A) FIG-8-REV-1.PDW 100 Feet 200 Feet 300 Feet 500 Feet Frequency (Hz) The following equations can be used to describe these upper bounds for the attenuation functions in terms of the frequency, f, in Hz. Note, T AA100 refers to the attenuation between the source in tunnel A and the measurement 100 feet along tunnel A; T AA200 refers to the attenuation between the source in tunnel A and the measurement 200 feet along tunnel A; T AA300 refers to the attenuation between the source in tunnel A and the measurement 300 feet along tunnel A; T AA500 refers to the attenuation between the source in tunnel A and the measurement 500 feet along tunnel A; T AA100 = exp[-(2.054x10⁻² )( f ) 0.656] T AA200 = exp[-(3.664x10⁻² )( f ) 1.230] T AA300 = exp[-(3.170x10⁻² )( f ) 2.538] T AA500 = exp[-(2.754x10⁻² )( f ) 3.520] 9
11 For reference, Figure 8 from the GEOVision report is reprinted in the following graph: Reprint of Figure 8, from the GEOVision Report, Revision 4 The straight-line curves in the semi-log plots are essentially upper bounds of the measured attenuation data. The straight-line curves are plotted from 10 Hz to 120 Hz since the data is not reliable below 3 Hz and there is considerable variability in the plots between 3 Hz and 10 Hz. An alternative to using the straight-line curves for estimating the transmissibility along the tunnels would be to use the GEOVision plots directly. This may be more representative in the frequency range from 3 Hz to 10 Hz 10
12 Mobility Function From Test 3 in the GEOVision report, a simple curve fit of the mobility curve as shown in Figure 9 of the GEOVision report results in the following upper bounds to the data for the mobility at 20 feet. This straight-line limit is shown in the following graph: FIG-9-REV-1.PDW Mobility [Velocity/Force - (cm/sec)/n] Feet From Source Frequency (Hz) The following equation can be used to describe the upper bound of the straight-line mobility curve shown above. The mobility function 20 feet from the source in tunnel A is denoted as M AA00 refers to the mobility function of the source in tunnel A and the measurement 20 feet away in tunnel A. M AA00 = exp[+(2.682x10⁻² )( f ) ] 11

13 The mobility plots for Test 3 are reprinted from Figure 9 in the GEOVision report in the following graph: Reprint of Figure 9, from the GEOVision Report Therefore, the above graphs could be used to determine the transmission from vibratory sources in the same tunnel. The first step would be to determine the source vibration velocity from the mobility curve at a given force and frequency. Then the transmission of vibrations from the source to locations along the tunnel would be determined using the transmissibility graph at the given frequency. Note that it is assumed that the data measured from the frequency content of an impulsive hammer test is applicable to steady-state vibratory sources. This assumption may require further verification. 12
14 TRANSMISSIBILITY FROM GROUND SURFACE TO TUNNEL A From Test 2 in the GEOVision report, a simple enveloping curve fit of the transmissibility curves shown in Figure 6 of the GEOVision report results in the following upper bounds to the data for transmission from the source at the ground surface to the instrumentation at various locations along tunnel A. These straight-line limits are shown in the following graph: Attenuation (Response in Tunnel Surface) FIG6.PDW 0 Feet 100 Feet 200 Feet Frequency (Hz) The following equations can be used to describe these upper bounds for the attenuation functions in terms of the frequency, f, in Hz. Note, T SA00 refers to the attenuation between the source at the surface and the measurement 0 feet in tunnel A, directly under the source; T SA100 refers to the attenuation between the source at the surface and the measurement 100 feet along tunnel A; T SA300 refers to the attenuation between the source at the surface and the measurement 200 feet along tunnel A; T SA00 = exp[-(4.567x10⁻² )( f ) 2.120] T SA100 = exp[-(4.674x10⁻² )( f ) 2.813] T SA200 = exp[-(5.757x10⁻² )( f ) 3.101] 13
15 For reference, Figure 6 from the GEOVision report is reprinted in the following graph: Mobility Function Reprint of Figure 6, from the GEOVision Report From Test 2 in the GEOVision report, a simple curve fit of the mobility curve could not be made due to the extreme curvature in the measured mobility curve. It is likely that the extreme curvature of the mobility curve at the surface (20 feet from the source) is due to the soft soil layers near the surface of the ground. Thus it is recommended that the rather smooth, but curved, measured mobility curve be used to determine the surface ground motions without attempting to smooth or bound the measured data. 14
16 Reprint of Figure 7, from the GEOVision Report Therefore, the above graphs could be used to determine the transmission from vibratory sources at the surface to the tunnel. The first step would be to determine the source vibration velocity from the measured mobility curve, 20 feet from the source, at a given force and frequency. Then the transmission of vibrations from the source to locations along the tunnel would be determined using the transmissibility graph at the given frequency. Note that it is assumed that the data measured from the frequency content of an impulsive hammer test is applicable to steady-state vibratory sources. This assumption may require further verification. 15
17 APPENDIX FULL SIZE PLOTS OF FIGURES 16
18 Attenuation (Response in Tunnel B/Source in Tunnel A) FIG10-REV-2.PDW 0 Feet 100 Feet 300 Feet Frequency (Hz) 17
19 Attenuation (Response in Tunnel B/Source in Tunnel A) FIG10A-REV-2.PDW 0 Feet 100 Feet 300 Feet Frequency (Hz) 18
20 19
21 FIG-9-REV-1.PDW Mobility [Velocity/Force - (cm/sec)/n] Feet From Source Frequency (Hz) 20
22 21
23 Attenuation (Response in Tunnel A/Source in Tunnel A) FIG-8-REV-1.PDW 100 Feet 200 Feet 300 Feet 500 Feet Frequency (Hz) 22
24 23
25 Attenuation (Response in Tunnel Surface) FIG6.PDW 0 Feet 100 Feet 200 Feet Frequency (Hz)
26 25
27 26
An Overview of Ground Motion and Vibration Studies
 An Overview of Ground Motion and Vibration Studies 1 Acknowledgements SLAC Accelerator Physics: Andrei Seryi, Fredric Le Pimpec SLAC Conventional Facility: Clay Corvin, Javier Sevilla, Jerry Aarons Colin
CALIBRATION OF COMPUTER PROGRAM SASSI FOR VIBRATION TRANSMISSIBILITY ANALYSIS IN UNDERGROUND STRUCTURES USING FIELD MEASURED DATA
 CALIBRATION OF COMPUTER PROGRAM SASSI FOR VIBRATION TRANSMISSIBILITY ANALYSIS IN UNDERGROUND STRUCTURES USING FIELD MEASURED DATA Frederick Tajirian Mansour Tabatabaie Fred Asiri and Andrei Seryi Chevron
Proposed Vibration Measurement Program In A Parallel Tunnel
 Proposed Vibration Measurement Program In A Parallel Tunnel 1 of 14- Fred Asiri Introduction Next Linear Collider U.S. Collaboration NLC Site Investigation Plan for Next Year Prepare an accurate and consistent
Appendix C: Graphing. How do I plot data and uncertainties? Another technique that makes data analysis easier is to record all your data in a table.
 Appendix C: Graphing One of the most powerful tools used for data presentation and analysis is the graph. Used properly, graphs are an important guide to understanding the results of an experiment. They
Ultrasound Physics. History: Ultrasound 2/13/2019. Ultrasound
 Ultrasound Physics History: Ultrasound Ultrasound 1942: Dr. Karl Theodore Dussik transmission ultrasound investigation of the brain 1949-51: Holmes and Howry subject submerged in water tank to achieve
Letter Report to Alexander Avenue Overhead (Bridge No. 27C-0150) Retrofit Project, City of Larkspur, Marin County, California 1.
 Retrofit Project, City of Larkspur, Marin County, California 1.") Parsons Brinckerhoff 303 Second Street Suite 700 North San Francisco, CA 94107-1317 415-243-4600 Fax: 415-243-9501 July 06, 2011 PB Project No. 12399A PARSONS BRINCKERHOFF 2329 Gateway Oaks Drive, Suite
Parsons Brinckerhoff 303 Second Street Suite 700 North San Francisco, CA 94107-1317 415-243-4600 Fax: 415-243-9501 July 06, 2011 PB Project No. 12399A PARSONS BRINCKERHOFF 2329 Gateway Oaks Drive, Suite
Experiment P01: Understanding Motion I Distance and Time (Motion Sensor)
") PASCO scientific Physics Lab Manual: P01-1 Experiment P01: Understanding Motion I Distance and Time (Motion Sensor) Concept Time SW Interface Macintosh file Windows file linear motion 30 m 500 or 700 P01
PASCO scientific Physics Lab Manual: P01-1 Experiment P01: Understanding Motion I Distance and Time (Motion Sensor) Concept Time SW Interface Macintosh file Windows file linear motion 30 m 500 or 700 P01
of bamboo. notes. in the D4. learning to. amplitudes and. pipe. The the.5% to. each. individual. 2% range.
 Analysis of Bambooo as an Acousticall Medium Isaac Carrasquillo Physics 406 Final Report 2014-5-16 Abstract This semester I constructed and took measurements on a set of bamboo pan flute pipes. Construction
Response spectrum Time history Power Spectral Density, PSD
 A description is given of one way to implement an earthquake test where the test severities are specified by time histories. The test is done by using a biaxial computer aided servohydraulic test rig.
Motion Graphs Teacher s Guide
 Motion Graphs Teacher s Guide 1.0 Summary Motion Graphs is the third activity in the Dynamica sequence. This activity should be done after Vector Motion. Motion Graphs has been revised for the 2004-2005
Engineering Discovery
 Modeling, Computing, & Measurement: Measurement Systems # 4 Dr. Kevin Craig Professor of Mechanical Engineering Rensselaer Polytechnic Institute 1 Frequency Response and Filters When you hear music and
Ultrasonic Testing using a unipolar pulse
 Ultrasonic Testing using a unipolar pulse by Y. Udagawa* and T. Shiraiwa** *Imaging Supersonic Laboratories Co.,Ltd. 12-7 Tezukayamanakamachi Nara Japan 63163 1. Abstract Krautkramer Japan Co.,Ltd. 9-29
Interference & Superposition. Creating Complex Wave Forms
 Interference & Superposition Creating Complex Wave Forms Waves & Interference I. Definitions and Types II. Parameters and Equations III. Sound IV. Graphs of Waves V. Interference - superposition - standing
Use of Acoustic Emission to Diagnose Breakdown in Accelerator RF Structures * Abstract
 SLAC PUB 9808 May 2003 Use of Acoustic Emission to Diagnose Breakdown in Accelerator RF Structures * J. Nelson, M. Ross, J. Frisch, F. Le Pimpec, K. Jobe, D. McCormick, T. Smith Stanford Linear Accelerator
Site-specific seismic hazard analysis
 Site-specific seismic hazard analysis ABSTRACT : R.K. McGuire 1 and G.R. Toro 2 1 President, Risk Engineering, Inc, Boulder, Colorado, USA 2 Vice-President, Risk Engineering, Inc, Acton, Massachusetts,
12/26/2017. Alberto Ardon M.D.
 Alberto Ardon M.D. 1 Preparatory Work Ultrasound Physics http://www.nysora.com/mobile/regionalanesthesia/foundations-of-us-guided-nerve-blockstechniques/index.1.html Basic Ultrasound Handling https://www.youtube.com/watch?v=q2otukhrruc
Wave Review Questions Updated
 Name: Date: 1. Which type of wave requires a material medium through which to travel? 5. Which characteristic is the same for every color of light in a vacuum? A. radio wave B. microwave C. light wave
GENERAL GUIDELINES FOR APPLICATION OF THE EXTENDED SUBTRACTION METHOD IN SASSI SOIL-STRUCTURE INTERACTION ANALYSIS
 Transactions, SMiRT-22 GENERAL GUIDELINES FOR APPLICATION OF THE EXTENDED SUBTRACTION METHOD IN SASSI SOIL-STRUCTURE INTERACTION ANALYSIS C. C. Chin 1, Nan Deng 2, and Farhang Ostadan 3 1 Senior Engineer,
VIBRATIONAL TESTING OF A FULL-SCALE PILE GROUP IN SOFT CLAY
 VIBRATIONAL TESTING OF A FULL-SCALE PILE GROUP IN SOFT CLAY Marvin W HALLING 1, Kevin C WOMACK 2, Ikhsan MUHAMMAD 3 And Kyle M ROLLINS 4 SUMMARY A 3 x 3 pile group and pile cap were constructed in a soft
Optimization of the LCLS Single Pulse Shutter
 SLAC-TN-10-002 Optimization of the LCLS Single Pulse Shutter Solomon Adera Office of Science, Science Undergraduate Laboratory Internship (SULI) Program Georgia Institute of Technology, Atlanta Stanford
Waves transfer energy NOT matter Two categories of waves Mechanical Waves require a medium (matter) to transfer wave energy Electromagnetic waves no
 to transfer wave energy Electromagnetic waves no") 1 Waves transfer energy NOT matter Two categories of waves Mechanical Waves require a medium (matter) to transfer wave energy Electromagnetic waves no medium required to transfer wave energy 2 Mechanical
1 Waves transfer energy NOT matter Two categories of waves Mechanical Waves require a medium (matter) to transfer wave energy Electromagnetic waves no medium required to transfer wave energy 2 Mechanical
Chapter 16 Sound. Copyright 2009 Pearson Education, Inc.
 Chapter 16 Sound 16-6 Interference of Sound Waves; Beats Sound waves interfere in the same way that other waves do in space. 16-6 Interference of Sound Waves; Beats Example 16-12: Loudspeakers interference.
Glulam Curved Members. Glulam Design. General Glulam Design. General Glulam Beams are Designed in the SAME Manner as Solid Sawn Beams
 Glulam Curved Members Glulam Design General Glulam Beams are Designed in the SAME Manner as Solid Sawn Beams There is an Additional Adjustment Factor, C v, the Volume Factor C v and C L (Lateral Stability
RECOMMENDATION ITU-R F.1819
 Rec. ITU-R F.1819 1 RECOMMENDATION ITU-R F.1819 Protection of the radio astronomy service in the 48.94-49.04 GHz band from unwanted emissions from HAPS in the 47.2-47.5 GHz and 47.9-48.2 GHz bands * (2007)
DETERMINATION OF SEISMIC WAVE VELOCITIES USING METRO-VIBRATIONS
 DETERMINATION OF SEISMIC WAVE VELOCITIES USING METRO-VIBRATIONS ABSTRACT: H. Wenzel 1 1 Managing Director, VCE Holding GmbH, Hadikgasse 60, A-1140 Vienna Email: wenzel@vce.at The knowledge of wave velocities
Momentum and Impulse. Objective. Theory. Investigate the relationship between impulse and momentum.
 [For International Campus Lab ONLY] Objective Investigate the relationship between impulse and momentum. Theory ----------------------------- Reference -------------------------- Young & Freedman, University
Radar Signatures and Relations to Radar Cross Section. Mr P E R Galloway. Roke Manor Research Ltd, Romsey, Hampshire, United Kingdom
 Radar Signatures and Relations to Radar Cross Section Mr P E R Galloway Roke Manor Research Ltd, Romsey, Hampshire, United Kingdom Philip.Galloway@roke.co.uk Abstract This paper addresses a number of effects
Momentum and Impulse
 General Physics Lab Department of PHYSICS YONSEI University Lab Manual (Lite) Momentum and Impulse Ver.20180328 NOTICE This LITE version of manual includes only experimental procedures for easier reading
UNIT Derive the fundamental equation for free space propagation?
 UNIT 8 1. Derive the fundamental equation for free space propagation? Fundamental Equation for Free Space Propagation Consider the transmitter power (P t ) radiated uniformly in all the directions (isotropic),
FÉDÉRATION EUROPÉENNE DE LA MANUTENTION Product Group Industrial Trucks. Floors for Use of Industrial Trucks Very Narrow Aisles Trucks Requirements
 FEM-IT-T/WG4/Nxxx FÉDÉRATION EUROPÉENNE DE LA MANUTENTION Product Group Industrial Trucks Floors for Use of Industrial Trucks Very Narrow Aisles Trucks Requirements FEM 4.007 draft April 2010 Contents
Using Voltage Dividers to Design a Photo-Sensitive LED Circuit. ( Doug Oliver & Jackie Kane. May be reproduced for non-profit classroom use.
 Using Voltage Dividers to Design a Photo-Sensitive LED Circuit ( 2009 - Doug Oliver & Jackie Kane. May be reproduced for non-profit classroom use.) Purpose: After completing the module students will: 1.
British Columbia Carpenter Apprenticeship Program
 British Columbia Carpenter Apprenticeship Program Level 2 Line G Competency G-8 Use Pile Foundations and Shoring 7960003564 Ordering Crown Publications, Queen s Printer PO Box 9452 Stn Prov Govt 563 Superior
A NEW APPROACH FOR THE ANALYSIS OF IMPACT-ECHO DATA
 A NEW APPROACH FOR THE ANALYSIS OF IMPACT-ECHO DATA John S. Popovics and Joseph L. Rose Department of Engineering Science and Mechanics The Pennsylvania State University University Park, PA 16802 INTRODUCTION
AGN 008 Vibration DESCRIPTION. Cummins Generator Technologies manufacture ac generators (alternators) to ensure compliance with BS 5000, Part 3.
 to ensure compliance with BS 5000, Part 3.") Application Guidance Notes: Technical Information from Cummins Generator Technologies AGN 008 Vibration DESCRIPTION Cummins Generator Technologies manufacture ac generators (alternators) to ensure compliance
Application Guidance Notes: Technical Information from Cummins Generator Technologies AGN 008 Vibration DESCRIPTION Cummins Generator Technologies manufacture ac generators (alternators) to ensure compliance
 Chapter 5 5.1 What are the factors that determine the thickness of a polystyrene waveguide formed by spinning a solution of dissolved polystyrene onto a substrate? density of polymer concentration of polymer
System Inputs, Physical Modeling, and Time & Frequency Domains
 System Inputs, Physical Modeling, and Time & Frequency Domains There are three topics that require more discussion at this point of our study. They are: Classification of System Inputs, Physical Modeling,
ii) When light falls on objects, it reflects the light and when the reflected light reaches our eyes then we see the objects.
 When light falls on objects, it reflects the light and when the reflected light reaches our eyes then we see the objects.") Light i) Light is a form of energy which helps us to see objects. ii) When light falls on objects, it reflects the light and when the reflected light reaches our eyes then we see the objects. iii) Light
Light i) Light is a form of energy which helps us to see objects. ii) When light falls on objects, it reflects the light and when the reflected light reaches our eyes then we see the objects. iii) Light
CITY OF BEVERLY HILLS Department of Public Works and Transportation Civil Engineering Division STORM DRAIN IMPROVEMENT PLAN REVIEW CHECKLIST
 CITY OF BEVERLY HILLS Department of Public Works and Transportation Civil ing Division STORM DRAIN IMPROVEMENT PLAN REVIEW CHECKLIST The following checklist consists of the minimum requirements for preparation
CHAPTER 11 TEST REVIEW -- MARKSCHEME
 AP PHYSICS Name: Period: Date: 50 Multiple Choice 45 Single Response 5 Multi-Response Free Response 3 Short Free Response 2 Long Free Response MULTIPLE CHOICE DEVIL PHYSICS BADDEST CLASS ON CAMPUS AP EXAM
Structural UT: Variables Affecting Attenuation and Review of the 2 db per Inch Model
 Structural UT: Variables Affecting Attenuation and Review of the 2 db per Inch Model Paul Holloway, P.Eng, MASc, CGSB UT3 MT2 President, Holloway NDT & Engineering Inc. Purpose & Practical Applications
Also, side banding at felt speed with high resolution data acquisition was verified.
 PEAKVUE SUMMARY PeakVue (also known as peak value) can be used to detect short duration higher frequency waves stress waves, which are created when metal is impacted or relieved of residual stress through
Lesson 02: Sound Wave Production. This lesson contains 24 slides plus 11 multiple-choice questions.
 Lesson 02: Sound Wave Production This lesson contains 24 slides plus 11 multiple-choice questions. Accompanying text for the slides in this lesson can be found on pages 2 through 7 in the textbook: ULTRASOUND
Borehole vibration response to hydraulic fracture pressure
 Borehole vibration response to hydraulic fracture pressure Andy St-Onge* 1a, David W. Eaton 1b, and Adam Pidlisecky 1c 1 Department of Geoscience, University of Calgary, 2500 University Drive NW Calgary,
[4] (b) Fig. 6.1 shows a loudspeaker fixed near the end of a tube of length 0.6 m. tube m 0.4 m 0.6 m. Fig. 6.
![[4] (b) Fig. 6.1 shows a loudspeaker fixed near the end of a tube of length 0.6 m. tube m 0.4 m 0.6 m. Fig. 6.](/thumbs/82/84801740.jpg "[4] (b) Fig. 6.1 shows a loudspeaker fixed near the end of a tube of length 0.6 m. tube m 0.4 m 0.6 m. Fig. 6.") 1 (a) Describe, in terms of vibrations, the difference between a longitudinal and a transverse wave. Give one example of each wave.................... [4] (b) Fig. 6.1 shows a loudspeaker fixed near the
1 (a) Describe, in terms of vibrations, the difference between a longitudinal and a transverse wave. Give one example of each wave.................... [4] (b) Fig. 6.1 shows a loudspeaker fixed near the
Analysis of Fast Fading in Wireless Communication Channels M.Siva Ganga Prasad 1, P.Siddaiah 1, L.Pratap Reddy 2, K.Lekha 1
 International Journal of ISSN 0974-2107 Systems and Technologies IJST Vol.3, No.1, pp 139-145 KLEF 2010 Fading in Wireless Communication Channels M.Siva Ganga Prasad 1, P.Siddaiah 1, L.Pratap Reddy 2,
Chapter 17 Waves in Two and Three Dimensions
 Chapter 17 Waves in Two and Three Dimensions Slide 17-1 Chapter 17: Waves in Two and Three Dimensions Concepts Slide 17-2 Section 17.1: Wavefronts The figure shows cutaway views of a periodic surface wave
sin(wt) y(t) Exciter Vibrating armature ENME599 1
 y(t) Exciter Vibrating armature ENME599 1") ENME599 1 LAB #3: Kinematic Excitation (Forced Vibration) of a SDOF system Students must read the laboratory instruction manual prior to the lab session. The lab report must be submitted in the beginning
ENME599 1 LAB #3: Kinematic Excitation (Forced Vibration) of a SDOF system Students must read the laboratory instruction manual prior to the lab session. The lab report must be submitted in the beginning
ANALYSIS OF 3RD OCTAVE BAND GROUND MOTIONS TRANSMISSION IN SYNCHROTRON RADIATION FACILITY SOLARIS Daniel Ziemianski, Marek Kozien
 ANALYSIS OF 3RD OCTAVE BAND GROUND MOTIONS TRANSMISSION IN SYNCHROTRON RADIATION FACILITY SOLARIS Daniel Ziemianski, Marek Kozien Cracow University of Technology, Institute of Applied Mechanics, al. Jana
MAKE SURE TA & TI STAMPS EVERY PAGE BEFORE YOU START
 Laboratory Section: Last Revised on September 21, 2016 Partners Names: Grade: EXPERIMENT 11 Velocity of Waves 1. Pre-Laboratory Work [2 pts] 1.) What is the longest wavelength at which a sound wave will
On the accuracy reciprocal and direct vibro-acoustic transfer-function measurements on vehicles for lower and medium frequencies
 On the accuracy reciprocal and direct vibro-acoustic transfer-function measurements on vehicles for lower and medium frequencies C. Coster, D. Nagahata, P.J.G. van der Linden LMS International nv, Engineering
Vibration Fundamentals Training System
 Vibration Fundamentals Training System Hands-On Turnkey System for Teaching Vibration Fundamentals An Ideal Tool for Optimizing Your Vibration Class Curriculum The Vibration Fundamentals Training System
PREDICTION OF RAILWAY INDUCED GROUND VIBRATION
 inter.noise 2000 The 29th International Congress and Exhibition on Noise Control Engineering 27-30 August 2000, Nice, FRANCE Paper IN2000/467 http://confs.loa.espci.fr/in2000/000467/000467.pdf PREDICTION
SOLVING VIBRATIONAL RESONANCE ON A LARGE SLENDER BOAT USING A TUNED MASS DAMPER. A.W. Vredeveldt, TNO, The Netherlands
 SOLVING VIBRATIONAL RESONANCE ON A LARGE SLENDER BOAT USING A TUNED MASS DAMPER. A.W. Vredeveldt, TNO, The Netherlands SUMMARY In luxury yacht building, there is a tendency towards larger sizes, sometime
Motion Simulation - The Moving Man
 Constant Velocity Motion Simulation - The Moving Man Today you will learn how to get information from a simulation program. Our goal is to play with the simulation to find the rules that it follows. Simulations
Waves Mechanical vs. Electromagnetic Mechanical Electromagnetic Transverse vs. Longitudinal Behavior of Light
 PSC1341 Chapter 4 Waves Chapter 4: Wave Motion A.. The Behavior of Light B. The E-M spectrum C. Equations D. Reflection, Refraction, Lenses and Diffraction E. Constructive Interference, Destructive Interference
Dynamic Vibration Absorber
 Part 1B Experimental Engineering Integrated Coursework Location: DPO Experiment A1 (Short) Dynamic Vibration Absorber Please bring your mechanics data book and your results from first year experiment 7
Acoustic Filter Copyright Ultrasonic Noise Acoustic Filters
 OVERVIEW Ultrasonic Noise Acoustic Filters JAMES E. GALLAGHER, P.E. Savant Measurement Corporation Kingwood, TX USA The increasing use of Multi-path ultrasonic meters for natural gas applications has lead
Scaled Laboratory Experiments of Shallow Water Acoustic Propagation
 Scaled Laboratory Experiments of Shallow Water Acoustic Propagation Panagiotis Papadakis, Michael Taroudakis FORTH/IACM, P.O.Box 1527, 711 10 Heraklion, Crete, Greece e-mail: taroud@iacm.forth.gr Patrick
Whole geometry Finite-Difference modeling of the violin
 Whole geometry Finite-Difference modeling of the violin Institute of Musicology, Neue Rabenstr. 13, 20354 Hamburg, Germany e-mail: R_Bader@t-online.de, A Finite-Difference Modelling of the complete violin
Finite Element Study of Using Concrete Tie Beams to Reduce Differential Settlement Between Footings
 Finite Element Study of Using Concrete Tie Beams to Reduce Differential Settlement Between Footings AMIN H. ALMASRI* AND ZIAD N. TAQIEDDIN** *Assistant Professor, Department of Civil Engineering, Jordan
Multi Level Temperature Measurement Using a single 90 bend waveguide
 More info about this article: http://www.ndt.net/?id=21199 Multi Level Temperature Measurement Using a single 90 bend waveguide Nishanth R 1a, Lingadurai K 1, Suresh Periyannan a and Krishnan Balasubramaniam
DEVELOPMENT OF HEAT-RESISTANT OPTICAL FIBER AE SENSOR
 DEVELOPMENT OF HEAT-RESISTANT OPTICAL FIBER AE SENSOR PORNTHEP CHIVAVIBUL 1, HIROYUKI FUKUTOMI 1, SHIN TAKAHASHI 2 and YUICHI MACHIJIMA 2 1) Central Research Institute of Electric Power Industry (CRIEPI),
Fig. 1
 PhysicsAndMathsTutor.com 1 1. Fig. 1 shows data for the intensity of a parallel beam of X-rays after penetration through varying thicknesses of a material. intensity / MW m 2 thickness / mm 0.91 0.40 0.69
Anisotropic Frequency-Dependent Spreading of Seismic Waves from VSP Data Analysis
 Anisotropic Frequency-Dependent Spreading of Seismic Waves from VSP Data Analysis Amin Baharvand Ahmadi* and Igor Morozov, University of Saskatchewan, Saskatoon, Saskatchewan amin.baharvand@usask.ca Summary
Experiment P02: Understanding Motion II Velocity and Time (Motion Sensor)
") PASCO scientific Physics Lab Manual: P02-1 Experiment P02: Understanding Motion II Velocity and Time (Motion Sensor) Concept Time SW Interface Macintosh file Windows file linear motion 30 m 500 or 700
PASCO scientific Physics Lab Manual: P02-1 Experiment P02: Understanding Motion II Velocity and Time (Motion Sensor) Concept Time SW Interface Macintosh file Windows file linear motion 30 m 500 or 700
VIBRATION ISOLATORS FOR PORTABLE VIBRATING TOOLS
 Industrial Health, 1981, 19, 99. VIBRATION ISOLATORS FOR PORTABLE VIBRATING TOOLS PART 6. PROBLEMS CONCERNING VIBRATION FORCE MEASUREMENT Toshisuke MIWA,* Yoshiharu YONEKAWA,* Kazuo KANADA* and Kyo KOBAYASHI**
Understanding How Frequency, Beam Patterns of Transducers, and Reflection Characteristics of Targets Affect the Performance of Ultrasonic Sensors
 Characteristics of Targets Affect the Performance of Ultrasonic Sensors By Donald P. Massa, President and CTO of Massa Products Corporation Overview of How an Ultrasonic Sensor Functions Ultrasonic sensors
Design of a double clad optical fiber with particular consideration of leakage losses
 Vol. (4), pp. 7-62 October, 23 DOI.897/JEEER23.467 ISSN 993 822 23 Academic Journals http://www.academicjournals.org/jeeer Journal of Electrical and Electronics Engineering Research Full Length Research
National Accelerator Laboratory
 Fermi National Accelerator Laboratory FERMILAB-Conf-96/259 Continued Conditioning of the Fermilab 400 MeV Linac High-Gradient Side-Couple Cavities Thomas Kroc et al. Fermi National Accelerator Laboratory
Appendix 6-F: Electric and Magnetic Field Study Report
 Draft Environmental Impact Statement Cricket Valley Energy Project Dover, NY Appendix 6-F: Electric and Magnetic Field Study Report ELECTRIC & MAGNETIC FIELDS (EMFs) STUDY REPORT For the CRICKET VALLEY
describe sound as the transmission of energy via longitudinal pressure waves;
 1 Sound-Detailed Study Study Design 2009 2012 Unit 4 Detailed Study: Sound describe sound as the transmission of energy via longitudinal pressure waves; analyse sound using wavelength, frequency and speed
Appendix III Graphs in the Introductory Physics Laboratory
 Appendix III Graphs in the Introductory Physics Laboratory 1. Introduction One of the purposes of the introductory physics laboratory is to train the student in the presentation and analysis of experimental
REFLECTION AND TRANSMISSION OF LAMB WAVES AT DISCONTINUITY IN PLATE Z. Liu NDT Systems & Services AG, Stutensee, Germany
 REFLECTION AND TRANSMISSION OF LAMB WAVES AT DISCONTINUITY IN PLATE Z. Liu NDT Systems & Services AG, Stutensee, Germany Abstract: Lamb waves can be used for testing thin plate and pipe because they provide
OPERATING PAVEMENT PROFILOGRAPH AND EVALUATING PROFILES
 Test Procedure for OPERATING PAVEMENT PROFILOGRAPH AND EVALUATING PROFILES Texas Department of Transportation TxDOT Designation: Tex-1000-S Effective Date: August 1999 1. SCOPE 1.1 This method covers the
Module 5 : Design of Deep Foundations. Lecture 20 : Introduction [ Section 20.1 : Introduction ]
![Module 5 : Design of Deep Foundations. Lecture 20 : Introduction [ Section 20.1 : Introduction ]](/thumbs/82/86090197.jpg "Module 5 : Design of Deep Foundations. Lecture 20 : Introduction [ Section 20.1 : Introduction ]") Lecture 20 : Introduction [ Section 20.1 : Introduction ] Objectives In this section you will learn the following Introduction Lecture 20 : Introduction [ Section 20.1 : Introduction ] INTRODUCTION The
Lecture 20 : Introduction [ Section 20.1 : Introduction ] Objectives In this section you will learn the following Introduction Lecture 20 : Introduction [ Section 20.1 : Introduction ] INTRODUCTION The
Intext Exercise 1 Question 1: How does the sound produced by a vibrating object in a medium reach your ear?
 Intext Exercise 1 How does the sound produced by a vibrating object in a medium reach your ear? When an vibrating object vibrates, it forces the neighbouring particles of the medium to vibrate. These vibrating
EFFECTS OF ACCELEROMETER MOUNTING METHODS ON QUALITY OF MEASURED FRF S
 The 21 st International Congress on Sound and Vibration 13-17 July, 2014, Beijing/China EFFECTS OF ACCELEROMETER MOUNTING METHODS ON QUALITY OF MEASURED FRF S Shokrollahi Saeed, Adel Farhad Space Research
Moving Man Introduction Motion in 1 Direction
 Moving Man Introduction Motion in 1 Direction Go to http://www.colorado.edu/physics/phet and Click on Play with Sims On the left hand side, click physics, and find The Moving Man simulation (they re listed
The Basics. HECRAS Basis Input. Geometry Data - the basics. Geometry Data. Flow Data. Perform Hydraulic Computations. Viewing the Output
 The Basics HECRAS Basis Input Geometry Data. Flow Data. Perform Hydraulic Computations by G. Parodi WRS ITC The Netherlands Viewing the Output ITC Faculty of Geo-Information Science and Earth Observation
VIBRATION MEASUREMENTS IN THE KEKB TUNNEL. Mika Masuzawa, Yasunobu Ohsawa, Ryuhei Sugahara and Hiroshi Yamaoka. KEK, OHO 1-1 Tsukuba, Japan
 IWAA2004, CERN, Geneva, 4-7 October 2004 VIBRATION MEASUREMENTS IN THE KEKB TUNNEL Mika Masuzawa, Yasunobu Ohsawa, Ryuhei Sugahara and Hiroshi Yamaoka KEK, OHO 1-1 Tsukuba, Japan 1. INTRODUCTION KEKB is
sue-m-147 October 1965
 sue-m-147 October 1965 A perturbation measurement technique has been developed at Stanford University which determines the phase and field strength at a point inside a microwave structure by measuring
Physical Science Test Form A Test 5: Waves. Matching. 1. diffraction
 Physical Science Test Form A Test 5: Waves Matching. 1. diffraction 2. intensity 3. interference 4. mechanical wave 5. medium 6. pitch 7. reflection 8. refraction 9. translucent 10. transverse wave A.
Waves & Interference
 Waves & Interference I. Definitions and Types II. Parameters and Equations III. Sound IV. Graphs of Waves V. Interference - superposition - standing waves The student will be able to: HW: 1 Define, apply,
Experiment-4 Study of the characteristics of the Klystron tube
 Experiment-4 Study of the characteristics of the Klystron tube OBJECTIVE To study the characteristics of the reflex Klystron tube and to determine the its electronic tuning range EQUIPMENTS Klystron power
SUPPLEMENTARY INFORMATION
 Bifurcation-based acoustic switching and rectification N. Boechler, G. Theocharis, and C. Daraio Engineering and Applied Science, California Institute of Technology, Pasadena, CA 91125, USA Supplementary
NOISE REDUCTION IN SCREW COMPRESSORS BY THE CONTROL OF ROTOR TRANSMISSION ERROR
 C145, Page 1 NOISE REDUCTION IN SCREW COMPRESSORS BY THE CONTROL OF ROTOR TRANSMISSION ERROR Dr. CHRISTOPHER S. HOLMES HOLROYD, Research & Development Department Rochdale, Lancashire, United Kingdom Email:
CHAPTER 3 THE DESIGN OF TRANSMISSION LOSS SUITE AND EXPERIMENTAL DETAILS
 35 CHAPTER 3 THE DESIGN OF TRANSMISSION LOSS SUITE AND EXPERIMENTAL DETAILS 3.1 INTRODUCTION This chapter deals with the details of the design and construction of transmission loss suite, measurement details
EXAMPLE 1-4 EXAMPLE 1-5
 EXAMPLE 1- Calculate the maximum shear stress τmax in a simply supported wood beam carrying a uniform load of (w=18 kn/m) if the length is 1.75 m and the cross section is rectangular with width 150 mm
Chapter 16. Waves and Sound
 Chapter 16 Waves and Sound 16.1 The Nature of Waves 1. A wave is a traveling disturbance. 2. A wave carries energy from place to place. 1 16.1 The Nature of Waves Transverse Wave 16.1 The Nature of Waves
Chapter 12. Preview. Objectives The Production of Sound Waves Frequency of Sound Waves The Doppler Effect. Section 1 Sound Waves
 Section 1 Sound Waves Preview Objectives The Production of Sound Waves Frequency of Sound Waves The Doppler Effect Section 1 Sound Waves Objectives Explain how sound waves are produced. Relate frequency
Experimental investigation of the acousto-electromagnetic sensor for locating land mines
 Proceedings of SPIE, Vol. 3710, April 1999 Experimental investigation of the acousto-electromagnetic sensor for locating land mines Waymond R. Scott, Jr. a and James S. Martin b a School of Electrical
RECOMMENDATION ITU-R S.1528
 Rec. ITU-R S.158 1 RECOMMENDATION ITU-R S.158 Satellite antenna radiation patterns for non-geostationary orbit satellite antennas operating in the fixed-satellite service below 30 GHz (Question ITU-R 31/4)
Bending of Sparklers
 Bending of Sparlers Mirajuddin Abdullah (1,a), Shafira Khairunnisa (2), and Fathan Abar (3) (1) Department of Physics, Bandung Institute of Technology, Jl. Ganesha 1 Bandung 4132, Indonesia (2) Department
Channel Modelling ETIM10. Propagation mechanisms
 Channel Modelling ETIM10 Lecture no: 2 Propagation mechanisms Ghassan Dahman \ Fredrik Tufvesson Department of Electrical and Information Technology Lund University, Sweden 2012-01-20 Fredrik Tufvesson
ASSESSMENT AND PREDICTION OF STRUCTURE-BORNE RAIL NOISE IN DOMESTIC DWELLINGS
 ASSESSMENT AND PREDICTION OF STRUCTURE-BORNE RAIL NOISE IN DOMESTIC DWELLINGS Abstract Supreet Singh Chadha 1 and Sangarapillai Kanapathipillai 1 1 School of Mechanical and Manufacturing Engineering UNSW
CHAPTER 12 SOUND ass/sound/soundtoc. html. Characteristics of Sound
 CHAPTER 12 SOUND http://www.physicsclassroom.com/cl ass/sound/soundtoc. html Characteristics of Sound Intensity of Sound: Decibels The Ear and Its Response; Loudness Sources of Sound: Vibrating Strings
We will study all three methods, but first let's review a few basic points about units of measurement.
 WELCOME Many pay items are computed on the basis of area measurements, items such as base, surfacing, sidewalks, ditch pavement, slope pavement, and Performance turf. This chapter will describe methods
DQ-58 C78 QUESTION RÉPONSE. Date : 7 février 2007
 DQ-58 C78 Date : 7 février 2007 QUESTION Dans un avis daté du 24 janvier 2007, Ressources naturelles Canada signale à la commission que «toutes les questions d ordre sismique soulevées par Ressources naturelles
A Dissertation Presented for the Doctor of Philosophy Degree. The University of Memphis
 A NEW PROCEDURE FOR ESTIMATION OF SHEAR WAVE VELOCITY PROFILES USING MULTI STATION SPECTRAL ANALYSIS OF SURFACE WAVES, REGRESSION LINE SLOPE, AND GENETIC ALGORITHM METHODS A Dissertation Presented for
ULTRASONIC DEFECT DETECTION IN BILLET USING TIME- OF-FLIGHT OF BOTTOM ECHO
 ULTRASONIC DEFECT DETECTION IN BILLET USING TIME- OF-FLIGHT OF BOTTOM ECHO Ryusuke Miyamoto Graduate School of Systems and Information Engineering, University of Tsukuba, Tsukuba, Ibaraki 305-8573 Japan