Anchorage Port Modernization Program In air Noise and Ground borne Vibration Analysis Monitoring Report
|
|
|
- Janis Floyd
- 5 years ago
- Views:
Transcription


1 FINAL REPORT Anchorage Port Modernization Program In air Noise and Ground borne Vibration Analysis Monitoring Report Prepared for Municipality of Anchorage/Port of Anchorage 1980 Anchorage Port Road Anchorage, Alaska August 26, 2016 CH2M HILL, Inc. Anchorage, Alaska
2 This page intentionally left blank.
3 Executive Summary Aging infrastructure at the Port of Anchorage (POA) has far exceeded its economic and design life. Some of the oldest parts of the current infrastructure date back to the early 1960s. The POA is planning to undertake a reconstruction project the Anchorage Port Modernization Program (APMP) to improve and update these facilities. The APMP is planned for construction between 2017 and 2022 or later, dependent on available funding. In advance of the APMP, the POA conducted a smaller scale effort during spring 2016, known as the Test Pile Program (TPP). The TPP consisted of installing 10, 48 inch steel pipe indicator test piles adjacent to existing POA facilities. The primary purpose was to evaluate the performance of the pile installation equipment and methods under conditions similar to what will be used for production pile installation during the APMP. The information obtained during the TPP will be used to help inform, design, and implement the APMP. The TPP was multifaceted, and a number of investigations and data sets were collected as the piles were installed. One of the efforts entailed an in air noise and ground borne vibration technical analysis to assess the potential impacts from the future construction of the APMP. The goal of this analysis is to evaluate how construction noise and ground borne vibration during the APMP might affect residences close to the POA as well as workers within the POA boundary. This report summarizes the in air noise and ground borne vibration analysis conducted during the TPP. In general, results of the in air noise and ground borne vibration monitoring are summarized as follows: In air noise monitoring synopsis (residential areas): Monitored noise levels from pile driving did not exceed the Municipality of Anchorage (MOA) code limit of 80 A weighted decibels (dba) L eq (equivalent continuous noise level, hourly). According to the long term monitoring effort, sound levels in the Government Hill neighborhood during pile driving activities ranged from 56 to 73 dba L eq, while sound levels in the Cherry Hill neighborhood ranged from 54 to 78 dba L eq. The loudest monitored pile driver sound levels were generally associated with the hydraulic impact pile driver followed by the diesel impact pile driver. Vibratory pile driver sound levels were measurable, but were lower than impact pile driver sound levels. In air noise monitoring synopsis (POA tenant locations): Monitored pile driving noise levels were below the Occupational Safety & Health Administration maximum allowable impact levels, but fall within ranges for adverse occupational exposures during the course of an 8 hour workday. All personnel required to work outside at the shoreline or within 150 feet of pile driving operations are recommended to wear hearing protection. Common types of hearing protection include ear plugs (disposable or reusable), semi insert ear plugs, and ear muffs. Noise levels collected inside facilities near the piledriving test locations do not indicate any exposures of concern. Ground borne vibration monitoring synopsis: Monitored vibration levels attenuated quickly with distance from the piles driven. As a result, ground borne vibration from pile driving activity was not perceptible or of a level that could be readily identified over baseline ground borne vibration levels in the neighborhoods. The phenomenon experienced by some residents in the Government Hill neighborhood is most likely a result of low frequency noise associated with impact pile driving rather than ground borne vibration. PE RPT 001 NOISEVIBRATANALYSIS I
4 This page intentionally left blank. II PE RPT 001 NOISEVIBRATANALYSIS
5 Contents Section Page Executive Summary... i Acronyms and Abbreviations... vii 1 Introduction Report Purpose and Overview Test Pile Program Details Regulatory Environment In air Community Noise Regulations In air Port of Anchorage Worker and Tennant Noise Regulations Ground Borne Vibration Guidelines Methodology In air Noise Monitoring Locations (Residential Areas) Long term Monitoring Short term Monitoring In air Noise Monitoring Locations (Port of Anchorage Tenant Locations) Ground borne Vibration Monitoring Locations Data Collected Noise Data Vibration Data Meteorological Data Results/Data Results Synopsis Baseline Sound Levels Noise Monitoring by Pile Location Pile Location Pile Location Pile Location Pile Location Pile Location Pile Location Pile Location Pile Location Pile Location Discussion Noise Measurements (Port of Anchorage Tenants) Short term Ground borne Vibration Measurements Summary and Next Steps Community Noise and Vibration Considerations Port of Anchorage Tenant and Employee Noise Exposure References PE RPT 001 NOISEVIBRATANALYSIS III
6 CONTENTS Tables Table 1. Baseline Daytime Sound Levels Table 2. Pile 8 Sound Levels Table 3. Pile 9 Sound Levels Table 4. Pile 4 Sound Levels Table 5. Pile 5 Sound Levels Table 6. Pile 2 Sound Levels Table 7. Pile 7 Sound Levels Table 8. Pile 10 Sound Levels Table 9. Pile 6 Sound Levels Table 10. Pile 3 Sound Levels Table 11. Summary of In air Noise Measurements (POA Tenants) Table 12. Summary of Ground borne Vibration Measurements Figures Figure 1. Residential related Noise Monitoring Locations... 7 Figure 2. LT 01 Site: Government Hill Long term In air Noise Monitoring Site on Bluff within the POA Boundary... 8 Figure 3. LT 02 Site: Cherry Hill Long term In air Noise Monitoring Site within JBER... 9 Figure 4. ST 01 Site: Government Hill Short term Noise Monitoring Site (Brown s Point Park)... 9 Figure 5. ST 02 Site: Government Hill Short term Noise Monitoring Site (Susan Nightingale McKay Memorial Park)... 9 Figure 6. ST 03 Site: Cherry Hill Short term Noise Monitoring Site (southern site) Figure 7. ST 04 Site: Cherry Hill Short term Noise Monitoring Site (northern site) Figure 8. POA Tenant Noise Monitoring Locations Figure 9. Vibration Equipment: Accelerometer and Geophone Cord Figure 10. Vibration Monitoring Equipment Set Up Onshore near Pile Driving Location Figure 11. Setting Up Vibration Monitoring Equipment near Pile Driving Location Figure 12. Vibration Monitoring Locations Figure 13. Pile 8 Measurement Locations Figure 14. Pile 8 Time history at the Government Hill Long term Monitor (LT 01) Figure 15. Pile 8 Time history at the Cherry Hill Long term Monitor (LT 02) Figure 16. Pile 9 Measurement Locations Figure 17. Pile 9 Time history at the Government Hill Long term Monitor (LT 01) Figure 18. Pile 9 Time history at the Cherry Hill Long term Monitor (LT 02) Figure 19. Pile 4 Measurement Locations Figure 20. Pile 4 Time history at the Government Hill Long term Monitor (LT 01) Figure 21. Pile 4 Time history at the Cherry Hill Long term Monitor (LT 02) Figure 22. Pile 5 Measurement Locations Figure 23. Pile 5 Time history at the Government Hill Long term Monitor (LT 01) Figure 24. Pile 5 Time history at the Cherry Hill Long term Monitor (LT 02) Figure 25. Pile 2 Measurement Locations Figure 26. Pile 2 Time history at the Government Hill Long term Monitor (LT 01) Figure 27. Pile 2 Time history at the Cherry Hill Long term Monitor (LT 02) Figure 28. Pile 7 Measurement Locations Figure 29. Pile 7 Time history at the Government Hill Long term Monitor (LT 01) Figure 30. Pile 7 Time history at the Cherry Hill Long term Monitor (LT 02) Figure 31. Pile 10 Measurement Locations Figure 32. Pile 10 Time history at the Government Hill Long term Monitor (LT 01) IV PE RPT 001 NOISEVIBRATANALYSIS
7 Figure 33. Pile 10 Time history at the Cherry Hill Long term Monitor (LT 02) Figure 34. Pile 6 Measurement Locations Figure 35. Pile 6 Time history at the Cherry Hill Long term Monitor (LT 02) Figure 36. Pile 3 Measurement Location Figure 37. Pile 3 Time history at the Cherry Hill Long term Monitor (LT 02) Figure 38. Monitored Spectral Sound Levels at Government Hill Long term Monitor (LT 01) Figure 39. Monitored Spectral Sound Levels at Cherry Hill Long term Monitor (LT 02) Appendices Appendix A: Noise and Vibration Monitoring Equipment Laboratory Calibration Sheets PE RPT 001 NOISEVIBRATANALYSIS v
8
9 Acronyms and Abbreviations APMP db Caltrans dba dbc EPA F FTA IP JBER L eq L max L min L n MOA mph OSHA POA PPV rms SLM TPP Anchorage Port Modernization Program decibel California Department of Transportation A weighted decibel C weighted decibel U.S. Environmental Protection Agency Degrees Fahrenheit Federal Transit Administration indicator pile Joint Base Elmendorf Richardson Equivalent continuous noise level Maximum noise level Minimum noise level Statistical sound levels, representing the sound level exceeded for n percent of time Municipality of Anchorage miles per hour Occupational Safety & Health Administration Port of Anchorage peak particle velocity root mean square sound level meter Test Pile Program PE RPT 001 NOISEVIBRATANALYSIS VII
10
11 1 Introduction INTRODUCTION The Port of Anchorage (POA) is vital infrastructure for moving goods in and out of Alaska. However, some of the oldest components of the current infrastructure date back more than 50 years. Due to the deteriorating conditions of the pilings, the docks no longer meet seismic standards and are unlikely to survive a major earthquake. The POA began initial work on the current Anchorage Port Modernization Program (APMP) in The project is needed to provide safe, reliable, and cost effective cargo and fuel operations to Anchorage and the state long into the future. The APMP is currently planned for construction between 2017 and 2022 or later, depending upon funding availability. 1.1 Report Purpose and Overview Pile driving is a commonly used method for coastal and offshore construction. However, pile driving produces high sound pressure levels in both the surrounding air and underwater environment. The POA elected to conduct this in air noise and ground borne vibration analysis to proactively assess and address potential impacts associated with installation of the indicator piles as part of the Test Pile Project (TPP). The current phase the TPP began in April 2016, with the first test piles driven in May The POA initiated the TPP to collect data that will be used to inform the design of APMP improvements. In air noise from pile driving had been identified as a potential concern to nearby residents, especially those in the Government Hill and Cherry Hill neighborhoods, along with tenants physically located at the POA. Noise measurements were taken at key locations within and adjacent to POA property during the TPP s pile driving activities to help determine the effects of pile driving noise. Measurements included continuous noise readings at long term locations, combined with short term readings taken throughout the POA property and within the two nearby residential neighborhoods (Government Hill and Cherry Hill). Ground borne vibration monitoring data were also collected in those neighborhoods. This In air Noise and Ground borne Vibration Analysis Monitoring Report presents an assessment of the in air noise and ground borne vibration data collected during the pile driving activities of the TPP that occurred between April and June The following multi faceted monitoring approach was used: Conduct baseline acoustic monitoring Conduct short term monitoring of pile driving in air noise and ground borne vibration Conduct continuous long term noise monitoring during the TPP Public input early in the TPP identified the need to evaluate ground borne vibration monitoring in addition to traditional noise monitoring. Public involvement was an important component and one of the key drivers of the in air noise and ground borne vibration analysis. To keep the public engaged, the project team hosted a neighborhood noise monitoring event at one of the Government Hill parks on May 2, Specialists were on hand to show how the noise monitors worked and what information was being collected. During other short term in air monitoring events, project team members spoke to members of the public who stopped by to inquire about the project or the monitoring effort. The project team also presented at a number of Government Hill and Cherry Hill community meetings during spring PE RPT 001 NOISEVIBRATANALYSIS 1
12 INTRODUCTION 1.2 Test Pile Program Details The TPP consisted of installing 10, 48 inch steel pipe indicator test piles adjacent to the existing POA facilities. Installation of the indicator piles occurred with a combination of a vibratory hammer (used to drive the pile the first 50 feet) and an impact hammer (used to drive the pile to final tip elevation) to achieve the ultimate depth of approximately 150 feet below mudline. Noise and ground borne vibration are variable for a number of reasons, including the type of pile driver being used. Vibratory hammers cause the sediment surrounding the pile to liquefy, allowing the pile to penetrate the substrate. Generally, vibratory pile driving results in less intense in air noise levels, but may be more impactful underwater. Impact hammers consist of a heavy piston that is lifted and dropped against the top of the pile. Impact pile driving generally results in higher in air sound levels, but can be less impactful to the underwater environment. While not specifically identified as a goal of the in air monitoring program initially, variability in sound levels for the various pile hammers was also achieved by the in air noise monitoring effort. Hammers: The construction contractor used the following types of hammers: APE 400 Vibratory Hammer, APE D180 Diesel Impact Hammer, and APE 15 4 Hydraulic Impact Hammer. Diesel hammers carry their own fuel and generate their own power internally. Hydraulic hammers use an external hydraulic source, which then is left to fall freely or is accelerated downward by pressurized gas above the piston. Each of these hammers has its own acoustic emission level, which was captured as part of this report. Hydroacoustic abatement systems: The 10 piles were installed using a combination of different pile hammers and hydroacoustic noise abatement systems. These hydroacoustic noise abatement systems have little to no influence on monitored in air sound levels; therefore, they are not applicable to the analysis provided in this document. The hydroacoustic data collection and analysis of the effectiveness of the hydroacoustic abatement systems are being addressed under a separate effort and are not part of this report. 1.3 Regulatory Environment The following subsections provide information on the in air noise and ground borne vibration regulatory limits and guidelines In air Community Noise Regulations Noise and vibration regulations and guidelines provide the regulatory framework for the TPP and the APMP. The Municipality of Anchorage (MOA) provides construction noise limits via the Municipal Code, specifically Section The following text from the MOA Municipal Code applies to construction noise from the project: Construction: No person shall operate or cause the operation of any tools or equipment used in construction, drilling, repair, alteration or demolition work: a. So that the sound therefrom creates a noise disturbance across a residential real property boundary or within a noise sensitive zone between the hours of p.m. and 6:00 a.m. during the construction season, between the hours of 10:00 p.m. and 7:00 a.m. during other months, or at any time on Sundays or state holidays; b. So that the sound level therefrom exceeds an L eq of 80 db(a) at or within a residential real property boundary or within a noise sensitive zone during any one hour of the daily period from 6:00 a.m. to 10:00 p.m. during the construction season or from 7:00 a.m. to 10:00 p.m. during other months; or 2 PE RPT 001 NOISEVIBRATANALYSIS
13 PE RPT 001 NOISEVIBRATANALYSIS 3 INTRODUCTION c. So that the sound level therefrom exceeds an L eq of 80 db(a) at or within a commercial or industrial real property boundary during any one hour of the daily period from 6:00 a.m. to 10:00 p.m. during the construction season or from 7:00 a.m. to 10:00 p.m. during other months In air Port of Anchorage Worker and Tennant Noise Regulations Noise exposures for workers and tenants were assessed against thresholds established by Occupational Safety & Health Administration (OSHA) and U.S. Environmental Protection Agency (EPA) guidelines. Note that there is no functional difference between construction and industrial noise standards Occupational Health & Safety Administration OSHA has identified maximum instantaneous sound level limits for workers as well as total noise exposure limits for periods of work. The OSHA maximum regulatory limit for hazardous impact noise is 140 A weighted decibels (dba) U.S. Environmental Protection Agency Noise exposure for workers is assessed for an entire 8 hour work shift. Noise levels measured closest to the pile driving activities do not reach the continuous 90 dba threshold for an entire 8 hour work shift, which is necessary to classify the pile driving as hazardous noise. The EPA has identified a 24 hour average exposure level of 70 dba as the level of environmental noise that would prevent any measurable hearing loss over a lifetime. Likewise, levels of 55 dba outdoors and 45 dba indoors are identified as preventing activity interference and annoyance. These levels of noise are considered to be those that would permit spoken conversation and other activities such as sleeping, working, and recreation, which are part of the daily human condition. The levels are not single event, or peak levels. Instead, they represent averages of acoustic energy over short periods (e.g., 8 or 24 hours) and over long periods (e.g., years). For example, occasional higher noise levels would be consistent with a 24 hour energy average of 70 dba, so long as a sufficient amount of relative quiet is experienced for the remaining period (EPA 1974). This study did not collect a day/night average noise exposure reading. This 70 dba average, however, is only a recommendation, and neither the EPA nor the Federal Transit Administration (FTA) has identified any adverse hearing impacts from industrial operations with noise levels similar to those identified here (FTA 2016) Ground Borne Vibration Guidelines Locally, the MOA provides ground borne vibration regulation that is applicable to the project. The MOA s regulation is a nuisance based ordinance that is provided in MOA Municipal Code. Specifically, the following consideration for vibration is stated in Section 15.70: Vibration: No person shall operate or cause the operation of any device that produces lowfrequency, inaudible sound that creates vibration above the vibration perception threshold of any individual within a residential real property boundary or within a noise sensitive zone between the hours of 10:00 p.m. and 7:00 a.m. the following day. Additional guidelines have been established by the FTA and the California Department of Transportation (Caltrans). The Caltrans Transportation and Construction Induced Vibration Guidance Manual (Caltrans 2005) guidelines are particularly useful to the TPP since they are specific to pile driving. Construction ground borne vibration associated with pile driving efforts is characterized as a transient groundborne vibratory source because it is not a more steady ground borne vibration source like that of traffic on a busy railroad corridor. For context, Caltrans guidelines indicate that for transient sources, a peak particle velocity (PPV) inches per second of 0.04 is barely perceptible, and PPV lower than that is generally not perceptible (Caltrans 2005). In the context of building damage, the minimum PPV level when damage may occur (i.e., at extremely fragile historic buildings, ancient monuments, and ruins) is
14 INTRODUCTION 0.08 PPV. The structures on POA property are characterized as modern industrial/commercial buildings, which Caltrans indicates have a damage criterion of 0.5 PPV. 4 PE RPT 001 NOISEVIBRATANALYSIS
15 2 Methodology TPP in air noise and ground borne vibration monitoring was conducted in the neighborhoods surrounding the POA, while tenant noise monitoring was completed outside tenant locations within the POA itself. Neighborhood noise monitoring consisted of a combination of (1) long term unattended monitors set up as semi permanent noise monitoring stations that monitored sound levels 24 hours per day, 7 days per week, for the duration of the TPP; and (2) short term attended monitors with an operator present during some of the pile driving efforts. Ground borne vibration levels were monitored in the neighborhoods simultaneously with the short term noise monitors while some of the piles were driven. Noise levels at tenant locations were measured outside tenant buildings on POA property. All noise measurements were completed with Larson Davis 831 American National Standards Institute Type 1 sound level meters equipped with 1/2 inch microphones and windscreens. In addition, Vaisala Weather Transmitters (Model WXT520) were deployed to log weather conditions at the long term monitoring locations. Prior to deployment, or the start of a measurement, the calibration of each sound level meter was verified in the field using a hand calibrator, specifically a Larson Davis CAL200. Calibration sheets are included in Appendix A. The portable meteorological stations measured wind speed, precipitation, temperature, and humidity. Microphones were protected by windscreens that are effective up to 10 miles per hour (mph). Data were downloaded and battery power swapped out approximately weekly, if not more often. At both neighborhoods, pile driving noise from a minimum of two pile installations was also collected during the short term monitoring events. These measurements were conducted for slightly longer periods to capture the noise associated with one continuous pile driving sequence. The pile driving sequence generally consisted of the piles being set via vibratory hammer, followed by impact pile driving, to achieve the ultimate depth of approximately 150 feet below the mud line. Audio recordings of each pile driving effort were collected during the short term measurements so that the quality and content of pile driving noise in the community can be conveyed to the public, as necessary. Additionally, during the short term measurements, video recordings of each pile driven were attempted where views to a specific pile were possible; in some instances, video recording was not possible due to intervening buildings, topography, and/or vegetation blocking the sight line. After installation of the first pile, the POA received comments from the public that identified concerns relating to suspected ground borne vibration levels from pile driving. To address this concern, the POA elected to conduct ground borne vibration monitoring. Ground borne vibration levels were monitored with Instantel Micromate portable vibration monitors. One vibration monitor was placed in relatively close proximity (i.e., within 100 feet) to the pile being driven, while a second vibration monitor was deployed in the neighborhoods, coincidental with a short term noise monitor. The tenant noise monitoring effort consisted of baseline noise measurements at the pile driving location and occupied locations near the work site. Measurements collected during pile driving operations were used to develop noise gradients that identify the distance from the source (pile driving) to areas of hazardous noise exceeding levels of the 90 dba 8 hour hazardous noise for workers limit. If a POA tenant location was identified within a hazardous noise zone, interior noise levels during pile driving were analyzed. 2.1 In air Noise Monitoring Locations (Residential Areas) Two long term monitoring sites were set up for the duration of the TPP construction activities. Additionally, several short term monitoring events occurred in nearby residential areas during many of the pile driving events. During the short term monitoring events, more mobile neighborhood measurements were conducted at several locations within the Government Hill neighborhood. These PE RPT 001 NOISEVIBRATANALYSIS 5
16 METHODOLOGY extra neighborhood measurements were done to characterize pile driving noise within the neighborhood, farther away from the POA and parks than the other monitoring locations Long term Monitoring Noise levels at two long term monitoring sites were measured between April 27 and June 3, These unattended noise monitors collected both baseline noise levels and noise levels during the pile driving events. LT 01 Long term monitoring site at the POA near Government Hill: A long term noise monitoring station was located on the bluff near the southern boundary of the POA (see Figure 1 and Figure 2). This site was selected due to its secure location, open exposure to construction activities, and proximity to the Government Hill neighborhood. Observed non pile driving sound sources included POA related sources such as heavy truck and construction noise, railroad traffic, roadway traffic, and military and non military aircraft overhead. Natural sound sources included wind interacting with vegetation and birds. LT 02 Long term monitor site at the Cherry Hill residential area: Based on a meeting held on April 5, 2016, with JL Properties/Aurora Housing representatives, a second long term noise monitoring station was located within the Cherry Hill neighborhood on Joint Base Elmendorf Richardson (JBER). This monitoring site was located between a residential building and an adjacent playground. The noise meter was affixed to a pole approximately 20 feet in the air to be representative of noise levels in living spaces located in the second story building apartment units (see Figure 3). Monitoring noise levels at this height is considered conservative since shielding from ground effects is less at this height. Observed non pile driving sound sources included POA related noises such as heavy truck and construction noise, railroad traffic, roadway traffic, and military and non military aircraft overhead. Natural sound sources included wind interacting with vegetation and birds. Equipment: Noise specialists set up Larson Davis 831 American National Standards Institute Type 1 sound level meters (SLMs) equipped with 1/2 inch microphones and windscreens at the two long term locations. In addition, Vaisala Weather Transmitters (model WXT520) were deployed to log weather conditions at both long term measurement sites. Prior to the start of the long term measurements, field calibration of the Larson Davis 831 was verified using a hand calibrator (Larson Davis CAL200). (All noise monitoring equipment used for the in air noise monitoring was calibrated within the previous year in a laboratory; see Appendix A.) In the field, the SLM performed an internal self calibration daily. Battery power for the SLM was manually replaced approximately every 5 to 10 days, at which time data for the previous monitoring period were downloaded. 6 PE RPT 001 NOISEVIBRATANALYSIS


17 METHODOLOGY Figure 1. Residential related Noise Monitoring Locations PE RPT 001 NOISEVIBRATANALYSIS 7


18 METHODOLOGY 2016 Test Pile Program Figure 2. LT 01 Site: Government Hill Long term In air Noise Monitoring Site on Bluff within the POA Boundary 8 PE RPT 001 NOISEVIBRATANALYSIS

.")
19 Figure 3. LT 02 Site: Cherry Hill Long term In air Noise Monitoring Site within JBER Short term Monitoring During the TPP, pile driving noise was also collected via short term monitors to capture the noise associated with the pile driving sequence. METHODOLOGY Short term measurements were conducted at four measurement locations (two sites at Government Hill concurrently or two sites at Cherry Hill concurrently) to evaluate the existing acoustic environment at noise sensitive areas outside the POA property (i.e., neighborhood residential areas). Based on which pile was being driven, the analysts chose the short term site that was closest to the pile (e.g., either the Cherry Hill or the Government Hill location). Generally, the short term monitoring was conducted at Cherry Hill for piles located farther north. For piles farther south, the short term monitoring was conducted in the Government Hill location. Government Hill: Within the Government Hill neighborhood, two park locations were selected for short term noise monitoring due to their open exposure to the POA and proximity to residences. These parks are Brown s Point Park (ST 01 site) and Susan Nightingale McKay Memorial Park (ST 02 site; see Figure 4 and Figure 5). Observed non pile driving sound sources at Brown s Point Park included POA related truck traffic and construction, train horns, vehicles (trucks and motorcycles), birds, and military and non military aircraft overhead. General observed sounds sources at Susan Nightingale McKay Memorial Park were dominated by POA related truck traffic and construction as well as military and non military aircraft overhead. The indicator pile (IP) tests observed from the Government Hill short term location included IP5, IP7, IP9, and IP10. Figure 4. ST 01 Site: Government Hill Short term Noise Monitoring Site (Brown s Point Park) Figure 5. ST 02 Site: Government Hill Short term Noise Monitoring Site (Susan Nightingale McKay Memorial Park) PE RPT 001 NOISEVIBRATANALYSIS 9

.")
20 METHODOLOGY Cherry Hill: Within the Cherry Hill neighborhood, two locations were selected for short term noise monitoring based on proximity to residences. These measurement locations were adjacent to the multifamily housing units situated atop the bluff closest to the POA. One was located on the southern end of the Cherry Hill residential housing area (ST 03 site) and the other on the northern end of the housing complexes (ST 04 site) closest to the POA property (see Figure 6 and Figure 7). Observed non pile driving sound sources at the two short term noise monitoring sites at Cherry Hill were the same as those sound sources observed at the long term station located at Cherry Hill. The IP tests observed from the Government Hill short term location included IP4 and IP2. Figure 6. ST 03 Site: Cherry Hill Short term Noise Monitoring Site (southern site) Figure 7. ST 04 Site: Cherry Hill Short term Noise Monitoring Site (northern site) Mobile monitoring locations ( Neighborhood Measurements ): During the short term measurements taken on Government Hill, noise specialists also collected brief mobile noise measurements in response to community concerns. This entailed taking the noise meter from one of the parks and setting it up to collect spot measurements from varying distances farther into the residential neighborhood from the short term monitoring sites. This was done to determine how pile driving noise attenuated with distance. 10 PE RPT 001 NOISEVIBRATANALYSIS
21 2.2 In air Noise Monitoring Locations (Port of Anchorage Tenant Locations) METHODOLOGY Within the POA boundary, 11 potential sites were initially identified for noise monitoring. A meeting with tenants was scheduled for April 14, 2016, that was intended to further define specific locations for monitoring. Generally, it was decided that locations in proximity to pile driving activities would be monitored individually, and locations that were farther removed would have grouped or representative noise monitoring conducted. Monitoring consisted of noise measurements near the pile driving location and occupied locations near the work site (Figure 8). Measurements collected during the pile driving operations are used to develop noise gradients that identify the distance from the source (pile driving) to the threshold of hazardous noise levels (90 dba OSHA classified hazardous noise) and 80 dba (MOA Noise Ordinance construction noise limit). Occupied or potentially occupied facilities identified within the hazardous noise zones were assessed for interior noise levels during the pile driving process and during normal operations. For comparison purposes, baseline sound levels were also collected to identify the change in noise resulting from pile driving at tenant and worker locations. Due to the duration of TTP activities, and to minimize any daily noise variations, both ambient and TPP impacted noise measurements were collected on the same day. PE RPT 001 NOISEVIBRATANALYSIS 11


22 METHODOLOGY Figure 8. POA Tenant Noise Monitoring Locations 2016 Test Pile Program 12 PE RPT 001 NOISEVIBRATANALYSIS
. This occurred at the following specific sites: ST 01, ST 02, ST 03, ST 04, NM01, and NM02 (see Figure 12).")

23 2.3 Ground borne Vibration Monitoring Locations METHODOLOGY During several of the short term in air noise monitoring events, vibration equipment (Instantel Micromate units) was deployed (see Figure 9, Figure 10, and Figure 11). This occurred at the following specific sites: ST 01, ST 02, ST 03, ST 04, NM01, and NM02 (see Figure 12). When deployed, one vibration monitor was located immediately adjacent to one of the short term noise monitoring stations; the other vibration monitor was located in the landward vicinity of the pile being driven at the POA. PPV inches per second were collected at 1 minute intervals to document the potential for human perception and structural damage. Figure 9. Vibration Equipment: Accelerometer and Geophone Cord PE RPT 001 NOISEVIBRATANALYSIS 13

24 METHODOLOGY Figure 11. Setting Up Vibration Monitoring Equipment near Pile Driving Location Figure 10. Vibration Monitoring Equipment Set Up Onshore near Pile Driving Location 14 PE RPT 001 NOISEVIBRATANALYSIS

25 METHODOLOGY PE RPT 001 NOISEVIBRATANALYSIS 15 Figure 12. Vibration Monitoring Locations
26 METHODOLOGY 2.4 Data Collected Noise Data 2016 Test Pile Program To analyze community noise impacts and to fully characterize the baseline acoustic environment and noise emissions from pile driving, the following sound metrics and data were collected: A weighted decibel (dba) minimum noise level (L min ), maximum noise level (L max ), statistical sound level (L 10, L 50, L 90 ), and equivalent continuous noise level (L eq ) values on an hourly basis; C weighted decibel (dbc) L min, L max, L 10, L 50, L 90, and L eq values on an hourly basis; One third octave band linear (i.e., unweighted decibels [db]) sound levels ranging from 6.3 Hertz (Hz) to 20,000 Hz. A weighting and C weighting refers to the human response to sound. The L eq is the time logarithmically averaged sound level for a given period. For example, the MOA Noise Ordinance for construction is based on the hourly L eq. One third octave band data were also collected to address any tonal concerns that the POA would like to address in the future. One third octave band data could be used to describe phenomenon associated with specific frequencies. Because of the voluminous amount of data collected for this effort, sound levels presented in this report are A weighted and confined to the following metrics, which are included to provide greater detail on the quality and content of monitored baseline and pile driving sound levels: L eq : The logarithmically averaged sound level for a given period, often based on an hourly period and, while not technically correct, is often referred to as the average sound level for a given period. The L eq is the most frequently used noise metric in environmental noise and is used in many regulatory limits. For example, the MOA uses the L eq metric in their noise ordinance. L min : Minimum sound level monitored for a given period. L max : Maximum sound level monitored for a given period. L N : Statistical sound level, such as L 10, L 50, and L 90, provides the sound level exceeded for a specific percentage of time over a given monitoring period (i.e., hourly). Therefore, L 10 is the sound level that was exceeded 10 percent of the time and L 90 is the sound level that was exceeded 90 percent of the time. L 50 can be described as the median sound level and represents the sound level exceeded 50 percent of the time. L 90 is often referred to as the residual sound level because it excludes the vast majority of transitory sound sources, and what remain are the sustained sound sources at a given site. The short and long term monitors were programmed to log exceedances of the MOA Noise Ordinance daytime (6:00 a.m. to 10:00 p.m.) construction noise limit of 80 dba L eq (hourly). Audio recordings were conducted during each short term measurement. In addition to what is summarized in this report, all data collected have been provided to the POA electronically Vibration Data According to the FTA Noise and Vibration Impact Assessment (FTA 2016), construction activities can be a source of ground borne vibration. Activities such as pile driving and operation of heavy equipment may cause ground borne vibration during construction. Vibration is an oscillatory motion that can be described in terms of displacement, velocity, or acceleration (FTA 2016). Velocity or acceleration is typically used to describe vibration. Two descriptors are frequently used during discussions of quantification of vibration: the PPV and the root mean square (rms). 16 PE RPT 001 NOISEVIBRATANALYSIS
27 METHODOLOGY PPV: The PPV is defined as the maximum instantaneous positive or negative peak of the vibration signal. rms: The rms is typically calculated over a 1 second period and is the square root of the average of the squared amplitude of a signal. PPV is used in this document because it can be used to assess both structural damage potential and human annoyance, while rms is typically used for assessing human annoyance only Meteorological Data The portable meteorological stations at both long term monitoring sites measured wind speed (mph]), wind direction, precipitation (inches), temperature (degrees Fahrenheit [ F]), and percent relative humidity. PE RPT 001 NOISEVIBRATANALYSIS 17
28 RESULTS/DATA 3 Results/Data 3.1 Results Synopsis A total of 10 piles were installed between May 3 and June 7, A combination of short and longterm monitoring resulted in the collection of data during 9 of the 10 pile driving events. This section summarizes the data collected in the field during these select, representative pile driving events. 3.2 Baseline Sound Levels Sound levels in both the Government Hill and Cherry Hill neighborhoods are variable dependent upon anthropogenic sound sources such as aircraft at JBER and Merrill Field, non pile driving activity at POA, lawn mowers, rail traffic, and roadway traffic. Additional sound sources include natural sounds of wildlife such as birds and wind interacting with vegetation. Since pile driving at the POA would be restricted to daytime hours (i.e., 7:00 a.m. to 10:00 p.m.), baseline sound levels are provided for daytime periods only (Table 1). Baseline sound levels were identified via monitoring data obtained at the two long term monitoring stations; however, these data exclude any periods when the TPP pile driving operations were active. These baseline sound levels are representative of the Government Hills neighborhood (LT 1) and the Cherry Hill neighborhood (LT 2). Baseline sound levels are somewhat high, with daytime levels in the Government Hill neighborhood of 60.2 dba L eq and 65.1 dba L eq in the Cherry Hill neighborhood. Statistical sound levels (e.g., L 10, L 50, and L 90 ) do not show great variability between one another, which demonstrates that the daytime sound levels were not influenced greatly by short duration events, such as an individual aircraft flyover. Table 1. Baseline Daytime Sound Levels Monitoring Location L eq L min L max L 10 L 50 L 90 LT 01 Minimum Average Maximum LT 02 Minimum Average Maximum Noise Monitoring by Pile Location Pile driving sound levels are reported here in the sequence in which they were driven Pile Location 8 Test pile location 8 was set in the pile template on May 2, 2016, and driven to depth via vibratory and hydraulic impact pile drivers on May 3, Figure 13 depicts the noise measurement locations for Pile 8. Meteorological conditions during the survey were obtained via a nearby meteorological station or 18 PE RPT 001 NOISEVIBRATANALYSIS
29 RESULTS/DATA from field observations, since the meteorological equipment deployed at the long term stations malfunctioned. The meteorological conditions during the survey were a temperature of 44 F, wind speeds of less than 10 mph, humidity of 60 percent, and no precipitation. Figure 13. Pile 8 Measurement Locations Table 2 provides a summary of measured sound levels from Pile 8 for both pile drivers used, and includes only data from when the pile driver was active. The vibration pile driving effort took approximately 30 minutes, and the impact pile driving took 1 hour with small breaks in between to adjust the equipment. There were no exceedances of the MOA construction noise limit of 80 dba L eq (hourly) in the Government Hill or Cherry Hill neighborhood. Figure 14 and Figure 15 provide the timehistory of the L eq sound levels monitored at LT 1 and LT 2, respectively. The L eq sound levels on these charts are 1 minute L eq sound levels. At times, the 1 minute L eq sound levels exceed 80 dba; however, these are not considered exceedances of the MOA ordinance since they do not exceed 80 dba L eq (hourly) when logarithmically averaged over the entire pile driving period. Data monitored at ST 01 during the impact pile driving event became corrupted due to meter malfunction. The error with the SLM was rectified for piles driven after Pile 8. PE RPT 001 NOISEVIBRATANALYSIS 19
 LT 01 2,411 57.7 46.6 76.2 61.5 53.1 50.5 LT 02 4,056 58.")
30 RESULTS/DATA Table 2. Pile 8 Sound Levels Pile Driver Type Monitoring Location Distance to Pile (feet) L eq L min L max L 10 L 50 L 90 Vibratory LT 01 2, LT 02 4, ST 01 2, ST 02 2, Impact (hydraulic) LT 01 2, LT 02 4, ST 02 2, Figure 14. Pile 8 Time history at the Government Hill Long term Monitor (LT 01) 20 PE RPT 001 NOISEVIBRATANALYSIS


31 RESULTS/DATA Figure 15. Pile 8 Time history at the Cherry Hill Long term Monitor (LT 02) Pile Location 9 Test pile location 9 was set in the pile template and driven to depth via vibratory and diesel impact pile drivers on May 6 and 7, Figure 16 depicts the measurement locations for Pile 9. Meteorological conditions during the survey were obtained via the meteorological equipment deployed at the longterm station. The meteorological conditions during the survey were a temperature of 46 F, wind speeds of approximately 3 mph, humidity of 69 percent, and no precipitation. Table 3 provides a summary of measured sound levels from Pile 9 for both pile drivers used, and includes only data from when the pile driver was active. The vibration pile driving effort took approximately 30 minutes, and the impact pile driving took approximately 1 hour, with a large break between impact driving efforts that started on May 6 to fix the pile driver. Pile driving resumed the morning of May 7 and included another 2 hour long pause when the pile driver was intermittently working. These breaks in pile driving were necessary for adjustment of the pile driving equipment. There were no exceedances of the MOA construction noise limit of 80 dba L eq (hourly) in the Government Hill or Cherry Hill neighborhood. Figure 17 and Figure 18 provide the time history of the L eq sound levels monitored at LT 1 and LT 2, respectively. The L eq sound levels on these charts are 1 minute L eq sound levels. When logarithmically averaged over the entire pile driving period, they do not exceed 80 dba L eq (hourly). A power failure occurred at LT 02 on May 6; therefore, no vibratory pile driving noise was monitored at the station that day. PE RPT 001 NOISEVIBRATANALYSIS 21
32 RESULTS/DATA Figure 16. Pile 9 Measurement Locations Table 3. Pile 9 Sound Levels Pile Driver Type Monitoring Location (month/day) Distance to Pile (feet) L eq L min L max L 10 L 50 L 90 Vibratory LT 01 2, ST 01 2, ST 02 2, Impact (diesel) LT 01 (5/6) 2, LT 01 (5/7) 2, LT 02 (5/7) 4, ST 01 2, ST 02 2, PE RPT 001 NOISEVIBRATANALYSIS

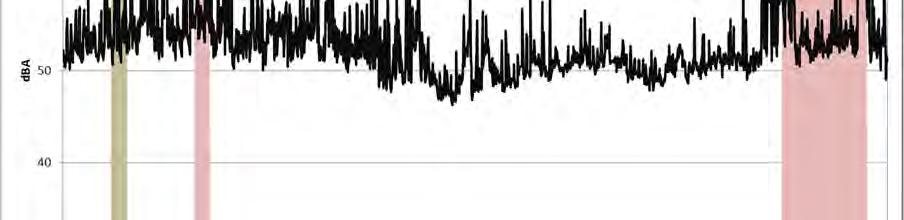


33 RESULTS/DATA Figure 17. Pile 9 Time history at the Government Hill Long term Monitor (LT 01) PE RPT 001 NOISEVIBRATANALYSIS 23

34 RESULTS/DATA Figure 18. Pile 9 Time history at the Cherry Hill Long term Monitor (LT 02) Pile Location 4 Test pile location 4 was set in the pile template on May 12, 2016, and driven to depth via vibratory, hydraulic, and diesel impact pile drivers on May 12 and 13, Figure 19 depicts the measurement locations for this pile. The meteorological conditions on May 12 were a temperature of 57 F, wind speeds of approximately 2 3 mph, humidity of 57 percent, and no precipitation. The meteorological conditions on May 13 were a temperature of 49 F, wind speeds of approximately 1 mph, humidity of 72 percent, and no precipitation. Figure 19. Pile 4 Measurement Locations Table 4 provides a summary of measured sound levels from Pile 4 for the pile drivers used, and includes only data from when the pile driver was active. The vibration pile driving effort took approximately 30 minutes, and the impact pile driving took approximately 1 hour, with a large break between impact driving efforts that started on May 12 to adjust the equipment. Specifically, the contractor had technical difficulties with the hydraulic pile driver that could not be rectified by May 13; therefore, the contractor elected to utilize the diesel impact pile driver to finish driving the pile on May 13. There were no exceedances of the MOA construction noise limit of 80 dba L eq (hourly) in the Government Hill or Cherry Hill neighborhood. Figure 20 and Figure 21 provide the time history of the L eq sound levels monitored at LT 1 and LT 2, respectively. The L eq sound levels on these charts are 1 minute L eq sound levels. At times, the 1 minute L eq sound levels exceed 80 dba; however, these are not considered exceedances of the 24 PE RPT 001 NOISEVIBRATANALYSIS
 L eq L min L max L 10 L 50 L 90 Vibratory LT 01 4,508 63.1 47.5 89.0 62.0 55.4 52.5 LT 02 2,004 66.4 48.1 94.6 64.1 54.")
 LT 01 4,508 56.1 45.6 82.4 57.8 52.6 49.9 LT 02 2,004 59.7 48.8 90.0 62.8 53.3 51.")
35 RESULTS/DATA MOA ordinance since they do not exceed 80 dba L eq (hourly) when logarithmically averaged over the entire pile driving period. Table 4. Pile 4 Sound Levels Pile Driver Type Monitoring Location Distance to Pile (feet) L eq L min L max L 10 L 50 L 90 Vibratory LT 01 4, LT 02 2, ST 03 2, ST 04 1, Impact (hydraulic) LT 01 4, LT 02 2, ST 03 2, ST 04 1, Impact (diesel) LT 01 4, LT 02 2, ST 03 2, ST 04 1, PE RPT 001 NOISEVIBRATANALYSIS 25


36 RESULTS/DATA Figure 20. Pile 4 Time history at the Government Hill Long term Monitor (LT 01) Figure 21. Pile 4 Time history at the Cherry Hill Long term Monitor (LT 02) Pile Location 5 Test pile location 5 was set in the pile template and driven to depth via vibratory and diesel impact pile drivers on May 18, Figure 22 depicts the measurement locations for this pile. The meteorological conditions during the survey were a temperature of 52 F, wind speeds of 2 mph, humidity of 71 percent, and no precipitation. Table 5 provides a summary of measured sound levels from Pile 5 for the pile drivers used, and includes only data from when the pile driver was active. The vibration pile driving effort took approximately 30 minutes, and the impact pile driving took approximately 1 hour. There were some intermittent breaks in each of these efforts (5 10 minutes) when the pile driver was adjusted by the contractor. There were no exceedances of the MOA construction noise limit of 80 dba L eq (hourly) in the Government Hill or Cherry Hill neighborhood. Figure 23 and Figure 24 provide the time history of the L eq sound levels monitored at LT 1 and LT 2, respectively. The L eq sound levels on these charts are 1 minute L eq sound levels. At times, the 1 minute L eq sound levels exceed 80 dba; however, these are not considered exceedances of the MOA ordinance since they do not exceed 80 dba L eq (hourly) when logarithmically averaged over the entire pile driving period. 26 PE RPT 001 NOISEVIBRATANALYSIS
 LT 01 2,481 61.6 45.5 89.3 63.")
37 RESULTS/DATA Figure 22. Pile 5 Measurement Locations Table 5. Pile 5 Sound Levels Pile Driver Type Monitoring Location Distance to Pile (feet) L eq L min L max L 10 L 50 L 90 Vibratory LT 01 2, LT 02 2, ST 01 3, ST 02 2, Impact (diesel) LT 01 2, LT 02 2, ST 01 3, ST 02 2, PE RPT 001 NOISEVIBRATANALYSIS 27

")


38 RESULTS/DATA Figure 23. Pile 5 Time history at the Government Hill Long term Monitor (LT 01) Figure 24. Pile 5 Time history at the Cherry Hill Long term Monitor (LT 02) 28 PE RPT 001 NOISEVIBRATANALYSIS
39 RESULTS/DATA Pile Location 2 Test pile location 2 was set in the pile template and driven to depth via vibratory and diesel impact pile drivers on May 19, Figure 25 depicts the measurement locations for this pile. The meteorological conditions during the survey were a temperature of 51 F, wind speeds of 2 mph, humidity of 75 percent, and no precipitation. Figure 25. Pile 2 Measurement Locations Table 6 provides a summary of measured sound levels from Pile 2 for the pile drivers used, and includes only data from when the pile driver was active. The vibration pile driving effort took approximately 30 minutes, and the impact pile driving took approximately 1 hour. There were some intermittent breaks in each of these efforts (5 10 minutes) when the pile driver was adjusted by the contractor. There were no exceedances of the MOA construction noise limit of 80 dba L eq (hourly) in the Government Hill or Cherry Hill neighborhood. Figure 26 and Figure 27 provide the time history of the L eq sound levels monitored at LT 1 and LT 2, respectively. The L eq sound levels on these charts are 1 minute L eq sound levels. When logarithmically averaged over the entire pile driving period, they do not exceed 80 dba L eq (hourly). PE RPT 001 NOISEVIBRATANALYSIS 29
 LT 01 2,481 61.5 46.7 89.7 64.4 54.4 50.")
40 RESULTS/DATA Table 6. Pile 2 Sound Levels Pile Driver Type Monitoring Location Distance to Pile (feet) L eq L min L max L 10 L 50 L 90 Vibratory LT 01 2, LT 02 2, ST 03 2, ST 04 2, Impact (diesel) LT 01 2, LT 02 2, ST 03 2, ST 04 2, Figure 26. Pile 2 Time history at the Government Hill Long term Monitor (LT 01) 30 PE RPT 001 NOISEVIBRATANALYSIS


41 RESULTS/DATA Figure 27. Pile 2 Time history at the Cherry Hill Long term Monitor (LT 02) Pile Location 7 Test pile location 7 was set in the pile template and driven to depth via vibratory and diesel impact pile drivers on May 25, Figure 28 depicts the measurement locations for this pile. The meteorological conditions during the survey were a temperature of 57 F, wind speeds of 2 mph, humidity of 58 percent, and no precipitation. Table 7 provides a summary of measured sound levels from Pile 7 for the pile drivers used, and includes only data from when the pile driver was active. The vibration pile driving effort took approximately 30 minutes, and the impact pile driving took approximately 1 hour. There were some intermittent breaks in each of these efforts (5 10 minutes) when the pile driver was adjusted by the contractor. There were no exceedances of the MOA construction noise limit of 80 dba L eq (hourly) in the Government Hill or Cherry Hill neighborhood. Figure 29 and Figure 30 provide the time history of the L eq sound levels monitored at LT 1 and LT 2, respectively. The L eq sound levels on these charts are 1 minute L eq sound levels. At times, the 1 minute L eq sound levels exceed 80 dba; however, these are not considered exceedances of the MOA ordinance since they do not exceed 80 dba L eq (hourly) when logarithmically averaged over the entire pile driving period. PE RPT 001 NOISEVIBRATANALYSIS 31
42 RESULTS/DATA Figure 28. Pile 7 Measurement Locations Table 7. Pile 7 Sound Levels Pile Driver Type Monitoring Location Distance to Pile (feet) L eq L min L max L 10 L 50 L 90 Vibratory LT 01 2, LT 02 3, Impact (diesel) LT 01 2, LT 02 3, ST 01 3, NM01 3, NM02 3, Note: NM = Neighborhood Measurement 32 PE RPT 001 NOISEVIBRATANALYSIS

43 RESULTS/DATA Figure 29. Pile 7 Time history at the Government Hill Long term Monitor (LT 01) PE RPT 001 NOISEVIBRATANALYSIS 33
44 RESULTS/DATA Figure 30. Pile 7 Time history at the Cherry Hill Long term Monitor (LT 02) Pile Location 10 Test pile location 10 was set in the pile template and driven to depth via vibratory and hydraulic impact pile drivers on May 26, Figure 31 depicts the measurement locations for this pile. The meteorological conditions during the survey were a temperature of 61 F, wind speeds of 2 mph, humidity of 53 percent, and no precipitation. Figure 31. Pile 10 Measurement Locations Table 8 provides a summary of measured sound levels from Pile 10 for both pile drivers used, and includes only data from when the pile driver was active. Short term monitoring of vibratory pile driving was not conducted for Pile 10 or any pile driven thereafter because the initial results showed that sound levels from vibratory pile driving were well below the MOA limits. The vibration pile driving effort took approximately 30 minutes, and the impact pile driving took approximately 1 hour. There were some intermittent breaks in each of these efforts (5 10 minutes) when the pile driver was adjusted by the contractor. There were no exceedances of the MOA construction noise limit of 80 dba L eq (hourly) in the Government Hill or Cherry Hill neighborhood. Figure 32 and Figure 33 provide the time history of the L eq sound levels monitored at LT 1 and LT 2, respectively. The L eq sound levels on these charts are 1 minute L eq sound levels. When logarithmically averaged over the entire pile driving period, they do not exceed 80 dba L eq (hourly). 34 PE RPT 001 NOISEVIBRATANALYSIS
 LT 01 2,411 57.1 44.6 75.3 61.4 53.5 49.2 LT 02 4,056 60.5 45.2 84.4 62.7 52.9 49.4 ST 01 2,844 61.0 48.5 79.6 63.5 57.2 54.")

45 RESULTS/DATA Table 8. Pile 10 Sound Levels Pile Driver Type Monitoring Location Distance to Pile (feet) L eq L min L max L 10 L 50 L 90 Vibratory LT 01 2, LT 02 4, Impact (hydraulic) LT 01 2, LT 02 4, ST 01 2, NM01 3, NM01 (indoor) 3, NM03 2, NM04 3, NM05 2, NM06 3, NM07 2, NM08 2, Note: NM = Neighborhood Measurement PE RPT 001 NOISEVIBRATANALYSIS 35
 Test pile location 6 was set in the pile template and driven to depth via vibratory and diesel impact pile drivers on June 1, 2016.")
46 RESULTS/DATA Figure 32. Pile 10 Time history at the Government Hill Long term Monitor (LT 01) Pile Location 6 Figure 33. Pile 10 Time history at the Cherry Hill Long term Monitor (LT 02) Test pile location 6 was set in the pile template and driven to depth via vibratory and diesel impact pile drivers on June 1, Figure 34 depicts the measurement location for this pile. The meteorological conditions during the survey were a temperature of 56 F, wind speeds of 2 mph, humidity of 61 percent, and no precipitation. Table 9 provides a summary of measured sound levels from Pile 6 for the pile drivers used, and includes only data from when the pile driver was active. The vibration pile driving effort took approximately 30 minutes, and the impact pile driving took approximately 1 hour. There were some intermittent breaks in each of these efforts (5 10 minutes) when the pile driver was adjusted by the contractor. Due to a power failure at LT 01, no vibratory or impact pile driving noise data were collected at the station. There were no monitored exceedances of the MOA construction noise limit of 80 dba L eq (hourly). Figure 35 provides the time history of the L eq sound levels monitored at LT 02. The L eq sound levels on this chart are 1 minute L eq sound levels. At times, the 1 minute L eq sound levels exceed 80 dba; however, these are not considered exceedances of the MOA ordinance since they do not exceed 80 dba L eq (hourly) when logarithmically averaged over the entire pile driving period. 36 PE RPT 001 NOISEVIBRATANALYSIS
47 RESULTS/DATA Figure 34. Pile 6 Measurement Locations Table 9. Pile 6 Sound Levels Pile Driver Type Monitoring Location Distance to Pile (feet) L eq L min L max L 10 L 50 L 90 Vibratory LT 02 2, Impact (diesel) LT 02 2, PE RPT 001 NOISEVIBRATANALYSIS 37
 3.")

48 RESULTS/DATA Figure 35. Pile 6 Time history at the Cherry Hill Long term Monitor (LT 02) Pile Location 3 Test pile location 3 was set in the pile template and driven to depth via vibratory and hydraulic impact pile drivers on June 3, Figure 36 depicts the measurement location for this pile. The meteorological conditions during the survey were a temperature of 59 F, wind speeds of 2 mph, humidity of 60 percent, and no precipitation. 38 PE RPT 001 NOISEVIBRATANALYSIS
49 RESULTS/DATA Figure 36. Pile 3 Measurement Location Table 10 provides a summary of measured sound levels from Pile 3 for the pile drivers used, and includes only data when the pile driver was active. The vibration pile driving effort took approximately 30 minutes, and the impact pile driving took approximately 1 hour. There were some intermittent breaks in each of these efforts (5 10 minutes) when the pile driver was adjusted by the contractor. Due to a power failure at LT 01, no vibratory or impact pile driving noise was collected at the station. There were monitored no exceedances of the MOA construction noise limit of 80 dba L eq (hourly). Figure 37 provides the time history of the L eq sound levels monitored at LT 02. The L eq sound levels on this chart are 1 minute L eq sound levels. When logarithmically averaged over the entire pile driving period, they do not exceed 80 dba L eq (hourly). Table 10. Pile 3 Sound Levels Pile Driver Type Monitoring Location Distance to Pile (feet) L eq L min L max L 10 L 50 L 90 Vibratory LT 02 2, Impact (hydraulic) LT 02 2, PE RPT 001 NOISEVIBRATANALYSIS 39


50 RESULTS/DATA Figure 37. Pile 3 Time history at the Cherry Hill Long term Monitor (LT 02) Discussion Sound levels for the pile driving effort were sometimes higher than the daytime baseline sound levels and sometimes they were lower. There are several reasons for this, including that the contribution of pile driving noise to an already relatively elevated acoustic environment results in higher sound levels, generally in the range of 1 3 dba over baseline. However, sometimes sound levels were lower than the daytime baseline. This generally is related to the absence of other sound sources such as aircraft overhead, railroad activity, and busier roadway traffic time periods such as rush hour or heavy truck traffic, or loading and/or unloading ships docked at the POA. Meteorological conditions can affect how sound propagates with distance; however, meteorological conditions during the pile driving effort were relatively consistent, specifically: Temperatures ranged from 46 to 65 F; Average wind speeds ranged from 1 to 3 mph; No precipitation; and Relative humidity ranged from 45 to 77 percent. These meteorological conditions did not greatly affect propagation of pile driving noise because they were not substantially different from one another. For example, higher wind speeds of approximately 10 mph did not persist during pile driving, which may have acted to aid in the propagation of sound over distance. Similarly there were no temperature inversions that could affect propagation of pile driving 40 PE RPT 001 NOISEVIBRATANALYSIS
51 RESULTS/DATA noise over distance. For comparison purposes, monitored daytime meteorological conditions when pile driving did not occur included: Temperatures ranging from 40 to 69 F; Average wind speeds ranging from 0 to 6 mph; Zero to 1 inch of precipitation; and Relative humidity ranging from 21 to 93 percent. Nevertheless, the following general conclusions have been identified via the monitoring data: Pile driving noise levels were within the range of monitored baseline sound levels, which indicates that pile driving noise was similar to levels that already exist in the neighborhoods from sources such as aircraft overhead, roadway traffic, rail operations, and noise from other POA activity. Vibratory pile driving was found by field technicians to be mostly inaudible over baseline sound levels in either neighborhood. Impact pile driving was readily audible during either diesel impact pile driving or during hydraulic impact pile driving; however, hydraulic impact pile driving noise levels were loudest. Low frequency noise (e.g., below 200 Hz) was most pronounced when piles were driven using the hydraulic impact pile driver followed by the diesel impact pile driver. The low frequency content of impact pile driving represents the biggest difference relative to daytime baseline sound levels. Figure 38 and Figure 39 are spectral charts of octave band monitoring data for each of the pile drivers used, compared to the daytime baseline levels collected at LT 01 and LT 02. Included on these charts is the threshold of human hearing by octave band. The hydraulic impact pile driver was the noisiest pile driver used in the TPP and was consistently above the daytime baseline from 12.5 Hz to 2,000 Hz. Data indicated that the diesel impact pile driver noise was very similar to baseline sound levels, which matches what was experienced by field technicians. Vibratory pile drivers were almost the same as baseline sound levels at LT 02; however, at LT 01 it appears that there was more low frequency content from the vibratory pile driving effort. In a review of field notes and recordings of other sound sources, such as tank farm construction within the POA, these are the likely cause of the elevated low frequency content during vibratory pile driving at LT 01. PE RPT 001 NOISEVIBRATANALYSIS 41
 Figure 39.")
 Four pile driving test sites were evaluated")


52 RESULTS/DATA Figure 38. Monitored Spectral Sound Levels at Government Hill Long term Monitor (LT 01) Figure 39. Monitored Spectral Sound Levels at Cherry Hill Long term Monitor (LT 02) 3.4 Noise Measurements (Port of Anchorage Tenants) Four pile driving test sites were evaluated (Indicator Piles 4, 5, 7, and 8), as shown on Figure 8. Because pile driving took place on a barge and this assessment was for shore based activities, no measurements were collected at the source. The intent was to characterize potentially hazardous noise exposures to shore based workers and work activities on the POA property. Due to scheduling conflicts, sound levels during pile driving operations at Pile 8 were not measured. 42 PE RPT 001 NOISEVIBRATANALYSIS
53 RESULTS/DATA Baseline, outdoor sound level readings ranged from 58.2 to 73 dba L eq. This wide range is due to the presence of other noise producing equipment in the area such as loaders, vehicles, and aircraft. Measurements collected during vibratory hammer operations fell within the baseline noise range, and, as such, vibratory operations were determined to not present a hazardous noise risk. Levels from the pile drivers (both hydraulic and diesel) ranged from 90.5 dba at the shoreline to baseline levels at distances exceeding 500 feet from the driver. Table 11 summarizes pile driving noise levels and baseline sound levels collected during this assessment. Laboratory calibration sheets are included in Appendix A. Table 11. Summary of In air Noise Measurements (POA Tenants) Date Indicator Test Pile No. Location * Baseline/ Vibratory Drilling/ Impact (hammer) Driving Level (dba L eq ) Additional Noise Sources 05/03 8 A 150 feet (shoreline) Baseline 63.0 Waves, barge crane noise 05/03 8 B 275 feet pad Baseline 62.7 Barge crane noise 05/03 8 A 150 feet (shoreline) Vibratory 70.7 Loader (70 feet away), barge crane noise 05/03 8 B 275 feet pad Vibratory 67.7 Loader (20 feet away), barge crane noise 05/12 4 C 200 feet (shoreline) Baseline /12 4 D 500 feet Baseline 67.0 Refrigeration truck 05/12 4 E TOTE building Baseline /12 4 C 200 feet (shoreline) Hydraulic hammer /12 4 D 500 feet Hydraulic hammer 84.2 Refrigeration truck 05/12 4 E TOTE building Hydraulic hammer 76.5 Vehicle traffic 05/12 4 F POA mechanic shop Hydraulic hammer 79.3 Vehicle traffic 05/12 4 G TOTE mechanic shop Hydraulic hammer 77.0 Vehicle traffic 05/12 4 H 400 feet (Trestle 3) Hydraulic hammer /12 4 I POA headquarters Hydraulic hammer /12 n/a I POA headquarters Baseline 68 C 130 taxiing 05/18 5 J 175 feet (shoreline) Baseline 64.8 Barge crane noise 05/18 5 K 350 feet Baseline 67.0 Barge crane noise 05/18 5 L 200 feet (equipment trailer) Baseline 73.0 Barge crane noise 05/18 5 M 300 feet Intertek office Baseline 68.4 Barge crane noise, running truck 05/18 5 J 175 feet (shoreline) Diesel hammer 90.1 Barge crane noise 05/18 5 K 350 feet Diesel hammer 85.7 Barge crane noise PE RPT 001 NOISEVIBRATANALYSIS 43
54 RESULTS/DATA Date Indicator Test Pile No. Location * Baseline/ Vibratory Drilling/ Impact (hammer) Driving Level (dba L eq ) Additional Noise Sources 05/18 5 L 200 feet (equipment trailer) Diesel hammer 88.4 Barge crane noise 05/18 5 M 300 feet Intertek office Diesel hammer 87.8 Barge crane noise 05/18 5 M 300 feet Intertek office (interior) Diesel hammer /25 7 N 150 feet (shoreline) Diesel hammer 65.4 Barge crane noise 05/25 7 O 300 feet Baseline 58.2 Barge crane noise 05/25 7 P dredging trailer exterior Baseline /25 7 P dredging trailer exterior Baseline /25 7 N 150 feet (shoreline) Baseline 90.2 Barge crane noise 05/25 7 O 300 feet Diesel hammer 84.7 Barge crane noise 05/25 7 P dredging trailer exterior Diesel hammer /25 7 P dredging trailer exterior Diesel hammer 39.6 * Location identifiers shown on Figure 8. Note: TOTE = TOTE Maritime (formerly Totem Ocean Trailer Express). Three potential areas of concern for POA tenants and workers were evaluated through this assessment: impact noise, exposure of POA workers to noise, and potential effects of repetitive noise on POA personnel. Impact noise: The maximum impact noise generated by the pile driving operations was identified as 90.5 dba L eq. This measurement was collected at the shoreline, which is the closest POA personnel can get to the noise source the pile driving barge. Noise levels collected inside facilities near the pile driving test locations do not indicate any exposures of concern. Existing structures and facilities abate any potential hazardous noise well below any regulatory or nuisance level. Note that nuisance levels are subjective and can vary greatly from one person to another, but generally are those sound levels that annoy the public or are found to be disruptive. 3.5 Short term Ground borne Vibration Measurements Ground vibration measurements were collected to identify whether ground vibration from pile driving activities could damage structures or be perceived in the Government Hill and Cherry Hill neighborhoods. For Indicator Piles 5, 2, 7, and 10, vibration levels were monitored in two general locations: Within approximately 100 feet of pile driving activities; and Within public rights of way near residences at ST 01, ST 02, ST 03, ST 04, NM01, and NM02. One additional vibration measurement was collected in the basement of a Government Hill residence where a homeowner had indicated suspected vibration levels associated with the TPP. Table 12 provides the PPV monitored during each monitored vibratory and impact pile driving event. Additionally, baseline PPVs are provided for those locations monitored in proximity to the pile drivers. The results in Table PE RPT 001 NOISEVIBRATANALYSIS
55 RESULTS/DATA indicate that vibration levels were not of sufficient strength from pile driving at POA to be perceptible and are well below any structural damage criteria for buildings in the area. Table 12. Summary of Ground borne Vibration Measurements Date Indicator Test Pile No. Location Distance from Pile (feet) Baseline/ Vibratory Drilling/Impact (hammer) Driving Level (PPV) Potential for Building Damage Human Perception Assessment 05/18 5 Near pile 300 Baseline None Not perceptible 05/18 5 Near pile 300 Vibratory pile driver 05/18 5 Near pile 300 Impact pile driver (diesel) 05/18 5 ST 02 2,941 Vibratory pile Driver None Not perceptible None Not perceptible None Not perceptible 05/18 5 ST 02 2,941 Diesel hammer None Not perceptible 05/19 2 Near pile 300 Baseline None Not perceptible 05/19 2 Near pile 300 Vibratory pile driver 05/19 2 Near pile 300 Impact pile driver (diesel) 05/19 2 ST 03 2,642 Vibratory pile driver None Not perceptible None Not perceptible None Not perceptible 05/19 2 ST 03 2,642 Diesel hammer None Not perceptible 05/19 2 ST 04 2,976 Diesel hammer None Not perceptible 05/25 7 Near pile 200 Baseline None Not perceptible 05/25 7 Near pile 200 Vibratory pile driver 05/25 7 Near pile 200 Impact pile driver (Diesel) 05/25 7 NM01 3,425 Vibratory pile driver None Not perceptible None Not perceptible None Not perceptible 05/25 7 NM01 3,425 Diesel hammer None Not perceptible 05/25 7 NM02 3,376 Diesel hammer None Not perceptible 05/25 7 ST02 2,704 Diesel hammer None Not perceptible 05/26 10 Near pile 500 Baseline None Not perceptible 05/26 10 Near pile 500 Vibratory pile driver None Not perceptible PE RPT 001 NOISEVIBRATANALYSIS 45
56 RESULTS/DATA Date Indicator Test Pile No. Location Distance from Pile (feet) Baseline/ Vibratory Drilling/Impact (hammer) Driving Level (PPV) Potential for Building Damage Human Perception Assessment 05/26 10 Near pile 500 Impact pile driver (hydraulic) 05/26 10 NM01 3,460 Vibratory pile driver None Not perceptible None Not perceptible 05/26 10 NM01 (indoor) 3,460 Impact pile driver (hydraulic) None Not perceptible 05/26 10 NM02 3,270 Impact pile driver (hydraulic) 05/26 10 ST 01 2,844 Impact pile driver (hydraulic) None Not perceptible None Not perceptible 46 PE RPT 001 NOISEVIBRATANALYSIS
57 4 Summary and Next Steps SUMMARY AND NEXT STEPS The following sections provide summaries of noise and vibration impact conditions and potential next steps. 4.1 Community Noise and Vibration Considerations Monitored noise levels from pile driving did not exceed the MOA code limit of 80 dba L eq (hourly), and vibration from pile driving activity is not perceptible in the Cherry Hill and Government Hill neighborhoods. Sound levels in the Government Hill neighborhood during pile driving activities ranged from 56 to 73 dba L eq according to the long term monitoring effort. In the Cherry Hill neighborhood, sound levels ranged from 54 to 78 dba L eq. The loudest monitored pile driver sound levels were associated with the hydraulic impact pile driver followed by the diesel impact pile driver. Vibratory pile driver sound levels were measurable, but were lower than impact pile driver sound levels and generally blended in with the existing sound sources. To minimize potential impacts strictly from a noise perspective, use of the diesel impact pile driver to the extent practicable instead of the hydraulic impact pile driver would result in lower community noise exposure levels. Vibration monitoring data show that all ground borne vibration levels are below levels considered perceptible at residential neighborhoods in the vicinity of POA and are not of sufficient strength even near the piles being driven to pose a structural damage concern at POA. However, observations by some neighborhood property owners of vibration from pile driving could be the result of airborne low frequency noise rattling structures/windows, thereby mimicking some of the characteristics of groundborne vibration. Monitored one third octave band sound levels at LT 01 and LT 02 were averaged for each pile driver type and the daytime period and plotted on spectral charts in Figure 38 and Figure 39, respectively. These charts also show that there is more acoustic energy focused in the lower audible, and inaudible frequencies for the impact pile drivers especially the hydraulic impact pile driver. A next step for the data collected as part of this effort could be detailed analysis of the low frequency (generally below 200 Hz) content monitored. This analysis would be useful to identify why some residents have identified ground borne vibration concerns, which appear instead to be attributed to low frequency impact pile driving noise. In addition, comparisons between the various measurement data sets relative to the locations of pile driving could be analyzed to determine attenuation rates in the area. This will be useful to inform the larger APMP effort. This analysis would also help address community noise concerns since the POA would be able to state more definitively what pile driving noise would be like throughout the neighborhood during the larger effort and to what extent it can be minimized via mitigation. It is also recommended that public engagement be continued to discuss noise impacts in the affected neighborhoods, especially based on real life noise exposure experiences associated with the TPP. If noise impacts from future APMP construction are determined to be of concern, noise mitigation measures could be evaluated to determine if received noise levels could be effectively reduced. Although somewhat limited based on project conditions (highly elevated, crane mounted impact hammer), noise mitigation measures such as acoustic blankets and newly emerging industry applications could be investigated to determine if/how they might help reduce pile driving noise in nearby neighborhoods. Acoustic blankets have been previously shown to reduce pile driving noise by up to 15 dba depending on the application. PE RPT 001 NOISEVIBRATANALYSIS 47
58 SUMMARY AND NEXT STEPS Finally, permanent noise monitoring units sited at locations representative of the neighborhoods (i.e., the long term monitoring locations) and a complaint resolution system may be of use to the POA as the APMP proceeds. The data collected at these stations could help in evaluating complaints received from the public and in identifying potential strategies to reduce pile driving noise levels. Data collected at these stations should include meteorological conditions during pile driving efforts. This data would be useful for identifying anomalous meteorological conditions that may aid in the propagation of pile driving noise, such as high wind speeds down wind of pile driving. Should these conditions occur, the POA could develop strategies for minimizing pile driving noise. 4.2 Port of Anchorage Tenant and Employee Noise Exposure Noise measurements collected on shore during pile driving operations do not meet the threshold for hazardous impact noise as defined by OSHA, nor do these levels exceed occupational exposure standards. However, personnel who are required to be at the shoreline all day (e.g., wildlife observers) are advised to take precautions to minimize the impacts of the pile driving noise. Precautions can include remaining in vehicles with windows closed or wearing approved personal protective equipment such as ear protection. No one on shore would need hearing protection, but wearing any noiseapproved hearing protection would reduce potential effects of noise exposure. 48 PE RPT 001 NOISEVIBRATANALYSIS
59 5 References REFERENCES Caltrans (California Department of Transportation) Transportation and Construction Induced Vibration Guidance Manual. Available at: (accessed July 15, 2016). EPA (U.S. Environmental Protection Agency) EPA Identifies Noise Levels Affecting Health and Welfare. Press release. Available at: identifies noise levelsaffecting health and welfare. April 2, FTA (Federal Transit Administration) Transit Noise and Vibration Impact Assessment. FTA VA May MOA (Municipality of Anchorage) Anchorage Noise Ordinance, Anchorage Municipal Code Available at: (accessed July 15, 2016). OSHA (Occupational Safety & Health Administration) Occupational noise exposure. 29 CFR , U.S. Department of Labor. Available at: (accessed August 3, 2016). PE RPT 001 NOISEVIBRATANALYSIS 49
60 Appendix A Noise and Vibration Monitoring Equipment Laboratory Calibration Sheets PE RPT 001 NOISEVIBRATANALYSIS
61 PE RPT 001 NOISEVIBRATANALYSIS This page intentionally left blank.
62 ~Certificate of Calibration~ Manufacturer: PCB Customer: TMS Rental Model Number: 377B02 Address: Serial Number: LW Asset ID: Calibration Date: May 05, :09:09 Description: Free-Field Microphone Due Date: Sensitivity: 250 Hz 1 khz Temperature: 74 (23) F ( C) db re. 1V/Pa Humidity: 36 % mv/pa Ambient Pressure: mbar Cal. Results: In Tolerance Polarization Voltage: 0 VDC 5 0 db Frequency Response Characteristics : The upper curve is the free field characteristic for the microphone with protection grid. The lower curve is the pressure response recorded by electrostatic actuator. Sensitivity : The stated sensitivity is the open-circuit sensitivity. When used with a typical preamplifier the sensitivity will be 0.2 db lower Frequency [Hz] Traceability: The calibration is traceable through 683/ Notes: Calibration results relate only to the items calibrated. This certificate may not be reproduced, except in full, without written permission. This calibration is performed in compliance with ISO 9001, ISO and ANSI Z540. Measurement uncertainty (250 Hz sensitivity calibration) at 95% confidence level: Calibrated per procedure PRD-P db. User Note: As Found / As Left: In Tolerance. Frequency Response with reference to level at 250 Hz Frequency (Hz) Upper (db) Frequency (Hz) Upper (db) Frequency (Hz) Upper (db) Frequency (Hz) Upper (db) Technician: Ed Devlin Reference Equipment Used: Manuf. Model Serial Cal. Date Due Date Approval: GRAS 40AG /22/2015 9/22/2016 Calibration Lab CALIBRATION CERT Page 1 of 1
63 ~Certificate of Calibration~ Manufacturer: PCB Customer: TMS Rental Model Number: 377B02 Address: Serial Number: LW Asset ID: Calibration Date: Jun 10, :06:16 Description: Free-Field Microphone Due Date: Sensitivity: 250 Hz 1 khz Temperature: 72 (22) F ( C) db re. 1V/Pa Humidity: 46 % mv/pa Ambient Pressure: mbar Cal. Results: In Tolerance Polarization Voltage: 0 VDC 5 0 db Frequency Response Characteristics : The upper curve is the free field characteristic for the microphone with protection grid. The lower curve is the pressure response recorded by electrostatic actuator. Sensitivity : The stated sensitivity is the open-circuit sensitivity. When used with a typical preamplifier the sensitivity will be 0.2 db lower Frequency [Hz] Traceability: The calibration is traceable through 683/ Notes: Calibration results relate only to the items calibrated. This certificate may not be reproduced, except in full, without written permission. This calibration is performed in compliance with ISO 9001, ISO and ANSI Z540. Measurement uncertainty (250 Hz sensitivity calibration) at 95% confidence level: Calibrated per procedure PRD-P db. User Note: As Found/As Left In Tolerance Frequency Response with reference to level at 250 Hz Frequency (Hz) Upper (db) Frequency (Hz) Upper (db) Frequency (Hz) Upper (db) Frequency (Hz) Upper (db) Technician: Wayne Underwood Reference Equipment Used: Manuf. Model Serial Cal. Date Due Date Approval: GRAS 40AG /15/2014 9/15/2015 Calibration Lab CALIBRATION CERT Page 1 of 1
64 ~Certificate of Calibration~ Manufacturer: PCB Customer: TMS Rental Model Number: 377B02 Address: Serial Number: LW Asset ID: Calibration Date: Jul 20, :20:03 Description: Free-Field Microphone Due Date: Sensitivity: 250 Hz 1 khz Temperature: 71 (22) F ( C) db re. 1V/Pa Humidity: 53 % mv/pa Ambient Pressure: mbar Cal. Results: In Tolerance Polarization Voltage: 0 VDC 5 0 db Frequency Response Characteristics : The upper curve is the free field characteristic for the microphone with protection grid. The lower curve is the pressure response recorded by electrostatic actuator. Sensitivity : The stated sensitivity is the open-circuit sensitivity. When used with a typical preamplifier the sensitivity will be 0.2 db lower Frequency [Hz] Traceability: The calibration is traceable through 683/ Notes: Calibration results relate only to the items calibrated. This certificate may not be reproduced, except in full, without written permission. This calibration is performed in compliance with ISO 9001, ISO and ANSI Z540. Measurement uncertainty (250 Hz sensitivity calibration) at 95% confidence level: Calibrated per procedure PRD-P db. User Note: As Found/As Left In Tolerance Frequency Response with reference to level at 250 Hz Frequency (Hz) Upper (db) Frequency (Hz) Upper (db) Frequency (Hz) Upper (db) Frequency (Hz) Upper (db) Technician: Wayne Underwood Reference Equipment Used: Manuf. Model Serial Cal. Date Due Date Approval: GRAS 40AG /15/2014 9/15/2015 Calibration Lab CALIBRATION CERT Page 1 of 1
65 Certificate of Calibration and Conformance This document certifies that the instrument referenced below meets published specifications per Procedure PRD-P263; ANSI S (R 2006) Type 1; S1.4A-1985; S Type 1; S Octave Band Class 0; S ; IEC Class 1; Type 1; Type 1; Class 0; Manufacturer: Model Number: Larson Davis 831 Temperature: o F o C Serial Number: 2229 Rel. Humidity: % Customer: Description: TMS Rental Sound Level Meter Pressure: mbars hpa Note: As Found / As Left: In Tolerance Upon receipt for testing, this instrument was found to be: Within the Stated tolerance of the manufacturer's specification Calibration Date: 22-Feb-16 Calibration Due: Calibration Standards Used: Manufacturer Larson Davis Model Serial Number Cal Due LDSigGen/ /0109 4/14/2016 This Certificate attests that this instrument has been calibrated under the stated conditions with Measurement and Test Equipment (M&TE) Standards traceable to the National Institute of Standards and Technology (NIST). All of the Measurement Standards have been calibrated to their manufacturers specified accuracy / uncertainty. Evidence of traceability and accuracy is on file at The Modal Shop and/or Larson Davis Corporate Headquarters. An acceptable accuracy ratio between the Standard(s) and the item calibrated has been maintained. This instrument meets or exceeds the manufacturer s published specification unless noted. This calibration complies with ISO and ANSI Z540. The collective uncertainty of the Measurement Standard used does not exceed 25% of the applicable tolerance for each characteristic calibrated unless otherwise noted. The results documented in this certificate relate only to the item(s) calibrated or tested. Calibration interval assignment and adjustment are the responsibility of the end user. This certificate may not be reproduced, except in full, without the written approval of The Modal Shop. Technician: Andy McGuire Signature: The Modal Shop, Inc East Kemper Road Cincinnati, OH Phone: (513) (800) PRD-F242 revnr December 2, Page 1 of 1
66 Certificate of Calibration and Conformance This document certifies that the instrument referenced below meets published specifications per Procedure PRD-P263; ANSI S (R 2006) Type 1; S1.4A-1985; S Type 1; S Octave Band Class 0; S ; IEC Class 1; Type 1; Type 1; Class 0; Manufacturer: Larson Davis Temperature: 74.3 Model Number: Serial Number: 3556 Rel. Humidity: Customer: TMS Rental Pressure: Description: Sound Level Meter Note: As Found / As Left: In Tolerance o F o C % mbars hpa Upon receipt for testing, this instrument was found to be: Within the Stated tolerance of the manufacturer's specification Calibration Date: 23-Feb-16 Calibration Due: Calibration Standards Used: Manufacturer Larson Davis Model Serial Number Cal Due LDSigGen/ /0109 4/14/2016 This Certificate attests that this instrument has been calibrated under the stated conditions with Measurement and Test Equipment (M&TE) Standards traceable to the National Institute of Standards and Technology (NIST). All of the Measurement Standards have been calibrated to their manufacturers specified accuracy / uncertainty. Evidence of traceability and accuracy is on file at The Modal Shop and/or Larson Davis Corporate Headquarters. An acceptable accuracy ratio between the Standard(s) and the item calibrated has been maintained. This instrument meets or exceeds the manufacturer s published specification unless noted. This calibration complies with ISO and ANSI Z540. The collective uncertainty of the Measurement Standard used does not exceed 25% of the applicable tolerance for each characteristic calibrated unless otherwise noted. The results documented in this certificate relate only to the item(s) calibrated or tested. Calibration interval assignment and adjustment are the responsibility of the end user. This certificate may not be reproduced, except in full, without the written approval of The Modal Shop. Technician: Andy McGuire Signature: PRD-F242 revnr December 2, 2008 The Modal Shop, Inc East Kemper Road Cincinnati, OH Phone: (513) (800) Page 1 of 1
67 Certificate of Calibration and Conformance This document certifies that the instrument referenced below meets published specifications per Procedure PRD-P263; ANSI S (R 2006) Type 1; S1.4A-1985; S Type 1; S Octave Band Class 0; S ; IEC Class 1; Type 1; Type 1; Class 0; Manufacturer: Larson Davis Temperature: 72.8 Model Number: Serial Number: 3142 Rel. Humidity: 38.4 Customer: TMS Rental Pressure: Description: Sound Level Meter Note: As Found / As Left: In Tolerance o F o C % mbars hpa Upon receipt for testing, this instrument was found to be: Within the Stated tolerance of the manufacturer's specification Calibration Date: 28-Sep-15 Calibration Due: Calibration Standards Used: Manufacturer Larson Davis Model Serial Number Cal Due Traceability No. LDSigGen/ /0109 4/7/ This Certificate attests that this instrument has been calibrated under the stated conditions with Measurement and Test Equipment (M&TE) Standards traceable to the National Institute of Standards and Technology (NIST). All of the Measurement Standards have been calibrated to their manufacturers specified accuracy / uncertainty. Evidence of traceability and accuracy is on file at The Modal Shop and/or Larson Davis Corporate Headquarters. An acceptable accuracy ratio between the Standard(s) and the item calibrated has been maintained. This instrument meets or exceeds the manufacturer s published specification unless noted. This calibration complies with ISO and ANSI Z540. The collective uncertainty of the Measurement Standard used does not exceed 25% of the applicable tolerance for each characteristic calibrated unless otherwise noted. The results documented in this certificate relate only to the item(s) calibrated or tested. Calibration interval assignment and adjustment are the responsibility of the end user. This certificate may not be reproduced, except in full, without the written approval of The Modal Shop. Technician: Andy McGuire Signature: PRD-F242 revnr December 2, 2008 The Modal Shop, Inc East Kemper Road Cincinnati, OH Phone: (513) (800) Page 1 of 1
68 ~Certificate of Calibration~ Manufacturer: PCB Customer: TMS Rental Model Number: 377B02 Address: Serial Number: LW Asset ID: Calibration Date: Feb 02, :10:34 Description: Free-Field Microphone Due Date: Sensitivity: 250 Hz 1 khz Temperature: 74 (23) F ( C) db re. 1V/Pa Humidity: 31 % mv/pa Ambient Pressure: mbar Cal. Results: In Tolerance Polarization Voltage: 0 VDC 5 0 db Frequency Response Characteristics : The upper curve is the free field characteristic for the microphone with protection grid. The lower curve is the pressure response recorded by electrostatic actuator. Sensitivity : The stated sensitivity is the open-circuit sensitivity. When used with a typical preamplifier the sensitivity will be 0.2 db lower Frequency [Hz] Traceability: The calibration is traceable through 683/ Notes: Calibration results relate only to the items calibrated. This certificate may not be reproduced, except in full, without written permission. This calibration is performed in compliance with ISO 9001, ISO and ANSI Z540. Measurement uncertainty (250 Hz sensitivity calibration) at 95% confidence level: Calibrated per procedure PRD-P db. User Note: As Found / As Left: In Tolerance. Frequency Response with reference to level at 250 Hz Frequency (Hz) Upper (db) Frequency (Hz) Upper (db) Frequency (Hz) Upper (db) Frequency (Hz) Upper (db) Technician: Ed Devlin Reference Equipment Used: Manuf. Model Serial Cal. Date Due Date Approval: GRAS 40AG /1/2015 9/1/2016 Calibration Lab CALIBRATION CERT Page 1 of 1
69 ~Certificate of Calibration~ Manufacturer: PCB Customer: TMS Rental Model Number: 377B02 Address: Serial Number: LW Asset ID: Calibration Date: Jul 20, :47:55 Description: Free-Field Microphone Due Date: Sensitivity: 250 Hz 1 khz Temperature: 71 (22) F ( C) db re. 1V/Pa Humidity: 53 % mv/pa Ambient Pressure: mbar Cal. Results: In Tolerance Polarization Voltage: 0 VDC 5 0 db Frequency Response Characteristics : The upper curve is the free field characteristic for the microphone with protection grid. The lower curve is the pressure response recorded by electrostatic actuator. Sensitivity : The stated sensitivity is the open-circuit sensitivity. When used with a typical preamplifier the sensitivity will be 0.2 db lower Frequency [Hz] Traceability: The calibration is traceable through 683/ Notes: Calibration results relate only to the items calibrated. This certificate may not be reproduced, except in full, without written permission. This calibration is performed in compliance with ISO 9001, ISO and ANSI Z540. Measurement uncertainty (250 Hz sensitivity calibration) at 95% confidence level: Calibrated per procedure PRD-P db. User Note: As Found/As Left In Tolerance Frequency Response with reference to level at 250 Hz Frequency (Hz) Upper (db) Frequency (Hz) Upper (db) Frequency (Hz) Upper (db) Frequency (Hz) Upper (db) Technician: Wayne Underwood Reference Equipment Used: Manuf. Model Serial Cal. Date Due Date Approval: GRAS 40AG /15/2014 9/15/2015 Calibration Lab CALIBRATION CERT Page 1 of 1
70 ~Certificate of Calibration~ Manufacturer: PCB Customer: TMS Rental Model Number: 377B02 Address: Serial Number: LW Asset ID: Calibration Date: Jul 20, :47:55 Description: Free-Field Microphone Due Date: Sensitivity: 250 Hz 1 khz Temperature: 71 (22) F ( C) db re. 1V/Pa Humidity: 53 % mv/pa Ambient Pressure: mbar Cal. Results: In Tolerance Polarization Voltage: 0 VDC 5 0 db Frequency Response Characteristics : The upper curve is the free field characteristic for the microphone with protection grid. The lower curve is the pressure response recorded by electrostatic actuator. Sensitivity : The stated sensitivity is the open-circuit sensitivity. When used with a typical preamplifier the sensitivity will be 0.2 db lower Frequency [Hz] Traceability: The calibration is traceable through 683/ Notes: Calibration results relate only to the items calibrated. This certificate may not be reproduced, except in full, without written permission. This calibration is performed in compliance with ISO 9001, ISO and ANSI Z540. Measurement uncertainty (250 Hz sensitivity calibration) at 95% confidence level: Calibrated per procedure PRD-P db. User Note: As Found/As Left In Tolerance Frequency Response with reference to level at 250 Hz Frequency (Hz) Upper (db) Frequency (Hz) Upper (db) Frequency (Hz) Upper (db) Frequency (Hz) Upper (db) Technician: Wayne Underwood Reference Equipment Used: Manuf. Model Serial Cal. Date Due Date Approval: GRAS 40AG /15/2014 9/15/2015 Calibration Lab CALIBRATION CERT Page 1 of 1
71 ~Calibration Certificate~ Manufacturer: Larson Davis Asset ID: Model: CAL200 Calibration Date: Jul 30, :08:33 Serial Number: Due Date: Description: Acoustic Calibrator Technician: Ed Devlin Customer: TMS Rental Approval: Calibration Results: Temperature: 22 C (72 F) Measured SPL : db re. 20µPa Humidity: 47.40% Measured Frequency : 1, Hz Pressure: mbar Upon receipt for calibration, the instrument was found to be: WITHIN the stated tolerance of the manufacturer's specification. Note: As Found / As Left: In Tolerance. Measurement uncertainty at 95% confidence level: 0.3 db The subject instrument was calibrated to the indicated specification using standards stated below or to accepted values of natural physical constants. This document certifies that the instrument met the following specification upon its return to the customer. This calibration is traceable through : 683/ Notes: The calibration was performed under operating procedures intended to implement the requirements of ISO 9001, ISO and ANSI Z540. Unless otherwise noted, the reported value is both "as found" and "as left" data. Calibration results relate only to the items calibrated. This certificate may not be reproduced, except in full, without written permission. Reference Equipment Used: Manuf. Model Serial Cal. Date Due Date GRAS 40AG /15/2014 9/15/2015 Page 2 of 2
 Measured SPL : 113.91 db re. 20µPa Humidity: 47.40% Measured Frequency : 1,000.00 Hz Pressure: 996.")
72 ~Calibration Certificate~ Manufacturer: Larson Davis Asset ID: Model: CAL200 Calibration Date: Jul 30, :05:16 Serial Number: Due Date: Description: Acoustic Calibrator Technician: Ed Devlin Customer: TMS Rental Approval: Calibration Results: Temperature: 22 C (72 F) Measured SPL : db re. 20µPa Humidity: 47.40% Measured Frequency : 1, Hz Pressure: mbar Upon receipt for calibration, the instrument was found to be: WITHIN the stated tolerance of the manufacturer's specification. Note: As Found / As Left: In Tolerance. Measurement uncertainty at 95% confidence level: 0.3 db The subject instrument was calibrated to the indicated specification using standards stated below or to accepted values of natural physical constants. This document certifies that the instrument met the following specification upon its return to the customer. This calibration is traceable through : 683/ Notes: The calibration was performed under operating procedures intended to implement the requirements of ISO 9001, ISO and ANSI Z540. Unless otherwise noted, the reported value is both "as found" and "as left" data. Calibration results relate only to the items calibrated. This certificate may not be reproduced, except in full, without written permission. Reference Equipment Used: Manuf. Model Serial Cal. Date Due Date GRAS 40AG /15/2014 9/15/2015 Page 1 of 2
73 ~Certificate of Calibration~ Manufacturer: PCB Customer: TMS Rental Model Number: 377B02 Address: Serial Number: LW Asset ID: Calibration Date: Feb 02, :54:05 Description: Free-Field Microphone Due Date: Sensitivity: 250 Hz 1 khz Temperature: 74 (23) F ( C) db re. 1V/Pa Humidity: 34 % mv/pa Ambient Pressure: mbar Cal. Results: In Tolerance Polarization Voltage: 0 VDC 5 0 db Frequency Response Characteristics : The upper curve is the free field characteristic for the microphone with protection grid. The lower curve is the pressure response recorded by electrostatic actuator. Sensitivity : The stated sensitivity is the open-circuit sensitivity. When used with a typical preamplifier the sensitivity will be 0.2 db lower Frequency [Hz] Traceability: The calibration is traceable through 683/ Notes: Calibration results relate only to the items calibrated. This certificate may not be reproduced, except in full, without written permission. This calibration is performed in compliance with ISO 9001, ISO and ANSI Z540. Measurement uncertainty (250 Hz sensitivity calibration) at 95% confidence level: Calibrated per procedure PRD-P db. User Note: As Found / As Left: In Tolerance. Frequency Response with reference to level at 250 Hz Frequency (Hz) Upper (db) Frequency (Hz) Upper (db) Frequency (Hz) Upper (db) Frequency (Hz) Upper (db) Technician: Ed Devlin Reference Equipment Used: Manuf. Model Serial Cal. Date Due Date Approval: GRAS 40AG /1/2015 9/1/2016 Calibration Lab CALIBRATION CERT Page 1 of 1

74 Certificate of Calibration and Conformance This document certifies that the instrument referenced below meets published specifications per Procedure PRD-P263; ANSI S (R 2006) Type 1; S1.4A-1985; S Type 1; S Octave Band Class 0; S ; IEC Class 1; Type 1; Type 1; Class 0; Manufacturer: Model Number: Larson Davis 831 Temperature: o F o C Serial Number: 3386 Rel. Humidity: 38.4 % Customer: Description: TMS Rental Sound Level Meter Pressure: mbars hpa Note: As Found / As Left: In Tolerance Upon receipt for testing, this instrument was found to be: Within the Stated tolerance of the manufacturer's specification Calibration Date: 25-Sep-15 Calibration Due: Calibration Standards Used: Manufacturer Larson Davis Model Serial Number Cal Due Traceability No. LDSigGen/ /0109 4/7/ This Certificate attests that this instrument has been calibrated under the stated conditions with Measurement and Test Equipment (M&TE) Standards traceable to the National Institute of Standards and Technology (NIST). All of the Measurement Standards have been calibrated to their manufacturers specified accuracy / uncertainty. Evidence of traceability and accuracy is on file at The Modal Shop and/or Larson Davis Corporate Headquarters. An acceptable accuracy ratio between the Standard(s) and the item calibrated has been maintained. This instrument meets or exceeds the manufacturer s published specification unless noted. This calibration complies with ISO and ANSI Z540. The collective uncertainty of the Measurement Standard used does not exceed 25% of the applicable tolerance for each characteristic calibrated unless otherwise noted. The results documented in this certificate relate only to the item(s) calibrated or tested. Calibration interval assignment and adjustment are the responsibility of the end user. This certificate may not be reproduced, except in full, without the written approval of The Modal Shop. Technician: Andy McGuire Signature: The Modal Shop, Inc East Kemper Road Cincinnati, OH Phone: (513) (800) PRD-F242 revnr December 2, Page 1 of 1
 F ( C) -27.10-27.15 db re. 1V/Pa Humidity: 30 % 44.15 43.89 mv/pa Ambient Pressure: 992.7 mbar Cal.")
75 ~Certificate of Calibration~ Manufacturer: PCB Customer: TMS Rental Model Number: 377B02 Address: Serial Number: Asset ID: Calibration Date: Feb 02, :28:10 Description: Free-Field Microphone Due Date: Sensitivity: 250 Hz 1 khz Temperature: 74 (23) F ( C) db re. 1V/Pa Humidity: 30 % mv/pa Ambient Pressure: mbar Cal. Results: In Tolerance Polarization Voltage: 0 VDC 5 0 db Frequency Response Characteristics : The upper curve is the free field characteristic for the microphone with protection grid. The lower curve is the pressure response recorded by electrostatic actuator. Sensitivity : The stated sensitivity is the open-circuit sensitivity. When used with a typical preamplifier the sensitivity will be 0.2 db lower Frequency [Hz] Traceability: The calibration is traceable through 683/ Notes: Calibration results relate only to the items calibrated. This certificate may not be reproduced, except in full, without written permission. This calibration is performed in compliance with ISO 9001, ISO and ANSI Z540. Measurement uncertainty (250 Hz sensitivity calibration) at 95% confidence level: Calibrated per procedure PRD-P db. User Note: As Found / As Left: In Tolerance. Frequency Response with reference to level at 250 Hz Frequency (Hz) Upper (db) Frequency (Hz) Upper (db) Frequency (Hz) Upper (db) Frequency (Hz) Upper (db) Technician: Ed Devlin Reference Equipment Used: Manuf. Model Serial Cal. Date Due Date Approval: GRAS 40AG /1/2015 9/1/2016 Calibration Lab CALIBRATION CERT Page 1 of 1

76
77


78
79

80
81

82
83


84
85
86
87
88

89
90

91
Appendix 8. Draft Post Construction Noise Monitoring Protocol
 Appendix 8 Draft Post Construction Noise Monitoring Protocol DRAFT CPV Valley Energy Center Prepared for: CPV Valley, LLC 50 Braintree Hill Office Park, Suite 300 Braintree, Massachusetts 02184 Prepared
Technical Report Noise and Vibration
 Technical Report Noise and Vibration Eagle Mine and Humboldt Mill Prepared for: Eagle Mine, LLC 4547 County Road 601 Champion, MI 49814 Date: August 8, 2014 TriMedia Project Number: 2014-083 Table of Contents
Portable Noise Monitoring Report March 5 - April 24, 2016 The Museum of Vancouver. Vancouver Airport Authority
 Portable Noise Monitoring Report March 5 - April 24, 2016 The Museum of Vancouver Vancouver Airport Authority September 27, 2016 Table of Contents INTRODUCTION... 2 OBJECTIVES... 2 VANCOUVER: AIRCRAFT
Black. LWECS Site Permit. Stearns County. Permit Section:
 PERMIT COMPLIANCE FILING Permittee: Permit Type: Project Location: Docket No: Permit Section: Date of Submission : Black Oak Wind,, LLC LWECS Site Permit Stearns County IP6853/WS-10-1240 and IP6866/WS-11-831
Appendix L Noise Technical Report. Rehabilitation and Restoration of the Longfellow Bridge
 Appendix L Noise Technical Report Rehabilitation and Restoration of the Longfellow Bridge Noise Technical Report Rehabilitation and Restoration of the Longfellow Bridge Boston, MA May, 2011* Prepared by
Appendix F Noise and Vibration
 1.1 Wayside Noise Model Methods Wayside noise collectively refers to noise generated by railcars and locomotives (i.e., without including horn noise). The joint lead agencies used noise measurements from
WITHIN GENERATOR APPLICATIONS
 POWER SYSTEMS TOPICS 9 Measuring and Understanding Sound WITHIN GENERATOR APPLICATIONS INTRODUCTION When selecting a generator, there are many factors to consider so as not to negatively impact the existing
BASELINE NOISE MONITORING SURVEY
 t m s environment ltd TMS Environment Ltd 53 Broomhill Drive Tallaght Dublin 24 Phone: +353-1-4626710 Fax: +353-1-4626714 Web: www.tmsenv.ie BASELINE NOISE MONITORING SURVEY UNIVERSITY COLLEGE DUBLIN Report
TECHNICAL REPORT 2016 IEL ENVIRONMENTAL NOISE SURVEY OF THE DAIRYGOLD CASTLEFARM FACILITY, MITCHELSTOWN, CO. CORK.
 TECHNICAL REPORT 16 IEL ENVIRONMENTAL NOISE SURVEY OF THE DAIRYGOLD CASTLEFARM FACILITY, MITCHELSTOWN, CO. CORK. FOR Gabriel Kelly Group Environmental Manager Dairygold Food ingredients Castlefarm Mitchelstown
Bancroft & Piedmont Cellular Facility
 Page 1 of 19 Environmental Noise Analysis Bancroft & Piedmont Cellular Facility Berkeley, California BAC Job # 2015-177 Prepared For: Complete Wireless Consulting Attn: Ms. Kim Le 2009 V Street Sacramento,
The following is the summary of Keane Acoustics community mechanical noise study for the City of St. Petersburg.
 August 11, 2017 David Goodwin Director Planning & Economic Development Department City of St. Petersburg Re: City of St. Petersburg Dear Mr. Goodwin, The following is the summary of Keane Acoustics community
Noise Mitigation Study Pilot Program Summary Report Contract No
 Ohio Turnpike Commission Noise Mitigation Study Pilot Program Summary Report Contract No. 71-08-02 Prepared For: Ohio Turnpike Commission 682 Prospect Street Berea, Ohio 44017 Prepared By: November 2009
Pfizer Ireland Pharmaceuticals
 Allegro Acoustics Limited, Unit 2A Riverside, Tallaght Business Park, Tallaght, Dublin 24 Tel/Fax: +33 () 1 4148 Pfizer Ireland Pharmaceuticals Pfizer Grange Castle, Grange Castle Business Park, Clondalkin,
Noise and Ground-Borne Vibration Monitoring
 69 Noise and Vibration Study Noise and Ground-Borne Vibration Monitoring Labrador City, Newfoundland Nov, 07 Iron Ore Company of Canada TABLE OF CONTENTS 1.0 INTRODUCTION... 2 1.1 Study Objectives... 2
Environment Protection Authority (EPA), Industrial Noise Policy (INP) 2000;
, Industrial Noise Policy (INP) 2000;") 15 December 2017 Suite 6, Level 1, 146 Hunter Street Newcastle NSW 2300 PO Box 506 Pere Riini Quarry Manager Hanson Construction Materials Pty Ltd Level 5, 75 George Street Parramatta, NSW 2150 Newcastle,
15 December 2017 Suite 6, Level 1, 146 Hunter Street Newcastle NSW 2300 PO Box 506 Pere Riini Quarry Manager Hanson Construction Materials Pty Ltd Level 5, 75 George Street Parramatta, NSW 2150 Newcastle,
Fundamentals of Environmental Noise Monitoring CENAC
 Fundamentals of Environmental Noise Monitoring CENAC Dr. Colin Novak Akoustik Engineering Limited April 03, 2013 Akoustik Engineering Limited Akoustik Engineering Limited is the sales and technical representative
UC Berkeley Northside Relocation Cellular Facility
 Page 1 of 19 Environmental Noise Analysis UC Berkeley Northside Relocation Cellular Facility Berkeley, California BAC Job # 2015-290 Prepared For: Complete Wireless Consulting Attn: Kim Le 2009 V Street
Black Butte Copper Project Mine Operating Permit Application (Revision 3)
") Mine Operating Permit Application (Revision 3) APPENDIX J: Tintina Montana, Inc. July 17 MEMORANDUM DATE: October 7, 13 TO: FROM: RE: Allan Kirk / Geomin Resources Bob Jacko / Tintina Resources Sean Connolly
Mine Operating Permit Application (Revision 3) APPENDIX J: Tintina Montana, Inc. July 17 MEMORANDUM DATE: October 7, 13 TO: FROM: RE: Allan Kirk / Geomin Resources Bob Jacko / Tintina Resources Sean Connolly
WesPac Pittsburg Energy Infrastructure Project. Noise Assessment Report
 WesPac Pittsburg Energy Infrastructure Project Noise Assessment Report Prepared for WesPac Energy Pittsburg LLC And Oiltanking North America LLC Prepared by TRC 1200 Wall Street West, 2 nd Floor Lyndhurst,
W For inspection purposes only. This report shall not be reproduced except in full, without the approval of BnM Environmental.
 ANNUAL MONITORING OF ENVIRONMENTAL NOISE AT THE BORD NA MóNA KILBERRY COMPOST FACILITY IN COMPLIANCE WITH IED LICENCE, NO. W0198-01 For the Attention of: Site Work & Report Prepared by: Anua File Ref:
Roche Ireland Limited
 Limited Clarecastle, Co. Clare Monitoring Report Industrial Emissions Licence Number P0012-05 Report Date: 1 st February 17 Fitz Scientific Unit 35A, Boyne Business Park, Drogheda, Co. Louth Report No.
The following is the summary of Keane Acoustics acoustical study for the City of St. Petersburg.
 November 23, 2017 David Goodwin Director Planning & Economic Development Department City of St. Petersburg Re: City of St. Petersburg Dear Mr. Goodwin, The following is the summary of Keane Acoustics acoustical
Environment Protection Authority (EPA), Industrial Noise Policy (INP) 2000;
, Industrial Noise Policy (INP) 2000;") 10 October 2017 Suite 6, Level 1,, 146 Hunter Street Newcastle NSW 2300 PO Box 506 Pere Riini Quarry Manager Hanson Construction Materials Pty Ltd Level 5, 75 George Street Parramatta, NSW 2150 Newcastle,
10 October 2017 Suite 6, Level 1,, 146 Hunter Street Newcastle NSW 2300 PO Box 506 Pere Riini Quarry Manager Hanson Construction Materials Pty Ltd Level 5, 75 George Street Parramatta, NSW 2150 Newcastle,
Liddell Coal Operations
 Liddell Coal Operations Environmental Noise Monitoring February 2018 Prepared for Liddell Coal Operations Pty Ltd Page i Liddell Coal Operations Environmental Noise Monitoring February 2018 Reference:
Background Ambient Noise Study Rosemont Copper
 Background Ambient Noise Study Rosemont Copper Prepared for: Rosemont Copper 40 Cherry Creek South Drive, Ste. 10 Denver, Colorado 246 (3) 0-0138 Fax (3) 0-0135 Prepared by: 31 West Ina Road Tucson, Arizona
Basin Electric Intertie Noise & Vibration Study and Land Use Assessment
 Executive Summary and Recommendations Black Hills Power and Basin Electric Power Cooperative constructed an Intertie outside of Rapid City, South Dakota (Facility). The Facility is a high voltage direct
Underwater Noise Levels
 TO: FROM: John Callahan Rick Huey Jim Laughlin (206) 440-4643 SUBJECT: Keystone Ferry Terminal Vibratory Pile Monitoring Technical Memorandum. Underwater Noise Levels This memo summarizes the vibratory
Offaly County Council
 Derryclure Landfill Facility, Derryclure, Co. Offaly Annual Monitoring Report Waste Licence Reg. No. W0029-04 Report Date: th October 15 Fitz Scientific Unit 35A, Boyne Business Park, Drogheda, Co. Louth
Lion s Gate Secondary Wastewater Treatment Plant Pile Driving North Vancouver, BC. Final Report Rev 1
 Lion s Gate Secondary Wastewater Treatment Plant Pile Driving North Vancouver, BC Final Report Rev 1 Noise Impact Assessment RWDI # 1502274 SUBMITTED TO Paul Dufault Project Manager Metro Vancouver 4330
PURPLE LINE EXTENSION SECTION 2 AMBIENT NOISE LEVEL REPORT METRO PROJECT RODEO STATION
 PURPLE LINE EXTENSION SECTION 2 AMBIENT NOISE LEVEL REPORT METRO PROJECT 865522 RODEO STATION Kleinfelder Section Table of Contents 1.0 Introduction... 4 2.0 Noise Measurement Procedure... 4 3.0 Noise
Raging River Quarry. Environmental Noise Monitoring Protocol Provisional Operations 11/30/2016
 Raging River Quarry Environmental Noise Monitoring Protocol Provisional Operations 11/30/2016 Introduction The Raging River Quarry operates in unincorporated King County, near Fall City, Washington. King
Memorandum 1.0 Highway Traffic Noise
 Memorandum Date: September 18, 2009 To: Chris Hiniker, SEH From: Stephen B. Platisha, P.E. Re: Updated CSAH 14 Noise Analysis The purpose of this memorandum is to provide the results of the revised traffic
REPORT PERIOD: JANUARY 01 MARCH
 QUARTERLY NOISE MONITORING REPORT FOR EAST GALWAY LANDFILL REPORT PERIOD: JANUARY 01 MARCH 31 2018 IE LICENCE REF. NO. W0178-02 APRIL 2018 QUARTERLY NOISE MONITORING REPORT FOR EAST GALWAY LANDFILL REPORT
AMERICAN UNIVERSITY EAST CAMPUS DEVELOPMENT WASHINGTON, D.C. Environmental Noise Study. Project Number
 AMERICAN UNIVERSITY EAST CAMPUS DEVELOPMENT WASHINGTON, D.C. Environmental Noise Study Project Number 11-107 Douglas P. Koehn, M.S. Senior Consultant 12040 SOUTH LAKES DRIVE, SUITE 104, RESTON, VIRGINIA
NOISE IMPACT ASSESSMENT 2016
 Panther Environmental Solutions Ltd, Unit 4, Innovation Centre, Institute of Technology, Green Road, Carlow, Ireland. Mobile: 087-8519284 Telephone /Fax: 059-9134222 Email: info@pantherwms.com Website:
Liddell Coal Operations
 Liddell Coal Operations Environmental Noise Monitoring May 2018 Prepared for Liddell Coal Operations Pty Ltd Page i Liddell Coal Operations Environmental Noise Monitoring May 2018 Reference: Report date:
Electricity Supply to Africa and Developing Economies. Challenges and opportunities. Planning for the future in uncertain times
 Electricity Supply to Africa and Developing Economies. Challenges and opportunities. Planning for the future in uncertain times 765 kv Substation Acoustic Noise Impact Study by Predictive Software and
Ashton Coal. Environmental Noise Monitoring May Prepared for Ashton Coal Operations Pty Ltd
 Ashton Coal Environmental Noise Monitoring May 2018 Prepared for Ashton Coal Operations Pty Ltd Page i Ashton Coal Environmental Noise Monitoring May 2018 Reference: Report date: 5 June 2018 Prepared for
APPENDIX G-4 NOISE MONITORING REPORT
 APPENDIX G-4 NOISE MONITORING REPORT TETRA TECH, INC. 820 Mililani Street, Suite 700 Honolulu, Hawai i 96813 Telephone (808) 533-3366 FAX (808) 533-3360 February 22, 2005 Uyen Tran Contract Monitor US
Traffic Noise and Vibration Impact Assessment Technical Report for the North Meadows Extension to US 85 and Interstate 25
 Traffic Noise and Vibration Impact Assessment Technical Report for the North Meadows Extension to US 85 and Interstate 25 February 2010 Prepared for: Town of Castle Rock Douglas County Colorado Department
Xtratherm Limited Kells Road, Navan, Co Meath
 Air I Noise I Water I Soil I Environmental Consultancy www.axisenv.ie Unit 5 Caherdavin Business Centre Ennis Road Limerick Kells Road, Navan, Co Meath Annual Environmental Noise Survey 2017 IPPC Licence
Roche Ireland Limited
 Roche Ireland Limited Clarecastle, Co. Clare Environmental Noise Monitoring Report Industrial Emissions Licence Number P0012-05 Report Date: 6 th October 17 Fitz Scientific Unit 35A, Boyne Business Park,
Boggabri Coal Mine. Environmental Noise Monitoring June Prepared for Boggabri Coal Operations Pty Ltd
 Boggabri Coal Mine Environmental Noise Monitoring June 2017 Prepared for Boggabri Coal Operations Pty Ltd Page i Boggabri Coal Mine Environmental Noise Monitoring June 2017 Reference: Report date: 5 July
Boggabri Coal Mine. Environmental Noise Monitoring October Prepared for Boggabri Coal Operations Pty Ltd
 Boggabri Coal Mine Environmental Noise Monitoring October 2017 Prepared for Boggabri Coal Operations Pty Ltd Page i Boggabri Coal Mine Environmental Noise Monitoring October 2017 Reference: Report date:
Noise Impact Analysis
 November 12, 2014 Holly P. Smyth, AICP, Planning Director City of Hercules 111 Civic Drive Hercules, CA 94547 Subject: CEQA Noise Analysis for the Proposed Sycamore Crossing Project in Hercules, California
PERMANENT AND SEMI-PERMANENT NOISE MONITORING - FIRST RESULTS IN THE CITY OF NIS
 PERMANENT AND SEMI-PERMANENT NOISE MONITORING - FIRST RESULTS IN THE CITY OF NIS Momir Prašćević 1, Darko Mihajlov 2, Dragan Cvetković 3 1 University of Nis, Faculty of Occupational Safety, Serbia, momir.prascevic@znrfak.ni.ac.rs
Muswellbrook Coal Company
 Muswellbrook Coal Company Environmental ise Monitoring May 2015 Prepared for Muswellbrook Coal Page i Muswellbrook Coal Company Environmental ise Monitoring May 2015 Reference: Report date: 18 June 2015
Soltec (Ireland) Limited Mullingar Business Park, Mullingar, Co Westmeath. Annual Noise Report
 Limited Mullingar Business Park, Mullingar, Co Westmeath. Annual Noise Report") Mullingar Business Park, Mullingar, Co Westmeath. Annual Noise Report 2013 Licence Number: W0115-01 Report Date: 09 th July 2013 Report Number: 3220-13-03 Version 0 AXIS environmental services 40 Coolraine
Mullingar Business Park, Mullingar, Co Westmeath. Annual Noise Report 2013 Licence Number: W0115-01 Report Date: 09 th July 2013 Report Number: 3220-13-03 Version 0 AXIS environmental services 40 Coolraine
Pre-Construction Sound Study. Velco Jay Substation DRAFT. January 2011 D A T A AN AL Y S IS S OL U T I ON S
 Pre-Construction Sound Study Substation DRAFT January 2011 D A T A AN AL Y S IS S OL U T I ON S TABLE OF CONTENTS 1.0 INTRODUCTION...1 2.0 SOUND LEVEL MONITORING...1 3.0 SOUND MODELING...4 3.1 Modeling
Orora Pty Ltd. B9 Paper Mill EPL Compliance Quarterly noise monitoring report. 20 June Doc no QM-RP-4-0
 Orora Pty Ltd B9 Paper Mill EPL Compliance Quarterly noise monitoring report 20 June 2017 Doc no. 102-QM-RP-4-0 Orora Pty Ltd B9 Paper Mill - EPL Compliance Title Document no. Quarterly noise monitoring
ITV CORONATION STREET PRODUCTION FACILITY, TRAFFORD WHARF ROAD ASSESSMENT OF POTENTIAL NOISE & VIBRATION IMPACT OF PROPOSED METROLINK LINE
 ITV CORONATION STREET PRODUCTION FACILITY, TRAFFORD WHARF ROAD ASSESSMENT OF POTENTIAL NOISE & VIBRATION IMPACT OF PROPOSED METROLINK LINE On behalf of: ITV plc Report No. 22396.01v1 October 2014 ITV CORONATION
CENTRAL WASTE MANAGEMENT FACILITY, INAGH, CO. CLARE. ENVIRONMENTAL NOISE MONITORING MAY 2017.
 CENTRAL WASTE MANAGEMENT FACILITY, INAGH, CO. CLARE. ENVIRONMENTAL NOISE MONITORING MAY 2017. Prepared for: CLARE COUNTY COUNCIL ÁRAS CONTAE AN CHLÁIR NEW ROAD ENNIS CO. CLARE 3156 May 16 th, 2017 EPA
Rehab Glassco. Unit 4, Osberstown Industrial Park, Caragh Road, Naas, Co. Kildare. For inspection purposes only.
 Air I Noise I Water I Soil I Environmental Consultancy www.axisenv.ie Unit 5 Caherdavin Business Centre, Ennis Road, Limerick Unit 4, Osberstown Industrial Park, Caragh Road, Naas, Co. Kildare Environmental
Assessing the accuracy of directional real-time noise monitoring systems
 Proceedings of ACOUSTICS 2016 9-11 November 2016, Brisbane, Australia Assessing the accuracy of directional real-time noise monitoring systems Jesse Tribby 1 1 Global Acoustics Pty Ltd, Thornton, NSW,
Appendix B: Noise Study
 Appendix B: Noise Study creating remarkable solutions for a higher quality of life NOISE STUDY Interstate 55 Route PP to County Road 311 Prepared for: MoDOT PROJECT NO. J010956 November 2014 Prepared
Liddell Coal Operations
 Liddell Coal Operations Environmental Noise Monitoring April 2016 Prepared for Liddell Coal Operations Pty Ltd Page i Liddell Coal Operations Environmental Noise Monitoring April 2016 Reference: Report
Review of Baseline Noise Monitoring results and Establishment of Noise Criteria
 Appendix G Review of Baseline Noise Monitoring results and Establishment of Noise Criteria Environmental Management Plan G May 2014 Colton Coal Mine Aldershot, Queensland Review of Baseline Noise Monitoring
Glassco Recycling. Unit 4, Osberstown Industrial Park, Caragh Road, Naas, Co. Kildare. For inspection purposes only.
 Air I Noise I Water I Soil I Environmental Consultancy www.axisenv.ie Unit 5 Caherdavin Business Centre, Ennis Road, Limerick. info@axisenv.ie 00353 61 324587 Unit 4, Osberstown Industrial Park, Caragh
ABSTRACT. Noise Monitoring Results. from. The USAF atmospheric interceptor technology (ait) launch From the Kodiak Launch Complex (KLC)
 launch From the Kodiak Launch Complex (KLC)") ABSTRACT Noise Monitoring Results from The USAF atmospheric interceptor technology (ait) launch From the Kodiak Launch Complex (KLC) As part of the monitoring and mitigation obligation of the United States
ABSTRACT Noise Monitoring Results from The USAF atmospheric interceptor technology (ait) launch From the Kodiak Launch Complex (KLC) As part of the monitoring and mitigation obligation of the United States
A. INTRODUCTION B. METHODOLOGY
 Chapter 9: and Vibration A. INTRODUCTION This chapter analyzes the effects of Alternatives B, C, and Preferred Alternative D on ambient noise and vibration levels. can be generated by fixed facilities,
OneSteel Recycling Hexham Quarterly Noise Monitoring Report Q2 2017
 OneSteel Recycling Pty Ltd 14-Jul-2017 60493017 OneSteel Recycling Hexham Quarterly Noise Monitoring Report Q2 2017 NATA ACCREDITATION No. 2778 (14391) Accredited for compliance with ISO/IEC 17025 Testing
Muswellbrook Coal Company
 Muswellbrook Coal Company Environmental Noise Monitoring November 2015 Prepared for Muswellbrook Coal Page i Muswellbrook Coal Company Environmental Noise Monitoring November 2015 Reference: Report date:
Orora Pty Ltd. B9 Paper Mill EPL Compliance Quarterly noise monitoring report. 11 August Doc no QM-RP-1-0
 Orora Pty Ltd B9 Paper Mill EPL Compliance Quarterly noise monitoring report 11 August 16 Doc no. 102-QM-RP-1-0 Orora Pty Ltd B9 Paper Mill - EPL Compliance Title Document no. Quarterly noise monitoring
Protocol for Ambient Level Noise Monitoring
 July 2015 Protocol for Ambient Level Noise Monitoring L pressure =10.log [10 (Lp/10) - 10 (LpBackground/10) ] L pressure = 10.log [10 (Lp/10) - 10 (LpBackground/10) ] CENTRAL POLLUTION CONTROL BOARD P
DOWNWIND LEG NOISE MONITORING SUMMARY REPORT
 Tel: 43-232-6771 Fax: 43-232-6762 RWDI AIR Inc. #1, 736-8 th Avenue S.W. Calgary, Alberta, Canada T2P 1H4 Email: solutions@rwdi.com DOWNWIND LEG NOISE MONITORING SUMMARY REPORT Introduction This report
Noise Study for Proposed Mavis Tire
 Noise Study for Proposed Mavis Tire Hyde Park, New York April 4, 2017 Prepared For: Town of Hyde Park Planning Board 4383 Albany Post Road Hyde Park, NY 12538 Prepared By: Novus Engineering, P.C. 25 Delaware
Noise monitoring during drilling operations Lower Stumble Well Site Balcombe, West Sussex
 Noise monitoring during drilling operations Lower Stumble Well Site Balcombe, West Sussex Report ref. PJ3159/13181 Date August 13 Issued to Cuadrilla Resources Limited Issued by Peter Jackson MSc MIOA
Attended Noise Monitoring - Quarter Ending September 2013
 Unity Mining Level 10, 350 Collins St Melbourne VIC 3000 Version: Page 2 PREPARED BY: ABN 29 001 584 612 Units 7-8, 26-28 Napier Close Deakin ACT 2600 Australia (PO Box 9344 Deakin ACT 2600 Australia)
Subject: Ambient Noise Measurement, Creekside Park Project, Monte Rio, California
 22 December 2011 11215-00.01810 Laura Saunders, AICP Prunuske Chatham, Inc. 400 Morris Street, Suite G Sebastopol, CA 95472 Subject: Ambient Noise Measurement, Creekside Park Project, Monte Rio, California
Boggabri Coal Mine. Environmental Noise Monitoring August Prepared for Boggabri Coal Operations Pty Ltd
 Boggabri Coal Mine Environmental Noise Monitoring August 2018 Prepared for Boggabri Coal Operations Pty Ltd Page i Boggabri Coal Mine Environmental Noise Monitoring August 2018 Reference: Report date:
Further Investigations of Low-frequency Noise Problem Generated by Freight Trains
 Proceedings of Acoustics 2012 - Fremantle Further Investigations of Low-frequency Noise Problem Generated by Freight Trains Jingnan Guo, John Macpherson and Peter Popoff-Asotoff Noise Regulation Branch,
Bickerdike Allen Partners
 25 CHURCH ROAD, SE19 ENTERTAINMENT NOISE ASSESSMENT Report to Kayode Falebita Kingsway International Christian Centre 3 Hancock Road Bromley-By-Bow London E3 3DA A9540/R01-A-HT 26/07/2012 CONTENTS Page
Standard Guide for Measurement of Outdoor A-Weighted Sound Levels 1
 Designation: E 1014 84 (Reapproved 1995) e1 AMERICAN SOCIETY FOR TESTING AND MATERIALS 100 Barr Harbor Dr., West Conshohocken, PA 19428 Reprinted from the Annual Book of ASTM Standards. Copyright ASTM
CHAPTER 3 NOISE FUNDAMENTALS
 CHAPTER 3 NOISE FUNDAMENTALS While a great deal is known about aircraft noise, the methods used to calculate noise exposure can be difficult to understand. Determining aircraft noise impacts involves logarithmic
University of York Heslington East Campus Details of Noise Modelling and Noise Survey. Report ref AAc/ /R01
 Heslington East Campus Details of Noise Modelling and Noise Survey Report ref Heslington East Campus Details of Noise Modelling and Noise Survey January 2008 Arup Acoustics Admiral House, Rose Wharf, 78
Noise Study Report. Addendum. Interstate 10 Corridor Project. In the Counties of San Bernardino and Los Angeles
 Interstate 10 Corridor Project Draft NSR Addendum Noise Study Report Addendum Interstate 10 Corridor Project In the Counties of San Bernardino and Los Angeles 07-LA-10 PM 44.9/48.3 08-SBD-10 PM 0.0/R37.0
Assessment of rail noise based on generic shape of the pass-by time history
 Proceedings of Acoustics 23 Victor Harbor 7-2 November 23, Victor Harbor, Australia Assessment of rail noise based on generic shape of the pass-by time history Valeri V. enchine, Jonathan Song Science
FINAL REPORT. On Project Supplemental Guidance on the Application of FHWA s Traffic Noise Model (TNM) APPENDIX K Parallel Barriers
 APPENDIX K Parallel Barriers") FINAL REPORT On Project - Supplemental Guidance on the Application of FHWA s Traffic Noise Model (TNM) APPENDIX K Parallel Barriers Prepared for: National Cooperative Highway Research Program (NCHRP) Transportation
FINAL REPORT On Project - Supplemental Guidance on the Application of FHWA s Traffic Noise Model (TNM) APPENDIX K Parallel Barriers Prepared for: National Cooperative Highway Research Program (NCHRP) Transportation
Identifying noise levels of individual rail pass by events
 Identifying noise levels of individual rail pass by events 1 Matthew Ottley 1, Alex Stoker 1, Stephen Dobson 2 and Nicholas Lynar 1 1 Marshall Day Acoustics, 4/46 Balfour Street, Chippendale, NSW, Australia
City and Borough of Juneau
 City and Borough of Juneau Flightseeing Noise Measurement and Assessment Study Proposed Work Plan BACKGROUND AND STUDY OBJECTIVES The objective of the flightseeing noise measurement program is to provide
NOISE IMPACT STUDY FOR THE SOUTH PIER IMPROVEMENT PROJECT BROOKLYN, NEW YORK. April 2008
 NOISE IMPACT STUDY FOR THE SOUTH PIER IMPROVEMENT PROJECT BROOKLYN, NEW YORK April 2008 NOISE IMPACT STUDY FOR THE SOUTH PIER IMPROVEMENT PROJECT BROOKLYN, NEW YORK Prepared for: ESS Group, Inc. 401 Wampanoag
Short Term Aircraft Noise Monitoring Pacifica
 Short Term Aircraft Noise Monitoring Pacifica Prepared for the Vallemar Neighborhood Noise Abatement Office P.O. Box 8097 San Francisco, CA 94128 (650) 821 5100 Technical Report #032016 P51 981 February
Assured Monitoring Group
 Assured Monitoring Group YARRANLEA SOLAR FARM NOISE & VIBRATION IMPACT ASSESSMENT JANUARY 2017 I3 CONSULTING PTY LTD Project ID. 10734 R_1 DATE OF RELEASE: 15/02/2017 Table 1: Document approval Name Position
Attended Noise Monitoring Program
 16 May 2018 Ref: 171356/7853 Muswellbrook Coal Company PO Box 123 Muswellbrook NSW 2333 RE: MAY 2018 NOISE MONITORING RESULTS MUSWELLBROOK COAL MINE This letter report presents the results of noise compliance
South Orange County Reliability Enhancement Project
 South Orange County Reliability Enhancement Project AMBIENT NOISE SURVEY REPORT CAPISTRANO SUBSTATION NOISE & CORONA NOISE March 2012 San Diego Gas & Electric Company Prepared by: Alliance Acoustical Consulting,
Mackas Sand Pty Ltd ENVIRONMENTAL NOISE MONITORING AUGUST 2014
 Mackas Sand Pty Ltd ENVIRONMENTAL NOISE MONITORING AUGUST 2014 Mackas Sand Pty Ltd ENVIRONMENTAL NOISE MONITORING AUGUST 2014 Prepared by Umwelt (Australia) Pty Limited on behalf of Mackas Sand Pty Ltd
Orora Compliance Monitoring
 Orora Compliance Monitoring ORORA LIMITED April 2016 Noise Monitoring 038900_20160506 A 6 May 2016 Orora Compliance Monitoring Project no: Document title: IA038900 April 2016 Noise Monitoring Document
Swan DH Noise Impact Assessment Report
 Swan 4-64 6-1 3DH Noise Impact Assessment Report April 9, 2018 Prepared for: ConocoPhillips 34501 East Quincy Avenue Watkins, Colorado 80137 Prepared by: Behrens and Associates, Inc. 13806 Inglewood Avenue
Environmental Noise Assessment Cambourne to Cambridge options
 Environmental Noise Assessment Cambourne to Cambridge options CLIENT: Cambridgeshire County Council Major Infrastructure Delivery Box No SH1311 Shire Hall Cambridge CB3 0AP CONTACT: Tim Watkins REPORTED
Terms of Reference of Aircraft Noise at IGI Airport, New Delhi
 Terms of Reference of Aircraft Noise at IGI Airport, New Delhi In order to determine the noise impact from aircraft flights and identify potential measures to reduce the noise impact, an Aircraft Noise
Annual Noise Monitoring Report
 Noise monitoring program Annual report sum mary 2 0 1 7 Annual Noise Monitoring Report The Vancouver Fraser Port Authority has a noise m onitoring program in place to better understand the source and intensity
Please refer to the figure on the following page which shows the relationship between sound fields.
 Defining Sound s Near The near field is the region close to a sound source usually defined as ¼ of the longest wave-length of the source. Near field noise levels are characterized by drastic fluctuations
Appendix D. Traffic Noise Analysis Report. I-94 St. Michael to Albertville Minnesota Department of Transportation
 Appendix D Traffic Noise Analysis Report I-94 St. Michael to Albertville Minnesota Department of Transportation Traffic Noise Analysis Report I-94 St. Michael to Albertville Project SP 8680-172 Report
McGill Environmental Ltd.
 McGill Environmental Ltd. Coom, Glenville, Co. Cork Environmental Noise Survey Report Date: 7 th October 2016 For inspection purposes only. KD Environmental Ltd. 1 Swiftbrook Glen, Virginia, Co. Cavan
ARTHUR KILL 3. US Army Corps of Engineers NEW YORK DISTRICT NOISE MONITORING REPORT EASTERN SHORE (WEEK OF APRIL 29, 2013 MAY 05, 2013)
") ARTHUR KILL 3 US Army Corps of Engineers NEW YORK DISTRICT NOISE MONITORING REPORT EASTERN SHORE (WEEK OF APRIL 29, 2013 MAY 05, 2013) SITE NAK-1 DUARTE MARTI SCHOOL, FRONT STREET, ELIZABETH, NEW JERSEY
ARTHUR KILL 3 US Army Corps of Engineers NEW YORK DISTRICT NOISE MONITORING REPORT EASTERN SHORE (WEEK OF APRIL 29, 2013 MAY 05, 2013) SITE NAK-1 DUARTE MARTI SCHOOL, FRONT STREET, ELIZABETH, NEW JERSEY
Geopier Foundation Company, Inc.
 Geopier Foundation Company, Inc. 800.371.7470 www.geopier.com 4_2006 g e o p i e r f o u n d a t i o n c o i n c t e c h n i c a l b u l l e t i n N o. 9 v i b r a t i o n a n d n o i s e l e v e l s Construction
Appendix N. Preliminary Noise Assessment Technical Memorandum
 Appendix N Preliminary Noise Assessment Technical Memorandum SENES Consultants Limited MEMORANDUM 121 Granton Drive, Unit 12 Richmond Hill, Ontario Canada L4B 3N4 Tel: (905) 764-9380 Fax: (905) 764-9386
ISO INTERNATIONAL STANDARD
 INTERNATIONAL STANDARD ISO 1996-2 Second edition 2007-03-15 Acoustics Description, measurement and assessment of environmental noise Part 2: Determination of environmental noise levels Acoustique Description,
PROPOSED MARYWOOD DEVELOPMENT
 ACOUSTICAL ANALYSIS PROPOSED MARYWOOD DEVELOPMENT CITY OF ORANGE, CALIFORNIA PREPARED FOR VCS Environmental 30900 RANCH VIEJO ROAD, SUITE 100 SAN JUAN CAPISTRANO, CALIFORNIA 92675 PREPARED BY A/E Tech
Pipeline Blowdown Noise Levels
 Pipeline Blowdown Noise Levels James Boland 1, Henrik Malker 2, Benjamin Hinze 3 1 SLR Consulting, Acoustics and Vibration, Brisbane, Australia 2 Atkins Global, Acoustics, London, United Kingdom 3 SLR