This document is downloaded from DR-NTU, Nanyang Technological University Library, Singapore.
|
|
|
- Evelyn Copeland
- 5 years ago
- Views:
Transcription
1 This document is downloaded from DR-NTU, Nanyang Technological University Library, Singapore. Title Optical edge projection for surface contouring Author(s) Citation Miao, Hong; Quan, Chenggen; Tay, Cho Jui; Fu, Yu; Wu, X. P. Miao, H., Quan, C., Tay, C. J., Fu, Y., & Wu, X. P. (2005). Optical edge projection for surface contouring. Optics Communications. Date 2005 URL Rights This is the author created version of a work that has been peer reviewed and accepted for publication by Optics Communications, Elsevier. It incorporates referee s comments but changes resulting from the publishing process, such as copyediting, structural formatting, may not be reflected in this document. The published version is available at: [DOI:
2 Optical edge projection for surface contouring H. Miao a,b, C. Quan a, *, C.J. Tay a, Y. Fu a, X.P. Wu b a Department of Mechanical Engineering, National University of Singapore, 10 Kent Ridge Crescent, Singapore , Singapore b Key Laboratory of Mechanical Behavior and Design of Materials, Department of Modern Mechanics, University of Science and Technology of China, Hefei, Anhui , China * Corresponding author. Tel.: ; fax: address: mpeqcg@nus.edu.sg (C. Quan). Abstract A novel optical edge projection method is proposed for surface contouring of an object with low reflectivity. A structured light edge is projected onto a dark surface, and the image is captured by a CCD camera. The object contour is evaluated using active triangular projection algorithm, and a whole field 3D contour of the object is obtained by scanning the optical edge over the entire object surface. The proposed method is applied to a black low-reflective object made of weaved carbon fiber. The results which are verified with conventional phase shifting fringe projection technique show that an accurate profile of a specimen can be obtained. The proposed method is also applied to surface contouring of a small component. Keywords: Fringe projection; Optical edge; Surface contouring 1. Introduction Optical techniques are widely used to determine surface contour in many engineering fields. Generally they are non-contact and non-destructive, and are desirable for vibration analysis, quality control and contour mapping. Common optical methods for contouring include moiré [1,2], holography [3], Fourier transform [4,5], phase measuring profilometry [6,7], and shearography [8,9]. In recent years, phase shifting fringe projection method [10,11] has become a predominant method for surface contouring, and has been extended to measurement of micro components. When a structured light is projected onto the surface of an object, the projected fringe pattern is perturbed due to its profile, thereby enabling direct derivation of the surface profiles. Conventional phase shifting fringe projection method produces good results when the surface of the object has good reflectivity. However, if the surface has low reflectivity, such as a weaved carbon fiber, large error will result due to low image intensity. To overcome this problem, a novel optical edge projection method is proposed. A structured light edge is projected onto an object and the distorted optical edge is captured by a CCD camera. Extracting the optical edge shadow and comparing it with a reference
3 line, the height of the object surface along the edge can be obtained using the triangulation method. Whole field 3D contour of the object is obtained by scanning the optical edge over the entire object surface. The accuracy of the method is dependent upon that of the optical edge detection algorithm. In this paper, the Canny edge detector [12] designed specially for step edge extraction [13] is used. 2. Principle of the method 2.1. Active triangulation projection Fig. 1 shows a schematic of the projection and imaging system. It is an active triangulation projection semi-whole-field measuring system. An optical edge is projected onto a specimen at right angle. The image of the edge is located along point A and O is the corresponding point on a reference line. When viewed from another direction at an angle θ, a distorted image AC can be observed. The height h(x,y) of point A can be calculated directly from simple geometry. As shown in Fig. 1, the height of the specimen surface h(x,y) can be obtained by AC indicates the projected optical edge; the length of AC which is calculated from the reference line is in units of pixels. The actual values of AC are calculated from a calibrated reference line Optical edge detection In Canny edge detection algorithm [12], a two-dimensional Gaussian function G(x,y) is given by: (1) (2) and an image with an optical edge f(x,y) is smoothened by convolution with G(x,y). The smoothened image G[f(x,y)] is Two-dimensional first derivatives are then calculated, and the gradient magnitude (edge strength) and direction are obtained. The first-order derivative of an image f(x,y) at a point P(x,y) is defined by a two-dimensional vector (3) (4)
4 The absolute gradient magnitude is given by: (5) The gradient direction (edge orientation) is defined by: A non-maximal suppression process is then applied to the gradient magnitude (edge strength) image to identify the local maxima. Only pixels with edge strength larger than their two adjacent pixels in the gradient direction are identified as edge candidates while the others are set to zero. The non-maximal suppression process results in edge segments of one pixel width. To remove false edge segments due to noise, a thresholding with hysteresis is processed. Two thresholds estimated by a signal-to-noise ratio from the original image are used to remove weak edges using the following criteria: (1) all edge candidates below the lower threshold value are marked as background; (2) edge candidates above the lower threshold are identified as edge pixels if they can be connected to any pixels above the high threshold through a chain of edge pixels Surface contouring by phase shifting technique The phase shifting fringe projection technique is also used for comparison. Four phase shifted sinusoidal fringes with phase shifts of 0, π/2, π and 3π/2 are projected onto a test surface. The following equations represent the four successive intensity distributions [14]: where a(x,y) is an average intensity (background), b(x,y) is the intensity modulation, and φ(x,y) are the phase values to be determined. The phase φ(x, y) at each point on the image can be obtained by The calculated phase φ(x, y) are principal values in the range of (-π, π), and is wrapped in this range with discontinuous 2π phase jumps if the variation is larger than 2π. The discontinuity can be removed by the phase unwrapping process [15,16] and the object height h(x,y) is obtained from the unwrapped phase map using [11] (6) (7) (8) (9) (10) (11) (12)
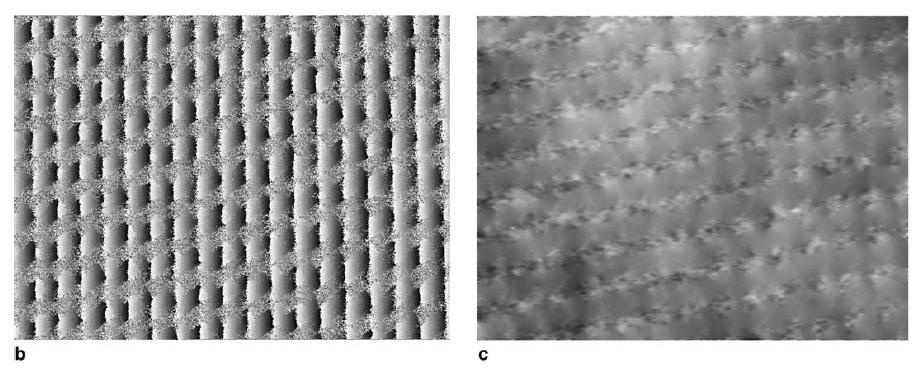
5 where k is an optical coefficient related to the configuration of the system. 3. Experimental work Two test specimens are used in this study. The first specimen consists of a flat plate fabricated with weaved carbon fiber material. Fig. 2 shows an optical edge projection on the specimen. The surface has a very low reflectivity and is highly uneven due to its weaved structure. Numerous valleys can be observed between the fibers. To view these valleys, a powerful white light source is needed. The optical edge is projected by a 150 W DC white light source at a right angle using optical fiber through a set of imaging lenses onto an area of 25 mm x 15 mm. The distorted optical edge is captured by a CCD camera mounted at an angle to the light source. In phase shifting fringe projection, the optical arrangement used is similar to that shown in Fig. 1. The edge projection in this case is replaced with a liquid crystal display (LCD) projector controlled by a computer. The phase shifted fringes are subsequently captured with the CCD camera and phase maps are subsequently obtained. Fig. 3 shows a second specimen indicating the area of interest. Areas A and B have respective dimensions of 3.0 mm x 2.5 mm and 650 µm x 400 µm. A microscopic lens with a long working distance and a large zoom range (Optem Zoom 160) is used to enhance the magnification of observation. 4. Results and discussion Fig. 4 shows the various steps of the proposed image processing method. A border line obtained by the Canny edge detection method together with a reference line are shown in Fig. 5. The height distribution of this line is calculated using the relationship between the projected light and that of the observation. The method works well on dark object but has the shortcoming of requiring a scanning device. The specimen is fixed on a stage drived by a step motor in the measurement system. As the stage is moved, the specimen surface is scanned by the projected optical edge, and a series of line profiles can be obtained. The measurement time for one specimen takes about 1 or 2 min depending on the dimension of the specimen. The final profile of the specimen is calculated by linear interpolation. Fig. 6(a) shows a continuous surface contour of the first specimen and Fig. 6(b) shows a corresponding 3D plot. The structures of the weaven fibers are clearly observed and the shape of fibers with valleys in between fibers is all clearly identified. Normally, the shape of the valley in a black specimen is difficult to measure because of the low reflectivity and large unevenness on the surface. However, in this study, the structured light projected on the surface enabled the image to be separated into two distinct regions. In the dark region, little or no information is obtained. In the bright region, precise details in between fibers can be observed. It is to be noted that certain area
6 in the bright region, especially at the top of the weaven carbon fibers would have intensity above the dynamic range of the camera. This, however, will not significantly affect the results as only the intensity along the optical edge is of concerned. To verify the proposed method, a phase shifting fringe projection method is also applied on the same specimen. Four phase shifted fringe patterns are captured as shown in Fig. 7(a). It is seen that the fringes are discontinuous and certain parts of the patterns are completely dark. Hence, it is not possible to record any useful information in this area. The wrapped and unwrapped phase maps are shown in Fig. 7(b) and (c), respectively. It is obvious from the phase maps that the profile of the specimen cannot be retrieved correctly. To verify the capability of the proposed method for profiling a small object, a small test coin is used. A small area (Fig. 3(a) area A) is measured and the height distribution of area A calculated by the proposed method is shown in Fig. 8(a). The corresponding 3D plot is shown in Fig. 8(b). It is seen that the profile of area A is shown in precise detail with a very high resolution. A smaller area (Fig. 3(b) area B) with less than 100 µm in diameter (the eyeball of the animal) is also studied. It is seen that minute profile variation (Fig. 9) can be observed clearly. The height distribution of area B is shown in Fig. 10(a) and the corresponding 3D plot is shown in Fig. 10(b). It is seen that high quality surface profile with a resolution of 0.7 µm (the real size of one integral pixel) is obtained. The resolution of the technique is dependent on pixel size, it is possible to improve the resolution of the measurement by employing sub-pixels edge extraction approach [17,18]. It is noteworthy that the measurement of a small component requires a long working distance microscopic zoom lens with high magnification and the width of the projected optical edge should be narrow in order to minimize the introduction of errors due to an unfocused edge. In the present experiment, the width of the optical edge projected (w) is less than 10 pixels as shown in Fig. 9. As can be seen the edge contrast is not high. This is mainly due to the out-of-focus of the lens system and light diffraction on the projection edge. The effect of out-of-focus is similar to a convolution of a step function which describes the edge with a Gaussian distribution. The effect of light diffraction at the projection edge would result in a spread of the edge to that of a Sinc function on the object surface since the point spread function of a step function is a Sinc function. The out-of-focus and diffraction effect would result in the smoothening of the optical edge and hence could be utilized in the image processing instead of employing the convolution shown in Eq. (3). The effect of light diffraction is dependent on the optical setup and projection system and hence the diffraction effect is fixed. However, by adjusting the projection image lens, a slight out-of-focus effect on the optical edge can be achieved and the first processing step in the Canny's method can be implemented by optical method. Adjusting the out-of-focus within a suitable range will not introduce any errors while detecting the edges using the Canny's method. It is worth noting that the resolution of the proposed method is lower than that of the phase shifting fringe projection method. In the proposed method, height information is
7 determined by comparing the distortion of a border line with a reference line. The minimal difference between the border line and the reference line is one integral pixel and hence a resolution of one pixel is achievable. It should be noted that the resolution is also dependent on the optical magnification of the observation system. In the first experiment, the actual size of one pixel which determines its resolution after calibration is 35 µm. In the second experiment, the corresponding resolution is 0.7 µm. 5. Concluding remarks This paper presents a novel technique, an optical edge projection, to obtain the profile of a highly low-reflective object. Experiments have been carried out on a specimen fabricated by weaved carbon fibre material, where normal phase shifting fringe projection technique is not suitable. The proposed method can also be applied to 3D shape measurement on a small object with accuracy in the order of microns. The accuracy and resolution of the proposed method is determined by the recording sensor which is one pixel. The resolution, however, can be further improved with the introduction of a sub-pixel edge detection technique. Acknowledgments The authors acknowledge the financial supports provided by the National University of Singapore under Research Project R , and National Science Foundation of China (NSFC) under Contract Number
8 References [1] J.D. Hovanesian, Y.Y. Hung, Appl. Opt. 10 (1971) [2] M. Idesawa, T. Yatagai, Appl. Opt. 16 (1977) [3] C. Quan, P.J. Bryanston-Cross, Opt. Laser Tech. 22 (1990) 255. [4] D.R. Burton, M.J. Lalor, Appl. Opt. 33 (1994) [5] C. Quan, C.J. Tay, H.M. Shang, J. Mat. Proc. Tech (1999) 88. [6] V. Sirnivasan, H.C. Liu, Appl. Opt. 23 (1984) [7] X.Y. Su, W.S. Zhou, Opt. Commun. 94 (1992) 561. [8] H.M. Shang, Y.Y. Hung, Opt. Eng. 139 (2000) 23. [9] P.K. Rastogi, Opt. Laser Eng. 29 (1998) 103. [10] C. Quan, X.Y. He, C.J. Tay, Opt. Commun. 189 (2001) 21. [11] C. Quan, C.J. Tay, X.Y. He, Opt. Laser Tech. 34 (2002) 547. [12] J.F. Canny, IEEE Trans. Pattern Anal. Machine Intell. 8 (1986) 679. [13] H. Liu, K.C. Jezek, Int. J. Remote Sensing 25 (2004) 937. [14] K. Creath, Prog. Opt. 26 (1998) 349. [15] D.C. Ghiglia, L.A. Romero, J. Opt. Soc. Am. A 11 (1994) 107. [16] M. Takeda, H. Ina, S. Kobayashi, J. Opt. Soc. Am. 72 (1) (1982) 156. [17] Y. Shan, G.W. Boon, Image Vision Comput. 18 (2000) [18] K. Jenson, D. Anastassiou, IEEE Tran. Image Proc. 4 (3) (1995) 285.
9 List of Figures Fig. 1 Fig. 2 Fig. 3 Fig. 4 Fig. 5 Fig. 6 Fig. 7 Fig. 8 Fig. 9 Optical edge projection setup. Weaved carbon fiber specimen with an optical edge projection. (a) A coin specimen showing area of interest (area A); (b) Area of interest (area B). Flow chart showing experimental procedure and image processing algorithm. Distorted border line together with a reference plane. (a) Surface profile of specimen; (b) 3D plot of specimen. (a) Phase-shifted fringe patterns on specimen surface; (b) wrapped phase map; (c) unwrapped phase map. (a) Height distribution of area A; (b) corresponding 3D plot. Enlarged optical edge image. Fig. 10 (a) Height distribution of area B; (b) corresponding 3D plot.
10 Fig. 1

11 Fig. 2

12 Fig. 3
13 Fig. 4

14 Fig. 5

15 Fig. 6

16 Fig. 7

17 Fig. 8

18 Fig. 9

19 Fig. 10
Automatic optical measurement of high density fiber connector
 Key Engineering Materials Online: 2014-08-11 ISSN: 1662-9795, Vol. 625, pp 305-309 doi:10.4028/www.scientific.net/kem.625.305 2015 Trans Tech Publications, Switzerland Automatic optical measurement of
Superfast phase-shifting method for 3-D shape measurement
 Superfast phase-shifting method for 3-D shape measurement Song Zhang 1,, Daniel Van Der Weide 2, and James Oliver 1 1 Department of Mechanical Engineering, Iowa State University, Ames, IA 50011, USA 2
This document is downloaded from DR-NTU, Nanyang Technological University Library, Singapore.
 This document is downloaded from DR-NTU, Nanyang Technological University Library, Singapore. Title Some new developments in optical dynamic testing Author(s) Fu, Yu; Phua, Poh Boon Citation Fu, Y., &
Three-dimensional quantitative phase measurement by Commonpath Digital Holographic Microscopy
 Available online at www.sciencedirect.com Physics Procedia 19 (2011) 291 295 International Conference on Optics in Precision Engineering and Nanotechnology Three-dimensional quantitative phase measurement
Multi-frequency and multiple phase-shift sinusoidal fringe projection for 3D profilometry
 Multi-frequency and multiple phase-shift sinusoidal fringe projection for 3D profilometry E. B. Li College of Precision Instrument and Optoelectronics Engineering, Tianjin Universit Tianjin 30007, P. R.
In-line digital holographic interferometry
 In-line digital holographic interferometry Giancarlo Pedrini, Philipp Fröning, Henrik Fessler, and Hans J. Tiziani An optical system based on in-line digital holography for the evaluation of deformations
Pixel-by-pixel absolute three-dimensional shape measurement with modified Fourier transform profilometry
 1472 Vol. 56, No. 5 / February 10 2017 / Applied Optics Research Article Pixel-by-pixel absolute three-dimensional shape measurement with modified Fourier transform profilometry HUITAEK YUN, BEIWEN LI,
Simultaneous geometry and color texture acquisition using a single-chip color camera
 Simultaneous geometry and color texture acquisition using a single-chip color camera Song Zhang *a and Shing-Tung Yau b a Department of Mechanical Engineering, Iowa State University, Ames, IA, USA 50011;
PhD Thesis. Balázs Gombköt. New possibilities of comparative displacement measurement in coherent optical metrology
 PhD Thesis Balázs Gombköt New possibilities of comparative displacement measurement in coherent optical metrology Consultant: Dr. Zoltán Füzessy Professor emeritus Consultant: János Kornis Lecturer BUTE
Elemental Image Generation Method with the Correction of Mismatch Error by Sub-pixel Sampling between Lens and Pixel in Integral Imaging
 Journal of the Optical Society of Korea Vol. 16, No. 1, March 2012, pp. 29-35 DOI: http://dx.doi.org/10.3807/josk.2012.16.1.029 Elemental Image Generation Method with the Correction of Mismatch Error by
Ultrafast 3-D shape measurement with an off-theshelf DLP projector
 Mechanical Engineering Publications Mechanical Engineering 9-13-21 Ultrafast 3-D shape measurement with an off-theshelf DLP projector Yuanzheng Gong Iowa State University Song Zhang Iowa State University,
Method for out-of-focus camera calibration
 2346 Vol. 55, No. 9 / March 20 2016 / Applied Optics Research Article Method for out-of-focus camera calibration TYLER BELL, 1 JING XU, 2 AND SONG ZHANG 1, * 1 School of Mechanical Engineering, Purdue
of surface microstructure
 Invited Paper Computerized interferometric measurement of surface microstructure James C. Wyant WYKO Corporation, 2650 E. Elvira Road Tucson, Arizona 85706, U.S.A. & Optical Sciences Center University
Exercise questions for Machine vision
 Exercise questions for Machine vision This is a collection of exercise questions. These questions are all examination alike which means that similar questions may appear at the written exam. I ve divided
University of Huddersfield Repository
 University of Huddersfield Repository Gao, F., Muhamedsalih, Hussam and Jiang, Xiang In process fast surface measurement using wavelength scanning interferometry Original Citation Gao, F., Muhamedsalih,
Image Measurement of Roller Chain Board Based on CCD Qingmin Liu 1,a, Zhikui Liu 1,b, Qionghong Lei 2,c and Kui Zhang 1,d
 Applied Mechanics and Materials Online: 2010-11-11 ISSN: 1662-7482, Vols. 37-38, pp 513-516 doi:10.4028/www.scientific.net/amm.37-38.513 2010 Trans Tech Publications, Switzerland Image Measurement of Roller
Dynamic Phase-Shifting Electronic Speckle Pattern Interferometer
 Dynamic Phase-Shifting Electronic Speckle Pattern Interferometer Michael North Morris, James Millerd, Neal Brock, John Hayes and *Babak Saif 4D Technology Corporation, 3280 E. Hemisphere Loop Suite 146,
Large Field of View, High Spatial Resolution, Surface Measurements
 Large Field of View, High Spatial Resolution, Surface Measurements James C. Wyant and Joanna Schmit WYKO Corporation, 2650 E. Elvira Road Tucson, Arizona 85706, USA jcwyant@wyko.com and jschmit@wyko.com
Image Filtering. Median Filtering
 Image Filtering Image filtering is used to: Remove noise Sharpen contrast Highlight contours Detect edges Other uses? Image filters can be classified as linear or nonlinear. Linear filters are also know
Study of self-interference incoherent digital holography for the application of retinal imaging
 Study of self-interference incoherent digital holography for the application of retinal imaging Jisoo Hong and Myung K. Kim Department of Physics, University of South Florida, Tampa, FL, US 33620 ABSTRACT
SUPRA Optix 3D Optical Profiler
 SUPRA Optix 3D Optical Profiler Scanning White-light Interferometric Microscope SWIM Series Applications The SUPRA Optix is the latest development in the field of Scanning White-light Interferometry. With
DetectionofMicrostrctureofRoughnessbyOpticalMethod
 Global Journal of Researches in Engineering Chemical Engineering Volume 1 Issue Version 1.0 Year 01 Type: Double Blind Peer Reviewed International Research Journal Publisher: Global Journals Inc. (USA)
Development of a new multi-wavelength confocal surface profilometer for in-situ automatic optical inspection (AOI)
") Development of a new multi-wavelength confocal surface profilometer for in-situ automatic optical inspection (AOI) Liang-Chia Chen 1#, Chao-Nan Chen 1 and Yi-Wei Chang 1 1. Institute of Automation Technology,
Development of a new multi-wavelength confocal surface profilometer for in-situ automatic optical inspection (AOI) Liang-Chia Chen 1#, Chao-Nan Chen 1 and Yi-Wei Chang 1 1. Institute of Automation Technology,
Solution Set #2
 05-78-0 Solution Set #. For the sampling function shown, analyze to determine its characteristics, e.g., the associated Nyquist sampling frequency (if any), whether a function sampled with s [x; x] may
A 3D Profile Parallel Detecting System Based on Differential Confocal Microscopy. Y.H. Wang, X.F. Yu and Y.T. Fei
 Key Engineering Materials Online: 005-10-15 ISSN: 166-9795, Vols. 95-96, pp 501-506 doi:10.408/www.scientific.net/kem.95-96.501 005 Trans Tech Publications, Switzerland A 3D Profile Parallel Detecting
Department of Mechanical Engineering and Automation, Harbin Institute of Technology Shenzhen Graduate School, Shenzhen, , China
 6th International Conference on Machinery, Materials, Environment, Biotechnology and Computer (MMEBC 16) Precision Measurement of Displacement with Two Quasi-Orthogonal Signals for Linear Diffraction Grating
1. INTRODUCTION ABSTRACT
 Experimental verification of Sub-Wavelength Holographic Lithography physical concept for single exposure fabrication of complex structures on planar and non-planar surfaces Michael V. Borisov, Dmitry A.
Automatic inspection system for measurement of lens field curvature by means of computer vision
 Indian Journal of Pure & Applied Physics Vol. 47, October 2009, pp. 708-714 Automatic inspection system for measurement of lens field curvature by means of computer vision Chern-Sheng Lin 1, Jung-Ming
Automated measurement of cylinder volume by vision
 Automated measurement of cylinder volume by vision G. Deltel, C. Gagné, A. Lemieux, M. Levert, X. Liu, L. Najjar, X. Maldague Electrical and Computing Engineering Dept (Computing Vision and Systems Laboratory
Manufacturing Metrology Team
 The Team has a range of state-of-the-art equipment for the measurement of surface texture and form. We are happy to discuss potential measurement issues and collaborative research Manufacturing Metrology
Development of innovative fringe locking strategies for vibration-resistant white light vertical scanning interferometry (VSI)
") Development of innovative fringe locking strategies for vibration-resistant white light vertical scanning interferometry (VSI) Liang-Chia Chen 1), Abraham Mario Tapilouw 1), Sheng-Lih Yeh 2), Shih-Tsong
Development of innovative fringe locking strategies for vibration-resistant white light vertical scanning interferometry (VSI) Liang-Chia Chen 1), Abraham Mario Tapilouw 1), Sheng-Lih Yeh 2), Shih-Tsong
Measurement of channel depth by using a general microscope based on depth of focus
 Eurasian Journal of Analytical Chemistry Volume, Number 1, 007 Measurement of channel depth by using a general microscope based on depth of focus Jiangjiang Liu a, Chao Tian b, Zhihua Wang c and Jin-Ming
Diffractive optical elements for high gain lasers with arbitrary output beam profiles
 Diffractive optical elements for high gain lasers with arbitrary output beam profiles Adam J. Caley, Martin J. Thomson 2, Jinsong Liu, Andrew J. Waddie and Mohammad R. Taghizadeh. Heriot-Watt University,
New Phase Shifting Algorithms Insensitive to Linear Phase Shift Errors J. Novák
 New Phase Shifting Algorithms Insensitive to Linear Phase Shift Errors J. Novák This article describes and analyses multistep algorithms for evaluating of the wave field phase in interferometric measurements
On spatial resolution
 On spatial resolution Introduction How is spatial resolution defined? There are two main approaches in defining local spatial resolution. One method follows distinction criteria of pointlike objects (i.e.
Contouring aspheric surfaces using two-wavelength phase-shifting interferometry
 OPTICA ACTA, 1985, VOL. 32, NO. 12, 1455-1464 Contouring aspheric surfaces using two-wavelength phase-shifting interferometry KATHERINE CREATH, YEOU-YEN CHENG and JAMES C. WYANT University of Arizona,
Confocal Imaging Through Scattering Media with a Volume Holographic Filter
 Confocal Imaging Through Scattering Media with a Volume Holographic Filter Michal Balberg +, George Barbastathis*, Sergio Fantini % and David J. Brady University of Illinois at Urbana-Champaign, Urbana,
Be aware that there is no universal notation for the various quantities.
 Fourier Optics v2.4 Ray tracing is limited in its ability to describe optics because it ignores the wave properties of light. Diffraction is needed to explain image spatial resolution and contrast and
Bringing Answers to the Surface
 3D Bringing Answers to the Surface 1 Expanding the Boundaries of Laser Microscopy Measurements and images you can count on. Every time. LEXT OLS4100 Widely used in quality control, research, and development
OPTIV CLASSIC 321 GL TECHNICAL DATA
 OPTIV CLASSIC 321 GL TECHNICAL DATA TECHNICAL DATA Product description The Optiv Classic 321 GL offers an innovative design for non-contact measurement. The benchtop video-based measuring machine is equipped
Digital Photographic Imaging Using MOEMS
 Digital Photographic Imaging Using MOEMS Vasileios T. Nasis a, R. Andrew Hicks b and Timothy P. Kurzweg a a Department of Electrical and Computer Engineering, Drexel University, Philadelphia, USA b Department
ILLUMINATION AND IMAGE PROCESSING FOR REAL-TIME CONTROL OF DIRECTED ENERGY DEPOSITION ADDITIVE MANUFACTURING
 Solid Freeform Fabrication 2016: Proceedings of the 26th 27th Annual International Solid Freeform Fabrication Symposium An Additive Manufacturing Conference ILLUMINATION AND IMAGE PROCESSING FOR REAL-TIME
Noise Tolerance of Improved Max-min Scanning Method for Phase Determination
 Noise Tolerance of Improved Max-min Scanning Method for Phase Determination Xu Ding Research Assistant Mechanical Engineering Dept., Michigan State University, East Lansing, MI, 48824, USA Gary L. Cloud,
Effect of Ink Spread and Opitcal Dot Gain on the MTF of Ink Jet Image C. Koopipat, N. Tsumura, M. Fujino*, and Y. Miyake
 Effect of Ink Spread and Opitcal Dot Gain on the MTF of Ink Jet Image C. Koopipat, N. Tsumura, M. Fujino*, and Y. Miyake Graduate School of Science and Technology, Chiba University 1-33 Yayoi-cho, Inage-ku,
COTTON FIBER QUALITY MEASUREMENT USING FRAUNHOFER DIFFRACTION
 COTTON FIBER QUALITY MEASUREMENT USING FRAUNHOFER DIFFRACTION Ayodeji Adedoyin, Changying Li Department of Biological and Agricultural Engineering, University of Georgia, Tifton, GA Abstract Properties
7 CHAPTER 7: REFRACTIVE INDEX MEASUREMENTS WITH COMMON PATH PHASE SENSITIVE FDOCT SETUP
 7 CHAPTER 7: REFRACTIVE INDEX MEASUREMENTS WITH COMMON PATH PHASE SENSITIVE FDOCT SETUP Abstract: In this chapter we describe the use of a common path phase sensitive FDOCT set up. The phase measurements
A moment-preserving approach for depth from defocus
 A moment-preserving approach for depth from defocus D. M. Tsai and C. T. Lin Machine Vision Lab. Department of Industrial Engineering and Management Yuan-Ze University, Chung-Li, Taiwan, R.O.C. E-mail:
Rotation/ scale invariant hybrid digital/optical correlator system for automatic target recognition
 Rotation/ scale invariant hybrid digital/optical correlator system for automatic target recognition V. K. Beri, Amit Aran, Shilpi Goyal, and A. K. Gupta * Photonics Division Instruments Research and Development
Fiber-optic Michelson Interferometer Sensor Fabricated by Femtosecond Lasers
 Sensors & ransducers 2013 by IFSA http://www.sensorsportal.com Fiber-optic Michelson Interferometer Sensor Fabricated by Femtosecond Lasers Dong LIU, Ying XIE, Gui XIN, Zheng-Ying LI School of Information
Digital Image Processing
 Digital Image Processing Part 2: Image Enhancement Digital Image Processing Course Introduction in the Spatial Domain Lecture AASS Learning Systems Lab, Teknik Room T26 achim.lilienthal@tech.oru.se Course
ULTRASOUND IN CFRP DETECTED BY ADVANCED OPTICAL FIBER SENSOR FOR COMPOSITE STRUCTURAL HEALTH MONITORING
 21 st International Conference on Composite Materials Xi an, 20-25 th August 2017 ULTRASOUND IN CFRP DETECTED BY ADVANCED OPTICAL FIBER SENSOR FOR COMPOSITE STRUCTURAL HEALTH MONITORING Qi Wu 1, 2, Yoji
Coherence radar - new modifications of white-light interferometry for large object shape acquisition
 Coherence radar - new modifications of white-light interferometry for large object shape acquisition G. Ammon, P. Andretzky, S. Blossey, G. Bohn, P.Ettl, H. P. Habermeier, B. Harand, G. Häusler Chair for
Bioimage Informatics
 Bioimage Informatics Lecture 5, Spring 01 Fundamentals of Fluorescence Microscopy (II) Bioimage Data Analysis (I): Basic Operations Lecture 5 January 5, 01 1 Outline Performance metrics of a microscope
Bias errors in PIV: the pixel locking effect revisited.
 Bias errors in PIV: the pixel locking effect revisited. E.F.J. Overmars 1, N.G.W. Warncke, C. Poelma and J. Westerweel 1: Laboratory for Aero & Hydrodynamics, University of Technology, Delft, The Netherlands,
BEAM HALO OBSERVATION BY CORONAGRAPH
 BEAM HALO OBSERVATION BY CORONAGRAPH T. Mitsuhashi, KEK, TSUKUBA, Japan Abstract We have developed a coronagraph for the observation of the beam halo surrounding a beam. An opaque disk is set in the beam
Image analysis. CS/CME/BIOPHYS/BMI 279 Fall 2015 Ron Dror
 Image analysis CS/CME/BIOPHYS/BMI 279 Fall 2015 Ron Dror A two- dimensional image can be described as a function of two variables f(x,y). For a grayscale image, the value of f(x,y) specifies the brightness
Advanced 3D Optical Profiler using Grasshopper3 USB3 Vision camera
 Advanced 3D Optical Profiler using Grasshopper3 USB3 Vision camera Figure 1. The Zeta-20 uses the Grasshopper3 and produces true color 3D optical images with multi mode optics technology 3D optical profiling
Wavefront sensing by an aperiodic diffractive microlens array
 Wavefront sensing by an aperiodic diffractive microlens array Lars Seifert a, Thomas Ruppel, Tobias Haist, and Wolfgang Osten a Institut für Technische Optik, Universität Stuttgart, Pfaffenwaldring 9,
Dynamic Phase-Shifting Microscopy Tracks Living Cells
 from photonics.com: 04/01/2012 http://www.photonics.com/article.aspx?aid=50654 Dynamic Phase-Shifting Microscopy Tracks Living Cells Dr. Katherine Creath, Goldie Goldstein and Mike Zecchino, 4D Technology
Opto Engineering S.r.l.
 TUTORIAL #1 Telecentric Lenses: basic information and working principles On line dimensional control is one of the most challenging and difficult applications of vision systems. On the other hand, besides
Optical RI sensor based on an in-fiber Bragg grating. Fabry-Perot cavity embedded with a micro-channel
 Optical RI sensor based on an in-fiber Bragg grating Fabry-Perot cavity embedded with a micro-channel Zhijun Yan *, Pouneh Saffari, Kaiming Zhou, Adedotun Adebay, Lin Zhang Photonic Research Group, Aston
Fourier Transformation Hologram Experiment using Liquid Crystal Display. Kenji MISUMI, Yoshikiyo KASHII, Mikio MIMURA (Received September 30, 1999)
") Mem. Fac. Eng., Osaka City Univ., Vol. 40, pp. 85-91 (1999) Fourier Transformation Hologram Experiment using Liquid Crystal Display Kenji MISUMI, Yoshikiyo KASHII, Mikio MIMURA (Received September 30,
Mem. Fac. Eng., Osaka City Univ., Vol. 40, pp. 85-91 (1999) Fourier Transformation Hologram Experiment using Liquid Crystal Display Kenji MISUMI, Yoshikiyo KASHII, Mikio MIMURA (Received September 30,
X-ray mirror metrology using SCOTS/deflectometry Run Huang a, Peng Su a*, James H. Burge a and Mourad Idir b
 X-ray mirror metrology using SCOTS/deflectometry Run Huang a, Peng Su a*, James H. Burge a and Mourad Idir b a College of Optical Sciences, the University of Arizona, Tucson, AZ 85721, U.S.A. b Brookhaven
Implementation of Adaptive Coded Aperture Imaging using a Digital Micro-Mirror Device for Defocus Deblurring
 Implementation of Adaptive Coded Aperture Imaging using a Digital Micro-Mirror Device for Defocus Deblurring Ashill Chiranjan and Bernardt Duvenhage Defence, Peace, Safety and Security Council for Scientific
A novel tunable diode laser using volume holographic gratings
 A novel tunable diode laser using volume holographic gratings Christophe Moser *, Lawrence Ho and Frank Havermeyer Ondax, Inc. 85 E. Duarte Road, Monrovia, CA 9116, USA ABSTRACT We have developed a self-aligned
Table of contents. Vision industrielle 2002/2003. Local and semi-local smoothing. Linear noise filtering: example. Convolution: introduction
 Table of contents Vision industrielle 2002/2003 Session - Image Processing Département Génie Productique INSA de Lyon Christian Wolf wolf@rfv.insa-lyon.fr Introduction Motivation, human vision, history,
Supplementary Figure 1. GO thin film thickness characterization. The thickness of the prepared GO thin
 Supplementary Figure 1. GO thin film thickness characterization. The thickness of the prepared GO thin film is characterized by using an optical profiler (Bruker ContourGT InMotion). Inset: 3D optical
Surface Defect Detection for Some Ghanaian Textile Fabrics using Moire Interferometry
 Research Journal of Applied Sciences, Engineering and Technology (3): 39-353, 23 ISSN: 2-59; e-issn: 2- Maxwell Scientific Organization, Submitted: February, Accepted: March, Published: June 5, 23 Surface
A Novel Algorithm for Hand Vein Recognition Based on Wavelet Decomposition and Mean Absolute Deviation
 Sensors & Transducers, Vol. 6, Issue 2, December 203, pp. 53-58 Sensors & Transducers 203 by IFSA http://www.sensorsportal.com A Novel Algorithm for Hand Vein Recognition Based on Wavelet Decomposition
NANO 703-Notes. Chapter 9-The Instrument
 1 Chapter 9-The Instrument Illumination (condenser) system Before (above) the sample, the purpose of electron lenses is to form the beam/probe that will illuminate the sample. Our electron source is macroscopic
Comparison of resolution specifications for micro- and nanometer measurement techniques
 P4.5 Comparison of resolution specifications for micro- and nanometer measurement techniques Weckenmann/Albert, Tan/Özgür, Shaw/Laura, Zschiegner/Nils Chair Quality Management and Manufacturing Metrology
Lecture Notes 10 Image Sensor Optics. Imaging optics. Pixel optics. Microlens
 Lecture Notes 10 Image Sensor Optics Imaging optics Space-invariant model Space-varying model Pixel optics Transmission Vignetting Microlens EE 392B: Image Sensor Optics 10-1 Image Sensor Optics Microlens
STEM Spectrum Imaging Tutorial
 STEM Spectrum Imaging Tutorial Gatan, Inc. 5933 Coronado Lane, Pleasanton, CA 94588 Tel: (925) 463-0200 Fax: (925) 463-0204 April 2001 Contents 1 Introduction 1.1 What is Spectrum Imaging? 2 Hardware 3
FPGA Based Area Measurement of Irregular Objects
 FPGA Based Area Measurement of Irregular Objects Mohammed Sadique K. Sheikh 1, Rupali Patil 2 PG Student [VLSI and Embedded], Dept. of ETC, G.H. Raisoni College of Engineering and Management, Pune, Maharashtra,
Aberrations and adaptive optics for biomedical microscopes
 Aberrations and adaptive optics for biomedical microscopes Martin Booth Department of Engineering Science And Centre for Neural Circuits and Behaviour University of Oxford Outline Rays, wave fronts and
Physics 3340 Spring Fourier Optics
 Physics 3340 Spring 011 Purpose Fourier Optics In this experiment we will show how the Fraunhofer diffraction pattern or spatial Fourier transform of an object can be observed within an optical system.
Coded Aperture for Projector and Camera for Robust 3D measurement
 Coded Aperture for Projector and Camera for Robust 3D measurement Yuuki Horita Yuuki Matugano Hiroki Morinaga Hiroshi Kawasaki Satoshi Ono Makoto Kimura Yasuo Takane Abstract General active 3D measurement
Spatial-Phase-Shift Imaging Interferometry Using Spectrally Modulated White Light Source
 Spatial-Phase-Shift Imaging Interferometry Using Spectrally Modulated White Light Source Shlomi Epshtein, 1 Alon Harris, 2 Igor Yaacobovitz, 1 Garrett Locketz, 3 Yitzhak Yitzhaky, 4 Yoel Arieli, 5* 1AdOM
Technical Explanation for Displacement Sensors and Measurement Sensors
 Technical Explanation for Sensors and Measurement Sensors CSM_e_LineWidth_TG_E_2_1 Introduction What Is a Sensor? A Sensor is a device that measures the distance between the sensor and an object by detecting
Measurement of the Modulation Transfer Function (MTF) of a camera lens. Laboratoire d Enseignement Expérimental (LEnsE)
 of a camera lens. Laboratoire d Enseignement Expérimental (LEnsE)") Measurement of the Modulation Transfer Function (MTF) of a camera lens Aline Vernier, Baptiste Perrin, Thierry Avignon, Jean Augereau, Lionel Jacubowiez Institut d Optique Graduate School Laboratoire d
Measurement of the Modulation Transfer Function (MTF) of a camera lens Aline Vernier, Baptiste Perrin, Thierry Avignon, Jean Augereau, Lionel Jacubowiez Institut d Optique Graduate School Laboratoire d
R I T. Title: Wyko RST Plus. Semiconductor & Microsystems Fabrication Laboratory Revision: A Rev Date: 05/23/06 1 SCOPE 2 REFERENCE DOCUMENTS
 Approved by: Process Engineer / / / / Equipment Engineer 1 SCOPE The purpose of this document is to detail the use of the Wyko RST Plus. All users are expected to have read and understood this document.
Parallel Mode Confocal System for Wafer Bump Inspection
 Parallel Mode Confocal System for Wafer Bump Inspection ECEN5616 Class Project 1 Gao Wenliang wen-liang_gao@agilent.com 1. Introduction In this paper, A parallel-mode High-speed Line-scanning confocal
In-line measurements of rolling stock macro-geometry
 Optical measuring systems for plate mills Advances in camera technology have enabled a significant enhancement of dimensional measurements in plate mills. Slabs and as-rolled and cut-to-size plates can
Supplementary Figure 1. Effect of the spacer thickness on the resonance properties of the gold and silver metasurface layers.
 Supplementary Figure 1. Effect of the spacer thickness on the resonance properties of the gold and silver metasurface layers. Finite-difference time-domain calculations of the optical transmittance through
Analysis of phase sensitivity for binary computer-generated holograms
 Analysis of phase sensitivity for binary computer-generated holograms Yu-Chun Chang, Ping Zhou, and James H. Burge A binary diffraction model is introduced to study the sensitivity of the wavefront phase
Design of a digital holographic interferometer for the. ZaP Flow Z-Pinch
 Design of a digital holographic interferometer for the M. P. Ross, U. Shumlak, R. P. Golingo, B. A. Nelson, S. D. Knecht, M. C. Hughes, R. J. Oberto University of Washington, Seattle, USA Abstract The
648. Measurement of trajectories of piezoelectric actuators with laser Doppler vibrometer
 648. Measurement of trajectories of piezoelectric actuators with laser Doppler vibrometer V. Grigaliūnas, G. Balčiūnas, A.Vilkauskas Kaunas University of Technology, Kaunas, Lithuania E-mail: valdas.grigaliunas@ktu.lt
Examination, TEN1, in courses SK2500/SK2501, Physics of Biomedical Microscopy,
 KTH Applied Physics Examination, TEN1, in courses SK2500/SK2501, Physics of Biomedical Microscopy, 2009-06-05, 8-13, FB51 Allowed aids: Compendium Imaging Physics (handed out) Compendium Light Microscopy
Compressive Through-focus Imaging
 PIERS ONLINE, VOL. 6, NO. 8, 788 Compressive Through-focus Imaging Oren Mangoubi and Edwin A. Marengo Yale University, USA Northeastern University, USA Abstract Optical sensing and imaging applications
Spectral Analysis of the LUND/DMI Earthshine Telescope and Filters
 Spectral Analysis of the LUND/DMI Earthshine Telescope and Filters 12 August 2011-08-12 Ahmad Darudi & Rodrigo Badínez A1 1. Spectral Analysis of the telescope and Filters This section reports the characterization
TECHNICAL DATA. OPTIV CLASSIC 322 Version 3/2013
 TECHNICAL DATA OPTIV CLASSIC 322 Version 3/2013 Technical Data Product description The Optiv Classic 322 combines optical and tactile measurement in one system (optional touchtrigger probe). The system
Testing Aspherics Using Two-Wavelength Holography
 Reprinted from APPLIED OPTICS. Vol. 10, page 2113, September 1971 Copyright 1971 by the Optical Society of America and reprinted by permission of the copyright owner Testing Aspherics Using Two-Wavelength
Improving Measurement Accuracy of Position Sensitive Detector (PSD) for a New Scanning PSD Microscopy System
 for a New Scanning PSD Microscopy System") Proceedings of the 2014 IEEE International Conference on Robotics and Biomimetics December 5-10, 2014, Bali, Indonesia Improving Measurement Accuracy of Position Sensitive Detector (PSD) for a New Scanning
Proceedings of the 2014 IEEE International Conference on Robotics and Biomimetics December 5-10, 2014, Bali, Indonesia Improving Measurement Accuracy of Position Sensitive Detector (PSD) for a New Scanning
REAL TIME SURFACE DEFORMATIONS MONITORING DURING LASER PROCESSING
 The 8 th International Conference of the Slovenian Society for Non-Destructive Testing»Application of Contemporary Non-Destructive Testing in Engineering«September 1-3, 2005, Portorož, Slovenia, pp. 335-339
Improvement of Accuracy in Remote Gaze Detection for User Wearing Eyeglasses Using Relative Position Between Centers of Pupil and Corneal Sphere
 Improvement of Accuracy in Remote Gaze Detection for User Wearing Eyeglasses Using Relative Position Between Centers of Pupil and Corneal Sphere Kiyotaka Fukumoto (&), Takumi Tsuzuki, and Yoshinobu Ebisawa
ADAPTIVE CORRECTION FOR ACOUSTIC IMAGING IN DIFFICULT MATERIALS
 ADAPTIVE CORRECTION FOR ACOUSTIC IMAGING IN DIFFICULT MATERIALS I. J. Collison, S. D. Sharples, M. Clark and M. G. Somekh Applied Optics, Electrical and Electronic Engineering, University of Nottingham,
ABSTRACT. Keywords: Computer-aided alignment, Misalignments, Zernike polynomials, Sensitivity matrix 1. INTRODUCTION
 Computer-Aided Alignment for High Precision Lens LI Lian, FU XinGuo, MA TianMeng, WANG Bin The institute of optical and electronics, the Chinese Academy of Science, Chengdu 6129, China ABSTRACT Computer-Aided
Parallel Digital Holography Three-Dimensional Image Measurement Technique for Moving Cells
 F e a t u r e A r t i c l e Feature Article Parallel Digital Holography Three-Dimensional Image Measurement Technique for Moving Cells Yasuhiro Awatsuji The author invented and developed a technique capable
arxiv:physics/ v1 [physics.optics] 12 May 2006
![arxiv:physics/ v1 [physics.optics] 12 May 2006](/thumbs/73/69394094.jpg "arxiv:physics/ v1 [physics.optics] 12 May 2006") Quantitative and Qualitative Study of Gaussian Beam Visualization Techniques J. Magnes, D. Odera, J. Hartke, M. Fountain, L. Florence, and V. Davis Department of Physics, U.S. Military Academy, West Point,
Quantitative and Qualitative Study of Gaussian Beam Visualization Techniques J. Magnes, D. Odera, J. Hartke, M. Fountain, L. Florence, and V. Davis Department of Physics, U.S. Military Academy, West Point,
REAL TIME THICKNESS MEASUREMENT OF A MOVING WIRE
 REAL TIME THICKNESS MEASUREMENT OF A MOVING WIRE Bini Babu 1, Dr. Ashok Kumar T 2 1 Optoelectronics and communication systems, 2 Associate Professor Model Engineering college, Thrikkakara, Ernakulam, (India)