Modeling of Tensile Properties of Woven Fabrics and Auxetic Braided Structures by Multi-Scale Finite Element Method. Yang Shen
|
|
|
- Clement Perry
- 6 years ago
- Views:
Transcription
1 Modeling of Tensile Properties of Woven Fabrics and Auxetic Braided Structures by Multi-Scale Finite Element Method by Yang Shen A thesis submitted to the Graduate Faculty of Auburn University in partial fulfillment of the requirements for the Degree of Master of Science Auburn, Alabama December 14, 2013 Keywords: multi-scale mechanical model, finite element method, woven fabric, helical auxetic yarn, biaxial tubular structure, analysis of mechanical property Copyright 2013 by Yang Shen Approved by Sabit Adanur, Chair, Professor of Polymer and Fiber Engineering Amnon Meir, Professor of Mathematics and Statistics Yanzhao Cao, Professor of Mathematics and Statistics Xinyu Zhang, Associate Professor of Polymer and Fiber Engineering
2 Abstract This study is undertaken to build an appropriate mechanical model for the analysis of mechanical properties of forming fabrics by incorporation of multi-scale modeling concept comprising micro-mechanical model, meso-mechanical model and macro-mechanical model. The fabric is analyzed at three different scales: yarn, unit cell and fabric sheet. The micro-mechanical model is to obtain the overall properties of yarn structure. The meso-mechanical model concentrates on the mechanical analysis of the unit cell of the fabric with the periodic boundary conditions by inputting yarns properties from the micro-mechanical model. The macro-mechanical model is to get the overall properties of desired fabric structure by extracting the results from meso-mechanical model. In the first part, six single-layer woven fabric samples, five two-layer fabric samples are analyzed. In the second part, a tubular braiding fabric structure made of helical auxetic yarns is manufactured and its properties are investigated by a similar multi-scale model. The models for both parts are validated by the comparison of simulation data and experimental data, which had good agreement. Detailed stress-strain field throughout the entire unit cell is determined, which can be further used in the analysis of fatigue and fracture properties. ii
3 Acknowledgments I would like to give my great gratitude to my academic advisor, Dr Sabit Adanur, for his excellent guidance of research as well as courses during my entire academic studies at Auburn. I also would like to thank Dr Ramsis Farag for his help with the test experiments in the lab. My thanks go to Dr. Amnon J. Meir and Dr. Yanzhao Cao from the Department of Mathematics and Statistics for their advice in research. The financial support from Auburn University Intramural Grants Program is appreciated. I also would like to appreciate my friends and colleagues at Auburn for their kind help and support at Auburn. Special appreciations go to Song Chen because of his help of finite element method in the research. Finally, I dedicated this thesis to my loving wife Zi Yan for taking care of me in life and her unconditional love for me. iii
4 Table of Contents Abstract... ii Acknowledgments... iii List of Tables... vii List of Figures... viii Chapter 1 Introduction... 1 Chapter 2 Mechanical Model of Fabric Structure Literature Review Fibrous Structure and Mechanical Behavior Large Deflection and Nonlinearity Deformation in Textile Structure Background Classification of Mechanical Models of Fibrous Structures Analytical Modeling Micro-Mechanical Model by Analytical Method Meso-Mechanical Model by Analytical Method Macro-Mechanical Model by Analytical Method Numerical Modeling Micro-Mechanical Model by Numerical Method iv
5 Meso-Mechanical Model by Numerical Method Macro-Mechanical Model by Numerical Method Evaluation Experimental Material Preparation Geometry of Unit Cell Measurement of Geometry Mechanical Property Tests Friction Coefficient Tests Modeling Approach Micro-Mechanical Modeling Meso-Mechanical Modeling D Solid Modeling of Unit Cell Geometry Material Property Definition Meshing Contact Definition Periodic Boundary Conditions Derivation of Periodic Boundary Conditions Implementation of Boundary Conditions Macro-Mechanical Modeling Results and Analysis Conclusions v
6 Chapter 3 Mechanical Analysis of Auextic Behavior of a Novel Braiding Tubular Structure by FEM Literature Review Material Preparation Approach Analysis of the Properties by FEM Micro-Mechanical Model Meso-Mechanical Model Results and Discussion Conclusions References vi
7 List of Tables Table 1 Geometric properties of six single-layer fabric samples Table 2 Spacing for five two-layer fabric samples Table 3 Major and minor radius for two-layer fabrics Table 4 Mechanical properties of yarns for single-layer fabrics Table 5 Mechanical properties of yarns for two-layer fabrics Table 6 Friction coefficients of single-layer fabrics Table 7 Friction coefficients of two-layer fabrics Table 8 Mesh statistics Table 9 Mechanical properties of wrap and core yarns as component of the helical auxetic yarn Table 10 Geometric parameters for the auxetic yarn Table 11 Geometry of the biaxial tubular structure vii
8 List of Figures Figure 1 Integrated model of micro, meso and macro mechanical model... 9 Figure 2 Geometric model of plain woven fabric by Peirce Figure 3 3D geometric model of plain woven unit cell by Peirce Figure 4 3D representation of wove model proposed by Kemp Figure 5 3D representation of elliptic model proposed by Olofsson Figure 6 Beam model of filaments for loose structure Figure 7 Beam FE model of 50-filament twisted yarn Figure 8 Solid FE model of unit cell of twill (left) and satin (right) woven structure Figure 9 Cross section of a typical two-layer woven fabric structure with unit cell of 8 columns of weft yarns Figure 10 Geometry of single-layer fabrics in top view (left), right view (middle) and left view (right) Figure 11 Geometry of two-layer fabrics in top view (left), right view (middle) and left view (right) Figure 12 Peirce s model of simple woven fabric structure Figure 13 Illustration for measurement of centerline of warp yarn for two-layer fabric Figure 14 Universal mechanical testing machine with a camera device Figure 15 Stress strain curves for yarns in six single-layer fabric samples Figure 16 Schematic of the friction coefficient testing device Figure 17 Schematic of lenticular cross sections Figure 18 3D solid model of unit cell of all fabric samples viii
9 Figure 19 Schematic of the meshing of cross section by triangles and rectangles Figure 20 Coarse mesh of unit cell of single-layer fabric sample Figure 21 Medium mesh of unit cell of single-layer fabric sample Figure 22 Fine mesh of unit cell of single-layer fabric sample Figure 23 A contact pair Figure 24 Periodicity of boundary of a yarn Figure 25 Displacement constraints on the edge Figure 26 Periodic boundary conditions on the single-layer fabric sample Figure 27 The contour of stress distribution throughout the unit cell of single-layer fabric sample 1 in undeformed state (top) and 10% deformed state (bottom) in the warp direction Figure 28 The contour of stress distribution throughout the unit cell of single-layer fabric 2 in undeformed state (top) and 10% deformed state (bottom) in the warp direction Figure 29 The contour of stress distribution throughout the unit cell of single-layer fabric 3 in undeformed state (top) and 10% deformed state (bottom) in the warp direction Figure 30 The contour of stress distribution throughout the unit cell of single-layer fabric 4 in undeformed state (top) and 10% deformed state (bottom) in the weft direction Figure 31 The contour of stress distribution throughout the unit cell of single-layer fabric 5 in undeformed state (top) and 10% deformed state (bottom) in the warp direction Figure 32 The contour of stress distribution throughout the unit cell of single-layer fabric 6 in undeformed state (top) and 10% deformed state (bottom) in the weft direction Figure 33 The contour of stress distribution throughout the unit cell of two-layer fabric 1 in undeformed state (top) and 10% deformed state (bottom) warp direction Figure 34 The contour of stress distribution throughout the unit cell of two-layer fabric 2 in undeformed state (top) and 10% deformed state (bottom) warp direction ix
10 Figure 35 The contour of stress distribution throughout the unit cell of two-layer fabric 3 in undeformed state (top) and 10% deformed state (bottom) warp direction Figure 36 The contour of stress distribution throughout the unit cell of two-layer fabric 4 in undeformed state (top) and 10% deformed state (bottom) warp direction Figure 37 The contour of stress distribution throughout the unit cell of two-layer fabric 5 in undeformed state (top) and 10% deformed state (bottom) warp direction Figure 38 Comparison between experimental data and simulation data of single-layer fabric sample Figure 39 Comparison between experimental data and simulation data of single-layer fabric sample Figure 40 Comparison between experimental data and simulation data of single-layer fabric sample Figure 41 Comparison between experimental data and simulation data of single-layer fabric sample Figure 42 Comparison between experimental data and simulation data of single-layer fabric sample Figure 43 Comparison between experimental data and simulation data of single-layer fabric sample Figure 44 Comparison between experimental data and simulation data of two-layer fabric sample Figure 45 Comparison between experimental data and simulation data of two-layer fabric sample Figure 46 Comparison between experimental data and simulation data of two-layer fabric sample Figure 47 Comparison between experimental data and simulation data of two-layer fabric sample Figure 48 Comparison between experimental data and simulation data of two-layer fabric sample Figure 49 Schematic of manufacture of helical auxetic yarn Figure 50 The cross sectional view of rotating surface Figure 51 The braiding machine used x
11 Figure 52 Geometry of a helical auxetic yarn Figure 53 Geometrical parameters Figure 54 Schematic of the biaxial tubular structure Figure 55 The biaxial tubular structure Figure 56 3D solid model of the helical auxetic yarn Figure 57 Application of boundary conditions Figure 58 The contour of stress distribution before (up) and after (down) deformation Figure 59 Comparison between simulation data and experimental data for tensile property Figure 60 Curve fitting with bilinear function Figure 61 Representation of helical auxetic yarn Figure 62 Poisson s ratio versus longitudinal strain Figure 63 3D solid model of the unit cell Figure 64 Illustration of tension and shear Figure 65 Application of boundary conditions Figure 66 Geometry of the unit cell Figure 67 The contour of stress distribution before deformation (left) and after deformation (right) Figure 68 Experimental data and simulation results of each parameter xi
12 Chapter 1 Introduction Computer aided designs for conventional engineering materials such as metal and concrete which are widely used in bridges, airplanes and other structures are well established to work out the effects of all the likely forces and aerodynamic properties using computer simulations. In contrast, interlaced fibrous structures and products are still produced largely on the basis of experience, intuition and trial-and-error due to their unique properties of strength, flexibility, inhomogeneous structure and non-linearity. In recent years, the development of new materials and new manufacturing techniques allowed a variety of interlaced fibrous structures to penetrate into high performance areas, from medical to civil engineering, from automotive to military, from space to undersea applications. On the one hand, these ever-expanding new application areas require interlaced structures to be engineered very carefully and precisely since their failure could be devastating. On the other hand, appropriate computer aided design for interlaced fibrous structure and fibrous reinforced composites could maximally utilize overall properties of structures to result in high quality to cost ratio product tailored for very specialized purposes. Such demands considerably stimulate the development of geometric and mechanical modeling of fibrous materials. Many former researches built analytical models to predict mechanical properties of fibrous materials based on assumptions and simplifications. The main drawbacks of analytical models are that most of them are quite complicated, time consuming and difficult to control the balance between necessary simplifications and accuracy. Application of finite element method emerges with rapid development of computer hardware and CAD programs 1
13 and it is gradually accepted as the first priority method to analyze properties of fibrous materials due to its advantages of accuracy, time saving and presentation of detailed stress distribution. After finite element analysis based on numerical method is well established and developed, a multi-level modeling concept by means of finite element method was also proposed and applied into all sorts of traditional materials analysis. Multi-scale concept divides materials into different scale. At each scale, properties data from previous scale is considered as inputs to generate overall properties of a larger unit by finite element method and the latter is then transferred into next scale as inputs to finally get the overall properties of the analyzed object. This concept could be suitably applied for mechanical analysis of interlaced fibrous structure. The fundamental theory of this multi-level model is that the fabric is considered to be made of many identical repeating units which have exactly the same properties. Each repeating unit comprises continuous and elastic yarns interlaced at a certain structure. The micro scale stage is to calculate the overall properties of each yarn or obtained directly from mechanical tests if the yarn structure is as simple as monofilament. The overall properties of one single yarn are approached by the homogenization process which connects the micro and meso-modeling. The meso scale stage is to calculate overall properties of repeating unit from yarn properties data of micro-stage. Finally the macro-mechanical modeling stage based on the generation of simplified structure predicts the mechanical performance of extended fabric pieces. The macro-mechanical data are collected from the homogenization process which transfers property of unit cell into property of overall fabric with desired geometry. 2
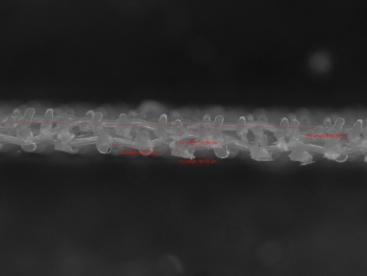
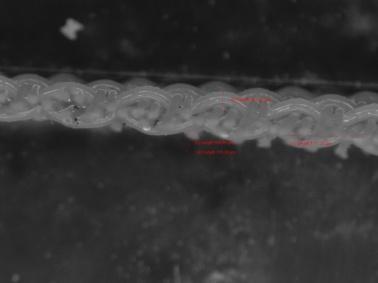
14 The first part of this research is to propose a multi-level model consisting of micro-mechanical model, meso-mechanical model and macro-mechanical model to efficiently and effectively analyze tensile properties of interlaced fibrous structure by finite element method. The multi-level model is constructed in detail so that it could contain most possible aspects from properties of yarn assemble to contact frictional coefficient which could affect the property of final product. Six single-layer woven fabrics and five different two-layer woven fabrics were investigated. Micro-mechanical properties and 3D geometric information both serve as input data for meso-mechanical modeling of repeating unit of each sample. Micro-mechanical properties including modulus, Poisson s ratio and friction coefficient are obtained from test of each yarn. 3D geometric information of one repeating unit containing cross section, spacing and crimp height are directly measured using microscope with CellSens Standard software (Olympus Corporation). A generative model is used in this research to accurately generate 3D solid geometry of repeating unit of each sample. The meso-mechanical model containing material definition, contact specification and periodic boundary conditions is built in Static Structure module of Ansysworkbench. Finally, homogenization process of stress-strain data obtained from meso-mechanical model extrapolates the macroscopic tensile properties of tested fabrics which are compared with experimental data. Tensile properties of samples in both warp and weft directions were simulated by this model and then compared with experimental data. The second part of the research introduces a novel auxetic tubular fabric structure by biaxial braiding and its mechanical analysis by FEM. Considerable research about auxetic materials has been undertaken due to their counter 3
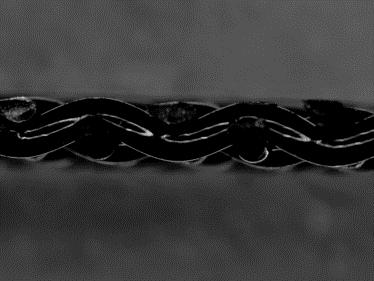
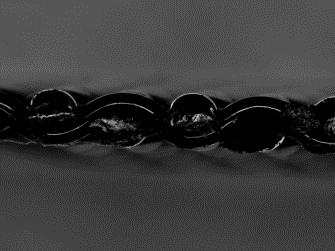
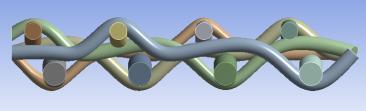
15 intuitive mechanical behavior or negative Poisson s ratio. In other words, auxetic materials are expanding in transverse direction while under longitudinal tension. Auxetic materials exhibit various potential applications because the negative Poisson s ratio could improve fundamental mechanical properties such as shear modulus, indentation resistance and toughness. The fundamental mechanism of auxetic behavior ranges from the rotation of the bonds at the molecular level to a honey comb structure at a macroscopic level. Among all auxetic materials, the synthesized auxetics are highly promising because it is possible to carefully tailor mechanical properties and control the structure of synthesized auxetics for specialized applications or purposes. Auxetic fibers also provide a new route to fabricate large textile structures or composites through textile methods such as weaving, knitting and braiding. Under such circumstance, a helical auxetic yarn is proposed by Hook et al. through winding a high modulus yarn helically onto a low modulus yarn [1]. In this research, we use the helical auxetic yarns as basis to fabricate a biaxial tubular structure and study its mechanical properties and variable permeability attributed to helical auxetic yarns. The whole mechanical model was established on Ansysworkbench 14.0 which is a commercial finite element analysis program. The generative model as the 3D modeling technique was implemented in the modeling module of Ansys. The literature review gives an introduction of characteristics of mechanical behavior of fabric structures under certain deformations and applications of analytical models and numerical models in mechanical analysis of fabric structures. It is followed by the descriptions of the model. Then results and discussion follow. Finally, conclusions and suggestions are presented. 4
16 Chapter 2 Mechanical Model of Fabric Structure 2.1 Literature Review Fibrous Structure and Mechanical Behavior Usually, a textile fabric is made of interlaced yarns which consist of elementary units fibers. Textile structures could be classified according to the manufacturing process such as knitted, woven, braided and non-woven. The major difficulty of computational modeling of textiles is probably the geometrical complexity of the textiles as well as the manufacture pattern. For instance, a plain woven fabric structure could have complicated deformation even under simple loading. A tensile deformation of a spun yarn could result from the combination of bending, tensile, compression and even frictional sliding of the constituent arranged fibers. Furthermore, contact phenomenon such as bonding or frictional contact should also be taken into account as a necessary parameter in the mechanical model. The determination of contact region in the fabric and implementation of contact algorithm undoubtedly increase the complexity of the whole model. Therefore, many mechanical models or analysis of fabric structures are based on some assumptions and simplifications so that the model is accurate and not costly. For example, the yarn is usually assumed to be an elastic homogeneous material. The elastic property of homogeneous yarn could be either linear or non-linear. A non-linear elastic behavior could come from synergy of mechanical behavior of assemble of micro fibers if the yarn is multifilament. If the yarn is monofilament made of one certain polymer, the yarn would probably exhibit a viscoelastic behavior which is also a non-linear behavior. 5
17 As it is mentioned previously, a suitable contact model at where yarns contact with each other must be established in order to effectively analyze mechanics of fabric structure. Actually, the friction effect supports the stability of the whole structure for some certain multifilament fabrics. Frictional contact has great influence on stress and strain distribution in a fabric subjected to deformation because force would be transferred from one yarn to the contacting adjacent yarn Large Deflection and Nonlinearity The complexity of the mechanical behavior of fabric structure could also introduce the large deflection and non-linearity. The relative large deformation is due to the flexibility of yarns and geometries structure of fabric. The yarn is a flexible material which allows large deformation before breakage because of low value of packing factor (the ratio of fibers volume to the total volume of the yarn). The air space left between fibers gives high mobility to fibers resulting high deformability and could be removed by exterior loading. This could also happen in the overall fabric since the fabric structure has air space between yarns [2]. The non-linearity behavior of fabric could be explained by synthesis of straightening of bent yarns and their subsequent elongation [3]. The straightening of yarns usually occurs at the initial stage of loading. Longitudinal elongation of yarns appears with the increase of load. Therefore, the stress-strain curve of a textile structure subjected to tensile deformation is nonlinear Deformation in Textile Structure As discussed in section 2.1.1, even a simple loading condition applied onto a piece of fabric could lead to a complex deformation of straightening, bending, compression and 6
18 sliding of yarns in the meso-scale stage and respective deformations of fibers in micro-scale stage. In addition, huge deformation could occur through fibers in micro-mechanical scale when fabric is subjected to small deformation of macro-mechanical scale. Therefore, a simple deformation behavior happened in macro-mechanical behavior corresponds to a complex deformation in micro-mechanical scale. According to the macro-mechanical scale, deformation can be classified into simple deformations which are tensile, shear, bending and compression of the fabric sheet and complex deformation which is mainly the drape deformation. The drape property is very important characteristic which determines the formability of fabric especially when fabrics are used as reinforcement in composites. This research mainly focuses on the tensile properties of woven fabric structure Background Composite materials exhibit a variety of advantages over conventional materials and have been under rapid development in terms of their design, manufacture and mathematical modeling. Under such circumstances, polymer materials are fabricated to form a tailored structure for a specialized purpose through textile manufacturing methods such as multi-layer weaving, multi-axial braiding and knitting due to their good quality to cost ratio [4]. The prediction of final product properties before the product is actually fabricated is extremely important for design and manufacture process in order to produce high quality to cost ratio product [5-6]. However, mathematical modeling of such fabric reinforced composites or novel fabric structures is complicated due to the complex structure. Fibrous materials present very different properties compared to other engineering materials because of their unique 7
19 properties such as strength and flexibility, inhomogeneous structure and visco-elasticity. Besides, the complicated crossover structure in fabric is also difficult to model [7]. The prerequisite of conducting a finite element analysis is to build an accurate geometric model of the object. A generative model which could generate all sorts of 3D fibrous structures has been proposed [8-9] Classification of Mechanical Models of Fibrous Structures Analysis of mechanical properties of textile structures has been done during the last decades. Generally speaking, the models can be classified by the scale of the model and the modeling method used. According to the modeling method, the model of textile structure could be divided into analytical model and numerical model. In most cases, the analytical model is to figure out the relationship between the desired properties and parameters as variables. The conceptualization, which is the process from physical reality of textile structure to mathematical model, is of essence. In conceptualization process, some necessary assumptions and simplifications have to be made. The major characteristic of analytical model is the balance between the simplifications introduced and the accuracy of the model. With respect to the numerical model, the first step, conceptualization, is still the same as the analytical model. The entire solution domain could be subdivided into piecewise finite elements and the mathematical model is solved in each finite element. The final solution is approximated by integration of solutions over all finite elements. With rapid development of computer hardware and 3D model programs, now the numerical method is dominating in the field of mechanical modeling of fibrous structures and its reinforced composites. Another classification is based on the scale of the model, namely micro-mechanical model, 8

20 meso-mechanical model and macro-mechanical model. The micro-mechanical stage studies the property of yarns by taking into account the orientation, structure and properties of constituent fibers. This stage is actually the process of transferring from properties of constituent fibers to overall property of the yarn assemble. The meso-mechanical model focuses on the study of overall property of fabric unit cell by introduction of geometry of unit cell and considering yarns as homogeneous material. The overall property of homogeneous yarn is calculated from micro-mechanical model. Finally, the macro-mechanical model is to predict complicated deformation of overall fabric such as drape by considering fabric as continuum material [10]. Even though these three model stages were proposed as distinct analysis approaches, there have been efforts for the integration of these three models. The textile society proposed a modeling hierarchy based on three modeling scales: the micromechanical modeling of yarns, the meso-mechanical modeling of the fabric unit cell and the macro-mechanical modeling of the fabric sheet as shown in Figure 1 [11-12]. Figure 1 Integrated model of micro, meso and macro mechanical model According to the integrated textile modeling concept, the only input data over the entire model procedure are the fiber properties, the yarn structure and the fabric structure. In the 9
21 first modeling stage, the fiber properties and the yarn structure are introduced as input parameters for the mechanical analysis of the yarn and the calculation of the yarn properties. Then, the yarn properties are transferred to the meso-mechanical stage as inputs. In the meso-mechanical model, the yarn is considered to be homogeneous and the yarns properties correspond to a homogenization process which connects the first and second model stages. Furthermore, the geometry of fabric unit cell is introduced in this stage to build accurate 3D solid model of the unit cell. The analysis is limited to the fabric unit cell. A second homogenization process is required to connect the second and third stages by calculation of property of unit cell and its attribution in the fabric sheet. Finally, the macro-mechanical modeling stage based on the assumption of continuum materials predicts the mechanical performance of extended fabric pieces in complex deformations. Each individual modeling procedure presents significant obstacles [12] Analytical Modeling The first mechanical analysis of fabric structure was probably proposed by Peirce [13]. Most of the analytical models are based on the elastica theory and energy minimization Micro-Mechanical Model by Analytical Method Some research concentrates on the study of multifilament twisted yarn in terms of micro-mechanical model. The objective of such research is to investigate the response of twisted yarn subjected to certain deformations. In most cases, yarn is considered to be homogeneous continuum of constant cross section and density along the length. And all fibers are assumed to have identical properties and perfectly elastic. Stress-strain curve of fibers, twist density and the initial specific volume are taken into account as input parameters. 10
22 The cylindrical- helix model by Hearle et al and the conical-helix model by Onder and Başer were established from the point of view of arrangement of fibers and geometry of fibers assemble [14-15]. Detailed descriptions of mechanical behavior of yarns were studied. Tension, bending and torsion behavior of yarns were approached by means of force, stress-analysis and energy methods [16-20]. Komori employed a statistical approach by introduction of large quantity of data to analyze mechanical properties of yarn assemble [21]. The major challenge of multifilament yarn model is the balance between physical reality and idealistic condition of yarn assemble Meso-Mechanical Model by Analytical Method The first attempt of analytical modeling of fabric unit cell is to predict the uniaxial or biaxial deformation of plain woven structure. Perice proposed three principal fundamental assumptions of geometrical model of plain woven fabric [13]. The flexible thread is assumed to be infinitely flexible, incompressible and inextensible with circular cross-sections as shown in Figure 2 and Figure 3 [13] [22]. This model has one main drawback which is the assumption of circular cross section shape because in most cases cross section shape is not perfectly circular due to exterior forces in manufacture processes. Thus, later, the Peirce s geometry model was improved by changing the cross sectional shape for a better representation of interlaced structure. The racetrack and elliptical cross sectional shapes were employed into Peirce s model as shown in Figure 4 and Figure 5 [23-24]. 11

![[13] Figure 3 3D geometric model](/docs-images/73/69327416/images/23-1.jpg "of plain woven unit cell by")
![Peirce [13] Figure 4 3D](/docs-images/73/69327416/images/23-2.jpg "representation of woven model")
23 Figure 2 Geometric model of plain woven fabric by Peirce [13] Figure 3 3D geometric model of plain woven unit cell by Peirce [13] Figure 4 3D representation of woven model proposed by Kemp [23] 12
![Figure 5 3D representation of elliptic model proposed by Olofsson [24] In Peirce s model, the theory of elastica was proposed to treat the yarns as elastic slender rods.](/docs-images/73/69327416/images/24-0.jpg "The shape of the yarn axis can be determined by the energy minimization of elastic slender while subjected to transverse forces.")
24 Figure 5 3D representation of elliptic model proposed by Olofsson [24] In Peirce s model, the theory of elastica was proposed to treat the yarns as elastic slender rods. The shape of the yarn axis can be determined by the energy minimization of elastic slender while subjected to transverse forces. In short, the Peirce s model and its corresponding models were all developed according to the equilibrium, energy or elastica method for the mechanical analysis. Another flexible thread model including the consideration of crimp and yarn extension was proposed by Freeston et al. [25]. This flexible thread model was based on the assumption of homogeneous, linear elasticity as well as linear work-hardening. Olofsson improved the Peirce s model by changing the yarn cross section shape into a function of the forces acting on them [24]. Mathematical equations were derived in terms of equilibrium conditions, stress-strain relationship of tension and compression and energy in bending. Grosberg and Kedia employed an energy method on the analysis of initial load extension modulus of completely relaxed woven fabric with the assumptions of inextensible and incompressible yarn [26]. Dastoor et al also proposed a similar elastica method taking into account linear extensibility of the yarns by regarding the yarns as homogeneous, weightless slender rods, frictionless material [27]. In this analytical approach, a computational algorithm was 13
25 implemented for the solution of the equilibrium equations. Another analysis of the large deformation of partially and completely set plain woven fabrics was performed by Huang [28-29]. Both effects of extension and bending of yarns were considered based on the elastic model. His model introduces the bilinear moment curvature relation to explain the sliding of the fibers within the yarn, increasing the reliability of the study. The sawtooth geometrical model which contains the force equilibrium and the displacement of the warp and weft yarns in thickness direction at contact points of crossing threads was proposed to elaborate finite deformation and biaxial deformation theory [30]. Dolatabadi and Kovař suggested an alternative geometrical model of woven fabric considering the yarn s packing density as well as general fabric data as parameters [31-32] Macro-Mechanical Model by Analytical Method An improvement of elastic theory based on the concept of planar and spatial elastica was developed to study complex deformation of fibers and fiber assembly by Konopasek [33-34]. This model includes considerations of nonlinear behavior of material, friction elasticity, elastic-plasticity and visco-elasticity. To be more specific, the planar elastica theory was proposed to study the large deflections of yarn in a plane and the bending behavior of fabric sheet. The spatial elastic was proposed to analyze fiber buckling and crimp. Computational tools were utilized in order to solve the nonlinear differential equations. Lloyd et al. published an alternative method to the theoretical mechanics of static drape of fabrics by solving the differential geometry of surfaces [35]. In addition, they developed a convenient implementation of the theoretical mechanics of fabrics since the fabric was considered as 2D continuum represented by a 14
26 surface with very small thickness embedded in the 3D Euclidean space. The dynamic deformation of fabrics was studied by means of differential geometry of surfaces [36]. A model was established to generate the surfaces made of a series of twisted curves. The relationship between the curvature of surface and the mechanical properties of material was investigated by checking differential geometry parameters. The concept of homotopy was applied in the mathematical model of deformation of the surface from the initial state to the final state Numerical Modeling The expansion of powerful commercial software codes considerably stimulates the application of numerical method into research of textile structures. Two dominant methods in mechanical modeling of textile structure and its respective reinforced composite are Finite Element Method (FEM) and Boundary Element Method (BEM) [37-38]. 2D and 3D representations for the plain woven fabric structure were the first attempts to build mechanical model by numerical method. Keefe et al. proposed a 3D geometrical model with various compactions and angles based on the geometry of woven fabric [39]. Later, these models were validated for numerical methods [40-41]. The application of numerical methods such as FEM and BEM guides the direction of the approaches for textile micro and meso-mechanical models in the future Micro-Mechanical Model by Numerical Method Munro et al [42] suggested a new approach using FEM to analyze the properties of aligned fiber assembly. The element used in the model is a cuboid cell with 8 nodes and each node contains 6 degrees of freedom. The model could correlate the energy contributions to 15


27 element stiffness with various user defined properties in which nonlinear behavior is successfully applied. The yarn models were discretized by dividing them into layers which was again split into finite element ranging from 1 to 22. The fibers were initially arranged to form the idealized helical-yarn geometry. The result from this model fit well with the expectation. The necking phenomenon of the yarn assembles appeared under tension and elements of the model were opened significantly under axial compression. The fast development of CAD tools makes the construction of 3D solid models of even complex textile structure possible. An FEM modeling of yarn of the loose condition and dense condition supported by the assumption of helicoidal filaments with a constant helix radius are given in Figures 6 and 7 [43]. Figure 6 Beam model of filaments for loose structure [43] Figure 7 Beam FE model of 50-filament twisted yarn [43] 16

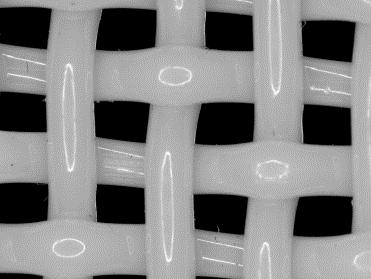
28 Meso-Mechanical Model by Numerical Method Parametric solid modeling software programs have been developed to generate 3D solid model of complex woven structures with weave pattern, yarn size or spacing as parameters. In the unit cell, the yarn is still assumed to be homogeneous material in order to reduce the cost and time consumption during calculation [44]. The meso-mechanical model was greatly improved by various types of finite elements and implementation of material property pool which includes linear, nonlinear, elastic, plastic, viscoelastic, isotropic, orthotropic, anisotropic options etc. In addition, contact algorithms and large strain effects were also taken into account in the mechanical model of unit cell since they have great influence on the final result. Durville [45] proposed a 3D beam model to simulate mechanical behavior of woven fabrics in fibers scale. Tarfaoui and Akesbi [46] presented a more complicated structure of twill woven fabric whose unit cell comprises of three warp and three weft yarns. B-spline function was used in order to generate more precise 3D solid model of yarn in FEM [47]. Vassiliadis et al built a 3D model of complex interlaced woven fabric for the mechanical properties analysis as shown in Figure 8 [48]. Figure 8 Solid FE model of unit cell of twill (left) and satin (right) woven structure [48] 17
29 Fibrous structure reinforced composites have been widely used in fields of automotive, marine and aerospace industry due to their high ratio of stiffness and strength to weight and multiple functions. Zhang and Harding used strain energy method of FEM to predict the elastic properties of plain woven composite structures [49]. The drawback of this approach pointed out by the authors was that the two undulations in one direction were not realistic for woven fabric. Naik improved this approach by considering the strand cross section geometry, possible gap between two adjacent yarns and the two direction undulation [50]. Whitcomb studied the effect of quadrature order, mesh density and material degradation on the predicted failure from in-plain loading [51]. The 3D solid model of composite is made of the volumes of woven unit cell and the volumes of matrix. The volume of matrix could be obtained by subtracting the volumes of fabric unit cell from the overall volume of composite unit cell. Some approaches were undertaken to investigate the homogenized elastic properties of fabric composites using the unit cell of composite structure. Circular, elliptic, compressed hexagonal and lenticular cross section shapes were assumed for the 3D construction of tows. The material properties of tows in the composite were defined as transverse isotropic and the matrix as isotropic. An approach proposed by Ng et al. [52] predicted the inplane elastic properties of a single layer 2/2 twill woven fabric composite. The mechanical model was programmed by the ANSYS Parametric Design Language (APDL). The 8-node solid elements with 3 degrees of freedom per node were used in the model. The whole model contains approximately finite elements and nodes. The contact areas were generated by subtracting the volume of fabric unit cell from the overall volume of composite unit cell and were then defined to be a shared entity for both the yarn and the matrix volumes. 18
30 Choi and Tamma [53] successfully predicted the in-plane elastic properties of a composite structure reinforced with plain woven fabric. The predicted elastic properties were then used for the damage analysis of laminated composite structures. The superposition principle was used for the prediction of homogenized properties of woven fabric reinforced composites. The overall model contains 520 wedge elements for the yarns and 256 brick elements for the matrix. In-plane tensile and shear deformation was obtained with a gradually incrementing load. A novel research in terms of generalized description of the internal structure of textile reinforcement was conducted by Leuven. Lomov et al. proposed a model for the internal geometry of 2D and 3D woven structure based on the minimization of total energy throughout unit cell and yarn mechanical properties. And this method could be extended to all sorts of fibrous structures such as woven, braided, knitted structures [54-56]. They also established a three-level hierarchy: the micro-, meso- and macro-level. The micro-level deals with the arrangement of fibers in the representative volume of yarn. The meso-level defines the internal structure of the reinforcement and direction and volume fraction within the yarn. Finally, the macro-level prescribes the 3D geometry of composite unit cell and distribution of the reinforcement properties Macro-Mechanical Model by Numerical Method Macro-mechanical modeling of fabric or cloth mainly concentrates on the prediction of drape behavior and the virtual representation. According to the purpose and application of fabric, different techniques have been developed in the last decades. Numerical model such as the particle-model, the deformable node-bar model and the FEM were proposed for the purpose of better understanding of fabric behavior under deformation. Most 19
31 macro-mechanical models by numerical method mainly focus on drape properties of fabric, whereas meso-mechanical models with appropriate boundary condition are accurate enough to solve simple macro-deformation of tension, compression and shearing. Since this research only concentrates on the prediction of tensile property of fabric structure, there is no further introduction of macro-mechanical model of drape properties of fabric Evaluation The review of literature of analytical models for the mechanical analysis of woven fabrics indicates that a globally accepted analytical model in terms of accuracy still remains as a goal. Even though there are so many different analytical models, most of which are based on totally distinct theories or principles, all of them were established on simplifications and assumptions in order to decrease the complexity of the model. The major drawback in analytical models is the balance between simplifications and the accuracy of the results. The two-dimensional approach and the attribution of linear isotropic properties defined for materials would result in inaccuracy. In addition, the analytical models have the difficulty of integrating of micro-, meso- and macro-level models. Analytical models have been replaced by or incorporated into the numerical models. The numerical methods have unique advantages to overcome obstacles such as geometrical representation, complex deformations, particular material properties, contact phenomena and large deflection effects. Moreover, numerical approach tools are able to generate good virtual representation of fabric under deformation. Most numerical methods are based on the Finite Element Method which could simplify the mechanical analysis by avoiding calculation of the bending rigidity of the yarn and its attribution at the modeled yarn. The homogenization process could be achieved 20
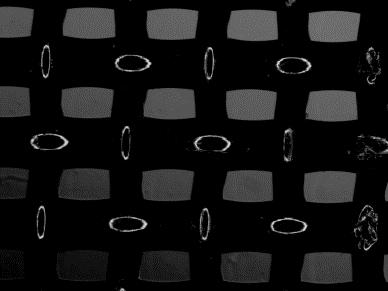
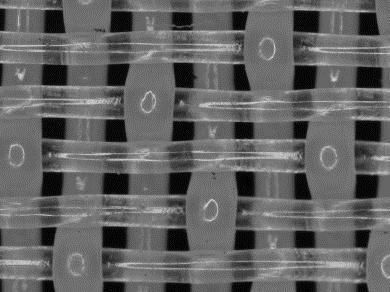
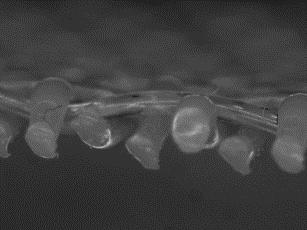
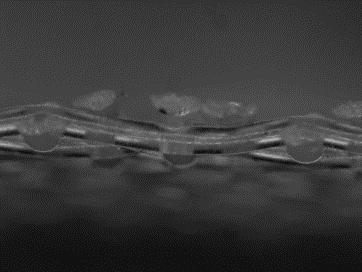
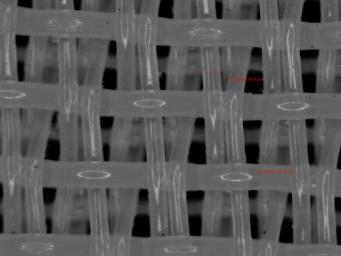
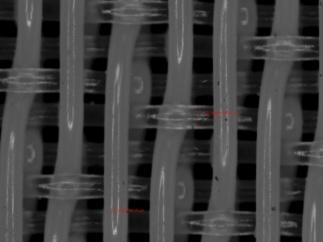
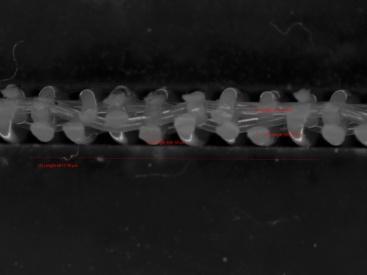
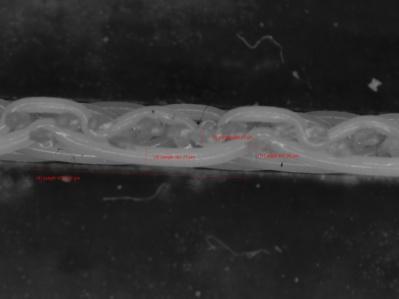
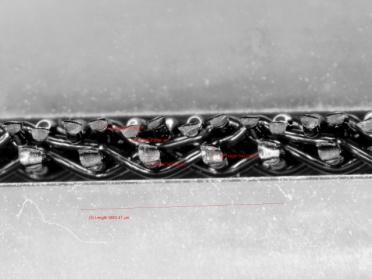
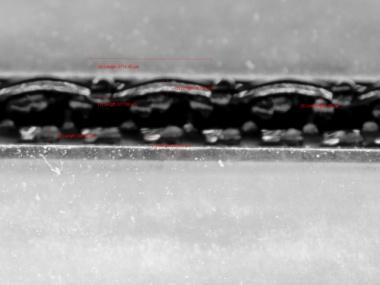
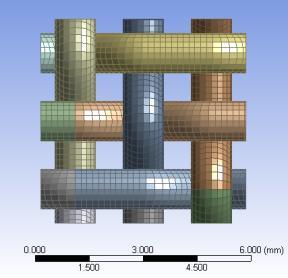
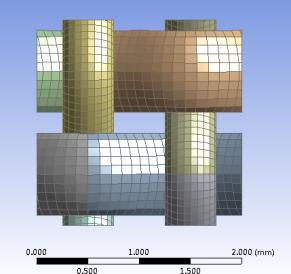
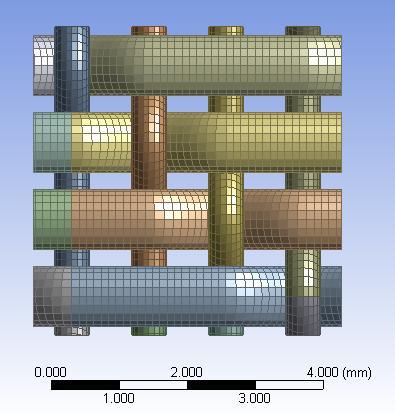
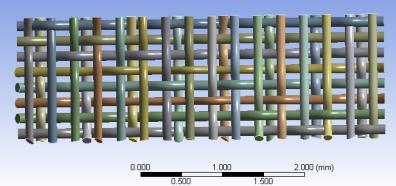
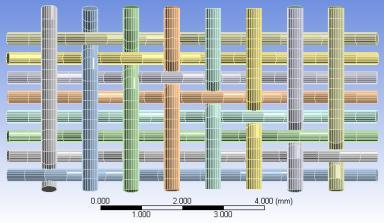
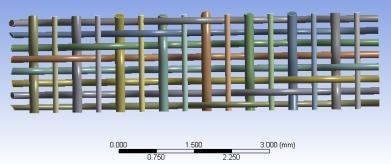
32 between each model level by application of boundary conditions so that the micro-, mesoand macro-level models are well connected. However, homogenization process may become problematic if the interpretation of data from previous stage is difficult for the next stage. There is still much work to collaborate each stage in order to generate realistic model and equivalent properties. 2.2 Experimental Material Preparation Six single-layer woven fabrics and five two-layer woven fabrics were used for this research. Each yarn in the fabric is polyester monofilament with different diameter and mechanical properties. The detailed information of unit cell of each woven fabric was examined by observation under microscope Geometry of Unit Cell The geometry of unit cell of each fabric samples was examined using computer software associated with a microscope (cellsens Standard by Olympus Corporation). The CellSens Standard program is capable to measure the length and angle up to magnitude of micrometer. The yarns in the fabric structure are classified into warp yarn and weft yarn. The warp yarn is along the machine direction, while weft yarn is perpendicular to the warp yarn. For the two-layer woven fabrics, the top layer and bottom layer are made of weft yarns, while a warp yarn crosses over each weft yarn as shown in Figure 9. The unit cells geometry of each fabric sample are presented in Figures 10 and 11. The top view, right view (weft yarn direction) and left view (machine direction) of single-layer woven fabrics and two-layer fabrics are shown in the figures. The properties of single-layer 21
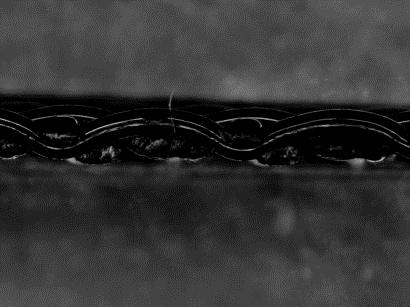
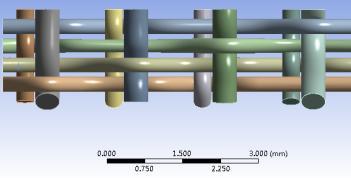
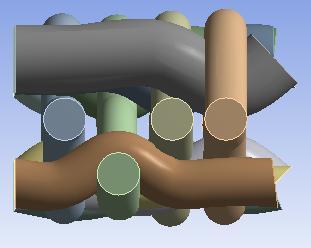
33 woven fabrics are given in Table 1. The patterns for two-layer fabrics are little bit complicated. The two-layer fabric samples 1, 4 and 5 have extra yarns in the top weft layer. Table 1 Geometric properties of six single-layer fabric samples (w: warp, f: filling) Fabric 1w 1f 2w 2f 3w 3 f 4w 4f 5w 5f 6 w 6 f Major radius (mm) Minor radius (mm) Spacing (mm) Crimp height (mm) Structure 1/1 2/1 4/1 3/1 3/1 3/1 Figure 9 Cross section of a typical two-layer woven fabric structure with unit cell of 8 columns of weft yarns 22

34 Single-layer fabric sample 1 Single-layer fabric sample 2 Single-layer fabric sample 3 Single-layer fabric sample 4 Single-layer fabric sample 5 23
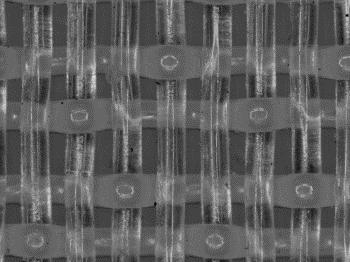
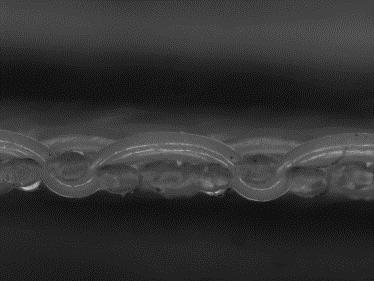

35 Single-layer fabric sample 6 Figure 10 Geometry of single-layer fabrics in top view (left), right view (middle) and left view (right) Two-layer fabric sample 1 Two-layer fabric sample 2 Two-layer fabric sample 3 Two-layer fabric sample 4 24


36 Two-layer fabric sample 5 Figure 11 Geometry of two-layer fabrics in top view (left), right view (middle) and left (right) view Measurement of Geometry The 3D model construction depends on the measurement of geometry of each unit cell. What geometrical parameters need to be measured matters. According to the Peirce s model, the intact geometry of the unit cell of fabric can be determined as long as the spacing between yarns (p in Figure 12), diameter and crimp height (h in Figure 12) are given. Then, the crimp angle, θ in Figure 12, can be calculated so that the contact area at cross over point is determined. Figure 12 Peirce s model of simple woven fabric structure CellSens Standard can measure fine distances between two points. The spacing is measured through the distance between centroids of two adjacent yarns. It was found that the 25

37 cross sectional shape of yarns is not perfectly circular. To build a more accurate model, elliptic shape is used to describe cross section of each yarn. The major radius and minor radius of each yarn are measured. Finally, the crimp is measured through the distance between the highest point and lowest point over an undulated yarn. Table 1 summarizes the geometrical information of 6 samples of single-layer fabrics However, this principle is only suitable for simple woven structures which, in this case, are single-layer fabrics. It does not work for the more complicated woven structures such as 2 layer fabrics. A generative model which contains an interpolated spline function and elliptical surface is applied into generation of 3D solid geometry of unit cell for 2 layer fabrics. This technique will be explained later in the modeling section. An undulated yarn could be described by the path of the centerline of its cross section. Besides major and minor radius and spacing, the coordinates of the nodes along the centerline are also measured. In order to draw an intact curve for the centerline of the warp yarn for a two-layer structure as shown in Figure 9, at least 8 nodes which are exactly above the centroids of bottom weft yarns have to be determined. Figure 13 shows the 8 centerline nodes (black dots) for the unit cell of two-layer fabric 2. This method for generating 3D solid model of fabrics could be extended to all sorts of fabric structures Figure 13 Illustration for measurement of centerline of warp yarn for two-layer fabric 2 26
38 Table 2 presents the spacing information for five two-layer fabric samples. Since spacing between top weft, bottom weft and warps could be different, each of them has to be measured separately. Table 3 shows the major and minor radius for two-layer fabrics. Table 2 Spacing for five two-layer fabric samples spacing between top and bottom layer (mm) spacing between warp yarns (mm) spacing between top weft yarns (mm) spacing between bottom weft yarns (mm) Sample Sample Sample Sample Sample Table 3 Major and minor radius for two-layer fabrics Major radius(mm) Minor radius(mm) Sample 1 Warp yarn Weft bottom Weft top Sample 2 Warp yarn Weft bottom Weft top Sample 3 Warp yarn Weft bottom Weft top Sample 4 Warp yarn Weft bottom Weft top Top extra Sample 5 Warp yarn Weft bottom Weft top Weft extra

39 2.2.4 Mechanical Property Tests Since this model assumes that the yarn is homogeneous and isotropic, the linear isotropic material model is used to define elastic properties of yarns. A linear relationship is applied to fit the stress-strain curve of each yarn to describe mechanical properties. Thus, both stress-strain curve and Poisson s ratio are measured by universal mechanical testing machine (INSTRON) according to the ASTM D A camera device associated with the mechanical test machine can capture the image of yarns under tension test (Figure 14). The width of each yarn can be measured under different tensile deformation from which the Poisson s ratio can be calculated. Figure 14 Universal mechanical testing machine with a camera device (INSTRON Technology) The stress-strain curves of yarns in 6 single-layer fabric samples are given in Figure 15, which shows that some of them exhibit non-linear behavior. In an ideal realization of the model, the non-linear behavior should be taken into account. However, in this research, a simplified linear model is used. 28
40 Figure 15 Stress strain curves for yarns in six single-layer fabric samples The mechanical properties of each yarn are summarized in Tables 4 and 5. For single-layer fabric structure, both warp yarn and weft yarn have different modulus and Poisson s ratio. Usually, the modulus of warp yarn is higher than that of weft yarn. With respect to two-layer fabric structure, the unit cell of two-layer structure contains top weft, bottom weft, warp yarn and even extra yarn. Each of them may have different mechanical properties. Table 4 Mechanical properties of yarns for single-layer fabrics Samples Direction Modulus (MPa) Poisson s ratio single-layer Warp yarn sample 1 Weft yarn single-layer Warp yarn sample 2 Weft yarn single-layer Warp yarn sample 3 Weft yarn single-layer Warp yarn sample 4 Weft yarn single-layer Warp yarn sample 5 Weft yarn single-layer Warp yarn sample 6 Weft yarn
41 Table 5 Mechanical properties of yarns for two-layer fabrics Modulus(MPa) Poisson s ratio Sample 1 Warp yarn Weft bottom Weft top Sample 2 Warp yarn Weft bottom Weft top Sample 3 Warp yarn Weft bottom Weft top Sample 4 Warp yarn Weft bottom Weft top Top extra Sample 5 Warp yarn Weft bottom Weft top Weft extra Friction Coefficient Tests Previous research indicated that friction coefficient between fibers does not have much effect on mechanical properties while fabric is under axial or biaxial loading because relative sliding can be neglected when fabric is subjected to axial or biaxial loading. However, the friction coefficient turns out to be a very important aspect in terms of manufacturing process and behavior under shear loading or cyclic loading [56]. In addition, friction between yarns at crossover points directly supports the geometric integrity. For the completeness of the mechanical model, the friction coefficient has been taken into account in the FEA by 30
42 incorporating a friction model at the contact zone. The friction coefficient was experimentally obtained using a device whose schematic is shown in Figure 16. Five samples were tested for each pair of yarns contacting to each other and the final value of friction coefficient was obtained by taking the average. The friction coefficient is calculated using: (1) where is the number of turns per unit length, is the initial tension on the lower free ends, is the measured friction force, and is the twist angle which can be calculated from the following equation: (2) where L, L 1 and L 2 are distances indicated in Figure 16. Friction coefficients of each fabric measured from experiments are shown in Tables 6 and 7. The single-layer fabrics only have one type of contacting condition which is the contact between the warp and weft yarn at crossover point, whereas the two-layer fabrics have more than one contacting condition since there are two or three different types of weft yarns including the extra yarn in the two-layer structure. Figure 16 Schematic of the friction coefficient testing device 31
43 Table 6 Friction coefficients of single-layer fabrics Fabric Yarn to yarn average dynamic friction coefficient Coefficient of variation 2.2% 3.2% 2.9% 2.5% 2.4% 2.4% Table 7 Friction coefficients of two-layer fabrics Sample Yarn to yarn Coefficient average dynamic variation friction coefficient Sample 1 Warp yarn to % top weft Warp yarn to % bottom weft Sample 2 Warp yarn to % top weft Warp yarn to % bottom weft Sample 3 Warp yarn to % top weft Warp yarn to % bottom weft Sample 4 Warp yarn to % top weft Warp yarn to % bottom weft Warp yarn to % extra weft Sample 5 Warp yarn to % top weft Warp yarn to % bottom weft Warp yarn to % extra weft of 32
44 2.3 Modeling Approach Micro-Mechanical Modeling The objective of micro-mechanical model is to describe the stress-strain relationship of the yarn and to ultimately obtain what displacements would result from given forces in different directions. The properties of yarn calculated from this stage will be further used in the meso-mechanical modeling. To begin with, the strain represents the deformation of a body in a certain direction. Engineering strain, is defined by the following equation. (3) where is the body length before deformation, is the body length after deformation in the same direction. This is the simple definition of engineering strain in the uniform deformation scenario. If the deformation of the body is no longer uniform, the engineering strain can be defined by a more generic form: (4) where u is the displacement vector. So this expression can be extended to three orthogonal directions: (5) According to the mechanics of materials, the shear strains are defined in the following equations. 33
45 (6) The deformation at any point in a body can be defined by tensile and shear strain. The strain occurred in the body would cause the internal force within the body to resist the deformation. This internal force can be expressed by stress. The stress is the internal distribution of force per unit area. The stress is usually calculated as the function of the strain. (7) This function describing the relationship between stress and strain is usually called the material model or constitutive equation, which is what the micro-mechanical model seeks for. If the stress-strain relationship of the material is the same regardless of directions, then it is called isotropic material. The stress-strain relationships in different directions might not be identical for the same body. If so, the material is then named anisotropic material. Typically, the yarn material is an anisotropic material; however, it is not completely anisotropic. The stress response in the cross section plane is isotropic. So the yarn material is considered to be transverse isotropic material. If the material is assumed to be linear elastic, the stress can be defined as a function of strain with 5 constants. The constants are longitudinal modulus E L, transverse modulus E T, transverse Poisson s ratio ν TT, transverse-longitudinal Poisson s ratio ν TL and transverse-longitudinal shear modulus G TL. From these 5 constants, the longitudinal-transverse Poisson s ratio ν LT and transverse shear modulus G TT can be calculated by the following equations: 34
46 (8) (9) In this case, the stiffness matrix equation of transverse isotropic property can be established assuming that z axis is the yarn path direction and x and y axes are two orthogonal directions perpendicular to the z axis. The overall stiffness matrix can be expressed by the following equation: (10) However, all the yarns in this research are monofilaments which mean that each yarn is formed evenly by extruding and polyester is uniformly distributed throughout the entire yarn. Therefore it is quite reasonable to assume that the yarn is an isotropic homogeneous material. In order to have a simplified model for the description of mechanical properties of yarn, the isotropic model is defined for the homogeneous yarn. The isotropic mechanical property has only two independent variables (E for modulus and ν for Poisson s ratio). The expression of relationship between the stress and strain is simplified from equation (10) to equation (11). The modulus and Poisson s ratio are experimentally measured using universal mechanical testing with a camera device. The data of modulus and Poisson s ratio of each yarn are given in Section 3 experimental part. 35

47 (11) Usually, a homogenization process is required as the last step in this stage to obtain the overall property of a yarn if the yarn is multifilament assembled by many fibers. However, the overall property of yarn is self-explained by the modulus and Poisson s ratio because the yarn is homogeneous monofilament with isotropic properties Meso-Mechanical Modeling The meso-mechanical modeling stage is to analyze mechanical properties of the unit cell. According to the multi-scale model concept, the behavior of a micro heterogeneous medium can be described by that of an equivalent homogeneous medium with appropriate boundary conditions according to the macroscopic geometry and boundary. In particular, the fabric is a heterogeneous material. However, one can consider fabric structure to be homogeneous material made of identical repeating unit cells which have exactly same properties. In this case, the behavior of fabric structure can be described by repeating unit cell structure with appropriate boundary conditions. The overall fabric s simple deformation behavior such as unidirectional tension and shearing can be retrieved as long as the coresponding mechanical properties of unit cell are calculated. In this research, the tensile properties in longitudinal and transverse direction of unit cells are obtained through FEM in which the geometry of unit cell, modulus and Poisson s ratio are introduced as input data. An appropriate boundary condition is applied onto the unit cell to simulate the real physical conditions over the unit cell and 36
48 more importantly to homogenize the mechanical properties throughout the unit cell D Solid Modeling of Unit Cell Geometry 3D solid model of a single yarn can be described by its 2D shape of cross section and yarn path, which is similarly defined by an array of nodes of centroids. This kind of modeling is called generative model, which is formed by transformation of a lower dimensional shape to a higher dimensional shape [57]. Consider a cross sectiona shape: z=f 1 (x, y), x R 1, y R 2 (12) And a curve in 3D space: z=f 2 (ν), ν R 3 (13) Now the cross sectional shape (12) is translated along the tangent direction of the 3D curve (13) so that the new coordinate z is expressed as function of ν for every point (x, y) [R 1, R 2 ] given a ν. Then, a 3D solid structure V(x, y, ν) may be generated. In particular, the cross sectional shape of a yarn is the generator. This generator can be translated along the centerline curve of the yarn path in order to generate a 3D solid model. Yarn Path Representation Adanur and Liao proposed a geometric modeling technique by generative model which can actually generate all sorts of fabric structures such as woven, knitted and braided [8]. However, the yarn path function they used for the description of undulation of yarn is limited to cosine and sine. Cosine and sine functions are probably appropriate to describe undulation of the yarn in simple woven fabric; however, they are no longer precise for the undulation of 37
49 warp yarn in the two-layer woven fabric. Therefore, a more accurate yarn path function has to be used to represent the centerline path of the yarn. The path of a yarn can be considered as one dimensional line representing the yarn s centerline in three dimensional space. Thus, the yarn path can be defined in 3D space as a function of distance along the yarn. The most generic and accurate way to describe such a yarn path is to specify a number of discrete positions along the yarn length, known as master nodes, and have the rest part interpolated [57] between these points rather than to define a certain cosine or sine function which is not precise enough to represent yarn path in this case. Generally speaking, the more master nodes are defined, the more accurate model of the yarn path. In order to get an accurate yarn path model, it is sufficient to specify one or two master nodes per crossover as long as the interpolation function is suitable. The continuity C must be required in the interpolation function so that there is no gap in the yarn path and the tangent of yarn path varies smoothly. A common solution to make sure the continuity and smoothness of the yarn path is to use spline functions. A spline is a function defined piecewise by polynomials. In its most general form a polynomial spline S : [a, b] consists of polynomial pieces Si : [ti, ti+1], where a = t 0 < t 1 < < t k 2 < t k 1 = b (14) That is: (15) 38
50 Since it is impractical to measure so many master nodes along the yarn path, another requirement of this interpolation function is that it can generate the curve of yarn path with the master nodes as little as possible. In this case no extra points need to be defined in order to specify the yarn path. A natural cubic spline function is used for the model of yarn path [57]. A detailed definition of natural cubic spline function is introduced below: The continuity conditions C 0, C 1 and C 2 are applied by the equation: (16) (17) (18) The boundary conditions at t = a and t = b are given in equation: (19) The derivatives of the spline at the knots can be calculated by solving the matrix equations: (20) Once the derivatives are known, the coefficients of the spline pieces can easily be determined. For each cubic spline piece, there are 4 equations with 4 unknown coefficients a i, b i, c i and d i : (21) (22) (23) (24) The natural spline interpolation function also has a very important characteristic of 39
51 minimization of the total curvature. Equation 25 is the expression for approximation of the total curvature through the entire domain. The natural spline interpolation method can minimize the value of the total curvature. Since the total energy of elastic strip is proportional to the curvature, it turns out that the natural spline interpolation is actually the approximation of geometry of elastic strip with minimal energy constraint in k knots [57]. (25) Yarn Cross Section As discussed previously, the 3D solid model of a yarn is generated through the translation of cross section of yarn along its centerline yarn path. Thus, the shape of cross section is critical to determine the 3D solid model of a yarn. The cross section of yarn is defined as the 2D surface cut by plane perpendicular to the yarn path tangent. When it comes to multifilament which is assembled by fibers, the cross section shape would no longer be constant shape and rather difficult to determine. Therefore, the cross section of the multifilament yarn can be assumed to be the smallest region which encompasses all of the fibers within the yarn. The outline of cross sections can be defined using parametric equations in 2 dimensions. Various shapes have been explored including the ellipse proposed by Peirce [13], power ellipse [58] and a modified lenticular shape [59]. All of these cross sections are summarized as follows. Ellipse The elliptical cross-section is one of the simplest approximations. With given width A and height B the equation is defined as follows: (26) 40
: (29) (30) (31) (32) Figure 17 Schematic of lenticular cross sections The")
52 (27) (28) Lenticular The lenticular cross-section is defined by the intersection part of two circles of radius r 1 and r 2 each of which offsets vertically by distances o 1 and o 2 respectively. The parameters r 1, r 2, o 1 and o 2 can be calculated from w, h and distortion d in the following equations (Figure 17): (29) (30) (31) (32) Figure 17 Schematic of lenticular cross sections The outline of cross-section can be defined as: (33) (34) where: 41
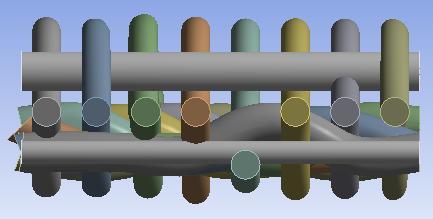
53 (35) Power ellipse The power ellipse is a cross-sectional shape between ellipse and lenticular. The power ellipse is a slight modification to the elliptical cross-section where the y coordinate is assigned a power n to make the section resemble a rectangle with rounded edges when n < 1 or a shape similar to a lenticular cross-section when n > 1 [57]. It is defined as follows: (36) (37) Specification of Centroids. The computer software associated with the microscope device (CellSells Standard Olympus Corporation) is used in this research to measure the geometry including major and minor radius of each yarn, spacing between top and bottom layer, spacing between warp yarns and spacing between weft yarns as well as configuration. In this case, the spacing is defined as the distance between centroids of cross-sections. Another critical factor for accuracy of 3D solid model is the crimp height at crossover points. Theoretical speaking, crimp of weft yarns for two-layer fabric structure is not developed until heat-setting procedure. Therefore, 3D model is of little practical value without taking into account the crimp of weft yarns. This is another reason to use the generative modeling technique and interpolation method. Two assumptions are made in order to simplify the model without losing much accuracy. First, the cross-section of each yarn is elliptical. Second, there is no 42
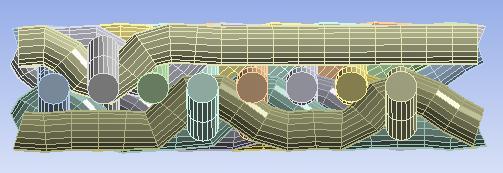
54 penetration at contact region and yarns contact perfectly at tangent plane to the line crossing two centroids at crossover point. The number of centerline nodes is determined from the number of weft yarns and warp yarns in one repeating unit. For instance, Figure 9 exhibits the configuration of two-layer fabric sample 2. This two-layer fabric structure has 16 weft yarns in one unit cell. Horizontal number from 1~8 indicates the horizontal position of each weft yarn and vertical number 1, 2 represent for vertical position of each weft yarn. There are at least 10 nodes to be defined for warp yarn in order to smoothly draw the curve of centerline of warp yarn. Likewise, minimum 10 nodes need to be defined along the weft yarn to smoothly draw the weft yarn. The related variables are defined as follows: The number of columns of weft yarn in one repeating unit: M The number of warp yarns in one repeating unit: N One single warp yarn could be described by a vector: (38) represents the coordinate of centerline node. Due to the periodic relationship between adjacent warp yarns, the relationship between adjacent warp yarns could be described by the following equation: (39) where stands for the periodic vector. This could be applied to weft yarns: (2M means 2 weft layers) (40) 43


55 This method could be applied to 3D modeling software such as Solidworks. All configurations of single-layer woven fabrics and two-layer woven fabrics are given in Figure 18. Single-layer fabric sample 1 Single-layer fabric sample 2 Single-layer fabric sample 3 Single-layer fabric sample 4 44
56 Single-layer fabric sample 5 Single-layer fabric sample 6 Two-layer fabric sample 1 Two-layer fabric sample 2 Two-layer fabric sample 3 45


57 Two-layer fabric sample 4 Two-layer fabric sample 5 Figure 18 3D solid model of unit cell of all fabric samples Material Property Definition The data of modulus and Poisson s ratio are used as inputs retrieved from the micro-mechanical model Meshing In order to perform the finite element analyses, the geometry of the fabric must be meshed. The only specific requirement about the mesh is that the cross section mesh at one end must be identical to that at the other end in a unit cell. This is due to the periodicity of the unit cell. The overall fabric is periodically made of repeating units. Hence, the nodes at both cross-sections at the end must be periodically related. The meshes at both cross-section ends have to be identical to ensure that the elements generated from meshing are the same. Figure 19 shows a typical mesh of cross-sections at both ends. This requirement can be achieved by the mapped face mesh with triangle and rectangle elements in Ansysworkbench. The rest of the meshing steps could follow the standard procedure of meshing in Ansysworkbench. Figures 20, 21 and 22 present the coarse, medium and fine mesh of single-layer fabric sample 1 respectively. Table 8 presents the mesh data of coarse, medium and fine mesh. 46


58 Figure 19 Schematic of the meshing of cross section by triangles and rectangles Figure 20 Coarse mesh of unit cell of single-layer fabric sample 1 47

59 Figure 21 Medium mesh of unit cell of single-layer fabric sample 1 Figure 22 Fine mesh of unit cell of single-layer fabric sample 1 Table 8 Mesh statistics Number of Nodes Number of elements Coarse mesh Medium mesh Fine mesh

60 Contact Definition Contact Pair In this case, a surface to surface contact model is used for contact behavior at crossover points. The contact pairs are defined according to the contact algorithm in ANSYS to handle the interpenetration. 3D eight-node surface-to-surface contact elements CONTA174/TARGE170 are used. CONTA174 is an 8-node element that is intended for general rigid-flexible and flexible-flexible contact analysis [60]. In studying the contact between two bodies, the surface of one body is conventionally taken as a contact surface and the surface of the other body as a target surface. For rigid-flexible contact, the contact surface is associated with the deformable body; and the target surface must be the rigid surface. For flexible-flexible contact, both contact and target surfaces are associated with deformable bodies. The contact and target surfaces constitute a "Contact Pair" (Figure 23). The yarn is considered to be flexible body, so flexible-flexible contact is applied. Figure 23 A contact pair 49
61 Frictional Model In this research, the yarn is considered to be contacted with another yarn at the crossover point and the friction effect between them sustains the stability of interlaced structure. Therefore, a Coulomb friction model is used according to Ansys contact options [60]. In the basic Coulomb friction model, two contacting surfaces can carry shear stresses. When the equivalent shear stress is less than a limit frictional stress (τ lim ), no motion occurs between the two surfaces. This state is known as sticking. The Coulomb friction model is defined as: (41) (42) where: = limit frictional stress = equivalent stress for 3D contact μ = coefficient of friction for isotropic material P = contact normal pressure b = contact cohesion Once the equivalent frictional stress exceeds τ lim, the contact and target surfaces will slide relative to each other. This state is known as sliding. The sticking/sliding calculations determine when a point transitions from sticking to sliding or vice versa. The contact cohesion provides sliding resistance even with zero normal pressure. The contact cohesion is assumed to be zero for the yarn to yarn contact. The friction coefficients in each fabric samples are experimentally measured. 50
62 Periodic Boundary Conditions Because the overall fabric is considered to be made of repeatable repeating units or representative volumes, a periodic boundary condition is imposed on the model to ensure symmetry and repeatability of the repeating unit. By applying such boundary conditions, the model is equivalent to an infinitely large fabric undergoing uniform deformation. If a large fabric needs to be modelled with non-uniform deformation as is usually the case, the unit cell model is still useful. A macroscopic model is required which takes effective properties from the unit cell model in a multi-scale modelling approach. Since this research only concentrates on the unidirectional tensile behaviour of fabrics, there is no need to use a well established macroscopic model to calculate the macroscopic behaviour. That is to say, in this particular case, periodic boundary condition serves as the equivalent function of homogenization which calculates the macroscopic response of fabrics. Figure 24 Periodicity of boundary of a yarn [57] Figure 24 illustrates a section of a periodic yarn, where the yarn is repeatable along the repeat vector P. Nodes A i and B i lie on opposite sides of the yarn section. Their positions are initially related by the following equation: (43) 51
63 Where B i is the coordinates of points on one surface, A i is the coordinates of points on another surface and is the periodicity vector. This is a requirement for applying periodic boundary conditions and it is a consideration to be taken into account when the mesh is generated for the yarn Derivation of Periodic Boundary Conditions The global constitutive law describes the relation between macroscopic stresses ( ) and strains (E) which are defined as volumetric averages of the relevant microscopic stresses (σ) and strains (ε) respectively: (44) (45) The microscopic stress and strain fields must fulfill the periodicity of the heterogeneous material [61-62]. This principle can be expressed by the following equation: (46) where: = a rigid displacement of the unit cell = anti-symmetric tensor related to the small rigid rotation of the unit cell = position vector in the RV = periodic part of microscopic displacement field For the problem of elastic behavior of unit cell, Equation 46 could be further simplified to: (47) 52
![(48) Then we get: (49) The equation could be further rearranged into [62]: (50) ε ε (51) where and are displacement vector of corresponding nodes on the surfaces of one side and the other,](/docs-images/73/69327416/images/64-0.jpg "respectively. is average strain tensor applied on the repeating unit, is the periodicity vector. The periodic boundary conditions can be set up by constraint equations in Ansys [60].")
64 (48) Then we get: (49) The equation could be further rearranged into [62]: (50) ε ε (51) where and are displacement vector of corresponding nodes on the surfaces of one side and the other, respectively. is average strain tensor applied on the repeating unit, is the periodicity vector. The periodic boundary conditions can be set up by constraint equations in Ansys [60]. Detailed information is given in the following. Equation (50) is a more general form of Equation (49) in mechanical model Implementation of Boundary Conditions There two types of boundary conditions defined for the unit cell. The first one is actually the displacement constraints on the edge in order to make the convergence of solution easier. In particular, nodes on the edge have no displacement along the y axis while fabric is subjected to tension along the x axis. This can be achieved by specifying the displacements along the y axis to be zero (Figure 25). Figure 25 Displacement constraints on the edge 53
. E stands for macroscopic strain tensor of the fabric Figure 26 Periodic boundary conditions on the single-layer fabric sample 5 2.3.3 Macro-Mechanical Modeling As discussed previously, there is no need to apply a specific macro-mechanical model for the calculation of macro-mechanical behavior.")
65 The second one is periodic boundary condition which could be implemented as follows: U 1 -U 2 =E(X 1 -X 2 ) (52) U 3 -U 4 =E(X 3 -X 4 ) (53) where U 1, U 2, U 3, and U 4 are displacement vectors of points on the edges of 1, 2, 3, and 4 respectively (Figure 26). E stands for macroscopic strain tensor of the fabric Figure 26 Periodic boundary conditions on the single-layer fabric sample Macro-Mechanical Modeling As discussed previously, there is no need to apply a specific macro-mechanical model for the calculation of macro-mechanical behavior. The macro-mechanical behavior can be obtained from the meso-mechanical model as long as the boundary conditions are appropriately established. On the macro-scale level, the fabric is considered as homogeneous material which can be described by the constitutive equation between macro strains E and macro-stresses : (54) The aim of macro-mechanical model is to find macro-stiffness matrix C. The solution to this question is actually the homogenization process. The homogenization process is 54
66 approached by considering the unit cell of a textile as a repetitive part of an infinite array of identical cells [1, 35, ]. Then the meso-mechanical modeling of unit cell can calculate the stiffness matrix C c of infinite array of identical cells through the appropriate periodic boundary conditions with given macro strain E. The macro stress can be calculated by volumetric average of microscopic stresses throughout the unit cell. 2.4 Results and Analysis Figures exhibit the contour of stress distribution throughout the unit cell under undeformed state and 10% deformed state in unidirectional tension for single-layer and two-layer fabrics. It is clearly indicated that stress concentration occurred at crossover points. The middle part between the edge and crossover point has less stress concentration than the crossover point. The positions at the crossover points in the fabric structure have the highest possibility to break or deform. Moreover, the translation of stress from weft yarns to warp yarns of single-layer fabrics and warp yarns to weft yarns of two-layer fabrics at the contact region can be observed. The detailed stress distribution indicates that stress from tensile force is translated to the yarns in perpendicular direction through the crossover points. This information could be further used for fracture analysis and ballistic resistance. Figure show the comparison between simulation data and experimental data. Generally speaking, the simulation data agreed well with the experimental data at initial stage, i.e. below 40%~50% of total deformation. However, the variation between simulation and experimental data is continuously increasing with growing deformation. This is probably due to the fact that the solid yarn is going to have plastic deformation at certain point which no longer indicates linear tensile behavior. Another reason is probably the simplification by 55
67 using isotropic properties instead of anisotropic properties. However, since this work mainly focuses on the mechanical properties under unidirectional tensile tests, the assumption of isotropic properties does not affect the simulation results much. Isotropic property assumption is a reasonable choice to simplify the model without losing the accuracy in the simulation. There are variations between contact simulations and actual contact conditions, which could also result in the inaccuracy of the model. The warp direction usually has higher force to extension ratio because the warp yarn has higher modulus than filling yarn. Even though the number of weft yarns is more than the number of warp yarns, the slope of force to extension in warp direction is still higher than the slope in weft direction. The initial modulus dominates unidirectional tensile property. 56
 and 10% deformed state (bottom) in the warp")
68 Figure 27 The contour of stress distribution throughout the unit cell of single-layer fabric sample 1 in undeformed state (top) and 10% deformed state (bottom) in the warp direction 57

 in the warp")
69 Figure 28 The contour of stress distribution throughout the unit cell of single-layer fabric 2 in undeformed state (top) and 10% deformed state (bottom) in the warp direction 58
70 Figure 29 The contour of stress distribution throughout the unit cell of single-layer fabric 3 in undeformed state (top) and 10% deformed state (bottom) in the warp direction 59

 in the weft")
71 Figure 30 The contour of stress distribution throughout the unit cell of single-layer fabric 4 in undeformed state (top) and 10% deformed state (bottom) in the weft direction 60
 and 10% deformed state (bottom) in the warp direction")
72 Figure 31 The contour of stress distribution throughout the unit cell of single-layer fabric 5 in undeformed state (top) and 10% deformed state (bottom) in the warp direction 61

 in the weft")
73 Figure 32 The contour of stress distribution throughout the unit cell of single-layer fabric 6 in undeformed state (top) and 10% deformed state (bottom) in the weft direction 62
74 Figure 33 The contour of stress distribution throughout the unit cell of two-layer fabric 1 in undeformed state (top) and 10% deformed state (bottom) warp direction 63
 and 10% deformed state (bottom) warp direction")
75 Figure 34 The contour of stress distribution throughout the unit cell of two-layer fabric 2 in undeformed state (top) and 10% deformed state (bottom) warp direction 64
 and 10% deformed state (bottom) warp direction")
76 Figure 35 The contour of stress distribution throughout the unit cell of two-layer fabric 3 in undeformed state (top) and 10% deformed state (bottom) warp direction 65
77 Figure 36 The contour of stress distribution throughout the unit cell of two-layer fabric 4 in undeformed state (top) and 10% deformed state (bottom) warp direction 66
 and 10% deformed state (bottom) warp direction")
78 Figure 37 The contour of stress distribution throughout the unit cell of two-layer fabric 5 in undeformed state (top) and 10% deformed state (bottom) warp direction 67
79 Force(N) Force(N) Extension(mm) Figure 38 Comparison between experimental data and simulation data of single-layer fabric sample 1 (1: simulation data in warp direction, 2: experimental data for warp direction, 3: simulation data in weft direction, 4: experimental data in weft direction) Extension(mm) Figure 39 Comparison between experimental data and simulation data of single-layer fabric sample 2 (1: simulation data in warp direction, 2: experimental data for warp direction, 3: simulation data in weft direction, 4: experimental data in weft direction) 68
80 Force(N) Force(N) Extension(N) Figure 40 Comparison between experimental data and simulation data of single-layer fabric sample 3 (1: simulation data in warp direction, 2: experimental data for warp direction, 3: simulation data in weft direction, 4: experimental data in weft direction) Extension(mm) Figure 41 Comparison between experimental data and simulation data of single-layer fabric sample 4 (1: simulation data in warp direction, 2: experimental data for warp direction, 3: simulation data in weft direction, 4: experimental data in weft direction) 69
81 Force(N) Force(N) Extension(mm) Figure 42 Comparison between experimental data and simulation data of single-layer fabric sample 5 (1: simulation data in warp direction, 2: experimental data for warp direction, 3: simulation data in weft direction, 4: experimental data in weft direction) Extension(mm) Figure 43 Comparison between experimental data and simulation data of single-layer fabric sample 6 (1: simulation data in warp direction, 2: experimental data for warp direction, 3: simulation data in weft direction, 4: experimental data in weft direction) 70
82 Force(N) Force(N) Extension(mm) Figure 44 Comparison between experimental data and simulation data of two-layer fabric sample 1 (1: simulation data in warp direction, 2: experimental data for warp direction, 3: simulation data in weft direction, 4: experimental data in weft direction) Extension(mm) Figure 45 Comparison between experimental data and simulation data of two-layer fabric sample 2 (1: simulation data in warp direction, 2: experimental data for warp direction, 3: simulation data in weft direction, 4: experimental data in weft direction) 71
83 Force(N) Force(N) Extension(mm) Figure 46 Comparison between experimental data and simulation data of two-layer fabric sample 3 (1: simulation data in warp direction, 2: experimental data for warp direction, 3: simulation data in weft direction, 4: experimental data in weft direction) Extension(mm) Figure 47 Comparison between experimental data and simulation data of two-layer fabric sample 4 (1: simulation data in warp direction, 2: experimental data for warp direction, 3: simulation data in weft direction, 4: experimental data in weft direction) 72
84 Force(N) Extension(mm) Figure 48 Comparison between experimental data and simulation data of two-layer fabric sample 5 (1: simulation data in warp direction, 2: experimental data for warp direction, 3: simulation data in weft direction, 4: experimental data in weft direction) 2.5 Conclusions A mechanical model is built to simulate tensile behavior of monofilament woven fabrics. The model is based on the multi-level mechanical theory in which the properties of the yarn and geometry of the repeating unit are taken into account. A generative model is used to efficiently generate the 3D solid model of woven fabrics. This technique can be further used to all sorts of complex fabric structures. The simulation data is in reasonably good agreement with the experimental data for all. The variation between experimental data and simulation data probably result from the difference between isotropic material property and an-isotropic material property. This model is based on FEA and shows the stress-strain field at local points. Stress concentration occurs at crossover points and stress translation takes place at crossover points, which can be further integrated into fatigue and damage analysis of fabrics and fabric reinforced composites. 73
85 Chapter 3 Mechanical Analysis of Auxetic Behavior of a Novel Braiding Tubular Structure by FEM 3.1 Literature Review Auxetic materials [63, 64] which are materials with negative Poisson s ratio, have received considerable attention over the last three decades because of their counter intuitive mechanical behavior: the auxetic material elongates in the force direction and expands perpendicularly to the force direction simultaneously. This interesting behavior has been studied and found that auxetic property could improve many fundamental bulk properties such as the indentation resistance, the shear modulus, fracture toughness and synclastic curvature [65]. The analysis of auxetic behaviour and exploration of auxetic materials demonstrated that auxetic materials exist in a wide range of fields from natural single crystals [66] and cubic metals [67] to biological materials such as skin [68] and bones [69] and synthetic materials such as foams [70], honeycomb structures [71] and composites [72]. Among all other auxetic materials discovered, synthetic auxetic materials are demonstrated to be very promising since they can be tailored for specific purpose by controlling the structure and properties. Numerous efforts has been done to scope the fundamental mechanism behind auxetic behavior. The research of crystal arsenic [73] and zeolites [74] drew a conclusion that auxetic behavior attributes to molecular bond rotation. Meanwhile, auxetic fibers demonstrated that they can be woven into technical textiles endowing the auxetic property to the overall structure. Shanahan and Piccirelli [75] fabricated woven fabric which exhibited auxetic behavior as a result of geometric effect by woven structure. Ugbolue et al. [76] invented a 74
86 knitted textile structure by carefully knitting the structure resulting in a Poisson s ratio of -0.6 over the fabric width. Hall et al. [77] successfully produced carbon nanotube sheets with an in-plane Poisson s ratio as low as a -0.2 by combination of single and multi-walled carbon nanotubes. Auxetic yarn structure was fabricated by Hook et al. [1] by wrapping a monofilament yarn with higher modulus and smaller diameter onto another yarn with lower modulus and larger diameter. This helical structure of combination of two separate yarns indicated a net increase in the width of the structure when subjected to a tensile load. Miller et al. [78] used helical auxetic yarns in weaving to manufacture a woven fabric made of helical auxetic yarns and tested the respective mechanical properties. In this research, a tubular fabric structure with auxetic behavior was made by braiding. Moreover, a finite element model of this tubular fabric structure was built for the analysis of auxetic behavior. 3.2 Material Preparation Two polyester yarns were prepared for the manufacture of helical auxetic yarn. One polyester yarn has much higher modulus and smaller diameter than the other. The auxetic yarn was manufactured on the braiding machine and then helical auxetic yarns were used as yarn component to fabricate the tubular braided structure by braiding. The modulus of warp yarn and core yarn are tested according to the ASTM D Monofilament. The data are given in Table 9. 75

87 Table 9 Mechanical properties of wrap and core yarns as component of the helical auxetic yarn Core Wrap Young s modulus (MPa) Ultimate strength (MPa) Strain at break (%) Approach The auxetic yarn is manufactured on braiding machine. The core yarn is inserted in the system taking place of the position of mandrel in the middle of the braiding machine. The core yarn is stationary. The wrap is wrapped onto the core yarn with spindle. An illustration of the manufacture process is given in Figure 49. Figure 50 presents one spindle rotating in the trajectory. Figure 51 shows the braiding machine used. Figure 49 Schematic of manufacture of helical auxetic yarn Figure 50 The cross sectional view of rotating surface 76

, the starting angle (α) and pitch (L) are three important")

88 Figure 51 The braiding machine used The geometry of helical auxetic yarn is analyzed by microscope. According to the manufacture process of helical auxetic yarn, the diameter of core and wrap yarns (Dc and Dw), the starting angle (α) and pitch (L) are three important parameters determining the geometry (Figure 52 and 53). The data are given in Table 10. Figure 52 Geometry of a helical auxetic yarn Figure 53 Geometrical parameters Each geometric parameter is correlated by the following equations: (55) 77
89 (56) (57) (58) A c and A w are the cross sectional area of core yarn and wrap yarn in helical auxetic structure. Table 10 Geometric parameters for the auxetic yarn Core diameter (D c ) 1.32 mm Warp diameter (D w ) 0.27 mm Starting angle (θ) 17.4 Pitch (L) 13.2mm Then, the biaxial tubular structure was fabricated on the braiding where 8 spindles of helical auxetic yarns were used. A mandrel was used in the core, around which 8 spindles of auxetic yarns are rotating. Figure 54 illustrates the geometric structure of the biaxial tubular structure. Figure 55 presents the picture of biaxial tubular structure. 78


 10.")
90 Figure 54 Schematic of the biaxial tubular structure The geometry information of the biaxial tubular structure is given in Table 11. Table 11 Geometry of the biaxial tubular structure Starting angle 47 Pitch (mm) Mandrel diameter (mm) Figure 55 The biaxial tubular structure 79
91 3.4 Analysis of the Properties by FEM The original purpose of the biaxial tubular fabric was to fabricate a novel 3D structure with variable permeability on the surface. This characteristic is achieved through the auxetic behavior of auxetic yarns in the biaxial tubular structure. Theoretically speaking, the increase of width of auxetic yarns in the structure would change the open area on the surface leading to variable permeability. The permeability can be quantified by measurement of open area on the surface under different longitudinal strain. The area of open surface can be measured by the universal mechanical test machine associated with a camera device while the biaxial structure is subjected to tensile loading. Then the curve of the open surface area versus longitudinal strain can be drawn according to the experimental data. The FEM model of the biaxial tubular structure is built to calculate the open surface area under different longitudinal strain. The results were validated by comparing the experimental data and simulation data. The objective of FEM model of biaxial tubular structure is to obtain the open surface area as a function of longitudinal strain. The change of the open surface area is due to three parameters: the Poisson s ratio of helical auxetic yarn, the edge length of unit cell and the angle between the two cross yarns Micro-Mechanical Model The micro-mechanical model of biaxial tubular structure is to simulate the mechanical properties of the helical auxetic yarn. An FEM model of the auxetic yarn is established. The 3D solid geometry model is made according to the geometric data experimentally measured. The same generative modeling technique in Chapter 2 is employed here for the 3D construction of the helical auxetic yarn. Figure 56 shows the 3D solid geometry of the helical 80


92 auxetic yarn. Figure 56 3D solid model of the helical auxetic yarn The material is defined as isotropic material. The boundary conditions to simulate the tensile test are derived from the compatibility of equations on the two ends. The boundary conditions are given in the following equations. U ac =U aw =U (59) U bc =U bw =-U (60) where U is the prescribed displacement which can be defined in an incremental form. The FEM model is established such that the stress σ is determined with strain U prescribed. Then the stress-strain curve of auxetic yarn can be obtained and validated by comparison with experimental data. The implementation of boundary conditions is illustrated in Figure 57. Figure 58 shows the contour of stress distribution of helical auxetic yarn before and after the deformation. The simulation and experimental data are exhibited in Figure 59. The simulation data is fit quite well with the experimental data below the strain point at around The inaccuracy of simulation data increased probably due to the plastic deformation and the rough contact algorithm. 81
 and after (down) deformation 70 60 50")

93 Stress(MPa) Figure 57 Application of boundary conditions Figure 58 The contour of stress distribution before (up) and after (down) deformation Experimental data Simulation data Strain Figure 59 Comparison between simulation data and experimental data for tensile property 82
94 Stress (Mpa) It is indicated in Figure 59 that the mechanical property of auxetic yarn is highly non-linear. Therefore, a bilinear isotropic property is defined for the material property of auxetic yarn. The stress-strain curve is divided into two parts by the onset point where the slope of the curve is changed abruptly. The turning of the curves can also be considered as the yield point. The first part is fitted with a linear function which represents the linear isotropic property; the second part is also fitted with another linear function which represents the plastic behaviour (Figure 60). These two linear functions are used to define the material property of the helical auxetic yarn in the meso-mechanical model y = 2E+08x + 2E y = 5.67E+08x First part Second part Strain Figure 60 Curve fitting with bilinear function After the stress-strain property of the helical auxetic yarn is obtained from the simulation, a 3D solid cylinder model with modified diameter is generated to represent the helical auxetic yarn (Figure 61). The modified diameter is given in the following equation: (61) 83

95 Figure 61 Representation of helical auxetic yarn Then, the only mechanical property left for the helical auxetic yarn is the Poisson s ratio. A Poisson s ratio has to be no more than 0.5 for the linear isotropic part. According to the geometry of the modified yarn, the overall lateral strain is the sum of wrap yarn s lateral strain and core yarn s lateral strain. The Poisson s ratio for the linear isotropic property of the helical auxetic yarn can be calculated by considering the laminate theory of parallel structures in the following equation: (62) where and stand for the Poisson s ratio of wrap yarn and core yarn. Furthermore, the probe can be defined in the FEM to measure the lowest position and highest position in transverse direction of the helical auxetic yarn, which gives the strain in transverse ( ) direction. Then the Poisson s ratio can be calculated by Equation (63). The curves of the Poisson s ratio versus longitudinal strain of the warp yarn, the core yarn, the experimental data of HAY and the simulation data of HAY are given in Figure 62. (63) 84
96 Poisson's ratio Longitudinal strain Experimental data of HAY Warp core Simulation data of HAY Figure 62 Poisson s ratio versus longitudinal strain Meso-Mechanical Model Geometry of unit cell of the biaxial tubular structure The biaxial tubular structure can be considered as a 2D interlaced fabric sheet by unwinding the structure. The periodic representative volume is a 2 2 plain woven structure with a certain angle between the warp and weft yarn at crossing point. The 3D solid geometric is generated by the same generative modelling technique used for woven fabrics. The geometry information of the unit cell of biaxial tubular structure is measured by microscope. It must be clarified that the crossing angle between the two interlaced yarns is 2Ɵ, which is continuously changing while the shear force is increasing. Figure 63 shows the 3D solid model of the unit cell. 85


97 Figure 63 3D solid model of the unit cell Simulation The tensile test of the biaxial tubular structure along the longitudinal direction is considered to be equivalent to pure shear test. The relationship between the longitudinal force and shear force is illustrated in Figure 64 and given in the following equations. (64) (65) Figure 64 Illustration of tension and shear The periodic boundary conditions are still valid for the unit cell of biaxial tubular structure due to the periodicity of the unit cell while the overall structure is subjected to deformation. In particular, periodic boundary conditions can be substituted by the boundary conditions of prescribed forces on the edges of unit cell. The nodes on both edges of one yarn have exactly the opposite forces to have periodicity. The displacement in x axis must be zero 86
 where is the macro strain tensor which can be defined as an incremental form.")
98 to avoid rigid body displacement. Figure 65 shows the application of boundary conditions. The boundary conditions in terms of displacements are given in the following equation: (66) where is the macro strain tensor which can be defined as an incremental form. This could be further transformed into the boundary condition in the form of forces: (67) where are four pairs of opposite forces which can be defined in Ansysworkbench. In addition, the condition is applied at the cross over point (Figure 65) to avoid the rigid displacement. A bonded tie contact is defined at each cross over point. 3.5 Results and Discussion Figure 65 Application of boundary conditions The shear deformation can be calculated by angle between the crossing yarns. (68) where is the change of angle, is the angle after deformation and is the angle before deformation It is assumed that the shape of the unit cell is always a parallelogram regardless of different crossing angles. According to the geometry of the unit cell (Figure 66), the open 87

99 area (A) is: (69) Figure 66 Geometry of the unit cell Suppose the edge length at a given tensile force F is ; then the final edge length l is given by the following equation: (70) where is the lateral strain of the helical auxetic yarn, is the displacement of the width of the helical auxetic yarn, is the displacement projected on hte axis direction of the helical auxetic yarn, resulted from the increase of width of the helical auxetic yarn under tension. The value and can be calculated from the FEM model of the unit cell as a function of incremental tensile force F. The lateral strain is a function of the longitudinal strain which equals to: (71) The initial length was l 0 = 9.83 mm 88
 Experimental data of open area (mm 2) Model data of open area (mm 2) 0 0 100 200 300 400 500 Force (N) Figure 68 Experimental data and simulation results of each parameter Figure 67")

100 Figure 67 The contour of stress distribution before deformation (left) and after deformation (right) Crossing angle (Degree) Unmodified edge length (mm) Modified edge length (mm) Experimental data of open area (mm 2) Model data of open area (mm 2) Force (N) Figure 68 Experimental data and simulation results of each parameter Figure 67 presents the contour of stress distribution before deformation and after deformation. Figure 68 shows the final results of the model. It is clearly observed that the open area is decreased while the structure is subjected to incremental tension. The experimental data of open area versus axial force indicates that the open area is going to decrease at the beginning stage and then gradually increase after the lowest point at around 250 N. This phenomenon can be explained by the combination effect of auxetic behaviour of the helical auxetic yarn and the decrease of the crossing angle under axial tension. The 89
EFFECT OF YARN CROSS-SECTIONAL SHAPES AND CRIMP ON THE MECHANICAL PROPERTIES OF 3D WOVEN COMPOSITES
 EFFECT OF YARN CROSS-SECTIONAL SHAPES AND CRIMP ON THE MECHANICAL PROPERTIES OF 3D WOVEN COMPOSITES S. Kari, M. Kumar, I.A. Jones, N.A. Warrior and A.C. Long Division of Materials, Mechanics & Structures,
MOULDABILITY OF ANGLE INTERLOCK FABRICS
 FPCM-9 (2008) The 9 th International Conference on Flow Processes in Composite Materials Montréal (Québec), Canada 8 ~ 10 July 2008 MOULDABILITY OF ANGLE INTERLOCK FABRICS François Boussu 1, 3, Xavier
GEOMETRICAL MODELLING OF 3D INTERLOCK FABRIC ABSTRACT
 GEOMETRICAL MODELLING OF 3D INTERLOCK FABRIC Saad NAUMAN, François BOUSSU, Xavier LEGRAND and Vladan KONCAR Univ. Lille North of France, F-59100, ROUBAIX, ENSAIT, GEMTEX saad.nauman@ensait.fr, francois.boussu@ensait.fr
HYBRID REINFORCING FABRICS FOR ADVANCED POLYMERIC COMPOSITES
 HYBRID REINFORCING FABRICS FOR ADVANCED POLYMERIC COMPOSITES NICOLAE TARANU 1, LILIANA BEJAN 2, GEORGE TARANU 1, MIHAI BUDESCU 1 1 Technical University Gh. Asachi Iasi, Department Civil Engineering B.dul
GEOMETRIC MODELING OF WIRE ROPE
 International Journal of Technical Innovation in Modern Engineering & Science (IJTIMES) Impact Factor: 5.22 (SJIF-217), e-issn: 2455-2585 Volume 4, Issue 8, August-218 GEOMETRIC MODELING OF WIRE ROPE Krishan
Nonlinear behavior of Reinforced Concrete Infilled Frames using ATENA 2D
 Available online at www.ijacskros.com Indian Journal of Advances in Chemical Science S1 (2016) 173-178 Nonlinear behavior of Reinforced Concrete Infilled Frames using ATENA 2D M. D. Raghavendra Prasad,
Geometrical parameters of yarn cross-section in plain woven fabric
 Indian Journal of Fibre & Textile Research Vol. 38, June 2013, pp. 126-131 Geometrical parameters of yarn cross-section in plain woven fabric Siavash Afrashteh 1,a, Ali Akbar Merati 2 & Ali Asghar Asgharian
FINITE ELEMENT MODELLING FOR TENSILE BEHAVIOUR OF THERMALLY BONDED NONWOVEN FABRIC
 FINITE ELEMENT MODELLING FOR TENSILE BEHAVIOUR OF THERMALLY BONDED NONWOVEN FABRIC Xiaoping Gao*, Liping Wang Inner Mongolia University of Technology, College of Light Industry and Textile, Hohhot, Inner
Introduction. Fig. 1. Structure of warp (a) and weft (b) knitted fabrics (picture from [4]) (Received 10 April 2012; accepted 14 May 2012)
![Introduction. Fig. 1. Structure of warp (a) and weft (b) knitted fabrics (picture from [4]) (Received 10 April 2012; accepted 14 May 2012)](/thumbs/94/118280216.jpg "Introduction. Fig. 1. Structure of warp (a) and weft (b) knitted fabrics (picture from [4]) (Received 10 April 2012; accepted 14 May 2012)") 794. Characterization of mechanical properties by inverse technique for composite reinforced by knitted fabric. Part 1. Material modeling and direct experimental evaluation of mechanical properties O.
794. Characterization of mechanical properties by inverse technique for composite reinforced by knitted fabric. Part 1. Material modeling and direct experimental evaluation of mechanical properties O.
Electronic supplementary material
 Electronic supplementary material Three-dimensionally Deformable, Highly Stretchable, Permeable, Durable and Washable Fabric Circuit Boards Qiao Li 1, and Xiao Ming Tao 1,2 * 1 Institute of Textiles and
SIMULATION OF 3D OVERBRAIDING SOLUTIONS AND CHALLENGES
 SIMULATION OF 3D OVERBRAIDING SOLUTIONS AND CHALLENGES Guido Grave August Herzog Maschinenfabrik GmbH & Co. KG Am Alexanderhaus 160, D-26127 Oldenburg info@herzog-online.com Karin Birkefeld, Tjark von
An Investigation of Optimal Pitch Selection to Reduce Self-Loosening of Threaded Fastener under Transverse Loading
 IJSTE - International Journal of Science Technology & Engineering Volume 3 Issue 01 July 2016 ISSN (online): 2349-784X An Investigation of Optimal Pitch Selection to Reduce Self-Loosening of Threaded Fastener
Numerical Modeling of Friction Effects on the Ballistic Impact Response of Single-Ply Tri-Axial Braided Fabric
 9 th International LS-DYNA Users Conference Impact Analysis (1) Numerical Modeling of Friction Effects on the Ballistic Impact Response of Single-Ply Tri-Axial Braided Fabric Daihua Zheng, Wieslaw K. Binienda,
Finite Element Analysis of Multi-Fastened Bolted Joint Connecting Composite Components in Aircraft Structures
 Finite Element Analysis of Multi-Fastened Bolted Joint Connecting Composite Components in Aircraft Structures Dr. M Satyanarayana Gupta Professor & HoD, Dept. of Aeronautical Engineering MLRIT, Hyderabad.
Module 2 WAVE PROPAGATION (Lectures 7 to 9)
") Module 2 WAVE PROPAGATION (Lectures 7 to 9) Lecture 9 Topics 2.4 WAVES IN A LAYERED BODY 2.4.1 One-dimensional case: material boundary in an infinite rod 2.4.2 Three dimensional case: inclined waves 2.5
Module 2 WAVE PROPAGATION (Lectures 7 to 9) Lecture 9 Topics 2.4 WAVES IN A LAYERED BODY 2.4.1 One-dimensional case: material boundary in an infinite rod 2.4.2 Three dimensional case: inclined waves 2.5
ANALYSIS OF LATERAL STIFFNESS FOR INFILLED FRAME WITH OPENING
 ANALYSIS OF LATERAL STIFFNESS FOR INFILLED FRAME WITH OPENING A.S. KASNALE 1 & SANJAY JAMKAR 2 Professor in Civil Engineering Department, M.S. Bidve Engineering College, Latur, India Professor in Civil
Finite Element Study of Using Concrete Tie Beams to Reduce Differential Settlement Between Footings
 Finite Element Study of Using Concrete Tie Beams to Reduce Differential Settlement Between Footings AMIN H. ALMASRI* AND ZIAD N. TAQIEDDIN** *Assistant Professor, Department of Civil Engineering, Jordan
AN INNOVATIVE FEA METHODOLOGY FOR MODELING FASTENERS
 AN INNOVATIVE FEA METHODOLOGY FOR MODELING FASTENERS MacArthur L. Stewart 1 1 Assistant Professor, Mechanical Engineering Technology Department, Eastern Michigan University, MI, USA Abstract Abstract Researchers
Stress Analysis of Flanged Joint Using Finite Element Method
 Stress Analysis of Flanged Joint Using Finite Element Method Shivaji G. Chavan Assistant Professor, Mechanical Engineering Department, Finolex Academy of Management and Technology, Ratnagiri, Maharashtra,
EFFECTS OF GEOMETRY ON MECHANICAL BEHAVIOR OF DOVETAIL CONNECTION
 EFFECTS OF GEOMETRY ON MECHANICAL BEHAVIOR OF DOVETAIL CONNECTION Gi Young Jeong 1, Moon-Jae Park 2, KweonHwan Hwang 3, Joo-Saeng Park 2 ABSTRACT: The goal of this study is to analyze the effects of geometric
ASSESSMENT OF COMPOSITES REINFORCED WITH INNOVATIVE 3D WOVEN HOLLOW FABRICS
 Munich, Germany, 26-30 th June 2016 1 ASSESSMENT OF COMPOSITES REINFORCED WITH INNOVATIVE 3D WOVEN HOLLOW FABRICS R. Geerinck 1, I. De Baere 1, G. De Clercq 2, J. Ivens 3 and J. Degrieck 1 1 Department
DCB TEST SIMULATION OF STITCHED CFRP LAMINATES USING INTERLAMINAR TENSION TEST RESULTS
 16 TH INTERNATIONAL CONFERENCE ON COMPOSITE MATERIALS DCB TEST SIMULATION OF STITCHED CFRP LAMINATES USING INTERLAMINAR TENSION TEST RESULTS Kozue Nakane*, Naoyuki Watanabe*, Yutaka Iwahori** *Tokyo Metropolitan
DESIGN OPTIMISATION OF 3D WOVEN T-JOINT REINFORCEMENTS
 st International Conference on Composite Materials Xi an, 0- th August 07 DESIGN OPTIMISATION OF D WOVEN T-JOINT REINFORCEMENTS Shibo Yan, Andrew Long and Xuesen Zeng Polymer Composites Group, Faculty
Effect of Sett and Construction on Uniaxial Tensile Properties of Woven Fabrics
 Effect of Sett and Construction on Uniaxial Tensile Properties of Woven Fabrics Prabir Kumar Banerjee, Ph.D, Swapna Mishra, Thiyagarajan Ramkumar Indian Institute of Technology, New Delhi, INDIA Correspondence
Prying of a Large Span Base Plate Undergoing a Moment Load Applied by a Round Pier
 Prying of a Large Span Base Plate Undergoing a Moment Load Applied by a Round Pier by Anastasia Wickeler A thesis submitted in conformity with the requirements for the degree of Masters of Applied Science
An Efficient Method for Geometric Modeling of 3D Braided Composites
 An Efficient Method for Geometric Modeling of 3D Braided Composites Qi Wang 1, Ronghua Zhang, Jianming Wang 1, Yanan Jiao 3, Xiaohui Yang 1, Ming Ma 3 1 School of Electronics and Information Engineering,
DYNAMIC SIMULATION OF 3D WEAVING PROCESS XIAOYAN YANG. B.S., Tianjin University, China 2008 AN ABSTRACT OF A DISSERTATION
 DYNAMIC SIMULATION OF 3D WEAVING PROCESS by XIAOYAN YANG B.S., Tianjin University, China 2008 AN ABSTRACT OF A DISSERTATION submitted in partial fulfillment of the requirements for the degree DOCTOR OF
Mechanical Properties of Glass Fiber Composites Reinforced by Textile Fabric
 Environment. Technology. Resources, Rezekne, Latvia Proceedings of the 1 th International Scientific and Practical Conference. Volume I, 133-138 Mechanical Properties of Glass Fiber Composites Reinforced
Low velocity impact testing and computed tomography damage evaluation of layered textile composite
 University of Iowa Iowa Research Online Theses and Dissertations Spring 2014 Low velocity impact testing and computed tomography damage evaluation of layered textile composite Changpeng Song University
Experimental characterization and modeling of GF/PP commingled yarns tensile behavior
 Experimental characterization and modeling of GF/PP commingled yarns tensile behavior Jean-Emile Rocher, Samir Allaoui, Gilles Hivet, Jean Gilibert, Eric Blond To cite this version: Jean-Emile Rocher,
MODELLING AND SIMULATION OF THE MECHANICAL BEHAVIOUR OF WEFT-KNITTED FABRICS FOR TECHNICAL APPLICATIONS
 AUTEX Research Journal, Vol. 4, No1, March 24 AUTEX MODELLING AND SIMULATION OF THE MECHANICAL BEHAVIOUR OF WEFT-KNITTED FABRICS FOR TECHNICAL APPLICATIONS Part III: 2D hexagonal FEA model with non-linear
MODELLING AND SIMULATION OF THE MECHANICAL BEHAVIOUR OF WEFT-KNITTED FABRICS FOR TECHNICAL APPLICATIONS
 MODELLING AND SIMULATION OF THE MECHANICAL BEHAVIOUR OF WEFT-KNITTED FABRICS FOR TECHNICAL APPLICATIONS Part IV: 3D FEA model with a mesh of tetrahedric elements M. de Araújo, R. Fangueiro and H. Hong
KNITTABILITY OF FIBRES WITH HIGH STIFFNESS
 Submitted for presentation as a poster at Conference on Mechanics of Composite Materials in Riga June 2. KNITTABILITY OF FIBRES WITH HIGH STIFFNESS Joel Peterson +, Ellinor Vegborn +, Carl-Håkan Andersson*
Analysis of the multilayer woven fabric behaviour during the forming process. Focus on the loss of cohesion within the woven fibre network.
 Analysis of the multilayer woven fabric behaviour during the forming process. Focus on the loss of cohesion within the woven fibre network. Ahmad Rashed Labanieh a*, Christian Garnier a, Pierre Ouagne
Recent Developments in the Realistic Geometric Modelling of Textile Structures using TexGen
 Proceedings of the 1 st International Conference on Digital Technologies for the Textile Industries Manchester, UK, 5-6 September 2013 Recent Developments in the Realistic Geometric Modelling of Textile
Anisotropy of Woven Fabric Deformation after Stretching
 Ramunė Klevaitytė, *Vitalija Masteikaitė Siauliai University, Department of Mechanical Engineering, Vilniaus 141, LT-76353, Siauliai, Lithuania, E-mail: R.Klevaityte@su.lt *Kaunas University of Technology,
Development of a Numerical Technique for the Static Analysis of Bolted Joints by the FEM
 , July 3-5, 2013, London, U.K. Development of a Numerical Technique for the Static Analysis of Bolted Joints by the FEM D. Valladares, M. Carrera, L. Castejon, C. Martin Abstract The use of numerical simulation
Effect of Yarn Twist on Young s Modulus of Fully-green Composites Reinforced with Ramie Woven Fabrics ABSTRACT
 Effect of Yarn Twist on Young s Modulus of Fully-green Composites Reinforced with Ramie Woven Fabrics Rie NAKAMURA, Hiroi NOMURA 2, Koichi GODA 3 and Junji OHGI 4 23 Department of Mechanical Engineering,
NALYSIS OF STABILIZING SLOPES USING VERTICAL PILES
 NALYSIS OF STABILIZING SLOPES USING VERTICAL PILES Mahmoud S. Abdelbaki: Lecturer, Gehan E. Abdelrahman: Lecturer, Youssef G. Youssef :Assis.Lecturer, Civil Eng. Dep., Faculty of Eng., Cairo University,
A Full 3-D Finite Element Analysis of Group Interaction Effect on Laterally Loaded Piles
 Modern Applied Science; Vol. 12, No. 5; 2018 ISSN 1913-1844 E-ISSN 1913-1852 Published by Canadian Center of Science and Education A Full 3-D Finite Element Analysis of Group Interaction Effect on Laterally
Experimental investigation of crack in aluminum cantilever beam using vibration monitoring technique
 International Journal of Computational Engineering Research Vol, 04 Issue, 4 Experimental investigation of crack in aluminum cantilever beam using vibration monitoring technique 1, Akhilesh Kumar, & 2,
Drawing of Hexagonal Shapes from Cylindrical Cups
 Dr. Waleed Khalid Jawed Metallurgy & Production Engineering Department, University of Technology /Baghdad Email: Drwaleed555@yahoo.com Sabih Salman Dawood Metallurgy & Production Engineering Department,
Comparison of the Mechanical Properties Between 2D and 3D Orthogonal Woven Ramie Fiber Reinforced Polypropylene Composites
 Comparison of the Mechanical Properties Between 2D and 3D Orthogonal Woven Ramie Fiber Reinforced Polypropylene Composites Comparison of the Mechanical Properties Between 2D and 3D Orthogonal Woven Ramie
ROUND ROBIN FORMABILITY STUDY
 ROUND ROBIN FORMABILITY STUDY Characterisation of glass/polypropylene fabrics Tzvetelina Stoilova Stepan Lomov Leuven, April 2004 2 Abstract Thiereport presents results of measuring geometrical and mechanical
INFLUENCE OF PILES ON LOAD- SETTLEMENT BEHAVIOUR OF RAFT FOUNDATION
 INFLUENCE OF PILES ON LOAD- SETTLEMENT BEHAVIOUR OF RAFT FOUNDATION BALESHWAR SINGH Department of Civil Engineering Indian Institute of Technology Guwahati Guwahati 78139, India NINGOMBAM THOIBA SINGH
Stretchability of integrated conductive yarns in woven electronic textile Master s thesis
 Stretchability of integrated conductive yarns in woven electronic textile Master s thesis E.S.C. de Boer Report number: MT 12.18 Eindhoven University of Technology Department of Mechanical Engineering
VIBRATIONAL MODES OF THICK CYLINDERS OF FINITE LENGTH
 Journal of Sound and Vibration (1996) 191(5), 955 971 VIBRATIONAL MODES OF THICK CYLINDERS OF FINITE LENGTH Department of Mechanical Engineering, University of Saskatchewan, Saskatoon, Saskatchewan, Canada
Failure of Engineering Materials & Structures. Code 34. Bolted Joint s Relaxation Behavior: A FEA Study. Muhammad Abid and Saad Hussain
 Failure of Engineering Materials & Structures Code 3 UET TAXILA MECHNICAL ENGINEERING DEPARTMENT Bolted Joint s Relaxation Behavior: A FEA Study Muhammad Abid and Saad Hussain Faculty of Mechanical Engineering,
Doctoral Dissertation (Shinshu University) Study on the relationship between fabric bending rigidity and yarn properties. March 2017.
 Study on the relationship between fabric bending rigidity and yarn properties. March 2017.") Doctoral Dissertation (Shinshu University) Study on the relationship between fabric bending rigidity and yarn properties March 2017 Julie PEIFFER Abstract In this study, the relationship between fabric
Doctoral Dissertation (Shinshu University) Study on the relationship between fabric bending rigidity and yarn properties March 2017 Julie PEIFFER Abstract In this study, the relationship between fabric
Numerical Modeling of Grouted Soil Nails
 Numerical Modeling of Grouted Soil Nails Dr. Haider S. Al -Jubair Department of Civil Engineering University of Basrah-College of Engineering Basrah, Iraq Afaf A. Maki Department of Civil Engineering University
Integrated Tool for Simulation of Textile Composites
 Integrated Tool for Simulation of Textile Composites SIXTH FRAMEWORK PROGRAMME Proposal no.: 516146 Aerodays Vienna June 2006 Marinus Schouten 06-2006 EADS-Corporate Research Centre 1 General objectives
3-D Finite Element Analysis of Bolted Joint Using Helical Thread Model
 3-D Finite Element Analysis of Bolted Joint Using Helical Thread Model Shaik Gousia Yasmin 1, P. Punna Rao 2, Kondaiah Bommisetty 3 1 M.Tech(CAD/CAM), Nimra College of Engineering & Technology, Vijayawada,
Fastener Modeling for Joining Parts Modeled by Shell and Solid Elements
 2007-08 Fastener Modeling for Joining Parts Modeled by Shell and Solid Elements Aleander Rutman, Chris Boshers Spirit AeroSystems Larry Pearce, John Parady MSC.Software Corporation 2007 Americas Virtual
SIMULATION OF COMPOSITE PROPERTIES REINFORCED BY 3D SHAPED WOVEN FABRICS
 SIMULATION OF COMPOSITE PROPERTIES REINFORCED BY 3D SHAPED WOVEN FABRICS Prof. Dr.-Ing. Alexander Büsgen Prof. Dr.-Ing. Karin Finsterbusch Dipl.-Ing. (FH) Andrea Birghan Niederrhein University of Applied
THIN-WALLED HOLLOW BOLTS
 THIN-WALLED HOLLOW BOLTS Experimental and numerical study Teixeira, C. D. S. Department of Mechanical Engineering, Instituto Superior Técnico, Av. Rovisco Pais, 1049-001, Lisbon, Portugal, 2010 Abstract
Experimental and numerical investigation of tube sinking of rectangular tubes from round section
 International Journal of Engineering and Technology sciences (IJETS) ISSN 2289-4152 Academic Research Online Publisher Research Article Experimental and numerical investigation of tube sinking of rectangular
CHAPTER V SUMMARY AND CONCLUSIONS
 CHAPTER V SUMMARY AND CONCLUSIONS The new developments in the textile manufacture with various types of blends offer varieties in the market. Consumers seek not only fashionable but also have become conscious
DRAPEABILITY OF GLASS AND STEEL FIBRES KNITTED FABRICS
 THE 19 TH INTERNATIONAL CONFERENCE ON COMPOSITE MATERIALS DRAPEABILITY OF GLASS AND STEEL FIBRES KNITTED FABRICS M. Barburski 1,2*, S. V. Lomov 1, K. Vanclooster 3, I. Verpoest 1 1 KU Leuven, Department
Studies on elastane-cotton core-spun stretch yarns and fabrics: Part II Fabric low-stress mechanical characteristics
 Indian Journal of Fibre & Textile Research Vol. 38, December 2013, pp. 340-348 Studies on elastane-cotton core-spun stretch yarns and fabrics: Part II Fabric low-stress mechanical characteristics A Das
Numerical approach of the weaving process for textile composite
 THE 19 TH INTERNATIONAL CONFERENCE ON COMPOSITE MATERIALS Numerical approach of the weaving process for textile composite J. Vilfayeau 1, 2, D. Crepin 1, 3, F. Boussu 1, 3*, D. Soulat 1, 3, P. Boisse 2
Webbing 101: Properties, Materials, and Techniques
 FE AT U RE D EB OO K Webbing 101: Properties, Materials, and Techniques Benefits of 3D Woven Composites Page 2 of 6 What is Webbing? Webbing is a woven fabric that comes in a variety of material compositions,
A Hybrid Trailing Edge Control Surface Concept
 Pınar ARSLAN, Uğur KALKAN, Harun TIRAŞ, İlhan Ozan TUNÇÖZ, Yosheph YANG, Ercan GÜRSES, Melin ŞAHİN, Serkan ÖZGEN, Yavuz YAMAN Department of Aerospace Enginnering, Middle East Technical University Ankara,
CONTINUOUS-LENGTH SPREAD TOW +α /-β FABRICS
 1/7 CONTINUOUS-LENGTH SPREAD TOW +α /-β FABRICS Fredrik Ohlsson, Product Manager - Materials Dr. Nandan Khokar, R&D Manager Oxeon AB, Borås, Sweden ABSTRACT Fabrics with +α/-β orientation of spread tows
Monopile as Part of Aeroelastic Wind Turbine Simulation Code
 Monopile as Part of Aeroelastic Wind Turbine Simulation Code Rune Rubak and Jørgen Thirstrup Petersen Siemens Wind Power A/S Borupvej 16 DK-7330 Brande Denmark Abstract The influence on wind turbine design
NUMERICAL MODELLING OF THE WEAVING PROCESS FOR TEXTILE COMPOSITE
 NUMERICAL MODELLING OF THE WEAVING PROCESS FOR TEXTILE COMPOSITE Vilfayeau Jérôme 1,2,Crepin David 1,3, Boussu François 1,3 & Boisse Philippe 2 1 Ensait, Gemtex, F-59100 Roubaix, France 2 Laboratoire de
TEXTILE FILTER MEDIAS
 TEXTILE FILTER MEDIAS By: Jose M. Sentmanat, Consultant Under the broad term of FILTER MEDIAS we find Synthetic Filter Medias such as: woven filter cloths, woven and non-woven filter media and filter felts.
Finite Element Modeling of Early Stage Self-loosening of Bolted Joints Haoliang Xu 1, a, Lihua Yang 1, b,, Lie Yu 1,2, c
 International Conference on Information Sciences, Machinery, Materials and Energy (ICISMME 2015) Finite Element Modeling of Early Stage Self-loosening of Bolted Joints Haoliang Xu 1, a, Lihua Yang 1, b,,
Dynamic Fatigue of Plain Knitted Fabric
 Dynamic Fatigue of Plain Knitted Fabric Volume 5, Issue 2, Summer2006 Saber BEN ABDESSALEM, Saber ELMARZOUGUI and Faouzi SAKLI Textile Research Unit, Institute Supérieur des Etudes Technologiques de Ksar
NUMERICAL ANALYSIS OF SCREW ANCHOR FOR CONCRETE
 VIII International Conference on Fracture Mechanics of Concrete and Concrete Structures FraMCoS-8 J.G.M. Van Mier, G. Ruiz, C. Andrade, R.C. Yu and X.X. Zhang (Eds) NUMERICAL ANALYSIS OF SCREW ANCHOR FOR
A Study on the Twist Loss in Weft Yarn During Air Jet Weaving
 A Study on the Twist Loss in Weft Yarn During Air Jet Weaving Muhammad Umair, Khubab Shaker, Yasir Nawab, Abher Rasheed, Sheraz Ahmad National Textile University, Faculty of Engineering & Technology, Faisalabad,
Investigation of Woven Fiber Reinforced Laminated Composites Using a Through Transmission Ultrasonic Technique
 Photos placed in horizontal position with even amount of white space between photos and header Photos placed in horizontal position with even amount of white space between photos and header Investigation
CHAPTER 4 COMPARISON OF DYNAMIC ELASTIC BEHAVIOUR OF COTTON AND COTTON / SPANDEX KNITTED FABRICS
 31 CHAPTER 4 COMPARISON OF DYNAMIC ELASTIC BEHAVIOUR OF COTTON AND COTTON / SPANDEX KNITTED FABRICS 4.1 INTRODUCTION Elastic garments for sports and outer wear play an important role in optimizing an athletic
Dowel connections in laminated strand lumber
 Dowel connections in laminated strand lumber Cranswick, Chad J. 1, M c Gregor, Stuart I. 2 ABSTRACT Laminated strand lumber (LSL) is a relatively new structural composite lumber. As such, very limited
LOAD CARRYING CAPACITY OF METAL DOWEL TYPE CONNECTIONS OF TIMBER STRUCTURES
 Vol. 10, Issue /014, 51-60 DOI: 10.478/cee-014-0011 LOAD CARRYING CAPACITY OF METAL DOWEL TYPE CONNECTIONS OF TIMBER STRUCTURES Jozef GOCÁL 1,* 1 Department of Structures and Bridges, Faculty of Civil
Module 10 : Improvement of rock mass responses. Content
 IMPROVEMENT OF ROCK MASS RESPONSES Content 10.1 INTRODUCTION 10.2 ROCK REINFORCEMENT Rock bolts, dowels and anchors 10.3 ROCK BOLTING MECHANICS Suspension theory Beam building theory Keying theory 10.4
Simulation Research on Pistol Bullet Penetrating Gelatin Target with Soft Body Armor
 2016 International Conference on Manufacturing Science and Information Engineering (ICMSIE 2016) ISBN: 978-1-60595-325-0 Simulation Research on Pistol Bullet Penetrating Gelatin Target with Soft Body Armor
1/2/2016. Lecture Slides. Screws, Fasteners, and the Design of Nonpermanent Joints. Reasons for Non-permanent Fasteners
 Lecture Slides Screws, Fasteners, and the Design of Nonpermanent Joints Reasons for Non-permanent Fasteners Field assembly Disassembly Maintenance Adjustment 1 Introduction There are two distinct uses
Keywords: Bracing bracket connection, local deformation, selective pallet racks, shear stiffness, spine bracings.
 Send Orders for Reprints to reprints@benthamscience.ae The Open Construction and Building Technology Journal, 2015, 9, 1-6 1 Open Access Investigation of Shear Stiffness of Spine Bracing Systems in Selective
Real scale simulation of ballistic test for soft armor. Mario Michael Dippolito
 Real scale simulation of ballistic test for soft armor by Mario Michael Dippolito B.S., Kansas State University, 2000 M.S., Kansas State University, 2011 AN ABSTRACT OF A DISSERTATION submitted in partial
Model Correlation of Dynamic Non-linear Bearing Behavior in a Generator
 Model Correlation of Dynamic Non-linear Bearing Behavior in a Generator Dean Ford, Greg Holbrook, Steve Shields and Kevin Whitacre Delphi Automotive Systems, Energy & Chassis Systems Abstract Efforts to
point for needles, in mm; point for sinkers, in mm; α p angle of thread feeding, in ; wt coefficient of pitch take-up.
 Krzysztof Kowalski, Bogdan Włodarczyk, *Tomasz Marek Kowalski Department of Knitting Technology, *Computer Engineering Department, Technical University of Lodz ul. Żeromskiego 6, 9-924 Łódź, Poland E-mail:
Korean standards of visual grading and establishing allowable properties of softwood structural lumber
 Korean standards of visual grading and establishing allowable properties of softwood structural lumber Park, Moon-Jae 1, Shim, Kug-Bo 1 ABSTRACT Korean standards related to wood products such as "Sizes
EFFECT OF ADHEREND SHAPE ON STRESS CONCENTRATION REDUCTION OF ADHESIVELY BONDED SINGLE LAP JOINT
 Engineering Review, Vol. 36, Issue 1, 29-34, 16. 29 EFFECT OF ADHEREND SHAPE ON STRESS CONCENTRATION REDUCTION OF ADHESIVELY BONDED SINGLE LAP JOINT A. Çalık 1* 1 Department of Mechanical Engineering,
Simulation of the Braiding Process in LS-DYNA
 Simulation of the Braiding Process in LS-DYNA Seyedalireza Razavi 1 and Lorenzo Iannucci 1 1 Imperial College London, Department of Aeronautics, London, UK Abstract Textile braids and the over-braiding
Bagging Phenomenon on Jersey Knitted Fabrics ABSTRACT
 Bagging Phenomenon on Jersey Knitted Fabrics Feriel Bouatay and Adel Ghith Department of Textiles National Engineering School of Monastir Tunisia bouatay_feriel@hotmail.com ABSTRACT Volume 8, Issue 4,
*The type of stainless steel were 316L, the diameter of the fiber were 12 micron.
 Advanced Materials Research Submitted: 2014-07-21 ISSN: 1662-8985, Vol. 1053, pp 93-96 Accepted: 2014-07-28 doi:10.4028/www.scientific.net/amr.1053.93 Online: 2014-10-20 2014 Trans Tech Publications, Switzerland
DEVELOPMENT OF A NOVEL TOOL FOR SHEET METAL SPINNING OPERATION
 DEVELOPMENT OF A NOVEL TOOL FOR SHEET METAL SPINNING OPERATION Amit Patidar 1, B.A. Modi 2 Mechanical Engineering Department, Institute of Technology, Nirma University, Ahmedabad, India Abstract-- The
Ifluence of Yarn Texturing Technological Parameters and Fabric Structure on Tensile Properties of the Polipropylene Fabric
 ISSN 1392 1320 MATERIALS SCIENCE (MEDŽIAGOTYRA). Vol. 17, No. 2. 2011 Ifluence of Yarn Texturing Technological Parameters and Fabric Structure on Tensile Properties of the Polipropylene Fabric Raimundas
FEA of textiles and textile composites: a gallery
 FEA of textiles and textile composites: a gallery Stepan V. Lomov, Dmitry S. Ivanov, Vitaly Koissin, Ignaas Verpoest Department MTM, Katholieke Universiteit Leuven Kasteelpark Arenberg 44 B-3001 Leuven
Strength of Material-I (CE-207)
") Strength of Material-I (CE-207) Course Contents: Types of stresses and strains Statically indeterminate problems Mechanical Properties of materials Thermal stresses Advanced cases of shearing forces and
Strength of Material-I (CE-207) Course Contents: Types of stresses and strains Statically indeterminate problems Mechanical Properties of materials Thermal stresses Advanced cases of shearing forces and
Mechanical behavior of fiberglass reinforced timber joints
 Mechanical behavior of fiberglass reinforced timber joints Chen, Chi-Jen 1 ABSTRACT The objective of this research is to investigate the mechanical performance of dowel-type timber joints reinforced by
ROBUST PARAMETER DESIGN AND FINITE ELEMENT ANALYSIS FOR A NON- PNEUMATIC TIRE WITH LOW VIBRATION
 Clemson University TigerPrints All Theses Theses 12-2009 ROBUST PARAMETER DESIGN AND FINITE ELEMENT ANALYSIS FOR A NON- PNEUMATIC TIRE WITH LOW VIBRATION Amarnath Proddaturi Clemson University, aprodda@clemson.edu
Effect of seamed viscose fabrics on drape coefficient
 Ö. Yücel: Effect of seamed viscose fabrics on drape coefficient, Tekstil 61 (1-6 1-6 (12. 1 Effect of seamed viscose fabrics on drape coefficient Prof. Önder Yücel, PhD Ege University Bayindir Vocational
Engineering of Tearing Strength for Pile Fabrics
 Engineering of Tearing Strength for Pile Fabrics Kotb N. 1, El Geiheini A. 2, Salman A. 3, Abdel Samad A. 3 1. Faculty of Education, Technical Department, Helwan University, Egypt 2. Faculty of Engineering,
SIMULATION AND EXPERIMENTAL WORK OF SINGLE LAP BOLTED JOINT TESTED IN BENDING
 SIMULATION AND EXPERIMENTAL WORK OF SINGLE LAP BOLTED JOINT TESTED IN BENDING Aidy Ali *, Ting Wei Yao, Nuraini Abdul Aziz, Muhammad Yunin Hassan and Barkawi Sahari Received: Jun 13, 2007; Revised: Nov
Tension Perpendicular to Grain Strength of Wood, Laminated Veneer Lumber (LVL), and Cross-Banded LVL (LVL-C)
, and Cross-Banded LVL (LVL-C)") Tension Perpendicular to Grain Strength of Wood, Laminated Veneer Lumber (LVL), and Cross-Banded LVL (LVL-C) M. Ardalany PhD candidate, Department of Civil and Natural Resources Engineering, University
Tension Perpendicular to Grain Strength of Wood, Laminated Veneer Lumber (LVL), and Cross-Banded LVL (LVL-C) M. Ardalany PhD candidate, Department of Civil and Natural Resources Engineering, University
A novel procedure for evaluating the rotational stiffness of traditional timber joints in Taiwan
 Structural Studies, Repairs and Maintenance of Heritage Architecture IX 169 A novel procedure for evaluating the rotational stiffness of traditional timber joints in Taiwan W.-S. Chang, M.-F. Hsu & W.-C.
We are IntechOpen, the world s leading publisher of Open Access books Built by scientists, for scientists. International authors and editors
 We are IntechOpen, the world s leading publisher of Open Access books Built by scientists, for scientists 3,800 116,000 120M Open access books available International authors and editors Downloads Our
Effect of Bolt Layout on the Mechanical Behavior of Four Bolted Shear Joint
 Effect of Bolt Layout on the Mechanical Behavior of Four Bolted Shear Joint using Three Dimensional Finite Effect of Bolt Layout on the Mechanical Behavior of Four Bolted Shear Joint using Three Dimensional
THE INFLUENCE OF GEOMETRIC PARAMETERS AND MECHANICAL PROPERTIES OF ADHESIVE ON STRESS ANALYSIS IN ADHESIVELY BONDED ALUMINUM SINGLE LAP JOINT
 Mojtaba Samaei Mostafa Seifan Amir Afkar Amin Paykani ISSN 333-24 eissn 849-39 THE INFLUENCE OF GEOMETRIC PARAMETERS AND MECHANICAL PROPERTIES OF ADHESIVE ON STRESS ANALYSIS IN ADHESIVELY BONDED ALUMINUM