Pennsylvania Life Sciences Industry
|
|
|
- Richard Gary Cross
- 6 years ago
- Views:
Transcription


1 Pennsylvania Life Sciences Industry September 2017 kpmg.com
2 Prepared by: About Life Sciences Pennsylvania (LSPA) Life Sciences Pennsylvania is the statewide trade association for the life sciences in Pennsylvania and serves as a catalyst to ensure Pennsylvania is a global leader in the life sciences by developing a business and public policy environment which fosters life science growth and success. More information is available at KPMG LLP (KPMG) KPMG is an Audit, Tax and Advisory firm and the independent U.S. member firm of KPMG International Cooperative ( KPMG International ). KPMG International s independent member firms have 189,000 professionals, including more than 9,000 partners in 152 countries.
3 Disclaimers KPMG s role is limited to providing the independent analysis described in this report. KPMG cannot undertake meetings with government officials or other parties or otherwise appear in a public or private context that could be fairly interpreted as public policy advocacy, lobbying, or otherwise be perceived as impairing our independence. In presenting our results, KPMG takes no view or cannot undertake any role that could be fairly interpreted as public policy advocacy and the firm s work is not intended to be used as such or in that context. Third Party Usage: Any advice, recommendations, information, deliverables or other work product provided to LSPA under this contract is for the sole use of LSPA and is not intended to be, and may not be, relied upon by any third party, and all advice, recommendations, information, deliverables, or other work product may be marked to so indicate. This report is offered as a holistic work and should be read and interpreted only in its entirely.
4 Contents Executive summary... 1 Understanding the life sciences industry... 4 Life sciences snapshot: Pennsylvania... 5 Research excellence Academic contribution Attracting capital Economic contribution Commonwealth support Life sciences: Key trends Supply trends Demand trends External factors Disruption Methodological appendix KPMG LLP, a Delaware limited liability partnership and the U.S. member firm of the KPMG network of independent member firms affiliated with KPMG International Cooperative ( KPMG International ), a Swiss entity. All rights reserved. NDPPS The KPMG name and logo are registered trademarks or trademarks of KPMG International.
5 Executive summary Amid rapid change brought on by new forms of competition, new regulations, and innovation, the Life Sciences industry in Pennsylvania is in the process of reinventing itself. The Life Sciences industry has historically been a strong contributor to Pennsylvania s economy. Following the financial crisis, the pace of growth has slowed in the face of increased costs, heightened uncertainty, changes in regulations and risk factors, and greater demands for efficiency. These forces are reshaping the industry in new ways, forcing companies to adopt new technologies, integrate data analytics into their management and operational practices, and reassess the business models used to develop new products and deliver goods and services to the market. Employment in this industry increased on net by fewer than 1,000 jobs during the five years between 2011 and 2016, but stronger net hiring during 2015 and 2016 more than offset all of the job losses that occurred between 2011 and Innovation in Pennsylvania s Life Sciences industry has also been advancing at a rapid rate. Through increased federal funding, patent applications, and entrepreneurship, Pennsylvania maintains a lead over much of the rest of the country in terms of research and development (R&D) in Life Sciences. Compared with other states, Pennsylvania s Life Sciences industry faces several unique challenges. Two of the most important challenges center on the Commonwealth s success rate in attracting and retaining the capital needed for continued investment in Life Sciences. The first challenge is the Life Sciences: Peer states The following states represent Pennsylvania s peer states for purposes of this study: California Indiana Massachusetts Michigan New Jersey New York North Carolina These states are considered to be part of Pennsylvania s peer group because they are some of the leading states in Life Sciences, including a particular focus on research, development, and innovation. These states contain some of the most concentrated centers of Life Sciences activity relative to the national economy. attraction and retention of entrepreneurial capital. Although it is difficult to measure entrepreneurial capacity directly, anecdotal evidence suggests that a dearth of Pennsylvania-based entrepreneurs with experience in Life Sciences ventures is a limiting factor for the industry s rate of expansion in the Commonwealth. 1 The second challenge, closely related to the first, lies in the attraction of venture capital and angel investors. Compared with states such as California and Massachusetts, Pennsylvania ranks relatively lower when it comes to venture capital investment, as discussed later in the report. Although Pennsylvania boasts a favorable relative share of federal health and science research grants and 1 Information based on a series of informational interviews conducted with technology transfer program coordinators of several major Pennsylvania universities. 1
6 production of doctoral recipients in Life Sciences disciplines, the Commonwealth lags below its peers in attracting venture capital investment, securing a disproportionately lower share of capital than that flowing into companies in California and Massachusetts. Similarly, the number of patents issued for Life Sciences discoveries lags well behind Massachusetts and California. The purpose of this report is to summarize the contribution of the Life Sciences industry to the Pennsylvania economy during Below are some key findings from this study: Study s Key findings: Small Business Oriented: More than half of the Life Sciences industry establishments operating in Pennsylvania in 2016 are comprised of fewer than 10 employees. Uneven Growth: Between 2011 and 2016, Pennsylvania experienced modest Life Sciences employment growth in comparison to peer states. This is primarily due to a decline in pharmaceutical manufacturing in the Commonwealth and concurrent gains in research, testing and medical laboratories. While two peer states, New Jersey and Indiana, experienced a decline in Life Sciences industry employment over this period, all other peer states grew more rapidly than Pennsylvania. Funding Leader: Pennsylvania had the highest 2016 National Science Foundation (NSF) funding rate in comparison to peer states and was awarded the second highest NSF & National Institute of Health (NIH) funding per capita in comparison to peer states. Patented Contributions: Pennsylvania was a top contributor to innovation, boasting recipients of 4,317 patents over the prior 5 years, among the top 5 states nationally. Acclaimed Universities: The Commonwealth was home to 7 of the top 100 universities ranked in 2016 according to the Shanghai Index, including 2 universities in the top 100 Biological Sciences Program. Producing the Next Generation of Experts: Pennsylvania universities conferred a doctorate degree to 578 recipients, ranking 4th highest in the nation during A Need for Investment: During 2016, Pennsylvania only secured $147 million in venture capital (VC) funding, ranking 13 th nationally. A lack of venture capital may serve as a limiting factor for the Life Sciences industry in Pennsylvania, as companies that are unable to secure sufficient funding early in their 2
7 lifecycle may be unable to stage significant expansions necessary to become dominant in their industries. Job Provider: The Life Sciences industry in Pennsylvania directly employed 112,000 people during 2016 and was responsible indirectly for an additional 230,000 jobs through business purchases and household expenditures. Generating Output: The industry generated a total (direct and indirect) state economic output of $88.5 billion, comprised of a direct economic impact of $48.8 billion and indirect economic impact of $39.6 billion. Well Developed Support: The Commonwealth of Pennsylvania offers several supportive incentive programs across various industries which are often utilized by companies in the Life Sciences industry 3
8 Understanding the life sciences industry Life Sciences encompasses not only human health services (comprising biotechnology, pharmaceuticals, and medical devices) but also industries related to the development and application of science and technology to improving human health and the environment. Companies operating in Life Sciences are engaged in the research and development, manufacturing and commercialization of products and services that advance healthcare, and environmental management and protection. 2 Although there is no official definition of Life Sciences sector for measuring activity or economic contribution at the local, regional, or national level, this report leveraged sectors defined by the North American Industry Classification System (NAICS) 3 to create a consistent definition of Life Sciences that reflects the industry s unique contours in Pennsylvania. For the purposes of this study, the definition is heavily informed by the guiding principal that Life Sciences companies are involved directly or indirectly in biomedical or human health research, product development, and innovation. This definition of the Life Sciences value chain encompasses R&D, design and production of biotechnology, pharmaceutical and medical device products. The definition includes specific allied logistics, wholesale and technical consulting services. Together, these major value chains form the core of the Life Sciences industry s economic value added. Excluded from the definition of Life Sciences are entities whose primary activity involves the delivery of medical services (excluding hospitals, ambulatory services and offices of physicians), marketing or customer support, or consulting activities. These entities are not engaged primarily in fostering or sustaining research and innovation. In addition, primarily agricultural industries are excluded from the definition of Life Sciences. The Methodological Appendix outlines the specific NAICS codes that comprise Life Sciences for the purposes of this report. 2 Source: What is Biotechnology?, Biotechnology Innovation Organization website, as accessed on April 20, 2017; Life Sciences Ontario Sector Report 2015, 2015, Life Sciences Ontario, as accessed on April 20, NAICS is the standard system used by Federal agencies for classifying businesses. NAICS was developed by the Office of Management and Budget. 4
9 Life sciences snapshot: Pennsylvania Pennsylvania is home to a thriving Life Sciences industry. The industry is built on a foundation of small businesses across the Commonwealth and is supported by strong contributions from world-class research institutions. Collectively, these establishments constitute some of the commonwealth s leading businesses contributing both direct and indirect economic and fiscal impacts. In 2011, there were a total of 2,722 Life Sciences establishments in Pennsylvania. 4 That number grew by 4.4 percent over the five-years ending in This rate of growth is slightly below the rate of change in peer states and is below the U.S. average. In recent years, growth in Life Sciences across Pennsylvania has been accompanied by the formation of smaller firms and establishments; as a result, overall employment in Pennsylvania s Life Sciences grew on net by about 0.6 percent during the same period. From 2011 to 2016, total Life Sciences industry employment in Pennsylvania grew from 111,430 to 112,068. Total average annual pay per employee in 2016 was $137,976, increasing by 13.9 percent since The single largest sub-sector of the Pennsylvania Life Sciences industry, Research, Testing, and Medical Laboratories, employed 63,008 individuals in 2016 and was the fastest-growing subsector over the prior five-year period. This sub-sector also saw strong growth in average earnings, which increased 12.1 percent to $169,358 per employee in 2016 from $151,118 per employee in Source: Quarterly Census of Employment and Wages (QCEW), Bureau of Labor Statistics. 5


10 Figure 1: Life Sciences Snapshot 6


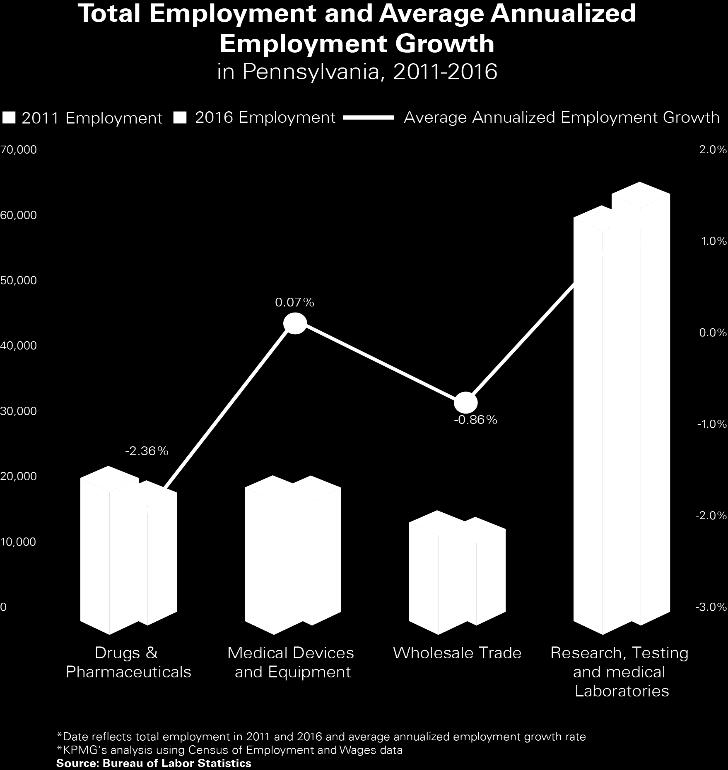
11 Pennsylvania s Life Sciences industry is a major component of the Commonwealth s industrial structure. Overall, Life Sciences comprises a larger share of Pennsylvania s economy than it does the U.S. economy as a whole. Measured using location quotients 5, Pennsylvania boasts the greatest relative concentrations of drugs and pharmaceuticals suppliers and research, testing and medical laboratories. Figure 2: Life Sciences Location Quotient Analysis In absolute terms, Pennsylvania s Life Sciences industries added fewer than 1,000 jobs on net over the 5 years spanning 2011 through 2016, but the overall trend of growth in the industry masks considerable underlying churn. Even while colleges and universities and private sector R&D organizations collectively increased Life Sciences-related employment by an estimated 3,000 jobs, much of this gain was offset by job loss among pharmaceuticals manufacturers, which shed 2,900 jobs through relocations to other states and local layoffs, a decline of almost 20.0 percent. 6 The churn evident in Pennsylvania s Life Sciences industry has also occurred in other regions of the country, but the dynamics are different. By comparison, pharmaceutical manufacturers have shed less than 2.0 percent employment nationwide during the same period, illustrating that Pennsylvania has become less attractive for pharmaceutical manufacturers compared with other regions of the country during the last five years. Concurrently, other segments of the Life Sciences industry have managed to 5 A location quotient is used to measure the relative concentration of an industry in a geographic region, with a larger location quotient indicating a greater relative concentration. The location quotients included in this report are calculated based on employment from the U.S. Bureau of Labor Statistics. 6 Source: Bureau of Labor Statistics. 7

12 increase their concentration in Pennsylvania. Although much smaller in size than their pharmaceutical cousins, electrotherapeutic apparatus manufacturing, testing and research laboratories, and colleges and universities are expanding in Pennsylvania faster than the national average. Moreover, even as pharmaceutical manufacturers have downsized their local workforces, younger companies developing new therapies for treating patients with a wide variety of diseases are gradually expanding in the space vacated by shrinking pharmaceutical giants. Reflecting growth in contract research locally, employment has also increased in biotechnology R&D, testing laboratories, and other physical and biological research. In addition to a high concentration of Life Sciences firms and establishments in the greater Philadelphia and Pittsburgh metro areas, there is a substantial industry presence across the Commonwealth as illustrated in the figure below. Figure 3: Distribution of Pennsylvania Life Sciences Establishments 7 7 White dots indicate the geographic location of firms with NAICS codes corresponding to one of the NAICS codes used in this report to define the Life Sciences industry in Pennsylvania. Data based on Dun & Bradstreet data available as of 2017 second quarter. 8

13 Interestingly, more than half of the Life Sciences industry establishments operating in Pennsylvania in 2016 are comprised of fewer than 10 employees. Conversely, fewer than 1.0 percent in the Pennsylvania Life Sciences industry employ more than 1,000 individuals as captured in the figure below. Figure 4: Establishments by Size 9
.")
14 Research excellence Pennsylvania is a national Life Sciences research leader and one of the most prominent states active in the industry. Figure 5: NSF Funding, by State In 2016 Pennsylvania businesses, universities, and establishments received $27.9 million in funding from the National Science Foundation (NSF). This makes Pennsylvania one of the highest NSF funded states in the nation. In addition, Pennsylvania had the highest 2016 NSF funding rate 8 in comparison to peer states. Although states like California and New York received considerably more NSF funding, 8 The funding rate, sometimes referred to as success rate, is calculated by the number of competitive awards made during a year divided by the number of total proposals competitively reviewed. 10

 Pennsylvania establishments also receive significant National Institute of Health (NIH) funding relative to other states.")
15 Pennsylvania s approximately 32.0 percent funding rate (meaning 32.0 percent of total NSF proposals receive an award) exceeded that of its peers. Figure 6: NSF Funding Rate, by State Similar to other states, much of Pennsylvania s NSF funding can be attributed to universities, with Penn State responsible for about 50.0 percent, or about $11.6 million of the total university NSF funding of $23.2 million in Pennsylvania in Figure 7: Top Ten University Rankings (Life Sciences) Pennsylvania establishments also receive significant National Institute of Health (NIH) funding relative to other states. In 2016 Pennsylvania received $1.6 billion in NIH funding. Pennsylvania s NIH funding is 11


16 especially significant when viewed on a per capita basis to account for the Commonwealth s relative size. Figure 8: NSF Funding Just as Pennsylvania receives significant NSF and NIH funding, Pennsylvania establishments have issued a substantial number of Life Sciences related patents. From 2011 to 2015, Pennsylvania establishments 12

17 have issued 4,317 Life Sciences patents. In 2015, Life Sciences patents in Pennsylvania were issued at a rate of 7.6 patents per 100,000 people, an increase of about 44.0 percent in rate since While this rate change from 2011 to 2015 was higher than many of its peers, Pennsylvania s rate of Life Sciences patent issuance in 2015 did not stand out amongst its peers. Figure 9: Life Sciences Patents 13


18 Much of the Life Sciences research in Pennsylvania centers on the development and investigation of new drugs. As of July 2017, roughly one third of all drugs investigated in Pennsylvania are related to cancer treatments, with central nervous system drugs being the second most investigated. Figure 10: Investigational New Drugs by Therapeutic Area 14
19 Academic contribution Pennsylvania has a longstanding tradition of academic excellence, which serves as an engine for research and innovation for the Life Sciences industry. Pennsylvania has seven universities listed on the World Top 100 Universities according to the Shanghai Index and two universities on the World Top 100 Biological Sciences Program according to the QS 2016 University Ranking by Subject. In 2015, institutions in the Commonwealth awarded 578 doctoral degrees in the Life Sciences discipline, which ranks amongst the highest states in the nation. Figure 11: Top 100 Universities World Top 100 Universities World Top 100 Biological Sciences Program California New York 12 4 Massachusetts 9 3 Pennsylvania 7 2 North Carolina 4 1 Indiana 4 1 New Jersey 2 1 Michigan 1 1 Source: Shanghai Index, 2016 rankings; QS World University Ranking by subject 15

20 It is difficult to overstate the role of the university in the formation of regional economies driven by technical and scientific activities. Pennsylvania s world-class research universities are some of its most important assets not only because they confer a comparative advantage in promising gene and cell therapeutic areas, but also because of their role in supporting the Commonwealth s innovation ecosystem through models of collaboration that enable researchers, entrepreneurs, angel investors, and venture capitalists to translate new ideas into marketable goods and services. University Commercialization Pennsylvania s research universities engage in two broad forms of commercialization: 1. Licensing Licensing or sale of intellectual property, typically in return for royalties; and 2. Spinoffs/Start-Ups Ventures created by the university, or that use technologies owned by the university, or those that are managed or financed by the university. The terms Spinoffs and Start-Ups are sometimes used interchangeably but some definitions distinguish a Spinoff from a Start-Up based on the latter s typically greater reliance on capital or management supplied by an entity other than the university. The commercialization activities 9 occurring at Pennsylvania s major research institutions are closely aligned with the Life Sciences industry, which at several large institutions accounts for between half and three-quarters of the commercialization activities taking place. Universities in Pennsylvania are increasingly working with corporations to conduct corporate-sponsored research in promising niche areas such as digital health, cellular immunotherapy, novel medical devices, and health-related information technology. Pennsylvania s universities take an active role in connecting researchers with entrepreneurs, venture capitalists and angel investors to promote an active start-up environment. The clear trend across the Commonwealth s universities is a movement towards the innovation center model. Through this model universities invest heavily in programs designed to form linkages with businesses pursuing research, connect entrepreneurs with researchers, and accelerate business development. 9 See University Commercialization text box. Source: CEO Council for Growth, Technology Transfer and Commercialization in Greater Philadelphia. 16
21 The latest signs suggest the pace of commercialization activity is accelerating. For example, from 2013 to 2016 the University of Pennsylvania s Penn Center for Innovation (PCI) has seen the share of research and development expenditures from all corporate sponsorships double 10, with much of the increase tied to Life Sciences. Similarly, the University of Pittsburgh s Innovation Institute has recorded a sharp increase in both the number of patents issued and start-up companies formed (both university-led and student-run), indicating research activities are increasingly translating into new ventures 11. One limiting factor for even greater university-led commercialization efforts is a dearth of both experienced entrepreneurial and venture capital in Pennsylvania. Although difficult to measure directly, anecdotal evidence based on discussions with leading university commercialization offices suggests greater levels of commercialization could occur with the support of more local entrepreneurs having experience in Life Sciences ventures and larger inflows of venture capital Source: Penn Center for Innovation, University of Pennsylvania. PCI Metrics Dashboard, % Total Penn R&D Expenditures from Corporate Sponsorships., as accessed on August 23, Source: Innovation Institute, University of Pittsburgh. Annual Reports for , as accessed on August 23, Information based on a series of informational interviews conducted with technology transfer program coordinators of several major Pennsylvania universities. 17

22 Attracting capital There are several ways in which early-stage Life Sciences companies can acquire funding. The method most commonly utilized by early-stage companies involves securing commitments from venture capitalists or angel investors. In Pennsylvania, the amount of venture capital commitments falls far below national leaders like California and Massachusetts. A lack of venture capital may serve as a limiting factor for the Life Sciences industry in Pennsylvania, as companies that are unable to secure sufficient funding early in their lifecycle may be unable to stage significant expansions necessary to become dominant in their industries. Figure 12: Life Sciences Venture Capital Another method of acquiring funding is through an initial public offering (IPO). IPOs occur most frequently among late-stage start-up companies that may require access to a larger pool of potential investors than may be acquired through venture capital alone. In 2016, fourteen Pennsylvania Life Sciences companies either announced or closed on an IPO with a total transaction value of $992 million. 18
23 Similarly, companies can acquire funding through private placements by issuing securities directly to private investors. In 2016, there were 26 instances of Pennsylvania Life Sciences companies acquiring funding through private placement activities. In total, Pennsylvania Life Sciences companies acquired $537 million in funding through private placements in Figure 13: Investment Activities in Life Sciences Pennsylvania investment activities Transaction activities Count Total transaction value (in millions) IPO $992 Private Placement 26 $537 Mergers and acquisitions (M&A) within the Life Sciences industry are sometimes a signal of consolidation but often serve as mechanisms for expansion and reducing risk. As the Life Sciences industry continues to grow, larger companies have begun to enhance their new product portfolios through M&A rather than investing in traditional R&D. While the Pennsylvania Life Sciences industry recorded only one acquisition in 2016, two such activities occurred in 2015, and five M&A transactions occurred in Source: S&P Capital IQ database (2017). 14 Includes both announced and closed transactions 19
24 Economic contribution In addition to its role in the issuance of patents, development of innovative drugs, and integration with world-class academic institutions, the Life Sciences industry is an integral component of the Pennsylvania economy. This section provides estimates of the economic impact that the Life Sciences industry brings to the Commonwealth. Economic impact analysis quantifies the direct and indirect economic impacts of companies or industry presence as measured by economic output, employment, labor income, and taxes of spending associated with an activity/event/project on a local, state or national economy. Economic impact analysis recognizes the interdependence among different sectors of the economy. Operating expenses incurred, compensation paid, taxes paid, and capital invested by an industry help stimulate business activity, personal consumption, and social development throughout the economy. The presence and impact of a particular industry generates total economic impact that is substantiality larger than its own activities. The Life Sciences industry directly employs over 112,000 individuals in Pennsylvania and supports over 340,000 total jobs in the Commonwealth. The additional indirect and induced jobs are generated by firms in the supply chain providing goods and services to the Life Sciences industry, as well as jobs created as a result of the spending of Life Sciences and supporting industry workers. 112,000 Direct Jobs 230,000 Indirect & Induced Jobs 342,000 Total Jobs Employee labor income contributed to the Pennsylvania economy both directly through the Life Sciences industry and indirectly through supporting industries. Labor income, including all wages and salaries, directly attributable to the Life Sciences industry in Pennsylvania totaled $11.0 billion in An 20

25 additional $15.2 billion in labor income resulted from the indirect and induced contributions of the Commonwealth Life Sciences industry. In addition, the Life Sciences industry s importance to Pennsylvania can be captured through its significant contribution to state economic output. The industry directly contributed approximately $48.8 billion in economic output in 2016 to the Commonwealth, with an additional $39.6 billion contributed through economic activities supporting the industry. This resulted in a total of $88.5 billion in state economic output contributed to the Pennsylvania economy by the Life Sciences industry and supporting activities in The Pennsylvania Life Sciences industry was responsible for generating approximately $9.8 billion in federal, Commonwealth and local taxes in 2016 Figure 14: Life Sciences Economic Contribution Effect Employment Annual labor income 15 State economic output 16 Direct Effects 112,000 $11.0 Billion $48.8 Billion Indirect & Induced Effects 230,000 $15.2 Billion $39.6 Billion Total Effects 342,000 $26.3 Billion $88.5 Billion 15 Labor Income refers to the sum of all wages and salaries (including employee benefits) paid to those directly and indirectly impacted by the Life Sciences industry. Labor Income is a component of Economic Output, and hence is not an additive economic impact to Economic Output. 16 State Economic Output represents the value of goods and services produced in the state economy due to certain economic activity, measured in gross product (revenues) generated. 21


26 The following sectors are most prominently impacted by the contributions of the Life Sciences industry in Pennsylvania. Many of these sectors, such as colleges, universities, and professional schools, scientific research and development services, and pharmaceutical preparation manufacturing are primarily the result of direct employment in the Life Sciences industry. Other industries, such as wholesale trade, management of companies and enterprises, and real estate are the result of significant indirect and induced employment in support of the Life Sciences industry. Figure 15: Employment Impact Detail, Top 10 Sectors 22

27 Pennsylvania has experienced modest employment growth of 0.6 percent from 2011 to 2016 in the Life Sciences industry relative to its peer states. While two peer states, New Jersey and Indiana, experienced a decline in Life Sciences industry employment over this period, all other peer states grew more rapidly than Pennsylvania. Three states, North Carolina, Michigan, and Massachusetts, experienced double-digit employment growth over this period of 11.0 percent, 11.3 percent, and 10.1 percent respectively. Figure 16: Employment Growth 23
28 Commonwealth support The Commonwealth of Pennsylvania offers several supportive incentive programs across various industries which are often utilized by companies in the Life Sciences industry including: Research and Development Tax Credit, Keystone Opportunity Zone, and Job Creation Tax Credit. In addition, the Commonwealth has specific appropriations in its budget specifically focused on Life Sciences and other high-tech industries including the Life Sciences Greenhouse Incentive and the Ben Franklin Technology Development Authority Fund. The Commonwealth also offers additional support in the form of a dedicated agency focused on supporting companies in the Life Sciences agency (Department of Community and Economic Development). The following table provides additional detail on Pennsylvania incentive programs, recipients, and proposed costs. Figure 17: Illustrative Commonwealth Support for Life Sciences Program name 17 Program description Beneficiaries Proposed budget ($ in millions) R&D Tax Credit A statutory credit in the amount of 10.0 percent of increase in qualified research expenditures 765 companies, annually $ Life Sciences Greenhouse Initiative A special appropriation fund to promote earlystage risk capital and catalyst development and creation of new Life Sciences related products and companies 38 life sciences companies in $3.0 Ben Franklin Technology Development Authority Fund A special appropriation fund to promote entrepreneurial business environment, advance technology innovation, and create technology ready workforce Not Available $14.5 Keystone Innovation Zones A statutory tax credit offered to targeted industries (including Life Sciences) in an amount derived in the zone over the previous 2 years, subject to limitations 59 Life Sciences companies, annually $ Job Creation Tax Credit Provides non-refundable income tax credits to companies that create a minimum of 25 new jobs Not Available $ The table identifies the key business support programs included in the Commonwealth of Pennsylvania's proposed budget for Amounts are included in the proposed revenue bill, however the bill has not been passed other numbers per general bill. 19 During 2016, Pittsburgh Life Sciences Greenhouse invested a total of $1.4 million into 14 companies. BioAdvance invested in 12 companies. Life Sciences Greenhouse of Central Pennsylvania (LSGPA) invested in 12 companies. 24
29 PA First or increase employment by 2.0 percent within three years from a negotiated start date A discretionary cash grant awarded to promote job creation and capital investment in the Commonwealth Not Available $15.0 California, New York, Massachusetts, and New Jersey are often evaluated in conjunction with Pennsylvania due to their large Life Sciences industry presence. Similar to Pennsylvania, each of these states have R&D tax credits which are often utilized by Life Sciences companies. Massachusetts has a similar approach to Pennsylvania as they both provide strong support in the form of a dedicated agency and a legislative act to appropriate funding support in the form of incentives at the discretion of the governor s budget. New York, New Jersey, and California utilize a different approach to support companies in this industry. These states have designated incentive programs in the form of grants, tax credits, etc. which may be enhanced if the company is in the Life Sciences industry. While both approaches may result in significant incentive benefits for a company in the Life Sciences industry, Pennsylvania s focus on the Life Sciences industry is evident. 25
30 Life sciences: Key trends Life Sciences is evolving at a rapid rate, driven by changes in technology, research, policy, and the allocation of capital. The following section analyzes the trends shaping the national Life Sciences industry and how those trends have manifested themselves in Pennsylvania. These trends include: Supply trends: How the industry is responding to volatility in input prices and supply levels, the increase in supply chain complexity, the consolidation of existing industries, and the emergence of new value-generating ventures; Demand trends: Expanding demand for the products and services produced in the Life Sciences industry, entry into new markets, new revenue mechanisms and risk-sharing arrangements, the shift from volume-based to value-based models, and the changing definition of the consumer; External factors: The changing regulatory and risk environment and its impact on the Life Sciences industry, changing economic environment and its impact on the Life Sciences industry growth; and, Disruption: Scientific breakthroughs, the growing need for digital and analytics capabilities to gain both operational efficiencies and greater consumer engagement, new forms of competition. Supply trends Consolidation in the industry 20 In many healthcare-related segments of the Life Sciences industry in the US, consolidation is occurring, leading to a further concentration in the healthcare market. Technology regulation, market disruption, the drive to gain access to clinical research, patent expirations, and increased movement of private and government payers are forcing companies to review their operating models. Life sciences is currently a leading industry in merger and acquisition activity. Pennsylvania in Focus In the last quarter of 2016, M&A activities in the healthcare industry accounted for 22% of total M&A deals in Central Pennsylvania. In the Philadelphia metro area, M&A activities in the healthcare industry accounted for 17% of all deals third most of any industry. One of the largest healthcare deals in late 2016 was the acquisition of Koltan Pharmaceuticals by Celdex Therapeutic, with a total transaction value of over $230 million. 20 Sources: KPMG 2016 M&A Survey findings: U.S. executives on M&A: full speed ahead in 2016, 2016, KPMG, as accessed on August 3, 2017; Central Pennsylvania regional M&A update: Q Baker Tilly Capital, as accessed on August 29, 2017; Philadelphia Regional M&A Update: Q Baker Tilly Capital., as accessed on August 29,
31 Demand trends Downward Pressure on Pricing 21 Governments and payers are exerting pressure to drive prices down in many of the industries in healthcare and pharmaceuticals. The movement of payers towards value-based methodologies is having significant follow-on effects for suppliers, especially in the pharmaceuticals industry. Companies are working increasingly towards developing value-based contracts, marking a decisive shift away from the volume-based models that prevailed in the past. Value-based pricing comes with its own set of risks and challenges, but it also has large potential to benefit multiple healthcare stakeholders if implemented properly. Pennsylvania in Focus The University of Pittsburgh Medical Center (UPMC) Health Plan has established the Center for Value-Based Purchasing for Pharmaceuticals. The center is dedicated to studying existing payment models, developing new payment methodologies, and evaluating health outcomes. UPMC hopes the center will fundamentally change the way medications are paid for in the U.S. Teva Pharmaceuticals, whose North American headquarters is based in North Wales, PA, intends to close 15 plants and lay off 7,000 employees over the next two years. Much of the firm s financial troubles stem from increased approval of generic drugs leading to price erosion. Rising costs 22 Despite continued growth and positive prospects, Life Sciences companies continue to incur high costs, particularly on the research front. There is a high demand for innovative and more effective healthcare solutions, however research remains a high risk and high expense approach for companies. This pricing pressure is further intensified as the cost of bringing a new product to the market has been the highest ever. Industry stakeholders are intensively scrutinizing income statements in an attempt to cut costs through company right-sizing, increasing cross-functionality within the organization, and improving operational efficiency. 23 Pennsylvania in Focus Mylan, a Pennsylvania-based pharmaceutical company, has announced its intention to restructure operations and reduce headcount in an effort to reduce costs. 21 Sources: KPMG Global Strategy Group report: Pharma outlook 2030: From evolution to revolution A shift in focus, 2017, KPMG, as accessed on August 3, 2017; UPMC Health Plan Establishes Unprecedented Center for Value-Based Purchasing for Pharmaceuticals, May , Cision PR Newswire, as accessed on August 29, 2017; American Pharmacists Association, as accessed on August 29, 2017; Teva to Cut 7,000 Jobs After Disappointing Quarter Results, August , BizPhilly, as accessed on August 29, Mylan eyes up to 3,500 layoffs in post-m&a cost-cutting drive, December 2016, FiercePharma, as accessed on August 3, An evolving industry: Today s clusters creating tomorrow s breakthroughs, 2017, JLL Research, as accessed on August 3,
32 External factors Portfolio optimization through M&A As the Life Sciences and healthcare industry in the U.S. continues to grow, biotechnology companies have started to focus on new product development through M&A activities and strategic partnerships, as it may often be more cost efficient than traditional R&D. 23 M&A activity is also seen as an opportunity, for pharmaceutical companies, to access new and innovative technologies, thereby refill their drug pipelines. This trend is expected to continue attracting top pharmaceutical players to pursue M&A opportunities further. The healthcare and Life Sciences industry ranked as the top sector for U.S. M&A in 2016 with $242.6 billion in transactions. 24 The top deal for the Life Sciences sector in 2016 was Dublin, Ireland-based Shire plc entering into an agreement to acquire Baxalta Incorporated from Baxter International Inc. and others for $36.2 billion on January 11, Continued wage growth for skilled labor The high demand for skilled labor in the Life Sciences industry has had a significant impact on the labor market. This trend has resulted in sustained wage growth for employees in the Life Sciences industry. In the US, over the past five years, the average employee salary has gone up by 19.2 percent. As Life Sciences companies continue to require highly skilled labor with advanced educational qualifications, wage growth will likely continue. In 2015, almost 60.0 percent of the jobs in the U.S. Life Sciences industry required some post-secondary education to obtain an entry level position, according the Bureau of Labor Statistics, while 45.6 percent of these positions required a Bachelor s degree or higher. 25 Increasing inflow of capital The Life Sciences industry ecosystem would not have grown without the funding received from venture capital firms. This funding has enabled further product innovation through R&D. National venture capital investment volume fell in 2016 after a record year in However, while U.S. funding as a whole decreased by about 20.0 percent in 2016, Life Sciences industry funding only decreased by about 8.0 percent. The Life Sciences industry received the second highest funding in 2016, while the software industry received the highest funding. 26 Disruption Increase in Partnership and Integration with Technology Businesses 27 The significance of technology, particularly software, has been steadily increasing across various fields, and the Life Sciences industry is no exception to this trend. Several pharmaceutical and medical devices companies are seeking opportunities to partner and integrate with technology firms. One of the recent examples is the collaboration that was announced in September 2016, between Sanofi and Verily Life 24 Source: 2016 Announced US M&A Summary, January 2017, S&P Global Market Intelligence, as accessed on August 2, Source: Greater Philadelphia Region Life Sciences Report, 2017, Ben Franklin Technology Partners, as accessed on August 3, Source: An evolving industry: Today s clusters creating tomorrow s breakthroughs, 2017, JLL Research, as accessed on July 31, Sources: Digital Health: Building on our Strengths Greater Philadelphia Region. Trends and Highlights, January 2008 to June
33 Sciences LLC, the Life Sciences business unit of Alphabet Inc. This joint venture plans to invest approximately $500 million to develop a solution comprising devices, software and medicine. 28 Pennsylvania in Focus Digital health companies are flourishing in the Greater Philadelphia region. More than 20% of these companies develop specialized information technology or data services for pharmaceutical and clinical trials. Additionally, more than two-thirds of these companies are developing provider/payer solutions. In 2012, Thomas Jefferson University in Philadelphia, PA entered into a partnership with RightCare Solutions to use innovations in medical technology to improve patient care and reduce readmissions. From Treatment to Prevention 29 Increased collection and monitoring of health data permits practitioners to predict the likelihood of a patient being diagnosed with a disease or health condition, marking a shift from treatment of symptoms to prevention measures. This cost-effective trend is marked by groundbreaking new therapies, advances in technology, and increased focus on consumers of healthcare products through increased data access by patients. 28 In addition, the collection and processing of patient-related data are paving the way for personalized treatment. Verily, in collaboration with Dexcom, is developing a miniaturized continuous glucose monitor with embedded sensors to monitor the glucose level. Leveraging real-time information, this device will help in effective control of diabetes in patients. 30 Pennsylvania in Focus Ben Franklin Technology Partners, a Pennsylvania based early-stage investment firm, has invested in Instadiagnostics, Inc., a technology company that is developing a rapid, quantitative, point-of-care platform designed to allow for early diagnosis for monitoring patients more easily at their care center. Disruption, and an increasing focus on R&D Life sciences product pipelines are gaining strength, U.S. Food and Drug Administration (FDA) approvals have rebounded, and new products are launching in key therapeutic areas. Venture capitalists remain focused on Life Sciences start-ups. Overall growth in the contract research organization sector is picking up. Elsewhere, Pennsylvania s Life Sciences industry is distinguishing itself in terms of its ability to acquire research funds and grants available from national research centers and federal agencies. 28 Source: Pharma outlook 2030: From evolution to revolution, January 2017, KPMG International, as accessed on July 31, Source: Twelve Health Companies Creating an Impact in our Region, July 28, 2017, Ben Franklin Technology Partners, as accessed on August 29, Source: Miniaturized CHM, Verily website, as accessed on August 3,

34 Methodological appendix 30
35 Employment Data The model used to estimate the economic contribution of the Life Sciences industry on the Pennsylvania economy relied on data from a variety of sources. The direct employment impacts of the Life Sciences industry to Pennsylvania were used to inform the model and were primarily derived from the Bureau of Labor Statistics Quarterly Census of Employment and Wages (QCEW). QCEW data reports employment and wages as reported by employers and covers more than 95.0 percent of U.S. jobs at the national, state, metropolitan statistical area, and county level. Data is aggregated starting at the 6-digit NAICS industry level. For the purposes of this study, the definition is heavily informed by the guiding principal that Life Sciences companies are involved directly or indirectly in biomedical or human health research, product development, and innovation. This definition included contributions from 23 NAICS industry codes. All of the QCEW Pennsylvania employment data was attributed to the Life Sciences industry for the following 18 industries. NAICS Sector Name Allocation Drugs & Pharmaceuticals Medicinal and Botanical Manufacturing 100% Pharmaceutical Preparation Manufacturing 100% In-Vitro Diagnostic Substance Manufacturing 100% Biological Product (except Diagnostic) Manufacturing 100% Medical Devices and Equipment Optical Instrument and Lens Manufacturing 100% Electromedical and Electrotherapeutic Apparatus Manufacturing 100% Analytical Laboratory Instrument Manufacturing 100% Irradiation Apparatus Manufacturing 100% Surgical and Medical Instrument Manufacturing 100% Surgical Appliance and Supplies Manufacturing 100% Dental Equipment and Supplies Manufacturing 100% Ophthalmic Goods Manufacturing 100% Dental Laboratories 100% Wholesale Trade Medical, Dental, and Hospital Equipment and Supplies Merchant Wholesalers 100% Ophthalmic Goods Merchant Wholesalers 100% 31
36 Research, Testing and Medical Laboratories Research and Development in Biotechnology 100% Medical Laboratories 100% Diagnostic Imaging Centers 100% An additional five industries were classified as partially attributed to the Life Sciences industry, with less than percent of QCEW Pennsylvania employment attributed to the Life Sciences definition. The allocation of output for these five industry segments were calculated through a variety of measures based on data availability. The allocation of industry employment attributable to Life Sciences for two sectors was derived using data from the U.S. Census Bureau s Economic Census. The Economic Census is a five-year measure of U.S. businesses and establishments aggregated at the NAICS industry level. The allocation for the following two sectors was calculated as the share of Life Sciences related establishments, as identified by the most disaggregated available NAICS code, relative to all establishments included in the 6-digit NAICS code. The allocation was performed using data from the 2012 Economic Census, the most recent available data at the time of this report. NAICS Sector Name Allocation Wholesale Trade Drugs and Druggists' Sundries Merchant Wholesalers 63% Research, Testing and Medical Laboratories Research and Development in the Physical, Engineering, and Life Sciences (except Biotechnology) 53% In the case of one NAICS industry sector, Testing Laboratories, sufficiently disaggregated detailed Economic Census data was not available for Pennsylvania. In this case, the allocation of industry employment attributable to Life Sciences was based on the average of this sector s allocation derived in a selection of Life Science industry studies for other states. NAICS Sector Name Allocation Research, Testing and Medical Laboratories Testing Laboratories 18% Additionally, in the case of one NAICS industry sector, Artificial and Synthetic Fibers and Filaments Manufacturing, sufficiently disaggregated detailed Economic Census data was not available for Pennsylvania nor was data available from comparable studies. In this case, the allocation of industry employment attributable to Life Sciences was based on the average of NAICS industry sectors attributable to Life Sciences derived from Economic Census data. 32
37 NAICS Sector Name Allocation Medical Devices and Equipment Artificial and Synthetic Fibers and Filaments Manufacturing 45% Finally, the allocation for NAICS industry sector , Colleges, Universities, and Professional Schools attributable to the Life Sciences industry was derived using data from the U.S. Department of Education s National Center for Education Statistics. The allocation was calculated as the share of Life Sciences related undergraduate and graduate degrees conferred in Pennsylvania using data. NAICS Sector Name Allocation Research, Testing and Medical Laboratories Colleges, Universities, and Professional Schools 18% IMPLAN 31 Model Description The IMPLAN model is a microcomputer-based program that allows construction of regional Input-Output models for areas as small as a county and aggregation of individual county databases for multi-county analysis. IMPLAN was originally developed for the U.S. Department of Agriculture and is maintained and supported by the Minnesota IMPLAN Group, Inc., Stillwater, Minnesota. The components of the IMPLAN database form the economic accounts of an individual county, several counties, or an entire state. These accounts show the flow of commodities to industries and institutional consumers in 536 separate industries in agriculture, mining, construction, manufacturing, wholesale and retail trade, utilities, finance, insurance and real estate, and consumer and business services. Each industry is described in terms of its purchases from and sales to all other industries in the local economy. Values for all activities are in producers' prices and do not include transportation costs or other additional transaction costs associated with delivering outputs from each industry to other intermediate users. Final demands are goods and services purchased for their ultimate use by an end user. They include personal consumption expenditures (payments by individuals or households to industries for goods and services for personal consumption); federal government purchases (military and nonmilitary) and sales; state and local government purchases (public education and non-education) and sales; inventory purchases (unsold annual output) and sales (where inventory reduction exceeds additions from production); capital formation (expenditures to obtain capital equipment); and foreign exports. Final demands are allocated to producing industries, and margins are allocated to the service sectors (transportation, wholesale and retail trade, insurance, etc.) associated with providing that good to the final user. The IMPLAN model provides the necessary information to estimate a complete set of regional economic accounts for a local area. The economic accounts are then converted to industry through the use of Input-Output accounts and a set of Leontief multipliers. The initial data set is the "use" of commodities by industry and the "make" of commodities by industry. These flows are derived for the local area from 31 IMPLAN Group LLC, IMPLAN System (data and software), Northcross Dr., Suite 120, Huntersville, NC IMPLAN was originally developed for the U.S. Department of Agriculture and is maintained and supported by MIG, Inc. (formerly the Minnesota IMPLAN Group, Inc.). 33
August 17, The Testimony of Christopher P. Molineaux President & CEO Pennsylvania Bio
 Joint Democratic and Republican House Policy Committee Hearing August 17, 2016 The Testimony of Christopher P. Molineaux President & CEO Pennsylvania Bio Chairman Benninghoff, Chairman Sturla, and members
PwC Deals $42B. Global Pharma & Life Sciences Deals Insights Q Update
 PwC Deals Q3 16 Update Executive summary Global Pharma and Life Sciences (PLS) deal activity declined both in volume and value this quarter compared to the prior quarter and Q3 15. The considerable decrease
Digital Health Startups A FirstWord ExpertViews Dossier Report
 AM PL E PA G ES S A G ES S A FirstWord ExpertViews Dossier Report Published Copyright 2016 Doctor s Guide Publishing Limited All rights reserved. No part of this publication may be reproduced or used in
Missouri Economic Indicator Brief: Manufacturing Industries
 Missouri Economic Indicator Brief: Manufacturing Industries Manufacturing is a major component of Missouri s $293.4 billion economy. It represents 13.1 percent ($38.5 billion) of the 2015 Gross State Product
KANSAS BIOSCIENCE INDEX 2008
 Innovation Capacity Education Capacity Workforce Capacity KANSAS BIOSCIENCE INDEX 2008 Industrial Output Prepared by: Research & Development Capacity ACKNOWLEDGEMENTS The Bioscience Authority contracted
VENTURE CAPITAL INVESTING REACHES HIGHEST LEVEL SINCE Q WITH $13.0 BILLION INVESTED DURING Q2 2014, ACCORDING TO THE MONEYTREE REPORT
 Contacts: Clare Chachere, PwC US, 512-867-8737, clare.chachere@us.pwc.com Jeffrey Davidson, Brainerd Communicators for PwC, 212-739-6733, davidson@braincomm.com Ben Veghte, NVCA, 703-778-9292, bveghte@nvca.org
Medtech Slowdown. Life sciences venture capital funding lagged behind other industries, declining 10% in 4Q13 and 1% in 2013 over last year
 www.pwc.com Medtech Slowdown Life sciences venture capital funding lagged behind other industries, declining 10% in 4Q13 and 1% in 2013 over last year February 2014 2 PwC US venture capital funding for
Fall State of the Industry Report UF SID MARTIN FLORIDA BIODATABASE
 Fall 2015 State of the Industry Report UF SID MARTIN FLORIDA BIODATABASE Industry Overview The expansion of Florida s biotech industry remains resilient with an overall growth rate of 92% in the number
SEMICONDUCTOR INDUSTRY ASSOCIATION FACTBOOK
 Factbook 2014 SEMICONDUCTOR INDUSTRY ASSOCIATION FACTBOOK INTRODUCTION The data included in the 2014 SIA Factbook helps demonstrate the strength and promise of the U.S. semiconductor industry and why it
Technology transfer industry shows gains
 Technology transfer industry shows gains in patents filed and granted, university-created startups and commercial products; slippage in federal research funding cited Highlights of AUTM s Canadian Licensing
Guidelines to Promote National Integrated Circuit Industry Development : Unofficial Translation
 Guidelines to Promote National Integrated Circuit Industry Development : Unofficial Translation Ministry of Industry and Information Technology National Development and Reform Commission Ministry of Finance
Financing Growth Ventures to Minimize Equity Dilution
 Financing Growth Ventures to Minimize Equity Dilution An entrepreneurial team s mission is to develop and grow its venture and to optimize the management team s equity ownership stake. Significant growth
Textron Reports Second Quarter 2014 Income from Continuing Operations of $0.51 per Share, up 27.5%; Revenues up 23.5%
 Textron Reports Second Quarter 2014 Income from Continuing Operations of $0.51 per Share, up 27.5%; Revenues up 23.5% 07/16/2014 PROVIDENCE, R.I.--(BUSINESS WIRE)-- Textron Inc. (NYSE: TXT) today reported
executives are often viewed to better understand the merits of scientific over commercial solutions.
 Key Findings The number of new technology transfer licensing agreements earned for every $1 billion of research expenditure has fallen from 115 to 109 between 2004 and. However, the rate of return for
Confirms 2013 Financial Guidance
 Confirms 2013 Financial Guidance PROVIDENCE, R.I.--(BUSINESS WIRE)--Jul. 17, 2013-- Textron Inc. (NYSE: TXT) today reported second quarter 2013 income from continuing operations of $0.40 per share, compared
Life Sciences. An evolving industry: Today s clusters creating tomorrow s breakthroughs. Long Island JLL Research
 Life Sciences Long Island 2017 An evolving industry: Today s clusters creating tomorrow s breakthroughs JLL Research Suffolk County Stony Brook University serves as an integral part of the research corridor
Textron Reports Third Quarter 2014 Income from Continuing Operations of $0.57 per Share, up 62.9%; Revenues up 18.1%
 Textron Reports Third Quarter Income from Continuing Operations of $0.57 per Share, up 62.9%; Revenues up 18.1% 10/17/ PROVIDENCE, R.I.--(BUSINESS WIRE)-- Textron Inc. (NYSE: TXT) today reported third
Service Science: A Key Driver of 21st Century Prosperity
 Service Science: A Key Driver of 21st Century Prosperity Dr. Bill Hefley Carnegie Mellon University The Information Technology and Innovation Foundation Washington, DC April 9, 2008 Topics Why a focus
Life Sciences Outlook
 Life Sciences Outlook Raleigh- 2013-2014 Mid-tier biotech and specialty pharmaceuticals drive demand Across North America, activity and demand within the life sciences industry seems to have shifted from
Textron Reports Third Quarter 2018 Results; Narrows Full-Year EPS and Cash Guidance
 Corporate Communications Department NEWS Release Textron Reports Third Quarter 2018 Results; Narrows Full-Year EPS and Cash Guidance $468 million returned to shareholders through share repurchases Completed
Life Sciences Outlook. New York City 2016
 Life Sciences Outlook City 2016 City is emerging as a leading destination for biotech startups and the larger life sciences industry. Investors have committed millions of dollars throughout the city and
ASEAN: A Growth Centre in the Global Economy
 Bank Negara Malaysia Governor Dr. Zeti Akhtar Aziz Speech at the ASEAN SME Conference 2015 It is my pleasure to be here this afternoon to speak at this inaugural ASEAN SME Conference. This conference takes
Promoting Foreign Direct Investment in The United States. Christopher Clement International Investment Specialist Invest in America
 Promoting Foreign Direct Investment in The United States Christopher Clement International Investment Specialist Invest in America FDI in the U.S. Economy 5.2 million $40 billion $55 billion $190 billion
Executive Summary Industry s Responsibility in Promoting Responsible Development and Use:
 Executive Summary Artificial Intelligence (AI) is a suite of technologies capable of learning, reasoning, adapting, and performing tasks in ways inspired by the human mind. With access to data and the
COLUMBUS 2020 A REGIONAL GROWTH STRATEGY FOR CENTRAL OHIO
 COLUMBUS 2020 A REGIONAL GROWTH STRATEGY FOR CENTRAL OHIO Vision To achieve the strongest decade of growth in the Columbus Region s history Mission To strengthen the economic base of the 11-county Columbus
Life Sciences Outlook. Long Island 2016
 Life Sciences Outlook Long Island 2016 Long Island The Long Island life sciences landscape will continue to fuel the economy as firms emerge from Cold Spring Harbor Laboratory in Nassau County, as well
THE U.S. SEMICONDUCTOR INDUSTRY:
 THE U.S. SEMICONDUCTOR INDUSTRY: KEY CONTRIBUTOR TO U.S. ECONOMIC GROWTH Matti Parpala 1 August 2014 The U.S. Semiconductor Industry: Key Contributor To U.S. Economic Growth August 2014 1 INTRO The U.S.
The State of Innovation. Orlando Saez
 The State of Innovation Orlando Saez Separating fact from myth Myth Illinois is hostile to businesses. Fact Illinois is a good place to do business, and it s getting better everyday. Illinois Economy Highlights
Silicon Valley Venture Capital Survey Second Quarter 2018
 fenwick & west Silicon Valley Venture Capital Survey Second Quarter 2018 Full Analysis Silicon Valley Venture Capital Survey Second Quarter 2018 fenwick & west Full Analysis Cynthia Clarfield Hess, Mark
The robots are coming, but the humans aren't leaving
 The robots are coming, but the humans aren't leaving Fernando Aguirre de Oliveira Júnior Partner Services, Outsourcing & Automation Advisory May, 2017 Call it what you want, digital labor is no longer
III. THE REGIONAL FRAMEWORK
 THE SAN DIEGO REGIONAL ECONOMY III. THE REGIONAL FRAMEWORK The San Diego region, comprised solely of San Diego County, is one of California s most dynamic regions. The efforts of the University within
2 nd Quarter Earnings Conference Call
 2 nd Quarter Earnings Conference Call KKR & Co. Inc. Investor Update July 26, 2018 Recent Milestones K-1 $ Converted to a Corporation on July 1, 2018 Investor Day held on July 9, 2018 2 Key Metrics Assets
21 st CEO Survey CEOs sound a note of optimism. Key findings from the oil and gas industry. ceosurvey.pwc
 21 st CEO Survey CEOs sound a note of optimism Key findings from the oil and gas industry ceosurvey.pwc 2 PwC s 21st CEO Survey: Key findings from the oil and gas industry Contents 5 7 9 X Positioned for
A STRATEGY TO IMPROVE CANADA S MINERAL EXPLORATION INVESTMENT CLIMATE
 A STRATEGY TO IMPROVE CANADA S MINERAL EXPLORATION INVESTMENT CLIMATE Submission by the Prospectors and Developers Association of Canada (PDAC) to the House Standing Committee on Finance Pre-Budget Consultations
Technology Leadership Course Descriptions
 ENG BE 700 A1 Advanced Biomedical Design and Development (two semesters, eight credits) Significant advances in medical technology require a profound understanding of clinical needs, the engineering skills
ACCELERATING TECHNOLOGY VISION FOR AEROSPACE AND DEFENSE 2017
 ACCELERATING TECHNOLOGY VISION FOR AEROSPACE AND DEFENSE 2017 TECHNOLOGY VISION FOR AEROSPACE AND DEFENSE 2017: THROUGH DIGITAL TURBULENCE A powerful combination of market trends, technology developments
Discovery: From Concept to the Patient - The Business of Medical Discovery. Todd Sherer, Ph.D.
 Discovery: From Concept to the Patient - The Business of Medical Discovery Todd Sherer, Ph.D. Associate Vice President for Research and Director of OTT President Elect, Association of University Technology
Overview of Venture Equity
 Overview of Venture Equity SVB Analytics Report 2017 Written by SVB Analytics: Steve Liu Managing Director sliu@svb.com Sean Lawson Senior Manager slawson2@svb.com Steven Pipp Senior Associate spipp@svb.com
Government of Puerto Rico Department of Labor and Human Resources Bureau of Labor Statistics BUSINESS EMPLOYMENT DYNAMICS: FOURTH QUARTER
 Government of Puerto Rico Department of Labor and Human Resources Bureau of Labor Statistics BUSINESS EMPLOYMENT DYNAMICS: FOURTH QUARTER 2011 TABLE OF CONTENTS Introduction.1 Business Employment Dynamics:
COM C. Rozwell
 C. Rozwell Research Note 6 October 2003 Commentary Technologies That Ease Pharmaceutical Industry Disruption Several disruptive forces are altering the life science business model. Enterprises must select
2013 venture capital trends summary
 213 venture capital trends summary Prepared by: Hitesh Kothari, Director, McGladrey LLP hitesh.kothari@mcgladrey.com August 213 Fundraising by venture capital funds In the first half of 213, 88 venture
Silicon Valley Venture Capital Survey Third Quarter 2017
 fenwick & west Silicon Valley Venture Capital Survey Third Quarter 2017 Full Analysis Silicon Valley Venture Capital Survey Third Quarter 2017 fenwick & west Full Analysis Cynthia Clarfield Hess, Mark
Asking Questions on Knowledge Exchange and Exploitation in the Business R&D and Innovation Survey
 Asking Questions on Knowledge Exchange and Exploitation in the Business R&D and Innovation Survey John Jankowski Program Director Research & Development Statistics OECD-KNOWINNO Workshop on Measuring the
IVC-MEITAR HIGH-TECH EXITS H1/ 2015 REPORT. IVC-Meitar 2014 Exits Report Prepared by IVC Research Center Ltd.
 IVC-MEITAR HIGH-TECH EXITS H1/ 215 REPORT IVC-Meitar 214 Exits Report Prepared by IVC Research Center Ltd. Israeli High-Tech Exit Highlights Exit proceeds in H1/215 reached ¾ of total exits for 214 Average
VENTURE IMPACT ILLINOIS THE ECONOMIC IMPACT OF VENTURE CAPITAL ON ILLINOIS
 VENTURE IMPACT ILLINOIS THE ECONOMIC IMPACT OF VENTURE CAPITAL ON ILLINOIS Executive Summary What Is Venture Capital? Venture Capital Plays an Important Role in the Illinois Economy Venture Capital Investments
Israel Venture Capital Investments Report Q3 2017
 Israel Venture Capital Investments Report Q3 2017 NOVEMBER 2017 Summary of Israeli Venture Capital Raising Q3/2017 +14% from Q2/2017 Israeli high-tech capital raising summed up to $1.44B @ ALL RIGHTS RESERVED.
Automotive Sector What is our interest in CAV & ITS and Why? Nigel J Francis
 Automotive Sector What is our interest in CAV & ITS and Why? Nigel J Francis State of Michigan Automotive Office April 2014 Vision We will leverage the strengths and assets of Michigan s automotive industry
Small Business Landscape 2016: Cause for Cautious Optimism
 Small Business Landscape 2016: Cause for Cautious Optimism Executive Summary With 90% of U.S. companies characterized as small-business enterprises and 30% of all working Americans employed at companies
Brief to the. Senate Standing Committee on Social Affairs, Science and Technology. Dr. Eliot A. Phillipson President and CEO
 Brief to the Senate Standing Committee on Social Affairs, Science and Technology Dr. Eliot A. Phillipson President and CEO June 14, 2010 Table of Contents Role of the Canada Foundation for Innovation (CFI)...1
Digital Health Funding and M&A
 Digital Health Funding and M&A 2018 Third Quarter and Nine Month Report Funding and Merger & Acquisition activity for the Digital Health sector http://www.mercomcapital.com 1 Copyright 2010-2016 Mercom
Life Sciences Outlook. Westchester County 2016
 Life Sciences Outlook Westchester County 2016 Westchester County Just a short distance from Manhattan, Westchester County is an ideal location to many firms looking to attract and retain talent. The access
4 th Quarter Earnings Conference Call
 4 th Quarter Earnings Conference Call KKR & Co. Inc. Investor Update February 1, 2019 Key Metrics Assets Under Management Management Fees ($ in billions) ($ in millions) $195 $1,069 $168 $905 $100 $107
Written Submission for the Pre-Budget Consultations in Advance of the 2019 Budget By: The Danish Life Sciences Forum
 Written Submission for the Pre-Budget Consultations in Advance of the 2019 Budget By: The Danish Life Sciences Forum List of recommendations: Recommendation 1: That the government creates a Life Sciences
Under the Patronage of His Highness Sayyid Faisal bin Ali Al Said Minister for National Heritage and Culture
 ORIGINAL: English DATE: February 1999 E SULTANATE OF OMAN WORLD INTELLECTUAL PROPERTY ORGANIZATION Under the Patronage of His Highness Sayyid Faisal bin Ali Al Said Minister for National Heritage and Culture
Research-Asset Assessment Study for Commonwealth of Virginia:
 Research-Asset Assessment Study for Commonwealth of Virginia: Phase II Second-Order Gap Analysis on the Advancement and Translation of Virginia s Research and Development Assets To: Virginia Research Investment
CRS Report for Congress
 95-150 SPR Updated November 17, 1998 CRS Report for Congress Received through the CRS Web Cooperative Research and Development Agreements (CRADAs) Wendy H. Schacht Specialist in Science and Technology
KKR & Co. Inc. Goldman Sachs U.S. Financial Services Conference December 4, 2018
 KKR & Co. Inc. Goldman Sachs U.S. Financial Services Conference December 4, 2018 KKR Today Private Markets Public Markets Capital Markets Principal Activities $104bn AUM $91bn AUM Global Franchise $19bn
Insights into Mining. Incremental innovation. Is it the right approach for mining?
 Insights into Mining Issue #5 kpmg.ca/mining Welcome to Insights into Mining, a periodic e-newsletter focused on current topics relevant to the Mining Industry. KPMG s mining practice is committed to the
Industry at a Crossroads: The Rise of Digital in the Outcome-Driven R&D Organization
 Accenture Life Sciences Rethink Reshape Restructure for better patient outcomes Industry at a Crossroads: The Rise of Digital in the Outcome-Driven R&D Organization Accenture Research Note: Key findings
In the quarter, Textron returned $344 million to shareholders through share repurchases, compared to $186 million in the first quarter of 2017.
 Corporate Communications Department NEWS Release Textron Reports First Quarter 2018 Income from Continuing Operations of $0.72 per Share; Signs Agreement to Sell Tools & Test Business for $810 Million
WOLPERT ASSOCIATES, INC. Strategic Advisory Services Firm Overview
 Strategic Advisory Services 2018 Firm Overview Our Foundational Principles Strategic Advice for Biopharmaceutical, Medical Technology and Life Science sectors A Focus on Strategic Thinking in the Context
Greater Binghamton, New York
 Presentation: COLLABORATING FOR OUR FUTURE Greater Binghamton, New York www.angeloueconomics.com Angelos G. Angelou July 25, 2006 PROGRAM 1. Greater Binghamton Today 2. Target Industries 3. What it Takes
BUSINESS EMPLOYMENT DYNAMICS THIRD QUARTER
 The Commonwealth of Puerto Rico Department of Labor and Human Resources Bureau of Labor Statistics BUSINESS EMPLOYMENT DYNAMICS THIRD QUARTER 2012 TABLE OF CONTENTS Introduction.1 Business Employment
Canada s Intellectual Property (IP) Strategy submission from Polytechnics Canada
 Strategy submission from Polytechnics Canada") Canada s Intellectual Property (IP) Strategy submission from Polytechnics Canada 170715 Polytechnics Canada is a national association of Canada s leading polytechnics, colleges and institutes of technology,
Canada s Intellectual Property (IP) Strategy submission from Polytechnics Canada 170715 Polytechnics Canada is a national association of Canada s leading polytechnics, colleges and institutes of technology,
FOREST PRODUCTS: THE SHIFT TO DIGITAL ACCELERATES
 FOREST PRODUCTS: THE SHIFT TO DIGITAL ACCELERATES INTRODUCTION While the digital revolution has transformed many industries, its impact on forest products companies has been relatively limited, as the
BioNJ 2013 Industry Study. Life Sciences in New Jersey: Looking Beyond Biotech
 BioNJ 2013 Industry Study Life Sciences in New Jersey: September 2014 Table of Contents Welcome to Our Study: A Broader Approach... 1 Executive Summary... 3 Goals, Recommendations and Expert Commentary...
PRECISE MEDICAL Self-revealing case Handout #1
 OBEA Conference May 23-24, 2015 Entrepreneurship as it Relates to Financial Literacy Grant Russell, Associate Director of Undergraduate Programs School of Accounting and Finance, University of Waterloo
Contents. Illustrations
 Copyright IDSA 2001 Contents Executive Summary 3 1.0 Introduction 4 2.0 Direct Effects of Consumer Demand for Computer and Video Games 6 2.1 Sectors and Industries Directly Affected and Included 6 Information
4 th Quarter Earnings Conference Call
 4 th Quarter Earnings Conference Call KKR & Co. L.P. Investor Update February 8, 2018 4Q17 Reflections Fundamentals Are Strong (Dollars in millions, except per unit amounts and unless otherwise stated)
PROGRAM ANNOUNCEMENT. New Jersey Institute of Technology. MSPhM Systems Engineering. Newark. Fall 2008
 PROGRAM ANNOUNCEMENT November 2007 Institution: New Program Title: Degree Designation: Degree Abbreviation: CIP Code and Nomenclature (if possible): Campus(es) where the program will be offered: Date when
Financing Baltimore s Growth: Venture Capital Support for Small Companies
 Financing Baltimore s Growth: Venture Capital Support for Small Companies by Mary Miller, Ben Seigel, Mac McComas, and Lee Scrivener October 2018 Executive Summary In 2017, the Johns Hopkins 21st Century
A review of the role and costs of clinical commissioning groups
 A picture of the National Audit Office logo Report by the Comptroller and Auditor General NHS England A review of the role and costs of clinical commissioning groups HC 1783 SESSION 2017 2019 18 DECEMBER
Powered by: Norway for Life Science. Photo cover: Christopher Olssøn Design: Fete typer
 Powered by: Norway for Life Science Photo cover: Christopher Olssøn Design: Fete typer Content Photo: Istockphoto The Value of the Health Industry 4 The Research Council of Norway 6 Innovation Norway 8
The Future of Growth and the Energy Industry
 The Future of Growth and the Energy Industry July 20, 2017 Grant Thornton LLP. All rights reserved. 1 Our Speakers Steve Toon Editor in Chief Oil and Gas Investor Kevin Schroeder National Managing Partner,
ECONOMIC SNAPSHOT. A Summary of the San Diego Regional Economy UNEMPLOYMENT
 A Summary of the San Diego Regional Economy UNEMPLOYMENT San Diego Regional EDC analyzes key economic metrics that are important to understanding the regional economy and San Diego's standing relative
Investor Presentation. November 2018
 Investor Presentation November 2018 KKR Today Private Markets Public Markets Capital Markets Principal Activities $104bn AUM $91bn AUM Global Franchise $19bn of Assets $81bn Private Equity, Growth Equity
Management to Host Conference Call at 8:30 a.m. ET today
 Aclaris Therapeutics Reports Second Quarter 2016 Financial Results August 11, 2016 7:01 AM ET Management to Host Conference Call at 8:30 a.m. ET today MALVERN, Pa., Aug. 11, 2016 (GLOBE NEWSWIRE) -- (NASDAQ:ACRS),
FS INVESTMENTS & KKR FORM STRATEGIC PARTNERSHIP. Combining FSIC & CCT platforms to create stockholder value
 FS INVESTMENTS & KKR FORM STRATEGIC PARTNERSHIP Combining FSIC & CCT platforms to create stockholder value FS INVESTMENTS AND KKR TO ESTABLISH INDUSTRY-LEADING PARTNERSHIP FS Investments ( FS ) and KKR
Committee on Development and Intellectual Property (CDIP)
") E CDIP/22/INF/3 ORIGINAL: ENGLISH DATE: OCTOBER 10, 2018 Committee on Development and Intellectual Property (CDIP) Twenty-Second Session Geneva, November 19 to 23, 2018 SUMMARY OF THE STUDY ON INTELLECTUAL
E CDIP/22/INF/3 ORIGINAL: ENGLISH DATE: OCTOBER 10, 2018 Committee on Development and Intellectual Property (CDIP) Twenty-Second Session Geneva, November 19 to 23, 2018 SUMMARY OF THE STUDY ON INTELLECTUAL
The Economic Contribution of Canada s R&D Intensive Enterprises Dr. H. Douglas Barber Dr. Jeffrey Crelinsten
 The Economic Contribution of Canada s R&D Intensive Enterprises Dr. H. Douglas Barber Dr. Jeffrey Crelinsten March 2004 Table of Contents Page 1. Introduction 1 2. Retrospective Review of Firms by Research
Textron Reports First Quarter 2016 Income from Continuing Operations of $0.55 per Share, up 19.6%; Reaffirms 2016 Financial Outlook
 Textron Reports First Quarter 2016 Income Continuing Operations of $0.55 per Share, up 19.6%; Reaffirms 2016 Financial Outlook April 20, 2016 06:30 AM Eastern Daylight Time PROVIDENCE, R.I.--(BUSINESS
FINLAND. The use of different types of policy instruments; and/or Attention or support given to particular S&T policy areas.
 FINLAND 1. General policy framework Countries are requested to provide material that broadly describes policies related to science, technology and innovation. This includes key policy documents, such as
FSIC FRANCHISE. Frequently asked questions
 Frequently asked questions FSIC FRANCHISE 1. What are the details of the announced transaction? FS Investments ( FS ) and KKR Credit ( KKR ) announced an agreement to form a partnership to provide investment
BASED ECONOMIES. Nicholas S. Vonortas
 KNOWLEDGE- BASED ECONOMIES Nicholas S. Vonortas Center for International Science and Technology Policy & Department of Economics The George Washington University CLAI June 9, 2008 Setting the Stage The
Regional Innovation Ecosystems:
 Regional Innovation Ecosystems: The Role of the University in Fostering Economic Growth Ross DeVol Chief Research Officer Milken Institute Caltech Giant High Level Forum, Leading Innovation Ecosystems
Life Sciences. An evolving industry: Today s clusters creating tomorrow s breakthroughs. New Jersey JLL Research
 Life Sciences New Jersey 2017 An evolving industry: Today s clusters creating tomorrow s breakthroughs JLL Research 2 New Jersey Over the course of the past 130 years, the pharmaceutical/life sciences
Climate Change Innovation and Technology Framework 2017
 Climate Change Innovation and Technology Framework 2017 Advancing Alberta s environmental performance and diversification through investments in innovation and technology Table of Contents 2 Message from
Dynamic Cities and Creative Clusters
 Dynamic Cities and Creative Clusters Weiping Wu Associate Professor Urban Studies, Geography and Planning Virginia Commonwealth University, USA wwu@vcu.edu Presented at the Fourth International Meeting
HTA Position Paper. The International Network of Agencies for Health Technology Assessment (INAHTA) defines HTA as:
 defines HTA as:") HTA Position Paper The Global Medical Technology Alliance (GMTA) represents medical technology associations whose members supply over 85 percent of the medical devices and diagnostics purchased annually
HTA Position Paper The Global Medical Technology Alliance (GMTA) represents medical technology associations whose members supply over 85 percent of the medical devices and diagnostics purchased annually
Prof. Steven S. Saliterman. Department of Biomedical Engineering, University of Minnesota
 Department of Biomedical Engineering, University of Minnesota http://saliterman.umn.edu/ Process by which new innovations flow from the basic research bench to commercial entities and then to public use.
Advancing Health and Prosperity. A Brief to the Advisory Panel on Healthcare Innovation
 Advancing Health and Prosperity A Brief to the Advisory Panel on Healthcare Innovation November 2014 About ITAC ITAC is the voice of the Canadian information and communications technologies (ICT) industry
An Introduction to China s Science and Technology Policy
 An Introduction to China s Science and Technology Policy SHANG Yong, Ph.D. Vice Minister Ministry of Science and Technology, China and Senior Fellow Belfer Center for Science and International Affairs
Scripps Funding Corporation Meets State s Statutory and Contractual Requirements
 September 2006 Report No. 06-61 Scripps Funding Corporation Meets State s Statutory and Contractual Requirements at a glance The Office of Tourism, Trade, and Economic Development and the Scripps Florida
Perspectives of Innovative Small Companies on the Industry s Prospects for 2012 and Beyond
 Perspectives of Innovative Small Companies on the Industry s Prospects for 2012 and Beyond ACI Forum on Structuring, Negotiating and Managing Life Sciences Collaborations and Acquisitions February 28,
Chapter IV SUMMARY OF MAJOR FEATURES OF SEVERAL FOREIGN APPROACHES TO TECHNOLOGY POLICY
 Chapter IV SUMMARY OF MAJOR FEATURES OF SEVERAL FOREIGN APPROACHES TO TECHNOLOGY POLICY Chapter IV SUMMARY OF MAJOR FEATURES OF SEVERAL FOREIGN APPROACHES TO TECHNOLOGY POLICY Foreign experience can offer
INNOVATION AND ENTREPRENEURSHIP MEASUREMENT SYSTEM
 INNOVATION AND ENTREPRENEURSHIP MEASUREMENT SYSTEM February 14, 2017 ii Table of Contents Introduction... 1 Talent Pipeline... 3 FIRST Participation... 3 STEM Degrees... 4 Knowledge Worker Migration...
The 9 Sources of Innovation: Which to Use?
 The 9 Sources of Innovation: Which to Use? By Kevin Closson, Nerac Analyst Innovation is a topic fraught with controversy and conflicting viewpoints. Is innovation slowing? Is it as strong as ever? Is
Trends in Healthcare Investments and Exits 2018
 Trends in Healthcare Investments and Exits 208 208 Massachusetts Life Science Innovation Day Clark Hayes Managing Director Life Science/Healthcare Northeast Head of Business Development SVB Corporate Overview
Kazakhstan Way of Innovation Clusterization K. Mukhtarova Al-Farabi Kazak National University, Almaty, Kazakhstan
 Journal of Social Sciences (COES&RJ-JSS) ISSN (E): 2305-9249 ISSN (P): 2305-9494 Publisher: Centre of Excellence for Scientific & Research Journalism, COES&RJ LLC Online Publication Date: 1 st January
Executive Summary. Introduction:
 Recommendations for British Columbia s 2013 Budget AME BC s Pre-Budget Submission to the Select Standing Committee on Finance and Government Services - October 18, 2012 Introduction: Executive Summary