Data Visualizations in SSRS 2008 R2. Stacia Misner Principal Consultant, Data Inspirations
|
|
|
- Noreen Porter
- 6 years ago
- Views:
Transcription
1 Data Visualizations in SSRS 2008 R2 Stacia Misner Principal Consultant, Data Inspirations 5/13/2011

2 About Me Stacia Misner Consultant, Educator, Mentor, Author blog.datainspirations.com BI consulting since 1999 Mentoring, assessments, classroom instruction Works published by TechNet, SQL Server Magazine, Microsoft Press, and McGraw-Hill
3 Overview What s New in SSRS 2008 R2? The Good, The Bad, and The Ugly Visual Design Principles for Information
4 What s New in SSRS 2008 R2? Data Bars Sparklines Indicators Maps
5 Data Bars Inline bar or column chart for single data points Horizontal axis properties Axis scope Minimum/maximum values Scale options Vertical axis properties usually not relevant
 Scale")
6 Sparklines Multiple chart types for multiple data points Column, line, area, shape, range Vertical axis properties Axis scope Minimum/maximum values Scale options Horizontal axis properties Axis type (category, scalar) Scale direction


7 Indicators Display condition-based icons in a table, matrix, or list Optionally use custom images Set indicator states using absolute or percentage values Link indicators to action

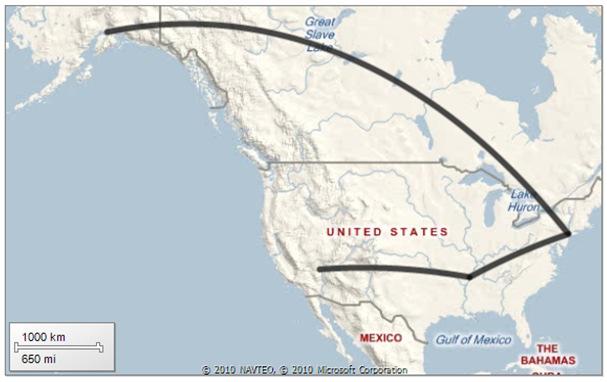
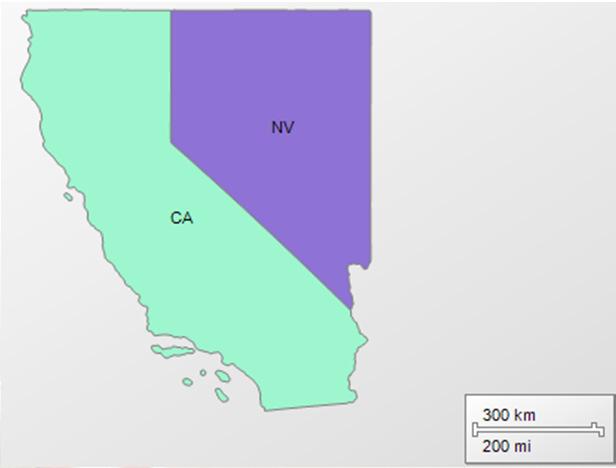
8 Spatial Data Visualizations Points Lines Polygons
9 The Good, the Bad, and the Ugly

10 The Trouble with Pie Charts


11 Too Many Gauges

12 Distorted Shapes and Sizes
13 Visual Design Principles in Information General Principles Best Practices in Chart Design Contextual Text
14 General Principles Remember your purpose is to communicate Eliminate components that do not add meaning Reduce the emphasis of non-data ink Use thin lines and soft-neutral colors Apply consistency Highlight the most important data-ink Use thicker lines bigger fonts italics Use lines or background fill to enclose important data Emphasize with different hue or color intensities
15 Best Practices in Chart Design Avoid skewing results Always start scale at zero Do not create taller but narrower chart Avoid colors that overemphasize one value over another Help readers understand the data Include tick marks and rules where appropriate Avoid 3-D charting and pie charts Remove grid lines
16 Working with Bar Charts Use horizontal bars for ranking in descending order or when category labels are too large Avoid vertical labels with vertical bars; use 45 degree angle or less if available Balance white space with width of bar Avoid fill patterns Intensify one fill color only to highlight a particular value Don t use border lines unless required to make bar visible Avoid too many categories
17 Working with Line Charts Make multiple quantitative values visually distinct Use either hue or intensity of color Alternatively use line style but use cautiously Add horizontal rules to facilitate comparisons Use a logarithmic scale when A wide range of values exists (to better view the lowest values with the highest) Ratios or percentages need to be compared (and to compare change over time for different value sets) Be sure to emphasize the scale change on the y-axis
18 Miscellaneous Components Tick marks De-emphasize on y-axis Remove from x-axis (categories stand on their own) Legends Include when you cannot put label next to line Avoid borders De-emphasize but position close to chart
19 Contextual Text On Every Page Title Differentiate from other reports with similar content Include time period, measure, and key dimensions Dates Identify range of dates covered by data Stamp the report with execution time Contact Identify the contact person for questions about report Page numbering Include both current page and total page count
20 Key Points to Remember Above all else show the data Edward R. Tufte In anything at all, perfection is finally attained not when there is no longer anything to add, but when there is no longer anything to take away. Antoine de Saint-Exupery

21 Please Complete the Evaluation Form Pick up your evaluation form: In each presentation room Drop off your completed form Near the exit of each presentation room At the registration area Presented by Dell Session Title 21
22 THANK YOU! Presented by Dell For attending this session and PASS SQLRally Orlando, Florida Session Code Session Title 22
SS Understand charts and graphs used in business.
 SS2 2.02 Understand charts and graphs used in business. Purpose of Charts and Graphs 1. Charts and graphs are used in business to communicate and clarify spreadsheet information. 2. Charts and graphs emphasize
CREATING (AB) SINGLE- SUBJECT DESIGN GRAPHS IN MICROSOFT EXCEL Lets try to graph this data
 SINGLE- SUBJECT DESIGN GRAPHS IN MICROSOFT EXCEL Lets try to graph this data") CREATING (AB) SINGLE- SUBJECT DESIGN GRAPHS IN MICROSOFT EXCEL 2003 Lets try to graph this data Date Baseline Data Date NCR (intervention) 11/10 11/11 11/12 11/13 2 3 3 1 11/15 11/16 11/17 11/18 3 3 2
CREATING (AB) SINGLE- SUBJECT DESIGN GRAPHS IN MICROSOFT EXCEL 2003 Lets try to graph this data Date Baseline Data Date NCR (intervention) 11/10 11/11 11/12 11/13 2 3 3 1 11/15 11/16 11/17 11/18 3 3 2
Using Figures - The Basics
 Using Figures - The Basics by David Caprette, Rice University OVERVIEW To be useful, the results of a scientific investigation or technical project must be communicated to others in the form of an oral
Notes 5C: Statistical Tables and Graphs
 Notes 5C: Statistical Tables and Graphs Frequency Tables A frequency table is an easy way to display raw data. A frequency table typically has between two to four columns: The first column lists all the
Purpose. Charts and graphs. create a visual representation of the data. make the spreadsheet information easier to understand.
 Purpose Charts and graphs are used in business to communicate and clarify spreadsheet information. convert spreadsheet information into a format that can be quickly and easily analyzed. make the spreadsheet
Excel Manual X Axis Scale Start At Graph
 Excel Manual X Axis Scale Start At 0 2010 Graph But when I plot them by XY chart in Excel (2003), it looks like a rectangle, even if I havesame for both X, and Y axes, and I can see the X and Y data maximum
Office 2016 Excel Basics 24 Video/Class Project #36 Excel Basics 24: Visualize Quantitative Data with Excel Charts. No Chart Junk!!!
 Office 2016 Excel Basics 24 Video/Class Project #36 Excel Basics 24: Visualize Quantitative Data with Excel Charts. No Chart Junk!!! Goal in video # 24: Learn about how to Visualize Quantitative Data with
Tables: Tables present numbers for comparison with other numbers. Data presented in tables should NEVER be duplicated in figures, and vice versa
 Tables and Figures Both tables and figures are used to: support conclusions illustrate concepts Tables: Tables present numbers for comparison with other numbers Figures: Reveal trends or delineate selected
Using Charts and Graphs to Display Data
 Page 1 of 7 Using Charts and Graphs to Display Data Introduction A Chart is defined as a sheet of information in the form of a table, graph, or diagram. A Graph is defined as a diagram that represents
Spreadsheets 3: Charts and Graphs
 Spreadsheets 3: Charts and Graphs Name: Main: When you have finished this handout, you should have the following skills: Setting up data correctly Labeling axes, legend, scale, title Editing symbols, colors,
Building a Chart Using Trick or Treat Data a step by step guide By Jeffrey A. Shaffer
 Building a Chart Using Trick or Treat Data a step by step guide By Jeffrey A. Shaffer Each year my home is bombarded on Halloween with an incredible amount of Trick or Treaters. So what else would an analytics
PASS Sample Size Software
 Chapter 945 Introduction This section describes the options that are available for the appearance of a histogram. A set of all these options can be stored as a template file which can be retrieved later.
Step 1: Set up the variables AB Design. Use the top cells to label the variables that will be displayed on the X and Y axes of the graph
 Step 1: Set up the variables AB Design Use the top cells to label the variables that will be displayed on the X and Y axes of the graph Step 1: Set up the variables X axis for AB Design Enter X axis label
Visualizing Data. Telling a story with information
 Visualizing Data Telling a story with information There were 5 Exabytes of information created between the dawn of civilization through 2003, but that much information is now created every two days. (Kind
Describing Data Visually. Describing Data Visually. Describing Data Visually 9/28/12. Applied Statistics in Business & Economics, 4 th edition
 A PowerPoint Presentation Package to Accompany Applied Statistics in Business & Economics, 4 th edition David P. Doane and Lori E. Seward Prepared by Lloyd R. Jaisingh Describing Data Visually Chapter
Chapter 10. Definition: Categorical Variables. Graphs, Good and Bad. Distribution
 Chapter 10 Graphs, Good and Bad Chapter 10 3 Distribution Definition: Tells what values a variable takes and how often it takes these values Can be a table, graph, or function Categorical Variables Places
STK110. Chapter 2: Tabular and Graphical Methods Lecture 1 of 2. ritakeller.com. mathspig.wordpress.com
 STK110 Chapter 2: Tabular and Graphical Methods Lecture 1 of 2 ritakeller.com mathspig.wordpress.com Frequency distribution Example Data from a sample of 50 soft drink purchases Frequency Distribution
Why Should We Care? More importantly, it is easy to lie or deceive people with bad plots
 Elementary Plots Why Should We Care? Everyone uses plotting But most people ignore or are unaware of simple principles Default plotting tools (or default settings) are not always the best More importantly,
Important Considerations For Graphical Representations Of Data
 This document will help you identify important considerations when using graphs (also called charts) to represent your data. First, it is crucial to understand how to create good graphs. Then, an overview
Use sparklines to show data trends
 Use sparklines to show data trends New in Microsoft Excel 2010, a sparkline is a tiny chart in a worksheet cell that provides a visual representation of data. Use sparklines to show trends in a series
Excel Manual X Axis Values Chart Multiple Labels Negative
 Excel Manual X Axis Values Chart Multiple Labels Negative Learn Excel - Chart Axis Labels at Bottom for Negative - Podcast 1897 Char asks: When. You'll see how to make a simple waterfall chart in Excel
PASS Sample Size Software. These options specify the characteristics of the lines, labels, and tick marks along the X and Y axes.
 Chapter 940 Introduction This section describes the options that are available for the appearance of a scatter plot. A set of all these options can be stored as a template file which can be retrieved later.
Infographics at CDC for a nonscientific audience
 Infographics at CDC for a nonscientific audience A Standards Guide for creating successful infographics Centers for Disease Control and Prevention Office of the Associate Director for Communication 03/14/2012;
Excel Manual X Axis Scales 2010 Graph Two X-
 Excel Manual X Axis Scales 2010 Graph Two X-axis same for both X, and Y axes, and I can see the X and Y data maximum almost the same, but the graphy on Thanks a lot for any help in advance. Peter T, Jan
Chapter 4 Displaying and Describing Quantitative Data
 Chapter 4 Displaying and Describing Quantitative Data Overview Key Concepts Be able to identify an appropriate display for any quantitative variable. Be able to guess the shape of the distribution of a
Why Should We Care? Everyone uses plotting But most people ignore or are unaware of simple principles Default plotting tools are not always the best
 Elementary Plots Why Should We Care? Everyone uses plotting But most people ignore or are unaware of simple principles Default plotting tools are not always the best More importantly, it is easy to lie
Numerical: Data with quantity Discrete: whole number answers Example: How many siblings do you have?
 Types of data Numerical: Data with quantity Discrete: whole number answers Example: How many siblings do you have? Continuous: Answers can fall anywhere in between two whole numbers. Usually any type of
Graphing Guidelines. Controlled variables refers to all the things that remain the same during the entire experiment.
 Graphing Graphing Guidelines Graphs must be neatly drawn using a straight edge and pencil. Use the x-axis for the manipulated variable and the y-axis for the responding variable. Manipulated Variable AKA
Elementary Statistics. Graphing Data
 Graphing Data What have we learned so far? 1 Randomly collect data. 2 Sort the data. 3 Compute the class width for specific number of classes. 4 Complete a frequency distribution table with the following
1.1 Displaying Distributions with Graphs, Continued
 1.1 Displaying Distributions with Graphs, Continued Ulrich Hoensch Thursday, January 10, 2013 Histograms Constructing a frequency table involves breaking the range of values of a quantitative variable
Creating Nice 2D-Diagrams
 UseCase.0046 Creating Nice 2D-Diagrams Keywords: 2D view, z=f(x,y), axis, axes, bitmap, mesh, contour, plot, font size, color lookup table, presentation Description This use case demonstrates how to configure
NCSS Statistical Software
 Chapter 147 Introduction A mosaic plot is a graphical display of the cell frequencies of a contingency table in which the area of boxes of the plot are proportional to the cell frequencies of the contingency
FlashChart. Symbols and Chart Settings. Main menu navigation. Data compression and time period of the chart. Chart types.
 FlashChart Symbols and Chart Settings With FlashChart you can display several symbols (for example indices, securities or currency pairs) in an interactive chart. You can also add indicators and draw on
Excel 2003: Discos. 1. Open Excel. 2. Create Choose a new worksheet and save the file to your area calling it: Disco.xls
 Excel 2003: Discos 1. Open Excel 2. Create Choose a new worksheet and save the file to your area calling it: Disco.xls 3. Enter the following data into your spreadsheet: 4. Make the headings bold. Centre
How to make a line graph
 How to make a line graph Line graphs are powerful in science because of the relationship they show between two variables (showing how one variable changes as the other changes). Step One You need the topic
Rainbow Logic Squares
 Thank you for downloading the science and mathematics activity packet! Below you will find a list of contents with a brief description of each of the items. This activity packet contains all the information
Comparing Methods for Solving Kuromasu Puzzles
 Comparing Methods for Solving Kuromasu Puzzles Leiden Institute of Advanced Computer Science Bachelor Project Report Tim van Meurs Abstract The goal of this bachelor thesis is to examine different methods
CS 147: Computer Systems Performance Analysis
 CS 147: Computer Systems Performance Analysis Mistakes in Graphical Presentation CS 147: Computer Systems Performance Analysis Mistakes in Graphical Presentation 1 / 45 Overview Excess Information Multiple
This tutorial will lead you through step-by-step to make the plot below using Excel.
 GES 131 Making Plots with Excel 1 / 6 This tutorial will lead you through step-by-step to make the plot below using Excel. Number of Non-Student Tickets vs. Student Tickets Y, Number of Non-Student Tickets
Excel 2013 Unit A: Getting Started With Excel 2013
 Excel 2013 Unit A: Getting Started With Excel 2013 MULTIPLE CHOICE 1. An electronic is an application you use to perform numeric calculations and to analyze and present numeric data. a. database c. dataform
TeleTrader FlashChart
 TeleTrader FlashChart Symbols and Chart Settings With TeleTrader FlashChart you can display several symbols (for example indices, securities or currency pairs) in an interactive chart. You can also add
Line Graphs. Name: The independent variable is plotted on the x-axis. This axis will be labeled Time (days), and
, and") Name: Graphing Review Graphs and charts are great because they communicate information visually. For this reason graphs are often used in newspapers, magazines, and businesses around the world. Sometimes,
Name: Graphing Review Graphs and charts are great because they communicate information visually. For this reason graphs are often used in newspapers, magazines, and businesses around the world. Sometimes,
ESSENTIAL MATHEMATICS 1 WEEK 17 NOTES AND EXERCISES. Types of Graphs. Bar Graphs
 ESSENTIAL MATHEMATICS 1 WEEK 17 NOTES AND EXERCISES Types of Graphs Bar Graphs Bar graphs are used to present and compare data. There are two main types of bar graphs: horizontal and vertical. They are
Statistics. Graphing Statistics & Data. What is Data?. Data is organized information. It can be numbers, words, measurements,
 Statistics Graphing Statistics & Data What is Data?. Data is organized information. It can be numbers, words, measurements, observations or even just descriptions of things. Qualitative vs Quantitative.
Microsoft Excel. Creating a Pie Chart on a Picture. 1. In order to create a pie chart on a picture, you need to first find
 Microsoft Excel Creating a Pie Chart on a Picture Name Date 1. In order to create a pie chart on a picture, you need to first find the picture you want to use. Click on the Internet Explorer icon. 2. When
Frequency Distribution and Graphs
 Chapter 2 Frequency Distribution and Graphs 2.1 Organizing Qualitative Data Denition 2.1.1 A categorical frequency distribution lists the number of occurrences for each category of data. Example 2.1.1
Chapter 2 Frequency Distributions and Graphs
 Chapter 2 Frequency Distributions and Graphs Outline 2-1 Organizing Data 2-2 Histograms, Frequency Polygons, and Ogives 2-3 Other Types of Graphs Objectives Organize data using a frequency distribution.
Instructions for Figure Submission
 Instructions for Figure Submission Please double check that your figures meet ALL of the following criteria: 1. Authors should be pleased with the figure submission quality before submission. It is recommended
Scientific Investigation Use and Interpret Graphs Promotion Benchmark 3 Lesson Review Student Copy
 Scientific Investigation Use and Interpret Graphs Promotion Benchmark 3 Lesson Review Student Copy Vocabulary Data Table A place to write down and keep track of data collected during an experiment. Line
A graph is an effective way to show a trend in data or relating two variables in an experiment.
 Chem 111-Packet GRAPHING A graph is an effective way to show a trend in data or relating two variables in an experiment. Consider the following data for exercises #1 and 2 given below. Temperature, ºC
Universal Scale 4.0 Instruction Manual
 Universal Scale 4.0 Instruction Manual Field Precision LLC 2D/3D finite-element software for electrostatics magnet design, microwave and pulsed-power systems, charged particle devices, thermal transport
Section 1: Data (Major Concept Review)
") Section 1: Data (Major Concept Review) Individuals = the objects described by a set of data variable = characteristic of an individual weight height age IQ hair color eye color major social security #
Section 1: Data (Major Concept Review) Individuals = the objects described by a set of data variable = characteristic of an individual weight height age IQ hair color eye color major social security #
Chapter 4. September 08, appstats 4B.notebook. Displaying Quantitative Data. Aug 4 9:13 AM. Aug 4 9:13 AM. Aug 27 10:16 PM.
 Objectives: Students will: Chapter 4 1. Be able to identify an appropriate display for any quantitative variable: stem leaf plot, time plot, histogram and dotplot given a set of quantitative data. 2. Be
Chapter 2. The Excel functions, Excel Analysis ToolPak Add-ins or Excel PHStat2 Add-ins needed to create frequency distributions are:
 I. Organizing Data in Tables II. Describing Data by Graphs Chapter 2 I. Tables: 1. Frequency Distribution (Nominal or Ordinal) 2. Grouped Frequency Distribution (Interval or Ratio data) 3. Joint Frequency
Laboratory 2: Graphing
 Purpose It is often said that a picture is worth 1,000 words, or for scientists we might rephrase it to say that a graph is worth 1,000 words. Graphs are most often used to express data in a clear, concise
YOU SHOULD MAKE SURE THAT ALL FIGURES ARE LEGIBLE AND LOOK GOOD WHEN PRINTED IN BLACK & WHITE
 I have noticed a pattern in many figures submitted to the JFE, so I want to highlight the following instructions that are often applicable (in addition to the general instructions outlined below): (1)
Lab 15: EXL3 Microsoft Excel s AutoFill Tool, Multiple Worksheets, Charts and Conditional Formatting
 Lab 15: EXL3 Microsoft Excel s AutoFill Tool, Multiple Worksheets, Charts and Conditional Formatting Learn how to work with multiple worksheets, use the AutoFill tool, charts, and apply conditional formatting
Activity Editing Bitmapped Images Chapter 3
 Activity Editing Bitmapped Images Chapter 3 Overview This is a hands-on activity. The purpose of this activity is to apply various effects to parts of an image. Learning Outcomes Students will be able
Geography 372 Introduction to Cartography Lab 2 Point, Line, and Area Symbols
 Geography 372 Introduction to Cartography Lab 2 Point, Line, and Area Symbols In this lab you will practice using point, line, and area symbols to represent geographic features on a map of Canada, and
Microsoft Excel: Data Analysis & Graphing. College of Engineering Engineering Education Innovation Center
 Microsoft Excel: Data Analysis & Graphing College of Engineering Engineering Education Innovation Center Objectives Use relative, absolute, and mixed cell referencing Identify the types of graphs and their
Transcript for Session 049
 Transcript for Session 049 Listen to the podcast session, see resources & links: http://chandoo.org/session49/ Transcript: Hi and welcome to http://chandoo.org podcast. This is session number 49. We are
Excel Tool: Plots of Data Sets
 Excel Tool: Plots of Data Sets Excel makes it very easy for the scientist to visualize a data set. In this assignment, we learn how to produce various plots of data sets. Open a new Excel workbook, and
MOAS II Client Intelligent Antenna Switch
 MOAS II Client Intelligent Antenna Switch Version 1.0.5 Yankee Clipper Contest Club Legal Notices Copyright 2015, 2018, Paul Young. All Rights Reserved. Windows, Windows XP, Windows Vista, Windows 7, Windows
CHM 109 Excel Refresher Exercise adapted from Dr. C. Bender s exercise
 CHM 109 Excel Refresher Exercise adapted from Dr. C. Bender s exercise (1 point) (Also see appendix II: Summary for making spreadsheets and graphs with Excel.) You will use spreadsheets to analyze data
Excel Lab 2: Plots of Data Sets
 Excel Lab 2: Plots of Data Sets Excel makes it very easy for the scientist to visualize a data set. In this assignment, we learn how to produce various plots of data sets. Open a new Excel workbook, and
Managing Your Dissertation From Beginning to End. Mike Brady Florida State University
 Managing Your Dissertation From Beginning to End Mike Brady Florida State University My Study Rather than give you opinions based on n=1, I decided to obtain a broader perspective. What advice would you
Chapter 3. Graphical Methods for Describing Data. Copyright 2005 Brooks/Cole, a division of Thomson Learning, Inc.
 Chapter 3 Graphical Methods for Describing Data 1 Frequency Distribution Example The data in the column labeled vision for the student data set introduced in the slides for chapter 1 is the answer to the
Sensors and Scatterplots Activity Excel Worksheet
 Name: Date: Sensors and Scatterplots Activity Excel Worksheet Directions Using our class datasheets, we will analyze additional scatterplots, using Microsoft Excel to make those plots. To get started,
Chpt 2. Frequency Distributions and Graphs. 2-3 Histograms, Frequency Polygons, Ogives / 35
 Chpt 2 Frequency Distributions and Graphs 2-3 Histograms, Frequency Polygons, Ogives 1 Chpt 2 Homework 2-3 Read pages 48-57 p57 Applying the Concepts p58 2-4, 10, 14 2 Chpt 2 Objective Represent Data Graphically
Oldham Lifelong Learning Service Frances Hill
 SET UP A MOODLE BOOK Moodle Books are made up of connected web pages. You can therefore build into your book anything which is possible in Page, except that you are not restricted to just one page. The
User Guide. Version 1.2. Copyright Favor Software. Revised:
 User Guide Version 1.2 Copyright 2009-2010 Favor Software Revised: 2010.05.18 Table of Contents Introduction...4 Installation on Windows...5 Installation on Macintosh...6 Registering Intwined Pattern Studio...7
Students use absolute value to determine distance between integers on the coordinate plane in order to find side lengths of polygons.
 Student Outcomes Students use absolute value to determine distance between integers on the coordinate plane in order to find side lengths of polygons. Lesson Notes Students build on their work in Module
Excel Manual X Axis Label Not Showing
 Excel Manual X Axis Label Not Showing Currently the labels in lines 31/32 are just pasted. This requires a lot of manual work. Is there a way to Level X-Axis labels. if that is not possible using data
Chapter 4. Displaying and Summarizing Quantitative Data. Copyright 2012, 2008, 2005 Pearson Education, Inc.
 Chapter 4 Displaying and Summarizing Quantitative Data Copyright 2012, 2008, 2005 Pearson Education, Inc. Dealing With a Lot of Numbers Summarizing the data will help us when we look at large sets of quantitative
User Guide. Version 1.4. Copyright Favor Software. Revised:
 User Guide Version 1.4 Copyright 2009-2012 Favor Software Revised: 2012.02.06 Table of Contents Introduction... 4 Installation on Windows... 5 Installation on Macintosh... 6 Registering Intwined Pattern
Creating Run Charts (Time Series Plots, Line Charts) Excel 2010 Tutorial
 Excel 2010 Tutorial") Creating Run Charts (Time Series Plots, Line Charts) Excel 2010 Tutorial Excel file for use with this tutorial GraphTutorData.xlsx File Location http://faculty.ung.edu/kmelton/data/graphtutordata.xlsx
Creating Run Charts (Time Series Plots, Line Charts) Excel 2010 Tutorial Excel file for use with this tutorial GraphTutorData.xlsx File Location http://faculty.ung.edu/kmelton/data/graphtutordata.xlsx
Excel Manual X Axis Label Below Chart 2010 >>>CLICK HERE<<<
 Excel Manual X Axis Label Below Chart 2010 When the X-axis is crowded with labels one way to solve the problem is to split the labels for to use two rows of labels enter the two rows of X-axis labels as
Preparation of figures for Publication in Clinical and Experimental Pharmacology and Physiology
 CEPP Guidelines for Preparation and Submission of Figures 1 Preparation of figures for Publication in Clinical and Experimental Pharmacology and Physiology Important Note: Submitted manuscripts with figures
Chapter 1. Picturing Distributions with Graphs
 Chapter 1. Picturing Distributions with Graphs 1 Chapter 1. Picturing Distributions with Graphs Definition. Individuals are the objects described by a set of data. Individuals may be people, but they may
Algebra. Teacher s Guide
 Algebra Teacher s Guide WALCH PUBLISHING Table of Contents To the Teacher.......................................................... vi Classroom Management..................................................
Light In Architecture
 Designing with Light Light plays a central role in the design of a visual environment. The architecture, people and objects are all made visible by the lighting. Light influences our well-being, the aesthetic
Principles of Graphical Excellence Best Paper: ALAIR April 5 6, 2001 AIR: June 2-5, 2002, Toronto Focus-IR, February 21, 2003
 Anna T. Waggener, Ph.D. Institutional Assessment United States Army War College Principles of Graphical Excellence Best Paper: ALAIR April 5 6, 2001 AIR: June 2-5, 2002, Toronto Focus-IR, February 21,
S. Rinzivillo DATA VISUALIZATION AND VISUAL ANALYTICS
 S. Rinzivillo rinzivillo@is/.cnr.it DATA VISUALIZATION AND VISUAL ANALYTICS TAXONOMY OF VISUAL VARIABLES Cleveland McGill [1984] Cleveland & McGill: graphical encodings Angle Area Color Hue Color Satura/on
PSY 307 Statistics for the Behavioral Sciences. Chapter 2 Describing Data with Tables and Graphs
 PSY 307 Statistics for the Behavioral Sciences Chapter 2 Describing Data with Tables and Graphs Class Progress To-Date Math Readiness Descriptives Midterm next Monday Frequency Distributions One of the
TOPIC 4 GRAPHICAL PRESENTATION
 TOPIC 4 GRAPHICAL PRESENTATION Public agencies are very keen on amassing statistics they collect them, raise them to the nth power, take the cube root, and prepare wonderful diagrams. But what you must
General tips for all graphs Choosing the right kind of graph scatter graph bar graph
 Excerpted and adapted from: McDonald, J.H. 2014. Handbook of Biological Statistics (3rd ed.). Sparky House Publishing, Baltimore, MD. (http://www.biostathandbook.com/graph.html) Guide to fairly good graphs
Ms. Cavo Graphic Art & Design Illustrator CS3 Notes
 Ms. Cavo Graphic Art & Design Illustrator CS3 Notes 1. Selection tool - Lets you select objects and groups by clicking or dragging over them. You can also select groups within groups and objects within
Describing Data: Frequency Tables, Frequency Distributions, and Graphic Presentation. Chapter 2
 Describing Data: Frequency Tables, Frequency Distributions, and Graphic Presentation Chapter 2 Learning Objectives Organize qualitative data into a frequency table. Present a frequency table as a bar chart
Back up your data regularly to protect against loss due to power failure, disk damage, or other mishaps. This is very important!
 Overview StatTrak for Soccer is a soccer statistics management system for league, tournament, and individual teams. Keeps records for up to 100 teams per directory (99 players per team). Tracks team and
LESSON 2: FREQUENCY DISTRIBUTION
 LESSON : FREQUENCY DISTRIBUTION Outline Frequency distribution, histogram, frequency polygon Relative frequency histogram Cumulative relative frequency graph Stem-and-leaf plots Scatter diagram Pie charts,
A Visual Display. A graph is a visual display of information or data. This is a graph that shows a girl walking her dog. Communicating with Graphs
 A Visual Display A graph is a visual display of information or data. This is a graph that shows a girl walking her dog. A Visual Display The horizontal axis, or the x-axis, measures time. Time is the independent
Then finding the slope, we can just use the same method that we have done the other ones we get the slope 4 1
 169 Graphing Equations with Slope Okay, now that you know how to graph a line by getting some points, and you know how to find the slope between two points, you should be able to find the slope of a line
Map Lettering. labelling
 Map Lettering labelling General rule: Lettering is an extension of the symbol itself, and should be 'automatically' attached to it in the mind of the reader, both in design and positioning: 'good lettering'
Remote Sensing. The following figure is grey scale display of SPOT Panchromatic without stretching.
 Remote Sensing Objectives This unit will briefly explain display of remote sensing image, geometric correction, spatial enhancement, spectral enhancement and classification of remote sensing image. At
B. Embossing. 1. Description. a. Embossing
 B. Embossing 1. Description a. Embossing Often used in combination with foil stamping, embossing is a process that applies pressure to the backside of a material to alter the surface, giving it a three
Digital Image Processing. Lecture # 8 Color Processing
 Digital Image Processing Lecture # 8 Color Processing 1 COLOR IMAGE PROCESSING COLOR IMAGE PROCESSING Color Importance Color is an excellent descriptor Suitable for object Identification and Extraction
DESCRIBING DATA. Frequency Tables, Frequency Distributions, and Graphic Presentation
 DESCRIBING DATA Frequency Tables, Frequency Distributions, and Graphic Presentation Raw Data A raw data is the data obtained before it is being processed or arranged. 2 Example: Raw Score A raw score is
Sections Descriptive Statistics for Numerical Variables
 Math 243 Sections 2.1.2-2.2.5 Descriptive Statistics for Numerical Variables A framework to describe quantitative data: Describe the Shape, Center and Spread, and Unusual Features Shape How is the data
ISSUES IN TYPOGRAPHY An Introduction
 An Introduction CONTENTS Chapter 1 Visual Hierarchy Reviewed Chapter 2 Type Parts and Measurement Chapter 3 Contrast of Typographic Elements Chapter 4 Typographic Spacing Basic Chapter 5 Alignment or Structure
aspexdraw aspextabs and Draw MST
 aspexdraw aspextabs and Draw MST 2D Vector Drawing for Schools Quick Start Manual Copyright aspexsoftware 2005 All rights reserved. Neither the whole or part of the information contained in this manual