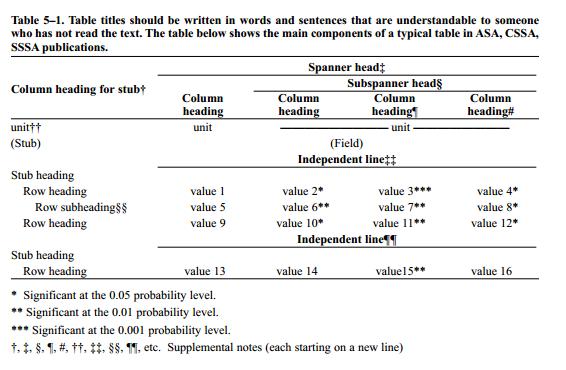
Tables: Tables present numbers for comparison with other numbers. Data presented in tables should NEVER be duplicated in figures, and vice versa
|
|
|
- Henry Evans
- 5 years ago
- Views:
Transcription
1 Tables and Figures Both tables and figures are used to: support conclusions illustrate concepts Tables: Tables present numbers for comparison with other numbers Figures: Reveal trends or delineate selected features. Data presented in tables should NEVER be duplicated in figures, and vice versa
2 Textual references to Figures and Tables Figures and tables presented consecutively in the text, beginning with the number one. Capitalize the t in table and the f in figure when you refer to a specific table or figure created in your text. Most journals have this convention see table XXX is nonsense. When interpreting, avoid redundancy.
3 Figure and table headers and footers Use these recommended fonts where possible: Arial, Helvetica, Times New Roman consistent font within and among sections All figure elements, including letters, numbers, and symbols, must be legible at their final size. In general, authors should make the figure type size large enough so that it is at least 8 points after reduction. No type should be less than 6 points.
4 Ability to follow directions Define all abbreviations Parameters are italicized Check spelling Consistent with journal?
5 Tables Is the table necessary? Not all analyses or results warrant a Table or Figure. Simple results are best stated in a single sentence, with data summarized parenthetically Tables are not meant to be a data dump Consistent presentation Consistent with the tables in the journal or your advisor s demands Are all abbreviations; special use of italics, parentheses, and dashes; and special symbols explained? There are no vertical lines in tables
6 Tables Statistical considerations Are all probability level values correctly identified asterisks attached to the appropriate table entries? Is a probability level assigned the same number of asterisks in all the tables in the same document?
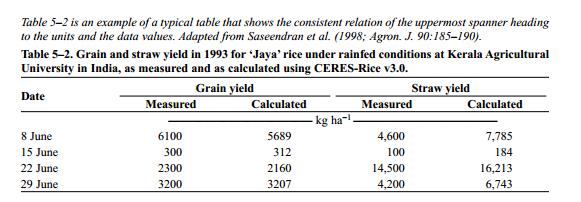
7 Tables Tables have headers. Headers are located at the top of the table Present the header in plain text with only the initial letter of the header and any proper names in the caption capitalized. Is the header as brief as possible but completely explanatory? Economy and clarity. Do not be afraid to use lengthy figure and table captions if the table content demands it this is preferable to confusing or incomplete ones.
8 PLOS One Biology Instructions to authors
9 This is a chart junk table Header 1 Header 2 Header 3 Header 4 Header 5 Header
10 This is a chart junk table Header 1 Header 2 Header 3 Header 4 Header 5 Header
11 This is a chart junk table Header 1 (units) Header 2 (units) Header 3 (units) Header 4 (units) Header 5 (units) Header 6 (units)
12 This is a chart junk table Header 1 (units) Header 2 (units) Header 3 (units) Header 4 (units) Header 5 (units) Header 6 (units)
13 This is a chart junk table Header 1 (units) Header 2 (units) Header 3 (units) Header 4 (units) Header 5 (units) Header 6 (units)
14 This is a chart junk table Header 1 (units) Header 2 (units) Header 3 (units) Header 4 (units) Header 5 (units) Header 6 (units)
15 This is a chart junk table Header 1 (units) Header 2 (units) Header 3 (units) Header 4 (units) Header 5 (units) Header 6 (units)
16
17
18
19
20
21 Figures Encompass at least four substantially different kinds of illustrations in black and white, shades of gray, color, or some combination: Quantitative data (line, bar, etc.) Line drawings Maps Photographs
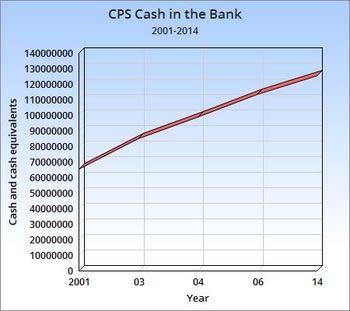
22 Figures formatting considerations They are generally used to show trends rather than the detailed information in a table Aspect ratio of height 2/3 of the width Do not draw a box around them
23 Figures Images should have a minimum resolution of 300 dpi. The final size of the published figure depend on where it will appear For journals, a single column is approximately 8.5 cm (3.5 inches) wide Full page width is approximately 17.8 cm (7 inches)
24 Figure graphic elements Axis scale Do not crowd Legend Complete that identifies figure elements Lines Every line has a meaning and a purpose No decorative borders, shadows or other Excel garbage
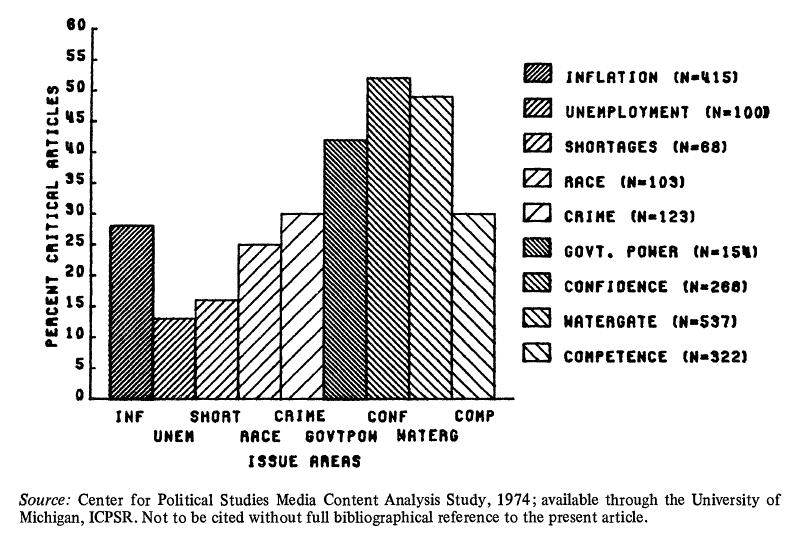
25 Edward Tufte The graphical display of quantitative information Figures should not draw the reader to the heaviness of the data through excessive shading Instead, focus on presenting quantitative contents In writing, you must kill all your darlings. ** William Faulkner **true for your T & F
26 Tufte The graphical display of quantitative information
27 Tufte The graphical display of quantitative information The more you leave out, the more you highlight what you leave in.

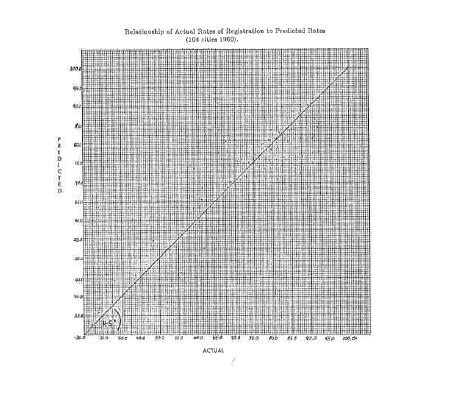
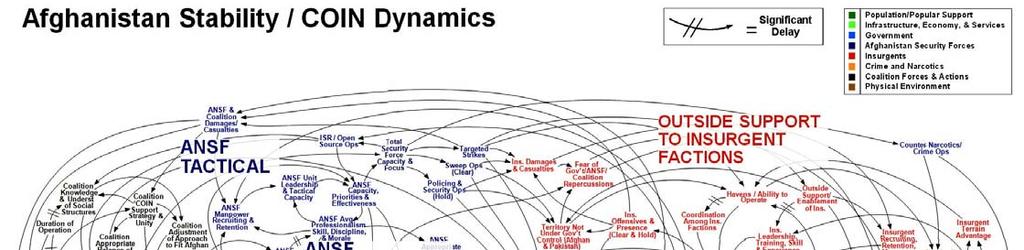
28 Compare the data to ink ratio

29 Compare the data to ink ratio
30
31
32
33
34
35
36
37
38
39
40 Data to ink ratio
41 Data to ink ratio
42 Data to ink ratio
43
44
45 Data to ink ratio
46 Figure display is best when: Correct and legible (Large) labels with units. Correct and legible (Large) tick marks. Grayscale (white to black) points and lines. Equation variables need to relate to independent, and dependent variables on the figure. Minimize ink horizontal lines that do nothing to add to the interpretation (unless they do). Axes range must coincide with data range.
47 Perfect chart junk: 10 8 Catch-at-age Data y = x R 2 = ln(n) 4 2 Not Used Used Age
48 Perfect chart junk: 10 8 Catch-at-age Data y = x R 2 = ln(n) 4 2 Not Used Used Age
49 Perfect chart junk: Catch-at-age Data y = x R 2 = ln(n) Not Used Used Age
50 Perfect chart junk: Catch-at-age Data y = x R 2 = ln(n) Not Used Used Age
51 Perfect chart junk: Catch-at-age Data ln(n) = (age) R 2 = ln(n) Not Used Used Age
52 Perfect chart junk: Catch-at-age Data ln(n) Not Used Used Age Figure XXX. Line described ln(n) = (age) , R 2 = 0.941
53 Perfect chart junk: ln(n) Not Used Used Age Figure XXX. Catch-at-age Data described by ln(n) = (age) , R 2 = 0.941
54 Perfect chart junk: ln(n) Not Used Used Age Figure XXX. Catch-at-age Data described by ln(n) = (age) , R 2 = 0.941
55 Perfect chart junk: ln(n) Age = Open Circle not used in Figure XXX. Catch-at-age Data described by ln(n) = (age) , R 2 regression.
56 Perfect chart junk: ln(n) Age = Open Circle not used in Figure XXX. Catch-at-age Data described by ln(n) = (age) , R 2 regression.
57 Perfect chart junk: ln(n) Age = Open Circle not used in Figure XXX. Catch-at-age Data described by ln(n) = (age) , R 2 regression.
58 Presentation quality figure (in many steps): Natural log of population Estimate, ln(n) Age (y) Figure XXX. Catch curve of Jerrius Garciaii from data collected in San Francisco Bay, California, USA, The solid line is a linear regression of the natural log of population size (circles) as a function of age (y), R 2 = Only those data with open circles were used for the determination of the regression parameters following the Peak Method, described in this manuscript. The regression line is extended for ages one to three to provide contrast. Estimated mean instantaneous total natural, Z is 0.51 y -1.
Spreadsheets 3: Charts and Graphs
 Spreadsheets 3: Charts and Graphs Name: Main: When you have finished this handout, you should have the following skills: Setting up data correctly Labeling axes, legend, scale, title Editing symbols, colors,
Preparation of figures for Publication in Clinical and Experimental Pharmacology and Physiology
 CEPP Guidelines for Preparation and Submission of Figures 1 Preparation of figures for Publication in Clinical and Experimental Pharmacology and Physiology Important Note: Submitted manuscripts with figures
Tables and Figures. Germination rates were significantly higher after 24 h in running water than in controls (Fig. 4).
.") Tables and Figures Text: contrary to what you may have heard, not all analyses or results warrant a Table or Figure. Some simple results are best stated in a single sentence, with data summarized parenthetically:
Tables and Figures Text: contrary to what you may have heard, not all analyses or results warrant a Table or Figure. Some simple results are best stated in a single sentence, with data summarized parenthetically:
Artwork. Electronic Figure Submission. Line Art
 Artwork For the best quality final product, it is highly recommended that you submit all of your artwork photographs, line drawings, etc. in an electronic format. Your art will then be produced to the
Using Figures - The Basics
 Using Figures - The Basics by David Caprette, Rice University OVERVIEW To be useful, the results of a scientific investigation or technical project must be communicated to others in the form of an oral
PASS Sample Size Software. These options specify the characteristics of the lines, labels, and tick marks along the X and Y axes.
 Chapter 940 Introduction This section describes the options that are available for the appearance of a scatter plot. A set of all these options can be stored as a template file which can be retrieved later.
Using Charts and Graphs to Display Data
 Page 1 of 7 Using Charts and Graphs to Display Data Introduction A Chart is defined as a sheet of information in the form of a table, graph, or diagram. A Graph is defined as a diagram that represents
NCSS Statistical Software
 Chapter 147 Introduction A mosaic plot is a graphical display of the cell frequencies of a contingency table in which the area of boxes of the plot are proportional to the cell frequencies of the contingency
YOU SHOULD MAKE SURE THAT ALL FIGURES ARE LEGIBLE AND LOOK GOOD WHEN PRINTED IN BLACK & WHITE
 I have noticed a pattern in many figures submitted to the JFE, so I want to highlight the following instructions that are often applicable (in addition to the general instructions outlined below): (1)
THE LOGO 4 COLOR PALETTE 6 LOGO USAGE 7 THE TYPEFACE 8 GENERAL GUIDELINES 10 TYPOGRAPHY USAGE 11 SUPPLEMENTAL ICONS 12
 BRAND GUIDELINES THE LOGO 4 Clear Area Alternate Logo Versions COLOR PALETTE 6 Color Options LOGO USAGE 7 THE TYPEFACE 8 Suggested Uses GENERAL GUIDELINES 10 TYPOGRAPHY USAGE 11 SUPPLEMENTAL ICONS 12
Section 3 Correlation and Regression - Worksheet
 The data are from the paper: Exploring Relationships in Body Dimensions Grete Heinz and Louis J. Peterson San José State University Roger W. Johnson and Carter J. Kerk South Dakota School of Mines and
Instructions for Figure Submission
 Instructions for Figure Submission Please double check that your figures meet ALL of the following criteria: 1. Authors should be pleased with the figure submission quality before submission. It is recommended
Lecture Notes: Writing and figures
 Lecture Notes: Writing and figures The creation of a good figure is somewhat of a creative process. It is definitely not trivial. It is not sufficient to use a simple plot command and do nothing else.
Why Should We Care? More importantly, it is easy to lie or deceive people with bad plots
 Elementary Plots Why Should We Care? Everyone uses plotting But most people ignore or are unaware of simple principles Default plotting tools (or default settings) are not always the best More importantly,
Instructions to Authors for Preparing Manuscripts Prior to submitting via Peer Track Natural Areas Journal
 Instructions to Authors for Preparing Manuscripts Prior to submitting via Peer Track Natural Areas Journal Please read: the NAJ has also instituted a new process for manuscript submissions. We have designed
Office 2016 Excel Basics 24 Video/Class Project #36 Excel Basics 24: Visualize Quantitative Data with Excel Charts. No Chart Junk!!!
 Office 2016 Excel Basics 24 Video/Class Project #36 Excel Basics 24: Visualize Quantitative Data with Excel Charts. No Chart Junk!!! Goal in video # 24: Learn about how to Visualize Quantitative Data with
Using Graphing Skills
 Name Class Date Laboratory Skills 8 Using Graphing Skills Introduction Recorded data can be plotted on a graph. A graph is a pictorial representation of information recorded in a data table. It is used
A Guide to Using the Generic Flyer Template
 A Guide to Using the Generic Flyer Template The purpose of this document is to demonstrate the creative uses of the Generic Flyer Template as well as providing a style guide for the successful application
Engineering Fundamentals and Problem Solving, 6e
 Engineering Fundamentals and Problem Solving, 6e Chapter 5 Representation of Technical Information Chapter Objectives 1. Recognize the importance of collecting, recording, plotting, and interpreting technical
Digital Art Requirements for Submission
 Requirements for Submission Contents 1. Overview What Is Digital Art? Types of Digital Art: Scans and Computer-Based Drawings 3 3 3 2. Image Resolution for Continuous-Tone Scans Continuous-Tone or Bi-tonal?
PASS Sample Size Software
 Chapter 945 Introduction This section describes the options that are available for the appearance of a histogram. A set of all these options can be stored as a template file which can be retrieved later.
Chapter 2: PRESENTING DATA GRAPHICALLY
 2. Presenting Data Graphically 13 Chapter 2: PRESENTING DATA GRAPHICALLY A crowd in a little room -- Miss Woodhouse, you have the art of giving pictures in a few words. -- Emma 2.1 INTRODUCTION Draw a
Graphing Guidelines. Controlled variables refers to all the things that remain the same during the entire experiment.
 Graphing Graphing Guidelines Graphs must be neatly drawn using a straight edge and pencil. Use the x-axis for the manipulated variable and the y-axis for the responding variable. Manipulated Variable AKA
Using Graphing Skills
 Name Class Date Laboratory Skills 8 Using Graphing Skills Introduction Recorded data can be plotted on a graph. A graph is a pictorial representation of information recorded in a data table. It is used
Data Visualizations in SSRS 2008 R2. Stacia Misner Principal Consultant, Data Inspirations
 Data Visualizations in SSRS 2008 R2 Stacia Misner Principal Consultant, Data Inspirations 5/13/2011 About Me Stacia Misner Consultant, Educator, Mentor, Author smisner@datainspirations.com Twitter: @StaciaMisner
Physics 253 Fundamental Physics Mechanic, September 9, Lab #2 Plotting with Excel: The Air Slide
 1 NORTHERN ILLINOIS UNIVERSITY PHYSICS DEPARTMENT Physics 253 Fundamental Physics Mechanic, September 9, 2010 Lab #2 Plotting with Excel: The Air Slide Lab Write-up Due: Thurs., September 16, 2010 Place
Resting pulse After exercise Resting pulse After exercise. Trial Trial Trial Trial. Subject Subject
 EXERCISE 2.3 Data Presentation Objectives After completing this exercise, you should be able to 1. Explain the difference between discrete and continuous variables and give examples. 2. Use one given data
Creating Run Charts (Time Series Plots, Line Charts) Excel 2010 Tutorial
 Excel 2010 Tutorial") Creating Run Charts (Time Series Plots, Line Charts) Excel 2010 Tutorial Excel file for use with this tutorial GraphTutorData.xlsx File Location http://faculty.ung.edu/kmelton/data/graphtutordata.xlsx
Creating Run Charts (Time Series Plots, Line Charts) Excel 2010 Tutorial Excel file for use with this tutorial GraphTutorData.xlsx File Location http://faculty.ung.edu/kmelton/data/graphtutordata.xlsx
Creating Digital Artwork
 5Steps to Creating Digital Artwork (For more detailed instructions, please click here) Introduction to Digital Artwork Authors often choose to include digital artwork as part of a submission to a medical
1940 US Federal Census
 1940 US Federal Census US 1940 Census Image Icons Census Form Data Entry Icons Data Entry Area Project Help Tabs Note the Project Help tabs in the lower right hand corner of the program. Before indexing
Lab 4 Projectile Motion
 b Lab 4 Projectile Motion What You Need To Know: x x v v v o ox ox v v ox at 1 t at a x FIGURE 1 Linear Motion Equations The Physics So far in lab you ve dealt with an object moving horizontally or an
Submission of Figures to the Japanese Journal of Ophthalmology
 Submission of Figures to the Japanese Journal of Ophthalmology 1. All figures should be ready for publication without the need for changes by either the editors or publishers. 2. There should be no text
Using Graphing Skills
 Name Class Date Laboratory Skills 8 Using Graphing Skills Time required: 30 minutes Introduction Recorded data can be plotted on a graph. A graph is a pictorial representation of information recorded in
Why Should We Care? Everyone uses plotting But most people ignore or are unaware of simple principles Default plotting tools are not always the best
 Elementary Plots Why Should We Care? Everyone uses plotting But most people ignore or are unaware of simple principles Default plotting tools are not always the best More importantly, it is easy to lie
Brand Identity System Interim Guidelines 12/2011
 Brand Identity System Interim Guidelines 12/2011 Table of Contents Introduction 2 The jcp Flag 3 The Brand Identity Components 4 About the jcp Flag 5 Using the jcp Flag Three Size Versions 6 Using the
HANDS-ON TRANSFORMATIONS: RIGID MOTIONS AND CONGRUENCE (Poll Code 39934)
") HANDS-ON TRANSFORMATIONS: RIGID MOTIONS AND CONGRUENCE (Poll Code 39934) Presented by Shelley Kriegler President, Center for Mathematics and Teaching shelley@mathandteaching.org Fall 2014 8.F.1 8.G.1a
HANDS-ON TRANSFORMATIONS: RIGID MOTIONS AND CONGRUENCE (Poll Code 39934) Presented by Shelley Kriegler President, Center for Mathematics and Teaching shelley@mathandteaching.org Fall 2014 8.F.1 8.G.1a
0418 INFORMATION TECHNOLOGY
 UNIVERSITY OF CAMBRIDGE INTERNATIONAL EXAMINATIONS International General Certificate of Secondary Education MARK SCHEME for the May/June 2007 question paper 0418 INFORMATION TECHNOLOGY 0418/02 Paper 2
background research word count Title SUBMISSION GUIDELINES FOR PUBLISHING SCIENCE FAIR WRITTEN WORK
 Name and number January 26 Science Fair background research word count Title SUBMISSION GUIDELINES FOR PUBLISHING SCIENCE FAIR WRITTEN WORK Open a single Word document for your Science Fair project. That
Civil Engineering Drawing
 Civil Engineering Drawing Third Angle Projection In third angle projection, front view is always drawn at the bottom, top view just above the front view, and end view, is drawn on that side of the front
4-H H Computer Art Manual : Basic Guidelines for Computer Poster Art
 University of Nebraska - Lincoln DigitalCommons@University of Nebraska - Lincoln Nebraska 4-H Clubs: Historical Materials and Publications 4-H Youth Development April 2015 4-H 238 4-H Computer Art Manual
By the Numbers. Obtaining and Using Data in Your Communication Efforts
 By the Numbers Obtaining and Using Data in Your Communication Efforts NABE-COMM 2013 Sep 27, 2013 By the Numbers Conor Jensen TexasBarBooks Kerstin Firmin The Bar Association of San Francisco Anna Zanolli
Standard Specification for Candle Fire Safety Labeling 1
 Designation: F2058 07 Standard Specification for Candle Fire Safety Labeling 1 This standard is issued under the fixed designation F2058; the number immediately following the designation indicates the
Higher Graphic Communication. Homework. Knowledge and Interpretation. Name. Page
 Higher Graphic Communication Homework Knowledge and Interpretation Name Page Homework 1 Q1. For each of the following lines name each and explain where it would be used on a drawing. A coloured electronic
Advisory Raised Characters. Signs that are designed to be read by touch should not have sharp or abrasive edges.
 ADAAG/ABA* US Access Board 7/23/04 *Not the enforceable standard for accessibility under the ADA. This document has not been adopted by the US Department of Justice as enforceable under Title II and III
Chapter 6. Architectural Lines and Lettering
 Chapter 6 Architectural Lines and Lettering Drafting Introduction Universal graphic language Uses lines, symbols, dimensions, and notes to describe a structure to be built Properly drawn lines are dark,
Addendum COLOR PALETTES
 Addendum Followup Material from Best Practices in Graphical Data Presentation Workshop 2010 Library Assessment Conference Baltimore, MD, October 25-27, 2010 COLOR PALETTES Two slides from the workshop
PORTAGE COUNTY WATER RESOURCES DRAFTING STANDARDS. Date: January 26, 2001
 PORTAGE COUNTY WATER RESOURCES DRAFTING STANDARDS Date: January 26, 2001 Portage County Water Resources Drafting Standards. AutoCad 2000/Land Development Desktop R2 Friday, January 26, 2001 Preface: Part
Step 1: Set up the variables AB Design. Use the top cells to label the variables that will be displayed on the X and Y axes of the graph
 Step 1: Set up the variables AB Design Use the top cells to label the variables that will be displayed on the X and Y axes of the graph Step 1: Set up the variables X axis for AB Design Enter X axis label
GUIDELINES FOR DRAFTING
 UNIT 1 GUIDELINES FOR DRAFTING 1.1 Introduction The term draughting is used to describe the language of drafting in this book. It defines the terminology, symbology, conventions, and standards used in
GRAPHICAL PRESENTATION OF DATA
 GRAPHICAL PRESENTATION OF DATA Mathematicians measure with their minds alone the forms of things separated from all matter. Since we wish the object to be seen, we will use a more sensate wisdom. Leon
Appendix C: Graphing. How do I plot data and uncertainties? Another technique that makes data analysis easier is to record all your data in a table.
 Appendix C: Graphing One of the most powerful tools used for data presentation and analysis is the graph. Used properly, graphs are an important guide to understanding the results of an experiment. They
HIGHWAY SAFETY RESEARCH GROUP
 1. Why use data visualization? 2. Why we perceive data visualizations better than tabular data? 3. How do we choose the proper visualization to display our data? 4. What are the Dos and Don ts of creating
Poster session Date and time have changed! Will be announced!!
 Poster session Date and time have changed! Will be announced!! Show off your projects Get experience See what others have done Faculty graders; peer graders Refreshments Award for best presentation (cert
Scientific Communication and visual reasoning. presentation for Institute for Leadership in Technology and Management July 5, 1999 Dan Little
 Scientific Communication and visual reasoning presentation for Institute for Leadership in Technology and Management July 5, 1999 Dan Little Edward Tufte, theorist of scientific graphics A political scientist
all editorial writing.
 PROOFREADING INSTRUCTIONS 1. Read the entire article carefully. Please note that your article has been edited for journal style and for English grammar and usage. Not all editorial changes will be mentioned
Infographics at CDC for a nonscientific audience
 Infographics at CDC for a nonscientific audience A Standards Guide for creating successful infographics Centers for Disease Control and Prevention Office of the Associate Director for Communication 03/14/2012;
CHM 152 Lab 1: Plotting with Excel updated: May 2011
 CHM 152 Lab 1: Plotting with Excel updated: May 2011 Introduction In this course, many of our labs will involve plotting data. While many students are nerds already quite proficient at using Excel to plot
Portfolio Primer University of Minnesota School of Architecture College of Design
 Portfolio Primer University of Minnesota School of Architecture College of Design John Comazzi, Associate Professor of Architecture Let your images breath. Avoid overlaps of images and text over images.
CHM 109 Excel Refresher Exercise adapted from Dr. C. Bender s exercise
 CHM 109 Excel Refresher Exercise adapted from Dr. C. Bender s exercise (1 point) (Also see appendix II: Summary for making spreadsheets and graphs with Excel.) You will use spreadsheets to analyze data
Chapter 4 MASK Encryption: Results with Image Analysis
 95 Chapter 4 MASK Encryption: Results with Image Analysis This chapter discusses the tests conducted and analysis made on MASK encryption, with gray scale and colour images. Statistical analysis including
Honors Chemistry Summer Assignment
 Honors Chemistry Summer Assignment Page 1 Honors Chemistry Summer Assignment 2014-2015 Materials needed for class: Scientific or Graphing Calculator Mrs. Dorman ldorman@ringgold.org Notebook with folder
MATHEMATICAL FUNCTIONS AND GRAPHS
 1 MATHEMATICAL FUNCTIONS AND GRAPHS Objectives Learn how to enter formulae and create and edit graphs. Familiarize yourself with three classes of functions: linear, exponential, and power. Explore effects
CS 200 Assignment 3 Pixel Graphics Due Monday May 21st 2018, 11:59 pm. Readings and Resources
 CS 200 Assignment 3 Pixel Graphics Due Monday May 21st 2018, 11:59 pm Readings and Resources Texts: Suggested excerpts from Learning Web Design Files The required files are on Learn in the Week 3 > Assignment
Bioacoustics Lab- Spring 2011 BRING LAPTOP & HEADPHONES
 Bioacoustics Lab- Spring 2011 BRING LAPTOP & HEADPHONES Lab Preparation: Bring your Laptop to the class. If don t have one you can use one of the COH s laptops for the duration of the Lab. Before coming
MEMBRANE ENGRAVING - VISION.NET BUTTON STATION. Important Notes! How To Order. PDF Form Instructions CUSTOM ENGRAVING FORM
 VISION.NET STATION MEMBRANE ENGRAVING - VISION.NET STATION Membrane for use with Vision Net pre-populated Standard and Custom Station Part Numbers: 0, 0, 09,,,, 98,,, 8. Important Notes!. Due to printer
UNIT 2: RATIONAL NUMBER CONCEPTS WEEK 5: Student Packet
 Name Period Date UNIT 2: RATIONAL NUMBER CONCEPTS WEEK 5: Student Packet 5.1 Fractions: Parts and Wholes Identify the whole and its parts. Find and compare areas of different shapes. Identify congruent
General tips for all graphs Choosing the right kind of graph scatter graph bar graph
 Excerpted and adapted from: McDonald, J.H. 2014. Handbook of Biological Statistics (3rd ed.). Sparky House Publishing, Baltimore, MD. (http://www.biostathandbook.com/graph.html) Guide to fairly good graphs
Microsoft Excel: Data Analysis & Graphing. College of Engineering Engineering Education Innovation Center
 Microsoft Excel: Data Analysis & Graphing College of Engineering Engineering Education Innovation Center Objectives Use relative, absolute, and mixed cell referencing Identify the types of graphs and their
Notes 5C: Statistical Tables and Graphs
 Notes 5C: Statistical Tables and Graphs Frequency Tables A frequency table is an easy way to display raw data. A frequency table typically has between two to four columns: The first column lists all the
New Mexico Pan Evaporation CE 547 Assignment 2 Writeup Tom Heller
 New Mexico Pan Evaporation CE 547 Assignment 2 Writeup Tom Heller Inserting data, symbols, and labels After beginning a new map, naming it and editing the metadata, importing the PanEvap and CountyData
Q A bitmap file contains the binary on the left below. 1 is white and 0 is black. Colour in each of the squares. What is the letter that is reve
 R 25 Images and Pixels - Reading Images need to be stored and processed using binary. The simplest image format is for an image to be stored as a bitmap image. Bitmap images are made up of picture elements
Math 65A Elementary Algebra A Exam II STUDY GUIDE and REVIEW Chapter 2, Sections 3 5, and Chapter 3, Sections 1-3
 Exam II STUDY GUIDE and REVIEW Chapter 2, Sections 5, and Chapter, Sections 1 - Exam II will be given on Thursday, April 10. You will have the entire class time for the exam. It will cover Chapter 2, Sections
Americans with Disabilities Act and Architectural Barriers Act Accessibility Guidelines
 Americans with Disabilities Act and Architectural Barriers Act Accessibility Guidelines July 23, 2004 U N I T E D S T A T E S A C C E S S B O A R D A FEDERAL AGENCY COMMITTED TO ACCESSIBLE DESIGN TECHNICAL
Page 21 GRAPHING OBJECTIVES:
 Page 21 GRAPHING OBJECTIVES: 1. To learn how to present data in graphical form manually (paper-and-pencil) and using computer software. 2. To learn how to interpret graphical data by, a. determining the
This histogram represents the +½ stop exposure from the bracket illustrated on the first page.
 Washtenaw Community College Digital M edia Arts Photo http://courses.wccnet.edu/~donw Don W erthm ann GM300BB 973-3586 donw@wccnet.edu Exposure Strategies for Digital Capture Regardless of the media choice
Lecture 4: Spatial Domain Processing and Image Enhancement
 I2200: Digital Image processing Lecture 4: Spatial Domain Processing and Image Enhancement Prof. YingLi Tian Sept. 27, 2017 Department of Electrical Engineering The City College of New York The City University
Graphics and Web Design Based on Edward Tufte's Principles (from
 Graphics and Web Design Based on Edward Tufte's Principles (from http://staff.washington.edu/larryg/classes/r560/zz-tufte.html ) This is an outline of Edward Tufte's pioneering work on the use of graphics
Science Binder and Science Notebook. Discussions
 Lane Tech H. Physics (Joseph/Machaj 2016-2017) A. Science Binder Science Binder and Science Notebook Name: Period: Unit 1: Scientific Methods - Reference Materials The binder is the storage device for
Basic Format, part 1
 Resume Workshop Who Are You? Jessica Rosa Assistant Manager of Student Services Career Development Officer for the CS Department E mail jessica@cs.columbia.edu to make an appointment. You can find me in
1.81 ( thru ) Drawings required in patent application. THE DRAWINGS Drawings required in patent application.
 Drawings required in patent application. THE DRAWINGS Drawings required in patent application.") 1.81 MANUAL OF PATENT EXAMINING PROCEDURE a common assignee disclosing and claiming that subject matter. THE DRAWINGS 1.81 Drawings required in patent application. [Editor Note: Para. (a) below is applicable
1.81 MANUAL OF PATENT EXAMINING PROCEDURE a common assignee disclosing and claiming that subject matter. THE DRAWINGS 1.81 Drawings required in patent application. [Editor Note: Para. (a) below is applicable
How to define Graph in HDSME
 How to define Graph in HDSME HDSME provides several chart/graph options to let you analyze your business in a visual format (2D and 3D). A chart/graph can display a summary of sales, profit, or current
Chapter Five: Graphics
 Chapter Five: Graphics Is a picture really worth a thousand words? It depends. What about a graphic such as this (Figure 1)? Figure 1: Pie chart showing percentages of majors declared by freshmen I can
Digital Art Requirements for Submission
 Requirements for Submission Contents Digital Art Check Sheet 2 1. Overview What Is Digital Art? Types of Digital Art: Scans and Computer-Based Drawings 3 3 3 2. Image Resolution for Continuous-Tone Scans
Appendix 3 - Using A Spreadsheet for Data Analysis
 105 Linear Regression - an Overview Appendix 3 - Using A Spreadsheet for Data Analysis Scientists often choose to seek linear relationships, because they are easiest to understand and to analyze. But,
Preparing figures for publication and presentations
 Preparing figures for publication and presentations Ram Seshadri Fred and Linda R. Wudl Professor of Materials Science Materials Department and Department of Chemistry & Biochemistry Director, Materials
Form Design Supplemental Materials PDF
 Form Design Supplemental Materials PDF In the interest of providing the best training information to our users, we have included additional material for those who want to review concepts in detail, read
Presentation Overview
 Presentation Overview ECHE 460 2010 Ed Gatzke Basics Learn Powerpoint (Use Slide Master) Fonts ( 24 typically) Text box sizes (default is small) Footer information (group and names/duties?) Images
STK 573 Metode Grafik untuk Analisis dan Penyajian Data
 STK 573 Metode Grafik untuk Analisis dan Penyajian Data Pertemuan 5 Sajian Peubah Diskret Tunggal Tim Dosen: Prof. Dr. Khairil Anwar Notodiputro Dr. Ir. Aji Hamim Wigena Dr. Agus M Soleh Pendahuluan Chart:
Laboratory 2: Graphing
 Purpose It is often said that a picture is worth 1,000 words, or for scientists we might rephrase it to say that a graph is worth 1,000 words. Graphs are most often used to express data in a clear, concise
WELCOME TO LIFE SCIENCES
 WELCOME TO LIFE SCIENCES GRADE 10 (your new favourite subject) Scientific method Life science is the scientific study of living things from molecular level to their environment. Certain methods are generally
Name Period Date LINEAR FUNCTIONS STUDENT PACKET 5: INTRODUCTION TO LINEAR FUNCTIONS
 Name Period Date LF5.1 Slope-Intercept Form Graph lines. Interpret the slope of the graph of a line. Find equations of lines. Use similar triangles to explain why the slope m is the same between any two
type workshop pointers
 type workshop pointers https://typographica.org/on-typography/making-geometric-type-work/ http://www.typeworkshop.com/index.php?id1=type-basics Instructor: Angela Wyman optical spacing By cutting and pasting
Style Guide CFMWS Website. Style Guide CFMWS Website October
 Style Guide CFMWS Website Style Guide CFMWS Website October 2013 1 Style Guide CFMWS Website Colours Consistent use of colours throughout the site helps users navigate and also promotes brand/site awareness.
PhotoFiltre DEPARTMENT OF EDUCATION
 DEPARTMENT OF EDUCATION PhotoFiltre Updated on 20 February 2010 This resource is part of the resource collection available through the ecentre for teachers. www.ecentre.education.tas.gov.au PhotoFiltre
FlashChart. Symbols and Chart Settings. Main menu navigation. Data compression and time period of the chart. Chart types.
 FlashChart Symbols and Chart Settings With FlashChart you can display several symbols (for example indices, securities or currency pairs) in an interactive chart. You can also add indicators and draw on
ORTHOGRAPHIC PROJECTIONS. Ms. Sicola
 ORTHOGRAPHIC PROJECTIONS Ms. Sicola Objectives List the six principal views of projection Sketch the top, front and right-side views of an object with normal, inclined, and oblique surfaces Objectives
Making the most of graph questions
 Get started Use skills and techniques to demonstrate geographical understanding (AO4) 4 Making the most of graph questions This unit will help you learn how to work with graphs, by plotting, labelling,
The Exact Change Report Press
 The Exact Change Report Press Page 0 The Exact Change Report Press Using the report editor to create custom reports The Report Press for Exact Change is a custom report editor that allows you to create
7.0 - MAKING A PEN FIXTURE FOR ENGRAVING PENS
 7.0 - MAKING A PEN FIXTURE FOR ENGRAVING PENS Material required: Acrylic, 9 by 9 by ¼ Difficulty Level: Advanced Engraving wood (or painted metal) pens is a task particularly well suited for laser engraving.
Graphs. This tutorial will cover the curves of graphs that you are likely to encounter in physics and chemistry.
 Graphs Graphs are made by graphing one variable which is allowed to change value and a second variable that changes in response to the first. The variable that is allowed to change is called the independent