Unit 8. GRAPHING AND Data Analysis
|
|
|
- Kristina Jocelyn Anthony
- 5 years ago
- Views:
Transcription
1 Unit 8 GRAPHING AND Data Analysis 247
2 8-1 Coordinates and Graphing 9 y x
3 249
4 250
5 8-1 Coordinates and Graphing NOTE: In all graphs in section 8-1, both horizontal and vertical grid lines will be spaced one unit apart. 1. Give the coordinates of each point: A B C D E F G H I J K L 2. a) How far from the x-axis is the point (3, -4)? b) How far from the y-axis is the point (-7, 4)? c) How far from the point (-2,3) is the point (5,3)? d) Give at least 5 different points, which are 5 units away from the origin. 3. Plot and label the following points on the grid (you may need to estimate for some). A (3, 7) B (4, 2) C (-3, 8) D (-5, -2) E (0, 5) F (2, 0) G (-6, 0) H (0, -4) I (2.5, -5) J (-4.5, 3) K (-0.5, -6.5) L (5.25, 6.75) 251
6 4. a) Complete the table of values for the relation y = 2x 1. y x b) Using the points, plot the relation y = 2x 1 on the grid below. 252
7 5. a) Complete the table of values for the relation x + y = 8. (Choose your own values. Note that x + y = 8 is the same as y = -x + 8.) y x b) Using the table, plot the relation x + y = 8 on the grid below. 253
8 6. a) Complete the table of values for the relation 1 y = x + 3. If possible, try to 2 choose x-values, which will give whole numbers for y, but also make sure all your points will fit on the grid. y x c) Using the points, plot the relation 1 y = x + 3 on the grid below
9 7. Compare and contrast the three graphs you have just drawn in questions 4, 5 and The points (2,3) and (7, 2) are two vertices (corner points) of a square. a) What are the coordinates of the other two vertices? Find all possible answers b) What is the area of the square? 255
10 9. Two vertices of a rectangle with area 24 square units are (5, 2) and (5, 5). If the other two vertices have both negative x and y coordinates, what are the coordinates of the other two vertices? 10. The vertices of a triangle are ( 4, 2), (1, 3), and (6, 2). a) Find the area of the triangle. b) What is the length of the shortest side? 256
11 11. A quadrilateral has vertices at ( 4, 1), (0, 4), (7, 4) and (3, 1). a) What type of quadrilateral is this? b) What is its area? c) What is its perimeter? 12. If a relation is plotted, as in the two examples shown, it is possible to find out the equation of those relations, do so. 257
12 8-2 Graphing Data I (Line Graphs) 258
13 259
14 8-2 Graphing Data I (Line Graphs) 1. At Pasquale s Pizza cheese and tomato sauce is included on all pizzas. Here is a partial price list for a large pizza. # of Price toppings 1 $17 3 $21 6 $27 Now construct a graph for this data. Make sure to label your axes and show your scale. a) How much would a large pizza with no toppings cost? b) How much would a large pizza with 5 toppings cost? c) How many toppings could you get for $34? d) What is the price per topping? e) Determine an equation for this relation: 260
15 2. Ivan Toksalotski was looking at his charges for text messaging on his last several phone bills. Here is what he found: # of texts cost 60 $ $ $ $2.00 Now construct a graph for this data. Make sure to label your axes and show your scale. a) How much would it cost to send 80 texts? b) How many texts could you send for $15? c) What is the price per text? d) Determine an equation for this relation: 261
16 3. A watermelon was dropped off the top of a 200m building, and its height above ground was measured at time intervals one second apart. Here is the data: Height (m) Time (s) Construct a graph of height vs time. Make sure to label your axes and show your scale. a) Is this graph a straight line? Why do you think this is? b) Estimate to the nearest tenth of a second when the watermelon would hit the ground. 262
 5 40 65 80 85 80 65 40 5 Time (s) 0 1 2 3 4 5 6 7 8 Construct a graph of height vs time. Make sure to label your axes and show your scale. a) What shape is this graph?")
17 4. A water-balloon was shot up into the air and its height above ground was measured at time intervals one second apart. Here is the data: Height (ft) Time (s) Construct a graph of height vs time. Make sure to label your axes and show your scale. a) What shape is this graph? b) What does the y-intercept (where the graph hits the y-axis) physically tell you about the water-balloon? (The y-axis is actually the height or h axis in this case!) 263

18 5. The following data was collected for Vancouver in 2007, graph the data on the grid below. Date Day Number (n) Hours of Daylight Jan Jan Mar Mar Apr May Jun Jul Aug Sep Oct Nov Dec
19 a) Approximately when was the longest day of the year (the day with the most hours of sunlight)? b) Approximately when was the shortest day of the year (the day with the least hours of sunlight)? c) One factor that affects a region s growing season is hours of daylight. Vancouver s growing season generally starts when there are 12 or more hours of daylight. From the graph predict the start and end date of the growing season in Vancouver. d) How would the graph look different if the same data was collected in Mexico City? Draw a sketch of what you think it might look like. e) How would the graph look different if the same data was collected in Sydney Australia? Draw a sketch of what you think it might look like. 6. Discussion question: How can you tell if a relation is linear? 265
20 7. World Population (billions) Year a) On the grid below, show this data in the most in the most useful way you can think of. b) What trend, if any, can be seen from your graph? c) Using your graph, -Predict when the world population will reach 8 billion: -Estimate when the world population was half of a billion ( ): -Estimate the world population in the year 1970: 2000: 2020: 266
21 8-3 Interpreting Graphs 267
22 268
 Fill in the following chart: A B C+ C C- I # of students % of students c) Use the percentages to draw a pie chart to represent this data. Remember there are 360 degrees in a circle.")
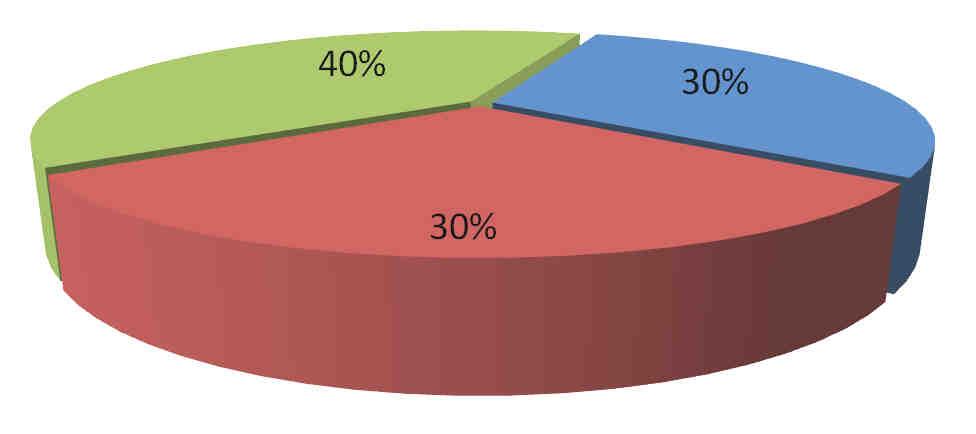
23 8-3 Interpreting Graphs 1. Below is a graph of the final marks in Mr. Tartaglia s Math 8 class. a) How many students were in the class? b) Fill in the following chart: A B C+ C C- I # of students % of students c) Use the percentages to draw a pie chart to represent this data. Remember there are 360 degrees in a circle. So for example if 10% of students got an A, then you would draw a central angle of 10% of 360 = 36 degrees. Be sure to label each piece with the grade and percentage. 269
24 d) What are the strengths and weaknesses of the bar graph? e) What are the strengths and weaknesses of the circle graph? f) Which would you use? Why? 2. Here are the results for Vancouver students on the Math 12 provincial exam for the past several years. Year Average Mark a) Display this data on a line graph. 270
25 b) Display this data on a bar graph. c) Is there a trend to the data? If so, what is it? Which graph shows it more clearly? d) Predict the average exam mark for What about 2015? e) What are the benefits of each type of graph? 271
26 3. Below is data collected from the past several years on the number of A s given out in two classes of Math Boys Girls Display the data in a double bar graph. a) What other type of graph could be used to show this data? b) Can you make any conclusions from the data? If so, what? c) What information are you not told in this data that could affect your conclusions? 272

27 2.. Discuss what this graph tells you. 273

28 3. THE NATURAL SCIENCE AND ENGINEERING SUPPLY CHAIN Discuss what this graph tells you. 274
29 4. NUMBER OF CHILDREN AGED 14 AND UNDER AND OF PERSONS AGED 65 AND OVER, CANADA, 1921 TO Discuss what this graph tells you. 275
30 8-4 Graphing Data II (Other Types of Graphs) 276
31 277
32 8-4 Graphing Data II (Other Types of Graphs) For each set of data, show the best way (or ways) to represent it graphically. You may need extra space and/or extra graph paper. Some of the data sets contain more than one kind of information which needs to be shown, and some of the data sets contain more information than you might be able to graph. Types of graphs include pie charts, pictographs, histograms, bar charts (single, double and multiple) as well as line graphs, and perhaps others. 1. TOP FIVE WORLDWIDE SMARTPHONE VENDORS 2012 Vendor Market Share(%) Samsung 29.1 Apple 24.2 Nokia 8.2 Research In Motion 6.7 HTC 4.8 Others 27.0 Total
33 2. BLOOD TYPE DISTRIBUTION Blood Type (Donor) % of Blood Type Amongst all Canadians A+ 36 A- 6 O+ 39 O- 7 B+ 7.6 B- 1.4 AB+ 2.5 AB
34 3. Temperature and Rainfall Vancouver BC Average high ( C) Jan Feb Mar Apr May Jun Jul Aug Sep Oct Nov Dec Average low ( C) Monthly rainfall (mm) ` 280
35 4. Population estimates by sex and age group as of July 1, 2011, Canada Age group Total Male Female Total 34,482,779 17,104,098 17,378,681 0 to 4 years 1,921, , ,314 5 to 9 years 1,823, , , to 14 years 1,899, , , to 19 years 2,196,437 1,123,767 1,072, to 24 years 2,402,234 1,234,223 1,168, to 29 years 2,419,280 1,227,544 1,191, to 34 years 2,348,086 1,173,463 1,174, to 39 years 2,290,396 1,149,025 1,141, to 44 years 2,396,726 1,206,180 1,190, to 49 years 2,750,685 1,384,979 1,365, to 54 years 2,668,169 1,333,326 1,334, to 59 years 2,354,191 1,161,120 1,193, to 64 years 2,038, ,378 1,039, to 69 years 1,534, , , to 74 years 1,142, , , to 79 years 918, , , to 84 years 703, , , to 89 years 439, , , to 94 years 179,895 52, , to 99 years 48,557 11,338 37, years and over 7,569 1,568 6,
36 5. Population by Province and Territory (2011) Province/Territory Population (Thousands) Nunavut 33.3 Yukon 34.7 North West Territories 43.7 Prince Edward Island Newfoundland and Labrador New Brunswick Nova Scotia Saskatchewan Manitoba Alberta British Columbia Quebec Ontario Total
37 6. Olympic Medals from London 2012 Country GOLD SILVER BRONZE United States of America Peoples Republic of China Great Britain Russian Federation Republic of Korea France Germany Italy Hungary Australia Japan
38 7. What do you usually eat for breakfast? Food group Elementary Secondary Girls Boys All students Girls Boys All students % Grain products Milk products Fruits and vegetables Meat and alternatives Other No breakfast Source: Statistics Canada, Census at School, 2010/

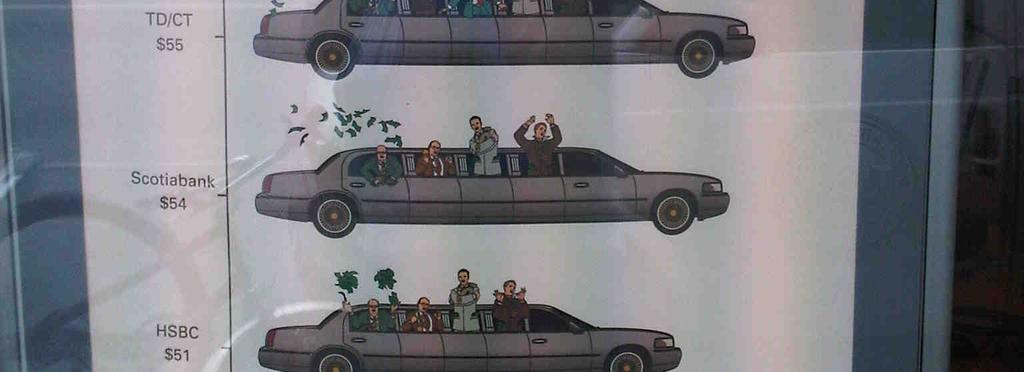
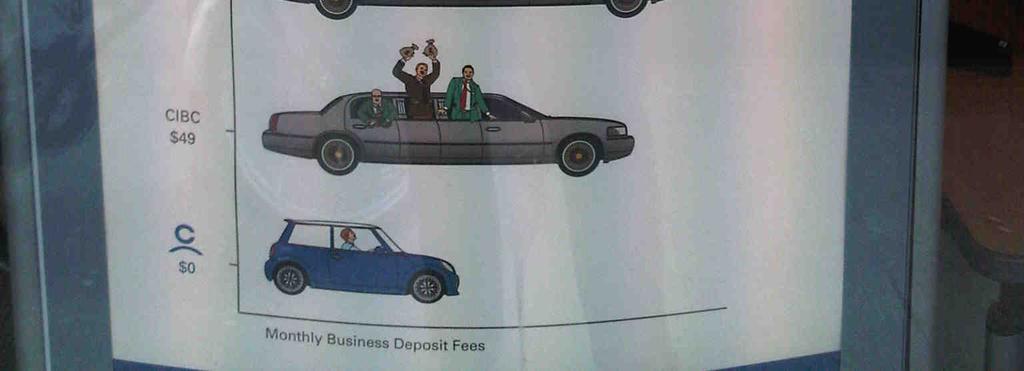
39 8-5 Misleading Graphs There are many ways in which data may be distorted, poorly represented, or presented in a biased form in graphs. Axis scale is too big or too small. Axis scale skips numbers, or does not start at zero. Axis scale made in very small units to make graph look very big. Scale values or labels missing from the graph. Incorrect scale placed on the graph. (Illogical scale spacing) Graph is not labeled properly. Graph does not have a title to explain what it is about. Data is left out. Pieces of a pie chart are not the correct sizes. Oversized volumes of objects that are too big for the differences they represent. Size of images used in pictographs being different for the different categories being graphed. Non-standard graph size or shape. 1. Examine the following graph found in a Vancouver newspaper. 285
40 a) Explain how this graph is misleading. b) What bank do you think made this advertisement? c) Why would they make a graph like this? d) Using the data from the graph, draw a new bar graph that isn t misleading. 286
 What bank do you think made this advertisement? c) Why would they make a graph like this?")
41 2. Examine the following graph found in a Vancouver newspaper. a) Explain how is this graph misleading. b) What bank do you think made this advertisement? c) Why would they make a graph like this? d) Using the data from the graph, draw a new bar graph that isn t misleading. 287
42 3, Provide reasons for this graph possibly being misleading. Discuss what the maker of this graph is trying to mislead you into believing
 Who do you think made this advertisement? c) What are they trying to make you believe by making a graph like this?")
43 4. Examine the following graph found in a Vancouver newspaper: a) Explain how this graph could be misleading. b) Who do you think made this advertisement? c) What are they trying to make you believe by making a graph like this? d) Who might be very opposed to this graph? 289
44 e) Sketch a graph that the gas companies might put out. f) Sketch a graph that is fair and not misleading. 290

45 For each of the following, provide reasons for the graph possibly being misleading. Discuss what the maker of this graph is trying to mislead you into believing. 5. The following graph was taken from CNN.com: 291
46

47 8. 293
48 8-6 Probability 294
49 8-6 Probability 1. A single six-sided die is rolled. Calculate the following probabilities: a) P(4) = b) P(odd number) = c) P(2 or 3) = d) P(less than 5) = e) P(not 2) = f) P(at most 6) = g) P(7) = h) P(at least 3) = i) P(prime number) = 2. A single card is drawn from a standard 52 card deck. Calculate the following probabilities: a) P(black card) = b) P(diamond) = c) P(King) = d) P(Ace of spades) = e) P(red 9) = f) P(face card) = g) P(not a Queen) = h) P(3 or 5) = i) P(spade of clubs) = 3. A bag contains 20 marbles, of which there are 7 black marbles, 5 red marbles, 6 green marbles, and the rest white marbles. If a marble is randomly pulled out of the bag without looking, calculate the following probabilities. a) P(black) = b) P(white) = c) P(red) = d) P(green or red) = e) P(purple) = f) P(not green) = 295
50 8-7 Independent Events 296
51 297
52 8-7 Independent Events 1. A six-sided die is rolled and then a coin is flipped. Draw a tree diagram to represent this experiment. a) P(2,Heads) = b) P(odd, Tails) = c) P(more than 4, Heads) = d) How could you have calculated these answers without drawing the tree diagram? 2. A card is drawn from a standard deck of cards, and then a six-sided die is rolled. Calculate the following probabilities: a) P(red, 2) = b) P(queen, 3) = c) P(spade, 3 or 4) = d) P(face card, odd) = e) P(King or Ace, prime) = f) P(not queen, not 6) = g) P(Black Jack, at most 4) = 298
53 3. The Canucks have a 60% or 3 5 chance of winning each game they play, independent of each other. Assume ties are not allowed. a) Draw a tree diagram to show the possibilities for the results of the Canucks playing 3 games. b) What is the probability that they win all 3? c) What is the probability that they lose all 3? d) What is the probability that they win the first two and then lose the third? e) What is the probability that they win 2 and lose 1 (in any order)? f) What is the probability that they lose the first game, win the second, and then lose the third? 299
54 4. Jan and Fred are playing a game called High Card. Each player has three cards in front of him or her face down, at the same time they both flip over one card, and whoever has the highest card wins. Jan s cards are a 5, a 9, and a Queen, while Fred has a 6, an 8, and an Ace. Draw a tree diagram to show the possible outcomes of one game. a) What is the probability Jan wins if she plays the 9? b) What is the probability Fred wins if he plays the Ace? c) What is the probability Fred wins if he plays the 6? d) What is the probability Jan wins if she plays the 5? e) What is the probability Jan wins? f) What is the probability Fred wins? 300
55 5. A fair coin is flipped 4 times. Find the following probabilities: a) P(exactly 1 Head) b) P(exactly 2 Heads) c) P(all Tails) d) P(at least one Head) 301
56 6. On a certain chocolate bar there is a contest on the wrapper, where there is a 1 in 4 chance of winning a prize. a) If I buy 4 chocolate bars, does that guarantee I will win a prize? Explain. b) If I buy two chocolate bars, what is the probability that I will win a prize on the first one and not win a prize on the second one? c) What is the probability that I will win exactly one prize if I buy 2 chocolate bars? d) What is the probability that I will win exactly one prize if I buy 3 chocolate bars? e) What is the probability that I will not win a prize if I buy 2 chocolate bars? 302
57 f) What is the probability that I will not win a prize if I buy 3 chocolate bars? g) What is the probability that I will not win a prize if I buy 4 chocolate bars? h) What is the probability that I will win at least one prize if I buy 4 chocolate bars? 303
Unit 7 Central Tendency and Probability
 Name: Block: 7.1 Central Tendency 7.2 Introduction to Probability 7.3 Independent Events 7.4 Dependent Events 7.1 Central Tendency A central tendency is a central or value in a data set. We will look at
Using Graphing Skills
 Name Class Date Laboratory Skills 8 Using Graphing Skills Introduction Recorded data can be plotted on a graph. A graph is a pictorial representation of information recorded in a data table. It is used
THE ALGEBRA III MIDTERM EXAM REVIEW Name. This review MUST be turned in when you take the midterm exam
 THE ALGEBRA III MIDTERM EXAM REVIEW Name This review MUST be turned in when you take the midterm exam ALG III Midterm Review Solve and graph on a number line. 1. x 6 14. 3x 1 5x 14 3. 4(x 1) (4x 3) Find
THE ALGEBRA III MIDTERM EXAM REVIEW Name
 THE ALGEBRA III MIDTERM EXAM REVIEW Name This review MUST be turned in when you take the midterm exam OR you will not be allowed to take the midterm and will receive a ZERO for the exam. ALG III Midterm
Order the fractions from least to greatest. Use Benchmark Fractions to help you. First try to decide which is greater than ½ and which is less than ½
 Outcome G Order the fractions from least to greatest 4 1 7 4 5 3 9 5 8 5 7 10 Use Benchmark Fractions to help you. First try to decide which is greater than ½ and which is less than ½ Likelihood Certain
Using Graphing Skills
 Name Class Date Laboratory Skills 8 Using Graphing Skills Introduction Recorded data can be plotted on a graph. A graph is a pictorial representation of information recorded in a data table. It is used
Independent Events. If we were to flip a coin, each time we flip that coin the chance of it landing on heads or tails will always remain the same.
 Independent Events Independent events are events that you can do repeated trials and each trial doesn t have an effect on the outcome of the next trial. If we were to flip a coin, each time we flip that
April 10, ex) Draw a tree diagram of this situation.
 Draw a tree diagram of this situation.") April 10, 2014 12-1 Fundamental Counting Principle & Multiplying Probabilities 1. Outcome - the result of a single trial. 2. Sample Space - the set of all possible outcomes 3. Independent Events - when
April 10, 2014 12-1 Fundamental Counting Principle & Multiplying Probabilities 1. Outcome - the result of a single trial. 2. Sample Space - the set of all possible outcomes 3. Independent Events - when
Math. Integrated. Trimester 3 Revision Grade 7. Zayed Al Thani School. ministry of education.
 ministry of education Department of Education and Knowledge Zayed Al Thani School www.z2school.com Integrated Math Grade 7 2017-2018 Trimester 3 Revision الوزارة كتاب عن تغني ال المراجعة هذه 0 Ministry
Objective 1: Simple Probability
 Objective : Simple Probability To find the probability of event E, P(E) number of ways event E can occur total number of outcomes in sample space Example : In a pet store, there are 5 puppies, 22 kittens,
, x {1, 2, k}, where k > 0. (a) Write down P(X = 2). (1) (b) Show that k = 3. (4) Find E(X). (2) (Total 7 marks)
 Write down P(X = 2). (1) (b) Show that k = 3. (4) Find E(X). (2) (Total 7 marks)") 1. The probability distribution of a discrete random variable X is given by 2 x P(X = x) = 14, x {1, 2, k}, where k > 0. Write down P(X = 2). (1) Show that k = 3. Find E(X). (Total 7 marks) 2. In a game
1. The probability distribution of a discrete random variable X is given by 2 x P(X = x) = 14, x {1, 2, k}, where k > 0. Write down P(X = 2). (1) Show that k = 3. Find E(X). (Total 7 marks) 2. In a game
Using Graphing Skills
 Name Class Date Laboratory Skills 8 Using Graphing Skills Time required: 30 minutes Introduction Recorded data can be plotted on a graph. A graph is a pictorial representation of information recorded in
A B C. 142 D. 96
 Data Displays and Analysis 1. stem leaf 900 3 3 4 5 7 9 901 1 1 1 2 4 5 6 7 8 8 8 9 9 902 1 3 3 3 4 6 8 9 9 903 1 2 2 3 3 3 4 7 8 9 904 1 1 2 4 5 6 8 8 What is the range of the data shown in the stem-and-leaf
Sinusoidal Applications
 Sinusoidal Applications A package of 5 activities Problems dealing with graphing and determining the equations of sinusoidal functions for real world situations Fractal image generated by MathWiz Created
Unit 14 Probability. Target 3 Calculate the probability of independent and dependent events (compound) AND/THEN statements
 AND/THEN statements") Target 1 Calculate the probability of an event Unit 14 Probability Target 2 Calculate a sample space 14.2a Tree Diagrams, Factorials, and Permutations 14.2b Combinations Target 3 Calculate the probability
Target 1 Calculate the probability of an event Unit 14 Probability Target 2 Calculate a sample space 14.2a Tree Diagrams, Factorials, and Permutations 14.2b Combinations Target 3 Calculate the probability
2. A bubble-gum machine contains 25 gumballs. There are 12 green, 6 purple, 2 orange, and 5 yellow gumballs.
 A C E Applications Connections Extensions Applications. A bucket contains one green block, one red block, and two yellow blocks. You choose one block from the bucket. a. Find the theoretical probability
Instructions: Choose the best answer and shade in the corresponding letter on the answer sheet provided. Be sure to include your name and student ID.
 Math 3201 Unit 3 Probability Test 1 Unit Test Name: Part 1 Selected Response: Instructions: Choose the best answer and shade in the corresponding letter on the answer sheet provided. Be sure to include
1. How many subsets are there for the set of cards in a standard playing card deck? How many subsets are there of size 8?
 Math 1711-A Summer 2016 Final Review 1 August 2016 Time Limit: 170 Minutes Name: 1. How many subsets are there for the set of cards in a standard playing card deck? How many subsets are there of size 8?
Review. Natural Numbers: Whole Numbers: Integers: Rational Numbers: Outline Sec Comparing Rational Numbers
 FOUNDATIONS Outline Sec. 3-1 Gallo Name: Date: Review Natural Numbers: Whole Numbers: Integers: Rational Numbers: Comparing Rational Numbers Fractions: A way of representing a division of a whole into
Unit 1 Day 1: Sample Spaces and Subsets. Define: Sample Space. Define: Intersection of two sets (A B) Define: Union of two sets (A B)
 Define: Union of two sets (A B)") Unit 1 Day 1: Sample Spaces and Subsets Students will be able to (SWBAT) describe events as subsets of sample space (the set of outcomes) using characteristics (or categories) of the outcomes, or as unions,
Unit 1 Day 1: Sample Spaces and Subsets Students will be able to (SWBAT) describe events as subsets of sample space (the set of outcomes) using characteristics (or categories) of the outcomes, or as unions,
Lesson 16.1 Assignment
 Lesson 16.1 Assignment Name Date Rolling, Rolling, Rolling... Defining and Representing Probability 1. Rasheed is getting dressed in the dark. He reaches into his sock drawer to get a pair of socks. He
Paper 2. Mathematics test. Calculator allowed. satspapers.org. First name. Last name. School KEY STAGE TIER
 Ma KEY STAGE 3 TIER 4 6 2005 Mathematics test Paper 2 Calculator allowed Please read this page, but do not open your booklet until your teacher tells you to start. Write your name and the name of your
Chapter Test Form A. mean median mode. 187 Holt Algebra 1. Name Date Class. Select the best answer.
 Select the best answer. 1. Use this bar graph to identify how many more candies are blue than red. A 3 B 6 C 9 D 15 Form A 2. Which type of graph would be best for displaying this data? Board Members Opinions
Name: Probability, Part 1 March 4, 2013
 1) Assuming all sections are equal in size, what is the probability of the spinner below stopping on a blue section? Write the probability as a fraction. 2) A bag contains 3 red marbles, 4 blue marbles,
Essential Question How can you list the possible outcomes in the sample space of an experiment?
 . TEXAS ESSENTIAL KNOWLEDGE AND SKILLS G..B Sample Spaces and Probability Essential Question How can you list the possible outcomes in the sample space of an experiment? The sample space of an experiment
STATISTICS and PROBABILITY GRADE 6
 Kansas City Area Teachers of Mathematics 2016 KCATM Math Competition STATISTICS and PROBABILITY GRADE 6 INSTRUCTIONS Do not open this booklet until instructed to do so. Time limit: 20 minutes You may use
Classical vs. Empirical Probability Activity
 Name: Date: Hour : Classical vs. Empirical Probability Activity (100 Formative Points) For this activity, you will be taking part in 5 different probability experiments: Rolling dice, drawing cards, drawing
GRADE 8 ANSWER KEY NUMBER. 1. Squares and Square Roots (8.N.1) 2. Estimating Square Roots (8.N.2)
 2. Estimating Square Roots (8.N.2)") GRADE 8 ANSWER KEY Note: For more information on particular vocabulary, refer to Kindergarten to Grade 8 Mathematics Glossary (Manitoba Education). NUMBER 1. Squares and Square Roots (8.N.1) Level of Question
GRADE 8 ANSWER KEY Note: For more information on particular vocabulary, refer to Kindergarten to Grade 8 Mathematics Glossary (Manitoba Education). NUMBER 1. Squares and Square Roots (8.N.1) Level of Question
Unit 19 Probability Review
 . What is sample space? All possible outcomes Unit 9 Probability Review 9. I can use the Fundamental Counting Principle to count the number of ways an event can happen. 2. What is the difference between
Statistics and Probability
 Lesson Statistics and Probability Name Use Centimeter Cubes to represent votes from a subgroup of a larger population. In the sample shown, the red cubes are modeled by the dark cubes and represent a yes
Chapter 3: PROBABILITY
 Chapter 3 Math 3201 1 3.1 Exploring Probability: P(event) = Chapter 3: PROBABILITY number of outcomes favourable to the event total number of outcomes in the sample space An event is any collection of
Relative frequency and probability
 5 Relative frequency and probability Syllabus topic MS-S Relative frequency and probability This topic will develop your awareness of the broad range of applications of probability concepts in everyday
This unit will help you work out probability and use experimental probability and frequency trees. Key points
 Get started Probability This unit will help you work out probability and use experimental probability and frequency trees. AO Fluency check There are 0 marbles in a bag. 9 of the marbles are red, 7 are
Summer Assignment for AP Environmental Science
 Summer Assignment for AP Environmental Science 1. Reading Writing Critically about Environmental Science Issues Read The Ghost Map and write a paper in which you focus on: How the water supply and delivery
Name Class Date. Introducing Probability Distributions
 Name Class Date Binomial Distributions Extension: Distributions Essential question: What is a probability distribution and how is it displayed? 8-6 CC.9 2.S.MD.5(+) ENGAGE Introducing Distributions Video
Unit 9: Probability Assignments
 Unit 9: Probability Assignments #1: Basic Probability In each of exercises 1 & 2, find the probability that the spinner shown would land on (a) red, (b) yellow, (c) blue. 1. 2. Y B B Y B R Y Y B R 3. Suppose
1. A factory manufactures plastic bottles of 4 different sizes, 3 different colors, and 2 different shapes. How many different bottles are possible?
 Unit 8 Quiz Review Short Answer 1. A factory manufactures plastic bottles of 4 different sizes, 3 different colors, and 2 different shapes. How many different bottles are possible? 2. A pizza corner offers
Year 7 mathematics test
 Ma KEY STAGE 3 Year 7 mathematics test LEVELS 4 6 Paper 1 Calculator not allowed First name Last name Class Date Please read this page, but do not open your booklet until your teacher tells you to start.
Most of the time we deal with theoretical probability. Experimental probability uses actual data that has been collected.
 AFM Unit 7 Day 3 Notes Theoretical vs. Experimental Probability Name Date Definitions: Experiment: process that gives a definite result Outcomes: results Sample space: set of all possible outcomes Event:
Outcomes: The outcomes of this experiment are yellow, blue, red and green.
 (Adapted from http://www.mathgoodies.com/) 1. Sample Space The sample space of an experiment is the set of all possible outcomes of that experiment. The sum of the probabilities of the distinct outcomes
Applications. 28 How Likely Is It? P(green) = 7 P(yellow) = 7 P(red) = 7. P(green) = 7 P(purple) = 7 P(orange) = 7 P(yellow) = 7
 = 7 P(yellow) = 7 P(red) = 7. P(green) = 7 P(purple) = 7 P(orange) = 7 P(yellow) = 7") Applications. A bucket contains one green block, one red block, and two yellow blocks. You choose one block from the bucket. a. Find the theoretical probability that you will choose each color. P(green)
Applications. A bucket contains one green block, one red block, and two yellow blocks. You choose one block from the bucket. a. Find the theoretical probability that you will choose each color. P(green)
The Canadian Open Mathematics Challenge November 3/4, 2016
 The Canadian Open Mathematics Challenge November 3/4, 2016 STUDENT INSTRUCTION SHEET General Instructions 1) Do not open the exam booklet until instructed to do so by your supervising teacher. 2) The supervisor
CCM6+7+ Unit 11 ~ Page 1. Name Teacher: Townsend ESTIMATED ASSESSMENT DATES:
 CCM6+7+ Unit 11 ~ Page 1 CCM6+7+ UNIT 11 PROBABILITY Name Teacher: Townsend ESTIMATED ASSESSMENT DATES: Unit 11 Vocabulary List 2 Simple Event Probability 3-7 Expected Outcomes Making Predictions 8-9 Theoretical
UNIT 2: RATIONAL NUMBER CONCEPTS WEEK 5: Student Packet
 Name Period Date UNIT 2: RATIONAL NUMBER CONCEPTS WEEK 5: Student Packet 5.1 Fractions: Parts and Wholes Identify the whole and its parts. Find and compare areas of different shapes. Identify congruent
Honors Statistics. 3. Review Homework C5#4. Conditional Probabilities. Chapter 5 Section 2 day s Notes.notebook. April 14, 2016.
 Honors Statistics Aug 23-8:26 PM 3. Review Homework C5#4 Conditional Probabilities Aug 23-8:31 PM 1 Apr 9-2:22 PM Nov 15-10:28 PM 2 Nov 9-5:30 PM Nov 9-5:34 PM 3 A Skip 43, 45 How do you want it - the
Mathematics (Project Maths Phase 2)
") 2014. S233 Coimisiún na Scrúduithe Stáit State Examinations Commission Junior Certificate Examination 2014 Mathematics (Project Maths Phase 2) Paper 2 Ordinary Level Monday 9 June Morning, 9:30 to 11:30
2014. S233 Coimisiún na Scrúduithe Stáit State Examinations Commission Junior Certificate Examination 2014 Mathematics (Project Maths Phase 2) Paper 2 Ordinary Level Monday 9 June Morning, 9:30 to 11:30
Diagnostic Assessment
 Diagnostic Assessment Mathematics LEVEL 1 Name Date. Mathematics Level 1 Diagnostic Test This test is designed to help you and your tutor identify any aspects of number work where you may need support
ELEMENTARY LEVEL British Columbia and Yukon Territory
 ELEMENTARY LEVEL British Columbia and Yukon Territory appreciate ocean my lunches Big Ideas Competencies Water is essential to all living things, and it cycles through the environment. Materials can be
Probability Worksheet Yr 11 Maths B Term 4
 Probability Worksheet Yr Maths B Term A die is rolled. What is the probability that the number is an odd number or a? P(odd ) Pr(odd or a + 6 6 6 A set of cards is numbered {,, 6}. A card is selected at
Objective: Determine empirical probability based on specific sample data. (AA21)
") Do Now: What is an experiment? List some experiments. What types of things does one take a "chance" on? Mar 1 3:33 PM Date: Probability - Empirical - By Experiment Objective: Determine empirical probability
Do Now: What is an experiment? List some experiments. What types of things does one take a "chance" on? Mar 1 3:33 PM Date: Probability - Empirical - By Experiment Objective: Determine empirical probability
Lesson Lesson 3.7 ~ Theoretical Probability
 Theoretical Probability Lesson.7 EXPLORE! sum of two number cubes Step : Copy and complete the chart below. It shows the possible outcomes of one number cube across the top, and a second down the left
MATH KANGARO O INSTRUCTIONS GRADE
 INTERNATIONAL CO NTES T -GAME MATH KANGARO O CANADA, 201 7 INSTRUCTIONS GRADE 11-1 2 1. You have 75 minutes to solve 30 multiple choice problems. For each problem, circle only one of the proposed five
MATH STUDENT BOOK. 7th Grade Unit 6
 MATH STUDENT BOOK 7th Grade Unit 6 Unit 6 Probability and Graphing Math 706 Probability and Graphing Introduction 3 1. Probability 5 Theoretical Probability 5 Experimental Probability 13 Sample Space 20
Fair Game Review. Chapter 9. Simplify the fraction
 Name Date Chapter 9 Simplify the fraction. 1. 10 12 Fair Game Review 2. 36 72 3. 14 28 4. 18 26 5. 32 48 6. 65 91 7. There are 90 students involved in the mentoring program. Of these students, 60 are girls.
KS specimen papers
 KS4 2016 specimen papers OCR H3 specimen 14 A straight line goes through the points (p, q) and (r, s), where p + 2 = r q + 4 = s. Find the gradient of the line. AQA F3 H3 specimen 21 When x² = 16 the only
The Canadian Population: Age and Sex
 Protected Document The Canadian Population: Age and Sex 2011 Census of Canada Presentation of the main results from the age and sex release by France-Pascale Ménard and Laurent Martel (Demography Division)
Chapter 8: Probability: The Mathematics of Chance
 Chapter 8: Probability: The Mathematics of Chance Free-Response 1. A spinner with regions numbered 1 to 4 is spun and a coin is tossed. Both the number spun and whether the coin lands heads or tails is
Ch Probability Outcomes & Trials
 Learning Intentions: Ch. 10.2 Probability Outcomes & Trials Define the basic terms & concepts of probability. Find experimental probabilities. Calculate theoretical probabilities. Vocabulary: Trial: real-world
Paper Reference F 1 F. 5540F/1F Edexcel GCSE Mathematics A (Linear) 2540 Paper 1 (Non-Calculator) Foundation Tier
 2540 Paper 1 (Non-Calculator) Foundation Tier") Centre No. Candidate No. Paper Reference 5 5 4 0 F 1 F Surname Signature Paper Reference(s) 5540F/1F Edexcel GCSE Mathematics A (Linear) 2540 Paper 1 (Non-Calculator) Foundation Tier Thursday 6 November
Centre No. Candidate No. Paper Reference 5 5 4 0 F 1 F Surname Signature Paper Reference(s) 5540F/1F Edexcel GCSE Mathematics A (Linear) 2540 Paper 1 (Non-Calculator) Foundation Tier Thursday 6 November
PRE TEST. Math in a Cultural Context*
 P grade PRE TEST Salmon Fishing: Investigations into A 6P th module in the Math in a Cultural Context* UNIVERSITY OF ALASKA FAIRBANKS Student Name: Grade: Teacher: School: Location of School: Date: *This
Minute Simplify: 12( ) = 3. Circle all of the following equal to : % Cross out the three-dimensional shape.
 = 3. Circle all of the following equal to : % Cross out the three-dimensional shape.") Minute 1 1. Simplify: 1( + 7 + 1) =. 7 = 10 10. Circle all of the following equal to : 0. 0% 5 100. 10 = 5 5. Cross out the three-dimensional shape. 6. Each side of the regular pentagon is 5 centimeters.
Minute 1 1. Simplify: 1( + 7 + 1) =. 7 = 10 10. Circle all of the following equal to : 0. 0% 5 100. 10 = 5 5. Cross out the three-dimensional shape. 6. Each side of the regular pentagon is 5 centimeters.
EXCELLENCE IN MATHEMATICS EIGHTH GRADE TEST CHANDLER-GILBERT COMMUNITY COLLEGE S. THIRTEENTH ANNUAL MATHEMATICS CONTEST SATURDAY, JANUARY 19 th, 2013
 EXCELLENCE IN MATHEMATICS EIGHTH GRADE TEST CHANDLER-GILBERT COMMUNITY COLLEGE S THIRTEENTH ANNUAL MATHEMATICS CONTEST SATURDAY, JANUARY 19 th, 2013 1. DO NOT OPEN YOUR TEST BOOKLET OR BEGIN WORK UNTIL
Probability --QUESTIONS-- Principles of Math 12 - Probability Practice Exam 1
 Probability --QUESTIONS-- Principles of Math - Probability Practice Exam www.math.com Principles of Math : Probability Practice Exam Use this sheet to record your answers:... 4... 4... 4.. 6. 4.. 6. 7..
LC OL Probability. ARNMaths.weebly.com. As part of Leaving Certificate Ordinary Level Math you should be able to complete the following.
 A Ryan LC OL Probability ARNMaths.weebly.com Learning Outcomes As part of Leaving Certificate Ordinary Level Math you should be able to complete the following. Counting List outcomes of an experiment Apply
Chapter 10 Practice Test Probability
 Name: Class: Date: ID: A Chapter 0 Practice Test Probability Multiple Choice Identify the choice that best completes the statement or answers the question. Describe the likelihood of the event given its
13-6 Probabilities of Mutually Exclusive Events
 Determine whether the events are mutually exclusive or not mutually exclusive. Explain your reasoning. 1. drawing a card from a standard deck and getting a jack or a club The jack of clubs is an outcome
2 Event is equally likely to occur or not occur. When all outcomes are equally likely, the theoretical probability that an event A will occur is:
 10.3 TEKS a.1, a.4 Define and Use Probability Before You determined the number of ways an event could occur. Now You will find the likelihood that an event will occur. Why? So you can find real-life geometric
Chapter 13 Test Review
 1. The tree diagrams below show the sample space of choosing a cushion cover or a bedspread in silk or in cotton in red, orange, or green. Write the number of possible outcomes. A 6 B 10 C 12 D 4 Find
Math Exam 2 Review. NOTE: For reviews of the other sections on Exam 2, refer to the first page of WIR #4 and #5.
 Math 166 Fall 2008 c Heather Ramsey Page 1 Math 166 - Exam 2 Review NOTE: For reviews of the other sections on Exam 2, refer to the first page of WIR #4 and #5. Section 3.2 - Measures of Central Tendency
Grade 8 Math Assignment: Probability
 Grade 8 Math Assignment: Probability Part 1: Rock, Paper, Scissors - The Study of Chance Purpose An introduction of the basic information on probability and statistics Materials: Two sets of hands Paper
Empirical (or statistical) probability) is based on. The empirical probability of an event E is the frequency of event E.
 probability) is based on. The empirical probability of an event E is the frequency of event E.") Probability and Statistics Chapter 3 Notes Section 3-1 I. Probability Experiments. A. When weather forecasters say There is a 90% chance of rain tomorrow, or a doctor says There is a 35% chance of a successful
Probability and Statistics Chapter 3 Notes Section 3-1 I. Probability Experiments. A. When weather forecasters say There is a 90% chance of rain tomorrow, or a doctor says There is a 35% chance of a successful
PRE TEST KEY. Math in a Cultural Context*
 PRE TEST KEY Salmon Fishing: Investigations into A 6 th grade module in the Math in a Cultural Context* UNIVERSITY OF ALASKA FAIRBANKS Student Name: PRE TEST KEY Grade: Teacher: School: Location of School:
6. a) Determine the probability distribution. b) Determine the expected sum of two dice. c) Repeat parts a) and b) for the sum of
 Determine the probability distribution. b) Determine the expected sum of two dice. c) Repeat parts a) and b) for the sum of") d) generating a random number between 1 and 20 with a calculator e) guessing a person s age f) cutting a card from a well-shuffled deck g) rolling a number with two dice 3. Given the following probability
d) generating a random number between 1 and 20 with a calculator e) guessing a person s age f) cutting a card from a well-shuffled deck g) rolling a number with two dice 3. Given the following probability
North Seattle Community College Winter ELEMENTARY STATISTICS 2617 MATH Section 05, Practice Questions for Test 2 Chapter 3 and 4
 North Seattle Community College Winter 2012 ELEMENTARY STATISTICS 2617 MATH 109 - Section 05, Practice Questions for Test 2 Chapter 3 and 4 1. Classify each statement as an example of empirical probability,
AWM 11 UNIT 1 WORKING WITH GRAPHS
 AWM 11 UNIT 1 WORKING WITH GRAPHS Assignment Title Work to complete Complete 1 Introduction to Statistics Read the introduction no written assignment 2 Bar Graphs Bar Graphs 3 Double Bar Graphs Double
Use a tree diagram to find the number of possible outcomes. 2. How many outcomes are there altogether? 2.
 Use a tree diagram to find the number of possible outcomes. 1. A pouch contains a blue chip and a red chip. A second pouch contains two blue chips and a red chip. A chip is picked from each pouch. The
Name: Period: Date: 7 th Pre-AP: Probability Review and Mini-Review for Exam
 Name: Period: Date: 7 th Pre-AP: Probability Review and Mini-Review for Exam 4. Mrs. Bartilotta s mathematics class has 7 girls and 3 boys. She will randomly choose two students to do a problem in front
Total Marks : 100 READ THE FOLLOWING DIRECTIONS CAREFULLY:
 Mathematics Writing Time : 2 Hours Total Marks : 100 READ THE FOLLOWING DIRECTIONS CAREFULLY: 1. Do not write in the first fifteen minutes. This time is to be spent on reading the questions. After having
Name. Introduction to Tables and Graphs
 Name Introduction to Tables and Graphs Graphing Resource - Student Guide (Source NASA Solar System Math Comparing Size and Distance) There are three types of graphs that scientists use. Graphs help them
Intermediate Math Circles November 1, 2017 Probability I
 Intermediate Math Circles November 1, 2017 Probability I Probability is the study of uncertain events or outcomes. Games of chance that involve rolling dice or dealing cards are one obvious area of application.
1. Simplify 5! 2. Simplify P(4,3) 3. Simplify C(8,5) ? 6. Simplify 5
 3. Simplify C(8,5) ? 6. Simplify 5") Algebra 2 Trig H 11.4 and 11.5 Review Complete the following without a calculator: 1. Simplify 5! 2. Simplify P(4,3) 3. Simplify C(8,5) 4. Solve 12C5 12 C 5. Simplify? nc 2? 6. Simplify 5 P 2 7. Simplify
Algebra 2 Trig H 11.4 and 11.5 Review Complete the following without a calculator: 1. Simplify 5! 2. Simplify P(4,3) 3. Simplify C(8,5) 4. Solve 12C5 12 C 5. Simplify? nc 2? 6. Simplify 5 P 2 7. Simplify
MULTIPLE CHOICE. Choose the one alternative that best completes the statement or answers the question.
 Statistics Homework Ch 5 Name MULTIPLE CHOICE. Choose the one alternative that best completes the statement or answers the question. Provide an appropriate response. 1) A coin is tossed. Find the probability
UNIT 5: RATIO, PROPORTION, AND PERCENT WEEK 20: Student Packet
 Name Period Date UNIT 5: RATIO, PROPORTION, AND PERCENT WEEK 20: Student Packet 20.1 Solving Proportions 1 Add, subtract, multiply, and divide rational numbers. Use rates and proportions to solve problems.
Practice 9-1. Probability
 Practice 9-1 Probability You spin a spinner numbered 1 through 10. Each outcome is equally likely. Find the probabilities below as a fraction, decimal, and percent. 1. P(9) 2. P(even) 3. P(number 4. P(multiple
out one marble and then a second marble without replacing the first. What is the probability that both marbles will be white?
 Example: Leah places four white marbles and two black marbles in a bag She plans to draw out one marble and then a second marble without replacing the first What is the probability that both marbles will
10.1 Applying the Counting Principle and Permutations (helps you count up the number of possibilities!)
") 10.1 Applying the Counting Principle and Permutations (helps you count up the number of possibilities!) Example 1: Pizza You are buying a pizza. You have a choice of 3 crusts, 4 cheeses, 5 meat toppings,
10.1 Applying the Counting Principle and Permutations (helps you count up the number of possibilities!) Example 1: Pizza You are buying a pizza. You have a choice of 3 crusts, 4 cheeses, 5 meat toppings,
NAME DATE PERIOD. Study Guide and Intervention
 9-1 Section Title The probability of a simple event is a ratio that compares the number of favorable outcomes to the number of possible outcomes. Outcomes occur at random if each outcome occurs by chance.
COMPOUND EVENTS. Judo Math Inc.
 COMPOUND EVENTS Judo Math Inc. 7 th grade Statistics Discipline: Black Belt Training Order of Mastery: Compound Events 1. What are compound events? 2. Using organized Lists (7SP8) 3. Using tables (7SP8)
Data Analysis and Probability
 Data Analysis and Probability Vocabulary List Mean- the sum of a group of numbers divided by the number of addends Median- the middle value in a group of numbers arranged in order Mode- the number or item
Scientific Investigation Use and Interpret Graphs Promotion Benchmark 3 Lesson Review Student Copy
 Scientific Investigation Use and Interpret Graphs Promotion Benchmark 3 Lesson Review Student Copy Vocabulary Data Table A place to write down and keep track of data collected during an experiment. Line
Mutually Exclusive Events
 5.4 Mutually Exclusive Events YOU WILL NEED calculator EXPLORE Carlos drew a single card from a standard deck of 52 playing cards. What is the probability that the card he drew is either an 8 or a black
Numbers Large and Small. Chapter NUMBER. Big Idea. Learning Goals. Essential Question. Important Words
 NUMBER Numbers Large and Small Chapter Big Idea Understanding very large and very small numbers helps me describe and solve real-world problems. Learning Goals I can show my understanding of place value
Objectives. Determine whether events are independent or dependent. Find the probability of independent and dependent events.
 Objectives Determine whether events are independent or dependent. Find the probability of independent and dependent events. independent events dependent events conditional probability Vocabulary Events
These Probability NOTES Belong to:
 hese Probability NOES elong to: Date opic Notes Questions. Intro 2. And & Or 3. Dependant & Independent. Dependant & Independent 5. Conditional 6. Conditional 7. Combinations & Permutations 8. inomial
Geographic Terms. Manifold Data Mining Inc. January 2016
 Geographic Terms Manifold Data Mining Inc. January 2016 The following geographic terms are adapted from the standard definition of Census geography from Statistics Canada. Block-face A block-face is one
Paper 2. Mathematics test. Calculator allowed. First name. Last name. School KEY STAGE TIER
 Ma KEY STAGE 3 TIER 3 5 2005 Mathematics test Paper 2 Calculator allowed Please read this page, but do not open your booklet until your teacher tells you to start. Write your name and the name of your
- go over homework #2 on applications - Finish Applications Day #3 - more applications... tide problems, start project
 10/20/15 ALICATIONS DAY #3 HOMEWORK TC2 WARM U! Agenda Homework - go over homework #2 on applications - Finish Applications Day #3 - more applications... tide problems, start project UCOMING: OW #6 Quiz
Statistics. Graphing Statistics & Data. What is Data?. Data is organized information. It can be numbers, words, measurements,
 Statistics Graphing Statistics & Data What is Data?. Data is organized information. It can be numbers, words, measurements, observations or even just descriptions of things. Qualitative vs Quantitative.
Biggar High School Mathematics Department. S1 Block 1. Revision Booklet GOLD
 Biggar High School Mathematics Department S1 Block 1 Revision Booklet GOLD Contents MNU 3-01a MNU 3-03a MNU 3-03b Page Whole Number Calculations & Decimals 3 MTH 3-05b MTH 3-06a MTH 4-06a Multiples, Factors,