Nessie is alive! Gerco Onderwater. Role of statistics, bias and reproducibility in scientific research
|
|
|
- Merry Parrish
- 5 years ago
- Views:
Transcription
1 Nessie is alive! Role of statistics, bias and reproducibility in scientific research Gerco Onderwater


2 4/23/15 2 Loch Ness, Scotland

![in 565 AD, [At] the river Ness a poor](/docs-images/87/96801106/images/3-3.jpg "unfortunate little fellow, whom some water")

3 4/23/15 3 Legendary monster Saint Adomnán of Iona describes the wonders by Saint Columba; in 565 AD, [At] the river Ness a poor unfortunate little fellow, whom some water monster had a little before snatched at as he was swimming, and bitten with a most savage bite...

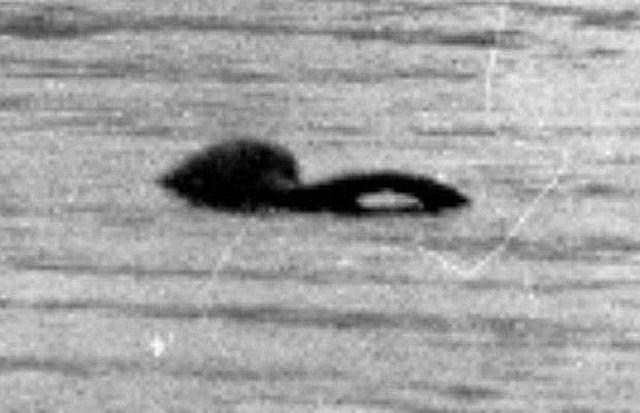
4 4/23/15 4 The surgeon's photo April 19, 1934

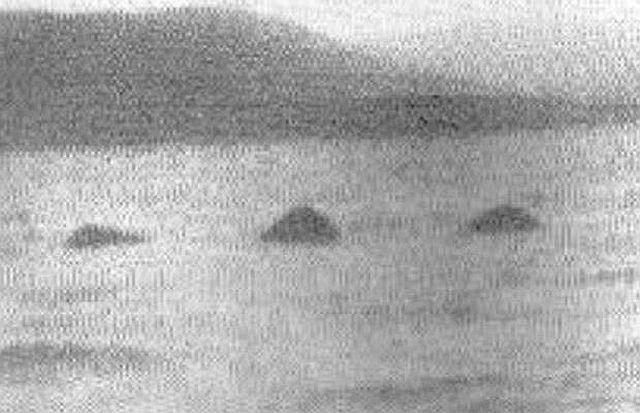

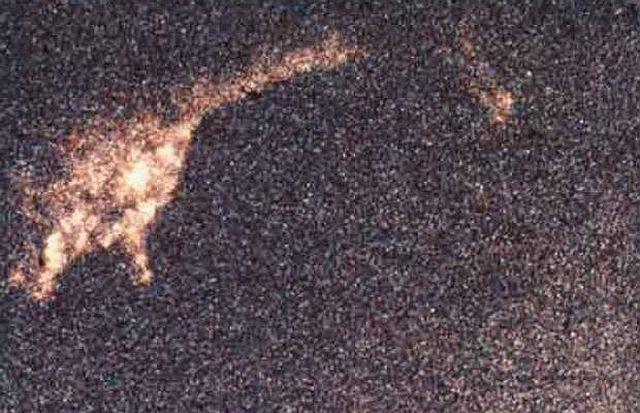

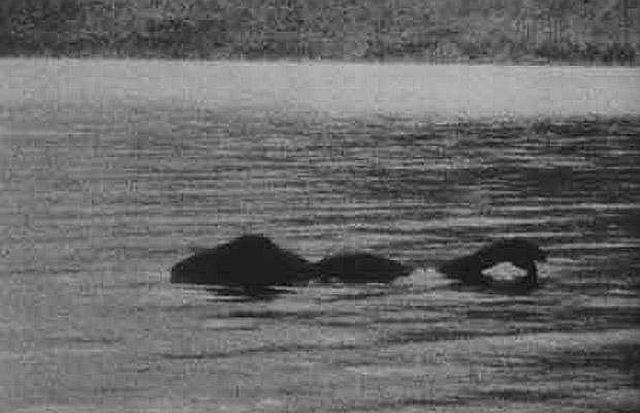
5 4/23/15 5 Sightings aplenty!
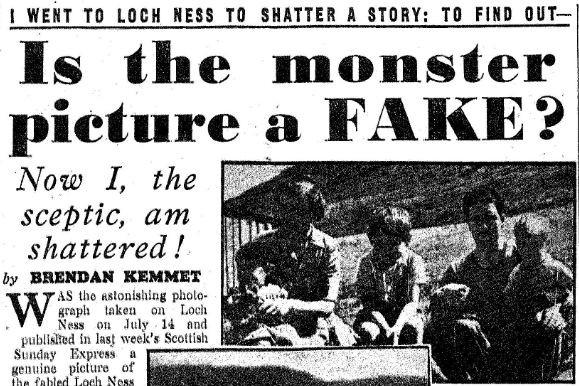

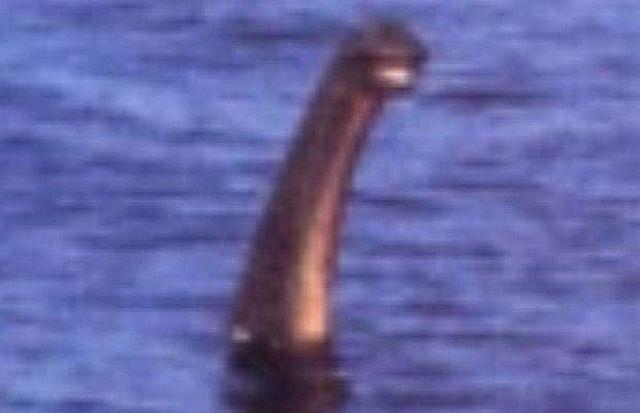
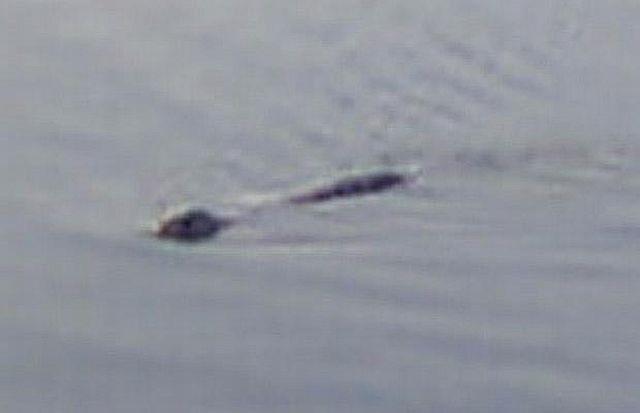
6 4/23/15 6 Controversy Legend, fact or fake?

7 4/23/15 7 Some opinions I think it is just a lot of tripe! I don't quite believe it. I'm wondering if it's a stunt If I stay here much longer... I shall see it It may possibly exist I don't know what to think
8 4/23/15 8 Getting beyond opinions Time for research!
9 4/23/15 9 Scientific method Define a question Gather information and resources (observe) Form an explanatory hypothesis Test the hypothesis by performing an experiment and collecting data in a reproducible manner Analyze the data Interpret the data and draw conclusions that serve as a starting point for a new hypothesis Publish results Retest (frequently done by other scientists)

10 4/23/15 10 Experimentation Cannot deal with full range of possibilities

11 4/23/15 11 Experimentation Cannot deal with full range of possibilities Select a representative sample Perform measurement Infer properties of full population


12 4/23/15 12 Probability Using properties of population & selection process, probability for an outcome predictable with certainty, outcome itself is subject to chance Truth Observation Observation Observation Observation Observation Observation Observation Observation Observation Observation
= 0.")
13 4/23/15 13 Demo n p0 (n)= for n=50


14 4/23/15 14 Likelihood In research we have to do the reverse Which explanation most likely given this observation? Observation Truth Speculation Wild guess Lie Lie Lie Lie lie Lie Lie


15 4/23/15 15 Sta tis tics branch of mathematics dealing with collection, analysis, interpretation, and presentation of numerical data Descriptive statistics summarize data for concise overview the mean grade of HC students is... Inferential statistics make claims about population based on sample my HC students were OK, so most likely they're all

16 4/23/15 16 Descriptive statistics 6, 1, 2, 6, 2, 3, 6, 5, 4, 5, 5, 4, 2, 5, 4, 3, 4, 2, 2, 1, 1, 4, 5, 4, 5, 1, 5, 1, 1, 3, 5, 2, 3, 1, 2, 4, 2, 4, 5, 3, 1, 3, 6, 3, 5, 1, 5, 5, 3, 4, 3, 1, 4, 4, 3, 5, 4, 5, 1, 1, 1, 5, 1, 2, 2, 1, 4, 5, 2, 3, 6, 4, 2, 4, 4, 2, 2, 3, 1, 6, 1, 4, 1, 3, 3, 6, 6, 3, 2, 3, 4, 5, 4, 1, 5, 5, 2, 2, 3, 4, 3, 5, 4, 5, 6, 1, 2, 6, 2, 2, 2, 6, 3, 1, 5, 1, 2, 2, 6, 5, 1, 2, 3, 3, 5, 2, 5, 6, 4, 5, 4, 6, 1, 3, 6, 1, 4, 6, 6, 1, 3, 2, 1, 6, 5, 3, 3, 5, 3, 2, 4, 1, 2, 3, 4, 5, 4, 1, 2, 6, 4, 4, 4, 4, 2, 3, 6, 5, 1, 5, 3, 1, 5, 6, 3, 1, 2, 1, 3, 4, 5, 1, 2, 4, 1, 5, 5, 5, 3, 4, 5, 3, 5, 3, 5, 6, 3, 3, 2, 2, 6, 5, 6, 6, 6, 2, 1, 3, 5, 3, 1, 6, 1, 3, 1, 2, 6, 4, 4, 5, 4, 2, 1, 2, 1, 6, 5, 5, 2, 3, 6, 4, 3, 6, 4, 1, 5, 3, 4, 6, 6, 5, 3, 2, 4, 5, 4, 4, 6, 4, 3, 4, 5, 1, 3, 1, 1, 6, 3, 5, 6, 3, 5, 3, 2, 3, 6, 3, 6, 1, 5, 4, 3, 6, 6, 5, 6, 3, 2, 1, 2, 1, 1, 2, 2, 6, 3, 5, 2, 6, 6, 1, 3, 4, 4, 4, 2, 4, 1, 5, 3, 2, 6, 2, 3, 5, 6, 1, 3, 3, 6, 5, 1, 3, 6, 5, 6, 2, 4, 3, 1, 5, 1, 6, 6, 4, 1, 5, 3, 4, 5, 4, 2, 3, 6, 3, 2, 1, 2, 1, 5, 1, 3, 4, 6, 1, 4, 2, 5, 6, 2, 6, 4, 6, 1, 3, 4, 2, 3, 4, 6, 2, 1, 2, 6, 1, 3, 1, 4, 5, 3, 3, 2, 4, 1, 3, 2, 5, 3, 1, 4, 6, 4, 4, 5, 2, 4, 4, 1, 6, 2, 4, 3, 4, 4, 6, 6, 1, 1, 3, 6, 5, 3, 1, 5, 5, 2, 2, 1, 4, 5, 4, 1, 3, 6, 1, 3, 2, 5, 5, 5, 2, 3, 6, 2, 4, 1, 4, 2, 2, 4, 6, 4, 4, 4, 4, 6, 6, 5, 3, 5, 2, 4, 3, 5, 5, 5, 3, 6, 4, 6, 1, 6, 5, 1, 1, 5, 1, 4, 1, 5, 6, 3, 2, 5, 4, 5, 3, 3, 3, 1, 1, 3, 1, 6, 5, 3, 4, 2, 5, 2, 2, 3, 1, 5, 1, 4, 2, 4, 6, 6, 2, 4, 5, 5, 1, 4, 1, 5, 5, 6, 4, 3, 3, 1, 3, 3, 5, 3, 1, 1, 4, 5, 6, 1, 1, 3, 2, 5, 2, 1, 6, 5, 1, 5, 2, 6, 5, 5, 4, 1, 4, 5, 6, 5, 5, 3, 4, 4, 3, 3, 4, 1, 2 4, 2, 3, 3, 2, 1, 4, 2, 2, 1, 4, 5, 5, 3, 1, 1, 1, 2, 1, 2, 6, 6, 1, 3, 3, 5, 2, 4, 2, 3, 6, 3, 3, 1, 6, 6, 5, 4, 3, 2, 5, 4, 1, 1, 5, 4, 5, 4, 4, 5, 6, 6, 1, 4, 4, 4, 1, 1, 5, 2, 1, 4, 5, 2, 2, 4, 5, 3, 4, 1, 1, 5, 1, 1, 6, 5, 5, 4, 1, 5, 4, 2, 4, 4, 5, 3, 4, 6, 2, 1, 5, 4, 3, 5, 2, 3, 2, 3, 4, 2, 5, 4, 3, 1, 2, 3, 2, 3, 1, 1, 1, 5, 6, 5, 5, 4, 6, 6, 2, 3, 5, 1, 2, 4, 4, 1, 2, 6, 3, 6, 6, 3, 6, 3, 4, 6, 1, 5, 5, 4, 2, 3, 6, 1, 6, 1, 3, 6, 5, 4, 4, 6, 2, 1, 1, 5, 5, 1, 4, 4, 6, 6, 6, 3, 6, 2, 6, 1, 1, 2, 6, 5, 3, 4, 2, 3, 6, 4, 5, 6, 3, 6, 3, 1, 2, 1, 5, 4, 5, 6, 2, 1, 3, 2, 6, 1, 4, 1, 2, 6, 3, 1, 3, 3, 3, 3, 3, 4, 4, 3, 6, 2, 5, 4, 6, 5, 6, 4, 1, 1, 1, 1, 1, 4, 5, 1, 2, 1, 2, 3, 5, 6, 5, 4, 5, 3, 4, 1, 4, 3, 4, 1, 4, 1, 4, 5, 6, 5, 3, 5, 6, 2, 6, 6, 2, 1, 6, 5, 6, 3, 3, 6, 4, 5, 5, 4, 6, 5, 1, 1, 6, 3, 6, 5, 3, 6, 5, 3, 4, 3, 6, 5, 1, 2, 6, 6, 3, 2, 6, 6, 5, 5, 5, 2, 5, 3, 1, 2, 4, 3, 2, 1, 6, 6, 2, 3, 3, 2, 4, 2, 5, 4, 2, 6, 6, 3, 6, 4, 2, 4, 3, 2, 4, 1, 6, 1, 2, 4, 1, 5, 6, 4, 6, 4, 3, 4, 4, 5, 4, 3, 4, 2, 6, 5, 3, 2, 5, 2, 6, 2, 4, 1, 4, 4, 5, 3, 6, 4, 4, 6, 3, 2, 5, 5, 4, 3, 1, 6, 1, 4, 3, 5, 5, 6, 2, 1, 1, 4, 6, 3, 4, 6, 2, 3, 5, 4, 4, 5, 3, 5, 3, 5, 4, 6, 3, 3, 6, 4, 2, 1, 2, 3, 4, 6, 1, 5, 1, 3, 4, 1, 6, 5, 3, 1, 2, 2, 1, 2, 2, 2, 6, 3, 6, 3, 2, 5, 4, 6, 2, 2, 2, 1, 5, 1, 5, 5, 2, 3, 4, 2, 4, 3, 2, 1, 2, 1, 5, 2, 4, 5, 2, 2, 5, 1, 6, 1, n N μ = 3.50, σ = 1.69 χ²/ndf = 2.75/5 p = x Deviations can & must be there!


17 4/23/15 17 Descriptive statistics sample Includes fitting Parameters calculated from observations Parameters (thus) have uncertainty Functional form is assumed... My first publication...
 Statistical fluctuation are predictable can test goodness-of-fit e.g. with χ² also χ² has fluctuations, follows χ²-distribution")
18 4/23/15 18 Inferential statistics Check whether your assumptions are correct Best match doesn't mean good match (just that nothing else was better) Statistical fluctuation are predictable can test goodness-of-fit e.g. with χ² also χ² has fluctuations, follows χ²-distribution


19 4/23/15 19 Getting a good fit Great challenge: getting a good fit with 1010 events
20 4/23/15 20 Quality testing Put X's in the grid Give each square 50% change for X Count number of X's 0 6, , 8, 17, 18 9, 10, 15, : : : : Humans ill suited for randomness


21 4/23/15 21 Inferential statistics Decide between multiple truths (hypotheses) Match observation with expectation (with likelihood) Also likelihood can be calculated with certainty
22 4/23/15 22 Einstein Many experiments may prove me right, but it takes only one to prove me wrong! Make sure you pick the right one!
23 4/23/15 23 Einstein Many experiments may prove me right, but it takes only one to prove me wrong! Make sure you pick the right one!

24 4/23/15 24 Einstein Many experiments may prove me right, but it takes only one to prove me wrong! Make sure you pick the right one! risk for bias

25 4/23/15 25 Types of bias Intellectual phase locking Experimental imperfections Correlations Find what you want to find Stop looking at positive 'proof' Keep looking until positive 'proof' Fix problems until positive 'proof'

26 4/23/15 26 Reproduce independently Support claim of discovery Expose unfortunate mistakes Avoid fraud!


27 4/23/15 27 So what about Nessie? Wishful thinking or historically founded?

28 4/23/15 28 Systematic observation


29 4/23/15 29 Deep-scan Systematic scan with sonar

30 4/23/15 30 Hoax?

31 4/23/15 31 Nessie in Queensland, AUS she's on vacation!

32 4/23/15 32


33 Thank you for your attention!
Laboratory 1: Uncertainty Analysis
 University of Alabama Department of Physics and Astronomy PH101 / LeClair May 26, 2014 Laboratory 1: Uncertainty Analysis Hypothesis: A statistical analysis including both mean and standard deviation can
MITOCW mit_jpal_ses06_en_300k_512kb-mp4
 MITOCW mit_jpal_ses06_en_300k_512kb-mp4 FEMALE SPEAKER: The following content is provided under a Creative Commons license. Your support will help MIT OpenCourseWare continue to offer high-quality educational
Statistical Hypothesis Testing
 Statistical Hypothesis Testing Statistical Hypothesis Testing is a kind of inference Given a sample, say something about the population Examples: Given a sample of classifications by a decision tree, test
OFF THE WALL. The Effects of Artist Eccentricity on the Evaluation of Their Work ROUGH DRAFT
 OFF THE WALL The Effects of Artist Eccentricity on the Evaluation of Their Work ROUGH DRAFT Hannah Thomas AP Statistics 2013 2014 Period 6 May 29, 2014 This study explores the relationship between perceived
On the Monty Hall Dilemma and Some Related Variations
 Communications in Mathematics and Applications Vol. 7, No. 2, pp. 151 157, 2016 ISSN 0975-8607 (online); 0976-5905 (print) Published by RGN Publications http://www.rgnpublications.com On the Monty Hall
Unit 8: Sample Surveys
 Unit 8: Sample Surveys Marius Ionescu 10/27/2011 Marius Ionescu () Unit 8: Sample Surveys 10/27/2011 1 / 13 Chapter 19: Surveys Why take a survey? Marius Ionescu () Unit 8: Sample Surveys 10/27/2011 2
Sampling distributions and the Central Limit Theorem
 Sampling distributions and the Central Limit Theorem Johan A. Elkink University College Dublin 14 October 2013 Johan A. Elkink (UCD) Central Limit Theorem 14 October 2013 1 / 29 Outline 1 Sampling 2 Statistical
Translational scientist competency profile
 C-COMEND Competency profile for Translational Scientists C-COMEND is a two-year European training project supported by the Erasmus plus programme, which started on November 1st 2015. The overall objective
Grade 8 Pacing and Planning Guide Science
 Colorado Academic Standards: Grade Level Expectations (GLE) Evidence Outcomes (EO) Nature of (NOS) and Engineering Practices (Nat l Frameworks) Asking questions (for science) and defining problems (for
Section 6.4. Sampling Distributions and Estimators
 Section 6.4 Sampling Distributions and Estimators IDEA Ch 5 and part of Ch 6 worked with population. Now we are going to work with statistics. Sample Statistics to estimate population parameters. To make
Prepared by the YuMi Deadly Centre Faculty of Education, QUT. YuMi Deadly Maths Year 6 Teacher Resource: SP Loaded dice
 YuMi Deadly Maths Year 6 Teacher Resource: SP Loaded dice Prepared by the YuMi Deadly Centre Faculty of Education, QUT YuMi Deadly Maths Year 6 Teacher Resource: SP Loaded dice ACKNOWLEDGEMENT We acknowledge
x y
 1. Find the mean of the following numbers: ans: 26.25 3, 8, 15, 23, 35, 37, 41, 48 2. Find the median of the following numbers: ans: 24 8, 15, 2, 23, 41, 83, 91, 112, 17, 25 3. Find the sample standard
Chapter 1: About Science
 Lecture Outline Chapter 1: About Science This lecture will help you understand: What Science Is Scientific Measurements Mathematics The Language of Science Scientific Methods Science, Art, and Religion
Social Studies 201 Notes for November 8, 2006 Sampling distributions Rest of semester For the remainder of the semester, we will be studying and
 1 Social Studies 201 Notes for November 8, 2006 Sampling distributions Rest of semester For the remainder of the semester, we will be studying and working with inferential statistics estimation and hypothesis
Basic Probability Concepts
 6.1 Basic Probability Concepts How likely is rain tomorrow? What are the chances that you will pass your driving test on the first attempt? What are the odds that the flight will be on time when you go
Chapter 12 Summary Sample Surveys
 Chapter 12 Summary Sample Surveys What have we learned? A representative sample can offer us important insights about populations. o It s the size of the same, not its fraction of the larger population,
Statistics, Probability and Noise
 Statistics, Probability and Noise Claudia Feregrino-Uribe & Alicia Morales-Reyes Original material: Rene Cumplido Autumn 2015, CCC-INAOE Contents Signal and graph terminology Mean and standard deviation
Genealogical trees, coalescent theory, and the analysis of genetic polymorphisms
 Genealogical trees, coalescent theory, and the analysis of genetic polymorphisms Magnus Nordborg University of Southern California The importance of history Genetic polymorphism data represent the outcome
Chapter 2 Scientific Method
 Chapter 2 Scientific Method Day Activity Homework 1 Notes I,II Cost/Benefit Case* Article Analysis 2 Notes III, IV Metric System WS/ Oil Spill Experiment* Graphing* 3 Notes V Satellite Imaging Activity*
MAT 1272 STATISTICS LESSON STATISTICS AND TYPES OF STATISTICS
 MAT 1272 STATISTICS LESSON 1 1.1 STATISTICS AND TYPES OF STATISTICS WHAT IS STATISTICS? STATISTICS STATISTICS IS THE SCIENCE OF COLLECTING, ANALYZING, PRESENTING, AND INTERPRETING DATA, AS WELL AS OF MAKING
Probability and Statistics
 Probability and Statistics Activity: TEKS: Mystery Bags (3.13) Probability and statistics. The student solves problems by collecting, organizing, displaying, and interpreting sets of data. The student
Grade 8 Math Assignment: Probability
 Grade 8 Math Assignment: Probability Part 1: Rock, Paper, Scissors - The Study of Chance Purpose An introduction of the basic information on probability and statistics Materials: Two sets of hands Paper
ROCHESTER INSTITUTE OF TECHNOLOGY COURSE OUTLINE FORM COLLEGE OF SCIENCE. Chester F. Carlson Center for Imaging Science
 ROCHESTER INSTITUTE OF TECHNOLOGY COURSE OUTLINE FORM COLLEGE OF SCIENCE Chester F. Carlson Center for Imaging Science NEW COURSE: COS-IMGS-141 - Earth System Dynamics I 1.0 Course Designations and Approvals
Probability - Introduction Chapter 3, part 1
 Probability - Introduction Chapter 3, part 1 Mary Lindstrom (Adapted from notes provided by Professor Bret Larget) January 27, 2004 Statistics 371 Last modified: Jan 28, 2004 Why Learn Probability? Some
Reading Skills Practice Test 9
 Reading Skills Practice Test 9 READING COMPREHENSION Read each story. Then fill in the circle that best completes each sentence or answers each question. What does your last name say about you? If you
Clay County District Schools. Addison Davis, Superintendent. Graduation Rate
 Clay County District Schools Addison Davis, Superintendent Graduation Rate February 1, 2018 Objectives Identify the Current Graduation Rates in Clay County District Schools Identify Achievement Gap Related
SPIRE MATHS Stimulating, Practical, Interesting, Relevant, Enjoyable Maths For All
 Probability experiments TYPE: OBJECTIVE(S): DESCRIPTION: OVERVIEW: EQUIPMENT: Main Probability from experiments; repeating experiments gives different outcomes; and more generally means better probability
ROCHESTER INSTITUTE OF TECHNOLOGY COURSE OUTLINE FORM COLLEGE OF SCIENCE. Chester F. Carlson Center for Imaging Science
 ROCHESTER INSTITUTE OF TECHNOLOGY COURSE OUTLINE FORM COLLEGE OF SCIENCE Chester F. Carlson Center for Imaging Science REVISED COURSE: COS-IMGS-241 Earth System Dynamics 1.0 Course Designations and Approvals
Patterns Professor Jon Kolko
 Patterns Professor Jon Kolko Moving to Synthesis Ethnography Synthesis Prototyping Immersion in the cultural context of a wicked problem Making meaning through inference and reframing Hypothesis validation
Science. What it is Why it s important to know about it Elements of the scientific method
 Science What it is Why it s important to know about it Elements of the scientific method DEFINITIONS OF SCIENCE: Attempts at a one-sentence description Science is the search for the perfect means of attaining
Introduction. (Good) Sources of Drug Use Data [drugdata.pdf]
![Introduction. (Good) Sources of Drug Use Data [drugdata.pdf]](/thumbs/93/113702407.jpg "Introduction. (Good) Sources of Drug Use Data [drugdata.pdf]") (Good) Sources of Drug Use Data [drugdata.pdf] How to Find Out How Many Americans Use Drugs and the Methodological Issues in Drug Research copyright 2006 Michael Hallstone 1 Introduction The purpose of
(Good) Sources of Drug Use Data [drugdata.pdf] How to Find Out How Many Americans Use Drugs and the Methodological Issues in Drug Research copyright 2006 Michael Hallstone 1 Introduction The purpose of
Teacher s Notes. Problem of the Month: Courtney s Collection
 Teacher s Notes Problem of the Month: Courtney s Collection Overview: In the Problem of the Month, Courtney s Collection, students use number theory, number operations, organized lists and counting methods
Chapter 3 Monday, May 17th
 Chapter 3 Monday, May 17 th Surveys The reason we are doing surveys is because we are curious of what other people believe, or what customs other people p have etc But when we collect the data what are
Introduction to Chi Square
 Introduction to Chi Square The formula χ 2 = Σ = O = E = Degrees of freedom Chi Square Table P = 0.05 P = 0.01 P = 0.001 1 3.84 6.64 10.83 2 5.99 9.21 13.82 3 7.82 11.35 16.27 4 9.49 13.28 18.47 5 11.07
Mohammad Hossein Manshaei 1394
 Mohammad Hossein Manshaei manshaei@gmail.com 394 Some Formal Definitions . First Mover or Second Mover?. Zermelo Theorem 3. Perfect Information/Pure Strategy 4. Imperfect Information/Information Set 5.
Statistical Methods in Computer Science
 Statistical Methods in Computer Science Experiment Design Gal A. Kaminka galk@cs.biu.ac.il Experimental Lifecycle Vague idea groping around experiences Initial observations Model/Theory Data, analysis,
Polls, such as this last example are known as sample surveys.
 Chapter 12 Notes (Sample Surveys) In everything we have done thusfar, the data were given, and the subsequent analysis was exploratory in nature. This type of statistical analysis is known as exploratory
Level Below Basic Basic Proficient Advanced. Policy PLDs. Cognitive Complexity
 Level Below Basic Basic Proficient Advanced Policy PLDs (Performance Level Descriptors) General descriptors that provide overall claims about a student's performance in each performance level; used to
No-Three-in-Line, Intransitive Dice, and Other Amusements in Mathematics
 No-Three-in-Line, Intransitive Dice, and Other Amusements in Mathematics Nathan Kaplan University of California, Irvine Lake Arrowhead IPAM Reunion Conference December 14, 2016 Kaplan (UCI) Amusements
1-What type of graph is used to show trends? 2-What type of graph is used to compare information?
 AGENDA ABSENT BLOCK 9/3 & 9/4 week-4 TOPIC: the NATURE of SCIENCE OBJ : 9, 10, 11 DO NOW: 1-What type of graph is used to show trends? 2-What type of graph is used to compare information? Science of Life
Ancient Worlds Chapter 2. Puzzling Pieces Copy the blue print, it means they are Key Ideas or Key Words
 Ancient Worlds Chapter 2 Puzzling Pieces Copy the blue print, it means they are Key Ideas or Key Words 1 Artifacts: Pieces of the Past Artifacts are human made objects that teach us about the society and
English I RI 1-3 Stop Wondering, Start Experimenting
 English I RI 1-3 Stop Wondering, Start Experimenting 1 Many of the greatest scientific discoveries of our time have been accidents. Take radioactivity. Physicist Henri Becquerel simply left a uranium rock
AP STATISTICS 2015 SCORING GUIDELINES
 AP STATISTICS 2015 SCORING GUIDELINES Question 6 Intent of Question The primary goals of this question were to assess a student s ability to (1) describe how sample data would differ using two different
All that begins... peace be upon you
 All that begins... peace be upon you Faculty of Mechanical Engineering Department of Thermo Fluids Mechanical Engineering «an etymology» Abu Hasan ABDULLAH September 2017 Outline 1 Science & Engineering
COMMUNITY UNIT SCHOOL DISTRICT 200 Science Curriculum Philosophy
 COMMUNITY UNIT SCHOOL DISTRICT 200 Science Curriculum Philosophy Science instruction focuses on the development of inquiry, process and application skills across the grade levels. As the grade levels increase,
CCMR Educational Programs
 CCMR Educational Programs Title: Date Created: August 6, 2006 Author(s): Appropriate Level: Abstract: Time Requirement: Joan Erickson Should We Count the Beans one at a time? Introductory statistics or
STAT 100 Fall 2014 Midterm 1 VERSION B
 STAT 100 Fall 2014 Midterm 1 VERSION B Instructor: Richard Lockhart Name Student Number Instructions: This is a closed book exam. You may use a calculator. It is a 1 hour long exam. It is out of 30 marks
What Do You Expect? Concepts
 Important Concepts What Do You Expect? Concepts Examples Probability A number from 0 to 1 that describes the likelihood that an event will occur. Theoretical Probability A probability obtained by analyzing
USE OF BASIC ELECTRONIC MEASURING INSTRUMENTS Part II, & ANALYSIS OF MEASUREMENT ERROR 1
 EE 241 Experiment #3: USE OF BASIC ELECTRONIC MEASURING INSTRUMENTS Part II, & ANALYSIS OF MEASUREMENT ERROR 1 PURPOSE: To become familiar with additional the instruments in the laboratory. To become aware
Permutation and Randomization Tests 1
 Permutation and 1 STA442/2101 Fall 2012 1 See last slide for copyright information. 1 / 19 Overview 1 Permutation Tests 2 2 / 19 The lady and the tea From Fisher s The design of experiments, first published
Trial version. Resistor Production. How can the outcomes be analysed to optimise the process? Student. Contents. Resistor Production page: 1 of 15
 Resistor Production How can the outcomes be analysed to optimise the process? Resistor Production page: 1 of 15 Contents Initial Problem Statement 2 Narrative 3-11 Notes 12 Appendices 13-15 Resistor Production
Why Randomize? Jim Berry Cornell University
 Why Randomize? Jim Berry Cornell University Session Overview I. Basic vocabulary for impact evaluation II. III. IV. Randomized evaluation Other methods of impact evaluation Conclusions J-PAL WHY RANDOMIZE
TO PLOT OR NOT TO PLOT?
 Graphic Examples This document provides examples of a number of graphs that might be used in understanding or presenting data. Comments with each example are intended to help you understand why the data
The Next Generation Science Standards Grades 6-8
 A Correlation of The Next Generation Science Standards Grades 6-8 To Oregon Edition A Correlation of to Interactive Science, Oregon Edition, Chapter 1 DNA: The Code of Life Pages 2-41 Performance Expectations
BOOSTING AFFILIATE PROFITS
 BOOSTING AFFILIATE PROFITS HOW TO MAKE MORE MONEY Jonathan Leger COURTESY OF LEARNFROMJON.COM - PRIVATE BUSINESS COACHING FROM A MULTI-MILLION DOLLAR INTERNET MARKETER + ACCESS TO PREMIUM AND EXCLUSIVE
Warm Up The following table lists the 50 states.
 .notebook Warm Up The following table lists the 50 states. (a) Obtain a simple random sample of size 10 using Table I in Appendix A, a graphing calculator, or computer software. 4 basic sampling techniques
Statistical Tests: More Complicated Discriminants
 03/07/07 PHY310: Statistical Data Analysis 1 PHY310: Lecture 14 Statistical Tests: More Complicated Discriminants Road Map When the likelihood discriminant will fail The Multi Layer Perceptron discriminant
Student Outcomes. Classwork. Exercise 1 (3 minutes) Discussion (3 minutes)
 Discussion (3 minutes)") Student Outcomes Students learn that when lines are translated they are either parallel to the given line, or the lines coincide. Students learn that translations map parallel lines to parallel lines.
Student Outcomes Students learn that when lines are translated they are either parallel to the given line, or the lines coincide. Students learn that translations map parallel lines to parallel lines.
Sample Surveys. Chapter 11
 Sample Surveys Chapter 11 Objectives Population Sample Sample survey Bias Randomization Sample size Census Parameter Statistic Simple random sample Sampling frame Stratified random sample Cluster sample
SF2972: Game theory. Introduction to matching
 SF2972: Game theory Introduction to matching The 2012 Nobel Memorial Prize in Economic Sciences: awarded to Alvin E. Roth and Lloyd S. Shapley for the theory of stable allocations and the practice of market
INTRODUCTION my world
 INTRODUCTION This book is dedicated to all the hard working lotto players and independent professionals forecasters, like you, who continue on in the face of any challenge to add value to society, to support
Chapter 8. Producing Data: Sampling. BPS - 5th Ed. Chapter 8 1
 Chapter 8 Producing Data: Sampling BPS - 5th Ed. Chapter 8 1 Population and Sample Researchers often want to answer questions about some large group of individuals (this group is called the population)
Now let s figure the probability that Angelina picked a green marble if Marc did not replace his marble.
 Find the probability of an event with or without replacement : The probability of an outcome of an event is the ratio of the number of ways that outcome can occur to the total number of different possible
EXPLAINING THE SHAPE OF RSK
 EXPLAINING THE SHAPE OF RSK SIMON RUBINSTEIN-SALZEDO 1. Introduction There is an algorithm, due to Robinson, Schensted, and Knuth (henceforth RSK), that gives a bijection between permutations σ S n and
Common Phrases (2) Generic Responses Phrases
 Generic Responses Phrases") Common Phrases (2) Generic Requests Phrases Accept my decision Are you coming? Are you excited? As careful as you can Be very very careful Can I do this? Can I get a new one Can I try one? Can I use it?
Common Phrases (2) Generic Requests Phrases Accept my decision Are you coming? Are you excited? As careful as you can Be very very careful Can I do this? Can I get a new one Can I try one? Can I use it?
Lesson Sampling Distribution of Differences of Two Proportions
 STATWAY STUDENT HANDOUT STUDENT NAME DATE INTRODUCTION The GPS software company, TeleNav, recently commissioned a study on proportions of people who text while they drive. The study suggests that there
SDS PODCAST EPISODE 148 FIVE MINUTE FRIDAY: THE TROLLEY PROBLEM
 SDS PODCAST EPISODE 148 FIVE MINUTE FRIDAY: THE TROLLEY PROBLEM Show Notes: http://www.superdatascience.com/148 1 This is Five Minute Friday episode number 144, two things to remember and two things to
K.1 Structure and Function: The natural world includes living and non-living things.
 Standards By Design: Kindergarten, First Grade, Second Grade, Third Grade, Fourth Grade, Fifth Grade, Sixth Grade, Seventh Grade, Eighth Grade and High School for Science Science Kindergarten Kindergarten
Investigate the great variety of body plans and internal structures found in multi cellular organisms.
 Grade 7 Science Standards One Pair of Eyes Science Education Standards Life Sciences Physical Sciences Investigate the great variety of body plans and internal structures found in multi cellular organisms.
Deadly windows Featured scientist: Natasha Hagemeyer from Old Dominion University
 Deadly windows Featured scientist: Natasha Hagemeyer from Old Dominion University Research Background: Glass makes for a great windowpane because you can see right through it. However, the fact that windows
Game Mechanics Minesweeper is a game in which the player must correctly deduce the positions of
 Table of Contents Game Mechanics...2 Game Play...3 Game Strategy...4 Truth...4 Contrapositive... 5 Exhaustion...6 Burnout...8 Game Difficulty... 10 Experiment One... 12 Experiment Two...14 Experiment Three...16
Mindful Communication In Code Reviews. By Amy Ciavolino, presenter notes are at the bottom.
 Mindful Communication In Code Reviews By Amy Ciavolino, presenter notes are at the bottom. What is mindful communication? Mindful communication means to listen and speak with compassion, kindness and awareness.
What Is Color Profiling?
 Why are accurate ICC profiles needed? What Is Color Profiling? In the chain of capture or scan > view > edit > proof > reproduce, there may be restrictions due to equipment capability, i.e. limitations
Research & Development (R&D) defined (3 phase process)
 defined (3 phase process)") Research & Development (R&D) defined (3 phase process) Contents Research & Development (R&D) defined (3 phase process)... 1 History of the international definition... 1 Three forms of research... 2 Phase
Research & Development (R&D) defined (3 phase process) Contents Research & Development (R&D) defined (3 phase process)... 1 History of the international definition... 1 Three forms of research... 2 Phase
QUANTITATIVE METHODOLOGY IN RESEARCH DESIGN: A PROCESS OF ACQUIRING KNOWLEDGE Adjunct Professor: Joseph W. Dorsey, Ph.D.
 QUANTITATIVE METHODOLOGY IN RESEARCH DESIGN: A PROCESS OF ACQUIRING KNOWLEDGE Adjunct Professor: Joseph W. Dorsey, Ph.D. Welcome. Welcome to the second session of research methods in the Patel College
Introduction to Biosystematics - Zool 575
 Introduction to Biosystematics Lecture 21-1. Introduction to maximum likelihood - synopsis of how it works - likelihood of a single sequence - likelihood across a single branch - likelihood as branch length
Exam 2 Review. Review. Cathy Poliak, Ph.D. (Department of Mathematics ReviewUniversity of Houston ) Exam 2 Review
 Exam 2 Review") Exam 2 Review Review Cathy Poliak, Ph.D. cathy@math.uh.edu Department of Mathematics University of Houston Exam 2 Review Exam 2 Review 1 / 20 Outline 1 Material Covered 2 What is on the exam 3 Examples
Exam 2 Review Review Cathy Poliak, Ph.D. cathy@math.uh.edu Department of Mathematics University of Houston Exam 2 Review Exam 2 Review 1 / 20 Outline 1 Material Covered 2 What is on the exam 3 Examples
Grades 6 8 Innoventure Components That Meet Common Core Mathematics Standards
 Grades 6 8 Innoventure Components That Meet Common Core Mathematics Standards Strand Ratios and Relationships The Number System Expressions and Equations Anchor Standard Understand ratio concepts and use
I: Can you tell me more about how AIDS is passed on from one person to the other? I: Ok. Does it matter a how often a person gets a blood transfusion?
 Number 68 I: In this interview I will ask you to talk about AIDS. And I want you to know that you don't have to answer all my questions. If you don't want to answer a question just let me know and I will
Elements of Scholarly Discourse in a Digital World
 Elements of Scholarly Discourse in a Digital World Victoria Stodden Graduate School of Library and Information Science University of Illinois at Urbana-Champaign Center for Informatics Research in Science
The Importance of Scientific Reproducibility in Evidence-based Rulemaking
 The Importance of Scientific Reproducibility in Evidence-based Rulemaking Victoria Stodden School of Information Sciences University of Illinois at Urbana-Champaign Social and Decision Analytics Laboratory
How do I review a manuscript? Karl V. Clemons, PhD Editor-in-Chief Medical Mycology
 How do I review a manuscript? Karl V. Clemons, PhD Editor-in-Chief Medical Mycology Authors wonder who is reviewing my paper? Ideally - someone with expertise in the area of study on the ms. Ideally -
Sampling Terminology. all possible entities (known or unknown) of a group being studied. MKT 450. MARKETING TOOLS Buyer Behavior and Market Analysis
 of a group being studied. MKT 450. MARKETING TOOLS Buyer Behavior and Market Analysis") Sampling Terminology MARKETING TOOLS Buyer Behavior and Market Analysis Population all possible entities (known or unknown) of a group being studied. Sampling Procedures Census study containing data from
Sampling Terminology MARKETING TOOLS Buyer Behavior and Market Analysis Population all possible entities (known or unknown) of a group being studied. Sampling Procedures Census study containing data from
Fairfield Public Schools Science Curriculum. Draft Forensics I: Never Gone Without a Trace Forensics II: You Can t Fake the Prints.
 Fairfield Public Schools Science Curriculum Draft Forensics I: Never Gone Without a Trace Forensics II: You Can t Fake the Prints March 12, 2018 Forensics I and Forensics II: Description Forensics I: Never
Iowa Core Science Standards Grade 8
 A Correlation of To the Iowa Core Science Standards 2018 Pearson Education, Inc. or its affiliate(s). All rights reserved A Correlation of, Iowa Core Science Standards, Introduction This document demonstrates
Common Core Structure Final Recommendation to the Chancellor City University of New York Pathways Task Force December 1, 2011
 Common Core Structure Final Recommendation to the Chancellor City University of New York Pathways Task Force December 1, 2011 Preamble General education at the City University of New York (CUNY) should
Lecture Start
 Lecture -- 4 -- Start Outline 1. Science, Method & Measurement 2. On Building An Index 3. Correlation & Causality 4. Probability & Statistics 5. Samples & Surveys 6. Experimental & Quasi-experimental Designs
Open Methodology and Reproducibility in Computational Science
 Open Methodology and Reproducibility in Computational Science Victoria Stodden Department of Statistics Columbia University Numerical Cosmology 2012 Centre of Theoretical Cosmology DAMTP, University of
COS Lecture 7 Autonomous Robot Navigation
 COS 495 - Lecture 7 Autonomous Robot Navigation Instructor: Chris Clark Semester: Fall 2011 1 Figures courtesy of Siegwart & Nourbakhsh Control Structure Prior Knowledge Operator Commands Localization
Love Is The Answer Lyrics
 Track Listing 1. Stay 2. Control 3. So in Love 4. Lights Camera Action 5. Obsessed With Stars 6. For the Both of Us 7. Invincible 8. Tidal Waves & Hurricanes 9. Little Things 10. Safe 11. Stay (acoustic)
IE 361 Module 7. Reading: Section 2.5 of Revised SQAME. Prof. Steve Vardeman and Prof. Max Morris. Iowa State University
 IE 361 Module 7 Calibration Studies and Inference Based on Simple Linear Regression Reading: Section 2.5 of Revised SQAME Prof. Steve Vardeman and Prof. Max Morris Iowa State University Vardeman and Morris
ECON 214 Elements of Statistics for Economists
 ECON 214 Elements of Statistics for Economists Session 4 Probability Lecturer: Dr. Bernardin Senadza, Dept. of Economics Contact Information: bsenadza@ug.edu.gh College of Education School of Continuing
Graphing Techniques. Figure 1. c 2011 Advanced Instructional Systems, Inc. and the University of North Carolina 1
 Graphing Techniques The construction of graphs is a very important technique in experimental physics. Graphs provide a compact and efficient way of displaying the functional relationship between two experimental
Fraud Detection using Benford s Law
 Fraud Detection using Benford s Law The Hidden Secrets of Numbers James J.W. Lee MBA (Iowa,US), B.Acc (S pore), FCPA (S pore), FCPA (Aust.), CA (M sia), CFE, CIA, CISA, CISSP, CGEIT Contents I. History
Basic Probability Ideas. Experiment - a situation involving chance or probability that leads to results called outcomes.
 Basic Probability Ideas Experiment - a situation involving chance or probability that leads to results called outcomes. Random Experiment the process of observing the outcome of a chance event Simulation
Gage Repeatability and Reproducibility (R&R) Studies. An Introduction to Measurement System Analysis (MSA)
 Studies. An Introduction to Measurement System Analysis (MSA)") Gage Repeatability and Reproducibility (R&R) Studies An Introduction to Measurement System Analysis (MSA) Agenda Importance of data What is MSA? Measurement Error Sources of Variation Precision (Resolution,
Gage Repeatability and Reproducibility (R&R) Studies An Introduction to Measurement System Analysis (MSA) Agenda Importance of data What is MSA? Measurement Error Sources of Variation Precision (Resolution,
Where tax and science meet part 2*
 Where tax and science meet part 2* How CAs can identify eligible activities for the federal government s SR&ED program *This is an expanded version of a summary that appeared in the November 2003 print
Elements of the Sampling Problem!
 Elements of the Sampling Problem! Professor Ron Fricker! Naval Postgraduate School! Monterey, California! Reading Assignment:! 2/1/13 Scheaffer, Mendenhall, Ott, & Gerow,! Chapter 2.1-2.3! 1 Goals for
MATHEMATICAL MODELS Vol. I - Measurements in Mathematical Modeling and Data Processing - William Moran and Barbara La Scala
 MEASUREMENTS IN MATEMATICAL MODELING AND DATA PROCESSING William Moran and University of Melbourne, Australia Keywords detection theory, estimation theory, signal processing, hypothesis testing Contents.
MITOCW watch?v=krzi60lkpek
 MITOCW watch?v=krzi60lkpek The following content is provided under a Creative Commons license. Your support will help MIT OpenCourseWare continue to offer high quality educational resources for free. To