WETLAND WILDLIFE POPULATIONS. Wetland Wildlife Populations and Research rd Street Bemidji, MN (218)
|
|
|
- Anabel Bradley
- 6 years ago
- Views:
Transcription
1 WETLAND WILDLIFE POPULATIONS Wetland Wildlife Populations and Research rd Street Bemidji, MN (218)
2 94


3 2015 WATERFOWL BREEDING POPULATION SURVEY MINNESOTA ABSTRACT Steve Cordts, Minnesota DNR, Waterfowl Staff Specialist The number of breeding waterfowl in a portion of Minnesota has been estimated each year since 1968 as a part of the overall inventory of North American breeding waterfowl. The survey consists of aerial observations in addition to more intensive ground counts on selected routes to determine the proportion of birds counted by the aerial crew. Procedures used are similar to those used elsewhere across the waterfowl breeding grounds. The 2015 aerial survey portion was flown from May 4 to May 30. The survey was the longest on record due to poor weather in mid-may. Spring ice-out dates were ~2 weeks earlier than average across the state. Temperatures were above normal and precipitation was below normal in March and April. Temperatures in May were near normal but precipitation was well above normal across the state. Spring wetland conditions were poor in early May at the start of the survey but improved some by the end of May when the survey was completed. Overall, wetland numbers (Types II- V) decreased 36% compared to 2014 and were below both the 10-year (-22%) and long-term (-13%) averages. The number of temporary wetlands (Type 1) was 64% below the long-term average. The 2015 estimated mallard breeding population was 206,000, which was 20% lower than last year s estimate of 257,000 mallards, but statistically unchanged (P=0.45). Mallard numbers were 17% below the 10-year average and 10% below the long-term average of 228,000 breeding mallards. The estimated blue-winged teal population was 169,000, which was 66% higher than last year s estimate of 102,000 blue-winged teal, but statistically unchanged (P=0.28). Blue-winged teal numbers were 14% above the 10-year average and 21% below the long-term average of 212,000 blue-winged teal. The combined population index of other ducks, excluding scaup, was 149,000 ducks, which was 29% higher than last year s estimate and 17% below the 10-year average and 16% below the long-term average of 177,000 other ducks. The estimate of total duck abundance (524,000), which excludes scaup, was 10% higher than last year s estimate of 474,000 ducks and was 9% below the 10-year average and 15% below the long-term average of 618,000 ducks. The estimated number of Canada geese was 162,000 and 62% higher than last year and 2% above the 10-year average. METHODS The aerial survey is based on a sampling design that includes three survey strata (Table 1, Figure 1). The strata cover 39% of the state area and are defined by density of lake basins (>10 acres) exclusive of the infertile northeastern lake region. The strata include the following: Stratum I: high density, 21 or more lake basins per township. Stratum II: moderate density, 11 to 20 lake basins per township. Stratum III: low density, 2 to 10 lake basins per township. Areas with less than two basins per township are not Figure 1. Location of waterfowl breeding population survey strata in Minnesota. 95
4 surveyed. Strata boundaries were based upon "An Inventory of Minnesota Lakes" (Minnesota Conserv. Dept. 1968:12). Standard procedures for the survey follow those outlined in "Standard Operating Procedures for Aerial Waterfowl Breeding Ground Populations and Habitat Surveys in North America (USFWS/CWS 1987). Changes in survey methodology were described in the 1989 Minnesota Waterfowl Breeding Population Survey report. Pond and waterfowl data for were calculated from Jessen ( ) and Maxson and Pace (1989). All aerial transects in Strata I-III (Table 1) were flown using an American Champion Scout. Past surveys have been flown with a Cessna 185 but the Scout performed well for the survey. Wetlands were counted on only the observer s side of the plane (0.125 mile wide transect); a correction factor obtained in 1989 (123,000/203,000 = 0.606) was used to adjust previous estimates ( ) of wetland abundance (Type II-V; Table 2) that were obtained when the observer counted wetlands on both sides of the plane (0.25 mile wide transect). All wetland and waterfowl data were recorded on digital voice recorders and transcribed by the observer from the digital files. On transects with low waterfowl abundance, the observer recorded all observations to make transcription easier. Visibility correction factors (VCFs) were derived from intensive ground surveys on 14 selected routes flown by the aerial crew. Many of these routes use a county road as the mid-point of the transect boundary which aids in navigation and helps ensure the aerial and ground crews survey the same area. Ground routes each originally included about 100 wetland areas; however, drainage has reduced the number of wetlands on most of the routes. All observations from both ground crews and aerial crews were used to calculate the VCFs. The SAS computer program was modified in 1992 to obtain standard errors for mallard and blue-winged teal breeding population estimates. These calculations were based upon SAS computer code written by Graham Smith, USFWS-Office of Migratory Bird Management. Estimates for 2014 and 2015 were compared using two-tailed Z-tests. SURVEY CHRONOLOGY The 2015 aerial survey began on 4 May in southern Minnesota and concluded in northern Minnesota on 30 May. Transects were flown on 9 days, May 4-5, May 9, May 19-20, May 22, May 27-28, and May 30 and completed in 63 flight hours. Flights began near 7 AM and were completed by 12:30 PM each day. The median date for survey completion was May 20, which was similar to last year but one of the latest on record. WEATHER AND HABITAT CONDITIONS For the majority of Minnesota lakes, ice out was 1-2 weeks earlier than the historical median dates. Temperatures in March averaged 2 F above normal and precipitation was 0.9 inches below normal statewide. Temperatures in April averaged 1.6 F above normal and precipitation was 0.6 inches below normal statewide. Temperatures in May averaged 0.9 F below normal statewide and precipitation was 1.8 inches above normal statewide ( Additional temperature and precipitation data are provided in Appendix A. Wetland conditions in early spring 2015 were extremely dry but improved some by late May. In early May 2015, 40% of the state was classified as severe drought, 54% was moderate drought, 1% was abnormally dry, and 4% of the state was under no drought designation. By early June 2015, 0% of the state was classified as severe drought, 12% was moderate drought, 39% was abnormally dry, and 49% of the state was under no drought designation. In early May 2015, statewide topsoil moisture indices were rated as 6% very short, 39% short, 55% adequate and 0% surplus moisture. By early June 2015, statewide topsoil moisture indices were rated as 0% very short, 1% short, 87% adequate and 13% surplus moisture ( 96
5 Planting dates for row crops were extremely early in By May 3, about 83% of the corn acres had been planted statewide compared to 7% in 2014 and 34% for the previous 5-year average. By June 1, 12% of alfalfa hay had been cut compared to 5% in 2014 and a 5-year average of 23% (Minnesota Agricultural Statistics Service Weekly Crop Weather Reports, ( Due to the early spring, leaf-out dates and wetland vegetation growth was about 2-3 weeks earlier than average and visibility was poor during the entire survey. Wetland numbers (Type II-V) decreased 36% from 2014 and were 22% below the 10-year average and 13% below the long-term average (Table 2; Figure 2). The number of temporary (Type 1) sheet water wetlands was 64% below the long-term average. In general, wetland conditions improved some during the survey with significant rain events in mid-may across the survey area. WATERFOWL POPULATIONS The number of ducks, Canada geese, and coots, by stratum, are shown in Tables 3-5; total numbers are presented in Table 6. These estimates are expanded for area but not corrected for visibility bias. Table 7 and Table 8 provide the unadjusted population index (Unad. PI), which is multiplied by the visibility correction factor (VCF) to obtain the population index (PI) for ducks and Canada geese. The standard error (SE) of the estimate is also provided for mallard and blue-winged teal estimates. The 2015 breeding population estimate of mallards was 206,230 (SE = 37,498), which was 20% lower than the 2014 estimate of 257,000 mallards, but statistically unchanged (Z = 0.76, P = 0.45) (Table 7, Figure 3). Mallard numbers were 17% below the 10-year average and 10% below the long-term average of 228,000 mallards. In 2015, the mallard population was comprised of 68% lone or flocked males, 19% pairs, and 13% flocked mallards. The 5-year average is 71% lone or flocked males, 21% pairs, and 8% flocked mallards. The estimated blue-winged teal population was 168,615 (SE = 56,787), which was 66% higher than the 2014 estimate of 101,640 blue-winged teal, but statistically unchanged (Z = 1.09, P = 0.28). Blue-winged teal numbers were 14% above the 10-year average and 21% below the long-term average (Table 7, Figure 4). The blue-winged teal population was comprised of 10% lone males, 43% pairs, and 47% flocks. The long-term average is 18% lone males, 54% pairs, and 29% flocks. The combined population estimate of other ducks (excluding scaup) was 149,330 which was 29% above last year s estimate of 115,750 other ducks and 17% below the 10-year average and 16% below the longterm average (Table 7, Figure 5). Ring-necked ducks and wood ducks were the most abundant species of other ducks (Table 6). Scaup numbers (35,000) were 46% above the 10-year average and 43% below the long-term average. The total duck population index, excluding scaup, was 524,000 ducks and was 10% above last year s index of 474,000 ducks and 9% below the 10-year average and 15% below the long-term average (Table 8, Figure 6). The population index for total ducks was 559,000 ducks, which was 7% below the 10-year average and 18% below the long-term average. Visibility Correction Factors (VCFs) were lower for mallards in 2015 than 2014 but higher for bluewinged teal, other ducks, and Canada geese in 2015 compared to 2014 (Table 7, Table 8). The mallard VCF (2.17) was 6% below last year s estimate and 20% below the 10-year average. The blue-winged teal VCF (5.04) was 58% above last year s estimate and 32% above the 10-year average. The VCF for other ducks (3.22) was 44% above last year s estimate and 3% above the 10-year average. The VCF for Canada geese (1.75) was 11% above last year s estimate and 17% below the 10-year average. The population estimate of Canada geese (adjusted for visibility) was 162,000, which was 2% above the 10-year average (Table 8, Figure 7). There were considerably more geese observed in flocks (>10 geese) this year compared to previous years. The goose population was comprised of 60% lone or paired Canada 97
6 geese and 40% flocked geese. In 2013, the goose population was comprised of 77% lone or paired Canada geese and 23% flocked geese. These flocked Canada geese could be non-breeding Minnesota resident geese, early molt migrant Canada geese from states south of Minnesota, or even late migrant Canada geese moving to Canada. A total of 23 Canada goose broods were observed, compared to 13 in 2014, 5 in 2013 and 70 in The estimated coot population, uncorrected for visibility, was 10,000 compared to 19,000 in The estimated number of swans (likely trumpeters) was 12,575 swans compared to last year s estimate of 7,700 (Table 6). Lone swans are not doubled and the estimate is expanded for area but not visibility, although visibility of swans is extremely high. Trumpeter swans continue to expand their range and dramatically increase in number. SUMMARY Ice out was about 2 weeks earlier than average across the state in Temperatures in March and April were above normal and precipitation was below normal. Temperatures in May were near average but precipitation was well above average. Wetland conditions were below average across the survey area. Overall, wetland numbers were 36% lower than last year and 13% below the long-term average. Mallard abundance in 2015 was 206,000 mallards, which was 20% lower than last year and 17% below the 10- year average and 10% below the long-term average of 228,000 breeding mallards. Blue-winged teal abundance (169,000) was 66% higher than 2014 but 21% below the long-term average of 212,000 bluewinged teal. The combined population index of other ducks (149,000) was 29% higher than 2014 and 16% below the long-term average of 178,000 other ducks. Total duck abundance (524,000), excluding scaup, was 10% higher than 2014 and was 15% below the long-term average. Canada goose numbers adjusted for visibility bias increased 62% from ACKNOWLEDGMENT Thanks to the ground crews and the pilot for all of their efforts. Data Supplied By: Minnesota Department of Natural Resources (MNDNR); U.S. Fish and Wildlife Service (USFWS) Air Crew: Pilot/Observer: Bob Geving, Conservation Officer Pilot, MNDNR, Division of Enforcement; Observer: Steve Cordts, Waterfowl Staff Specialist, MNDNR, Division of Wildlife Ground Crew Leaders: Sean Kelly, Deputy Chief, Migratory Birds, USFWS, Region III, Twin Cities; Wayne Brininger, USFWS, Tamarac National Wildlife Refuge; Dan Hertel and Fred Oslund, USFWS, HAPET, Fergus Falls; Tom Cooper, Andy Forbes and Jim Kelley, USFWS, Region III, Twin Cities; Bruce Davis, Minnesota DNR; Gina Kemper and Greg Dehmer, USFWS, Sherburne National Wildlife Refuge Ground Crew Assistants: Rich Olsen, Minnesota DNR; Lowell Deede, USFWS, Tamarac National Wildlife Refuge ; Tyler Zimmerman and Jordan Swart, USFWS, HAPET, Fergus Falls; Paul Richert and Steve Lewis, USFWS, Region III, Twin Cities; K. Svendsgaard, J. Rorah, K. Rittenhouse, E. Broich, Kris Spaeth, and John Riens, USFWS, Sherburne National Wildlife Refuge This project was funded in part by the Wildlife Restoration (Pittman-Robertson) Program. 98
7 Number 400, , , , Year Figure 2. Number of May ponds (Types II- V) and long-term average (dashed line) in Minnesota, Number 500, , , , , Year Figure 3. Mallard population estimates (adjusted for visibility bias) and long-term average (dashed line) in Minnesota, , , , ,000 Number 300, ,000 Number 300, , , , Year Year Figure 4. Blue-winged teal population estimates (adjusted for visibility bias) and long-term average (dashed line) in Minnesota, Figure 5. Other duck (excluding scaup) population estimates (adjusted for visibility bias) and long-term average (dashed line) in Minnesota, Number 1,200,000 1,000, , , , , Year Figure 6. Total duck (excluding scaup) population estimates (adjusted for visibility bias) and long-term average (dashed line) in Minnesota, Number 350, , , , , ,000 50, Year Figure 7. Canada goose population estimates (adjusted for visibility bias) and long-term average (dashed line) in Minnesota,
8 LITERATURE CITED: Jessen, R. J Waterfowl breeding ground survey, Minn. Game Research Proj. Q. Prog. Rep. 29(32): Jessen, R. J Waterfowl breeding ground survey, Minn. Game Research Proj. Q. Prog. Rep. 31(2): Jessen, R. J Waterfowl breeding ground survey, Minn. Game Research Proj. Q. Prog. Rep. 31(2): Jessen, R. J Waterfowl breeding ground survey, Minn. Game Research Proj. Q. Prog. Rep. 31(2): Jessen, R. J Waterfowl breeding ground survey, Minn. Game Research Proj. Q. Prog. Rep. 32(2): Minnesota Conservation Department An inventory of Minnesota Lakes. Waters Section, Division of Waters, Soils, and Minerals, Bull. No pp. Maxson, S. J., and R. M. Pace Summary and evaluation of Minnesota's waterfowl breeding population survey, Minnesota Wildl. Rep pp. USFWS/CWS Standard operating procedures for aerial waterfowl breeding ground population and habitat surveys in North America. U.S. Fish and Wildlife Service and Canadian Wildlife Service. Table 1. Survey design for Minnesota, May Stratum Total Survey design Square miles in stratum 5,075 7,970 17,671 30,716 Square miles in sample - waterfowl Square miles in sample - ponds Linear miles in sample ,089.0 Number of transects in sample Minimum transect length (miles) Maximum transect length (miles) Expansion Factor - waterfowl Expansion Factor - ponds Current year coverage Square miles in sample - waterfowl Square miles in sample - ponds Linear miles in sample ,089.0 Number of transects in sample Minimum transect length (miles) Maximum transect length (miles) Expansion Factor - waterfowl Expansion Factor - ponds Also, 8 additional air-ground transects (total linear miles = 202.5, range miles) were flown to use in calculating the VCF. 100
9 Table 2. Estimated May ponds (Type 1 and Types II-V), Year Number of Ponds 1 Year Type 1 wetlands Number of Ponds , , , , , , , , , , , , , , , , , , , , , , , , , , , , , , , , , , , , , , , , , , , , , , , , , , , , , , , , , , , , , , , , , , , , , , , , ,000 Averages: 10-year 44, ,000 Long-term 61, ,000 % change from: % -36% 10-year -50% -22% Long-term -64% -13% 1 Type II-V, correction factor from 1989 (123,000/203,000=0.606) used to adjust pond numbers. 101
10 Table 3. Minnesota waterfowl breeding populations by species for Stratum I (high wetland density), expanded for area but not visibility, Year Species Dabblers: Mallard 26,992 33,157 26,576 26,604 28,742 29,297 25,937 29,381 19,050 16,829 16,357 25,104 19,467 18,439 19,856 18,911 21,161 19,522 19,633 Black Duck Gadwall 611 1,111 1, , ,250 2,111 1,166 1, ,166 1,055 1, , ,083 American Wigeon Green-winged Teal Blue-winged Teal 6,387 8,220 6,998 11,247 7,387 14,218 9,664 23,771 9,303 5,665 5,332 9,942 5,998 7,304 4,665 5,110 4,193 3,388 4,360 Northern Shoveler 1, , , , , , Northern Pintail Wood Duck 9,497 12,302 5,582 10,219 6,720 2,888 4,499 8,081 5,498 3,555 2,666 6,665 4,277 3,999 3,416 4,138 3,249 2,527 2,222 Dabbler Subtotal 45,154 55,790 41,711 50,459 45,043 48,958 42,017 65,565 35,629 27,772 25,523 44,322 31,742 31,881 28,493 29,882 30,324 27,215 28,020 Divers: Redhead , , , Canvasback 1,333 1,777 2,971 1,222 2,027 1,833 1, ,000 2,277 1,333 1, ,555 1,777 1,027 Scaup 3,416 9,247 1,750 7,415 5,832 2,444 2,055 5,971 4, ,276 8,553 2,777 2,222 1,055 1,000 1,250 5,526 Ring-necked Duck 2,694 2,749 2,360 4,776 2,444 2,777 1,361 5,165 1,722 2,055 1,555 21,494 6,859 3,138 4,804 2,666 3,582 4,554 3,110 Goldeneye Bufflehead , Ruddy Duck , , , , Hooded Merganser ,000 Large Merganser Diver Subtotal 9,360 26,325 9,442 14,608 13,107 9,997 6,915 13,801 9,525 4,803 4,693 35,351 20,466 9,608 9,665 5,916 8,802 10,330 12,663 Total Ducks 54,514 82,115 51,153 65,067 58,150 58,955 48,932 79,366 45,154 32,575 30,216 79,673 52,208 41,489 38,158 35,798 39,126 37,545 40,683 Other: Coot 5, ,999 1,722 2,888 2,666 21,411 2, ,829 2, , ,386 2,360 1,972 Canada Goose 10,330 16,967 19,495 22,160 24,882 24,104 22,160 23,160 22,938 21,633 29,797 18,717 16,523 16,440 13,691 26,437 23,771 18,578 23,077 Swan , ,611 1,277 2,944 1,944 2,
11 Table 4. Minnesota waterfowl breeding populations by species for Stratum II (medium wetland density), expanded for area but not visibility, Year Species Dabblers: Mallard 54,643 53,942 52,247 49,559 44,650 43,773 34,715 44,474 26,883 25,130 24,779 27,935 23,494 21,507 30,974 29,689 27,409 28,987 24,078 Black Duck Gadwall ,519 3,039 1, , , ,039 1,169 1, , American Wigeon , Green-winged Teal Blue-winged Teal 13,792 13,208 10,578 19,637 9,701 21,390 15,955 30,624 11,513 9,000 8,416 12,740 11,104 8,474 12,390 9,000 4,383 7,364 5,026 Northern Shoveler 2, ,104 4,675 1,052 2,221 1,403 1, ,513 1, Northern Pintail Wood Duck 11,338 10,520 19,753 13,792 7,831 5,143 4,558 8,766 3,273 1,753 2,221 6,546 5,260 6,312 6,955 5,143 4,792 1,636 1,753 Dabbler subtotal 83,631 80,592 86,435 91,404 65,221 73,696 57,566 91,929 42,604 37,636 36,235 51,079 41,962 40,560 52,540 45,936 37,987 39,624 33,487 Divers: Redhead 1, ,636 2,805 2, , , Canvasback , , ,286 1,169 Scaup 18,935 4,032 3,331 6,779 3,039 5,961 2,279 7,188 2, ,097 2, , ,045 2,396 4,909 Ring-necked Duck 3,565 2,279 2,221 5,610 3,799 6,370 2,455 5,377 1,929 3,331 1,578 13,149 9,117 2,396 11,455 1,695 6,253 5,143 4,325 Goldeneye , Bufflehead , , , Ruddy Duck ,870 2, Hooded Merganser , ,221 1, ,169 Large Merganser Diver subtotal 26,708 7,714 9,409 17,765 11,281 17,007 10,110 15,196 6,606 4,617 4,676 20,338 14,317 4,910 19,930 6,137 11,688 12,039 13,560 Total Ducks 110,339 88,306 95, ,169 76,502 90,703 67, ,125 49,210 42,253 40,911 71,417 56,279 45,470 72,470 52,073 49,675 51,663 47,047 Other: Coot 5, , ,909 1,519 8, , , Canada Goose 16,364 19,812 18,585 25,831 24,604 20,688 22,091 28,461 20,688 26,825 25,890 19,753 22,675 18,935 14,201 23,260 22,442 20,572 24,312 Swan , ,519 2,922 2,279 7,188 3,507 6,604 3,740 5,
12 Table 5. Minnesota waterfowl breeding populations by species for Stratum III (low wetland density), expanded for area but not visibility, Year Species Dabblers: Mallard 78, ,873 90,390 81,690 72,642 72,121 55,156 84,561 36,539 30,884 35,843 50,371 35,408 40,976 51,415 47,848 62,638 62,899 51,154 Black Duck Gadwall 2,436 3,045 2,436 2,610 10,701 3,306 1,566 6,960 2,001 5,568 4, ,392 1,392 4,089 1,566 5,220 1,914 2,088 American Wigeon , ,566 1, , ,566 Green-winged Teal ,218 1, Blue-winged Teal 25,316 26,360 18,530 29,405 20,618 56,374 21,140 39,758 27,578 23,663 15,659 18,095 20,183 16,964 44,716 35,669 18,617 21,227 24,098 Northern Shoveler 11,049 4,176 4,002 20,444 10,701 6, , ,002 2,088 6,873 2,088 8,265 6, ,914 Northern Pintail Wood Duck 14,268 23,837 20,531 25,055 17,225 13,572 12,702 20,705 7,482 7,308 5,394 14,442 10,266 12,354 13,659 10,962 12,180 9,657 8,265 Dabbler subtotal 133, , , , , ,377 91, ,900 75,340 68,815 62,812 88,476 69,511 79, , , ,833 96,393 89,607 Divers: Redhead 1,044 2,001 3,480 2,523 3,654 1, ,740 1, ,350 3,306 1,827 1,566 1,305 Canvasback 0 3, , ,131 2, ,566 1, ,044 1, Scaup 8,787 15,137 8,961 18,182 6,873 4, ,747 5,307 1, ,481 1, , ,874 2, Ring-necked Duck 3,654 2,958 1,479 8,178 8,526 7,395 1,479 5,133 10,179 6,699 1,392 8,526 6,525 3,045 6,264 9,135 6,960 5,568 3,480 Goldeneye ,044 1,566 3,132 1, ,044 1, ,218 Bufflehead , , , , ,915 4, Ruddy Duck , , , Hooded Merganser , , ,740 1, ,218 1,044 1, Large Merganser Diver subtotal 15,225 25,142 16,182 34,799 22,011 39,932 5,916 34,190 20,358 11,832 5,307 19,053 12,963 6,003 25,578 16,095 23,490 15,921 8,178 Total Ducks 148, , , , , ,309 97, ,090 95,698 80,647 68, ,529 82,474 85, , , , ,314 97,785 Other: Coot 24,620 5,133 14,702 67,684 3,132 14,007 7,134 77,427 8,613 14,702 5,742 15,137 7, ,479 25,664 27,578 15,746 7,917 Canada Goose 33,755 42,368 41,933 57,940 39,932 33,407 43,412 46,717 39,758 27,230 42,629 31,841 28,274 30,710 32,711 37,496 48,022 24,707 43,498 Swan ,001 1, ,914 2,175 1,827 1,827 2,088 2,001 4,
13 Table 6. Minnesota waterfowl breeding populations by species for Stratum I-III combined, expanded for area coverage but not for visibility, Year Species Dabblers: Mallard 160, , , , , , , ,416 82,472 72,843 76, ,411 78,368 80, ,245 96, , ,408 94,866 Black Duck Gadwall 3,515 4,740 5,733 6,482 13,670 4,951 3,400 12,635 3,752 8,064 5,298 5,075 3,616 3,677 5,191 4,941 6,643 2,703 3,989 American Wigeon 699 1, , , ,634 1, , ,911 Green-winged Teal ,613 1,564 1, Blue-winged Teal 45,495 47,788 36,106 60,288 37,706 91,982 46,759 94,152 48,394 38,328 29,407 40,777 37,286 32,742 61,772 49,779 27,194 31,979 33,484 Northern Shoveler 15,120 5,377 6,661 26,175 12,058 9,762 2,550 6, ,273 1,276 5,469 3,456 10,413 3,251 8,320 7,470 2,179 2,902 Northern Pintail 867 1,449 1, , Wood Duck 35,103 46,659 45,866 49,067 31,777 21,603 21,759 37,553 16,253 12,616 10,281 27,652 19,802 22,664 24,029 20,242 20,221 13,820 12,240 Dabbler subtotal 262, , , , , , , , , , , , , , , , , , ,115 Divers: Redhead 3,809 3,880 5,616 5,911 7,552 2,289 1,092 3,656 2, ,373 3,107 1,926 1,878 6,733 4,523 3,155 3,425 2,356 Canvasback 2,034 5,200 3,262 6,072 2,549 2,996 3,516 3, ,517 4,311 2,785 1,687 2,461 1,883 3,186 3,585 2,892 Scaup 31,138 28,416 14,041 32,376 15,743 13,016 5,117 30,906 12,397 1,971 1,894 14,854 12,571 3,299 9,283 2,686 11,919 6,517 10,870 Ring-necked Duck 9,913 7,986 6,060 18,565 14,768 16,542 5,294 15,675 13,829 12,085 4,525 43,169 22,501 8,579 22,523 13,495 16,795 15,265 10,915 Goldeneye 1,340 1,041 1,687 1,684 2,367 3,477 1,539 1,269 1,383 1,216 1, , , ,616 2,138 2,431 Bufflehead ,609 1,011 2, ,231 2,521 1,206 4, ,526 5, Ruddy Duck ,052 1, ,054 3,192 2,567 2,443 1, ,114 1, , ,045 Hooded Merganser 1,719 1,202 2,641 2,392 2,299 3,432 1,209 2,251 1,785 1, ,947 1,993 1,890 3,765 3,236 1,383 1,248 2,691 Large Merganser , Diver subtotal 51,293 59,181 35,031 67,173 46,396 66,937 22,942 63,186 36,487 21,253 14,675 74,741 47,746 20,521 55,170 28,146 43,980 38,291 34,400 Total Ducks 313, , , , , , , , , , , , , , , , , , ,515 Other: Coot 34,700 6,331 15,020 72,793 5,321 21,804 11, ,845 11,641 15,633 6,290 55,927 9, ,965 26,401 40,535 18,984 9,888 Canada Goose 60,449 79,147 80, ,932 89,418 78,200 87,663 98,339 83,384 75,688 98,316 70,311 67,473 66,085 60,603 87,193 94,235 63,857 90,887 Swan ,341 1,355 2,400 3,855 2,074 2,823 5,336 5,148 10,626 6,611 11,500 7,700 12,
14 Table 7. Mallard, blue-winged teal, and other duck (excluding scaup) populations in Minnesota, Mallard Blue-winged teal Other ducks (exc. scaup) Year Unad. PI VCF PI SE Unad. PI VCF PI SE Unad. PI VCF PI , ,701 61, ,141 41, , , ,789 45, ,871 34, , , ,945 31, ,343 30, , , ,470 42, ,218 29, , , ,158 49, ,895 34, , , ,832 53, ,292 33, , , ,826 39, ,169 38, , , ,774 45, ,375 34, , , ,806 89, ,607 39, , , ,164 37, ,187 18, , , ,781 28, ,923 22, , , ,704 28,668 46, ,167 62,226 39, , , ,957 22,312 50, ,616 40,571 47, , , ,844 16,402 64, ,258 23,835 30, , , ,527 17,078 42, ,167 34,503 32, , , ,762 15,419 42, ,980 20,809 32, , , ,149 24,065 89, ,821 33,286 40, , , ,908 32,935 90, ,607 33,369 35, , , ,598 30,384 68, ,338 28,204 38, , , ,289 23, , ,718 32,289 76, , , ,718 38, , ,532 39,512 81, , , ,968 26,508 90, ,760 39,834 88, , , ,059 26, , ,659 44, , , , ,953 28,832 91, ,138 42,057 93, , , ,870 43,621 93, ,679 53, , ,
15 Table 7. Cont. Mallard Blue-winged teal Other ducks (exc. scaup) Year Unad. PI VCF PI SE Unad. PI VCF PI SE Unad. PI VCF PI , ,838 31,103 64, ,070 36,307 82, , , ,455 66,240 70, ,256 82,580 85, , , ,433 48,124 47, ,043 40,531 66, , , ,816 53,461 57, ,913 64, , , , ,413 65,771 45, ,408 67,526 76, , , ,450 61,513 47, ,848 33,855 91, , , ,394 51,651 36, ,499 36,124 80, , , ,134 36,857 60, ,055 32, , , , ,560 39,541 37, ,742 19,631 91, , , ,625 46,264 91, ,934 87,312 92, , , ,517 34,556 46, ,269 36,176 46, , , ,313 57,591 94, ,209 56,539 95, , , ,500 28,595 48, ,125 37,358 46, , , ,715 24,230 38, ,674 60,353 42, , , ,481 30,020 29, ,588 20,055 30, , , ,565 27,787 40, ,359 24,157 99, , , ,436 36,539 37, ,262 32,155 62, , , ,884 33,940 32, ,261 27,430 55, , , ,329 49,845 61, ,584 88,720 79, , , ,965 45,057 49, ,607 31,971 60, , , ,239 58,463 27, ,927 46,635 68, , , ,996 55,366 31, ,640 24,089 51, , , ,229 37,498 33, ,615 56,787 46, ,330 Averages: 10-year 91, ,611 38,984 39, ,903 39,292 59, ,434 Long-term 102, ,204 37,701 57, ,356 42,065 60, ,
16 Table 7. Cont. Mallard Blue-winged teal Other ducks (exc. scaup) Year Unad. PI VCF PI SE Unad. PI VCF PI SE Unad. PI VCF PI % change from % -6% -20% -32% 5% 58% 66% 136% -10% 44% 29% 10-year average 4% -20% -17% -4% -16% 32% 14% 45% -23% 3% -17% Long-term average -8% -3% -10% -1% -42% 30% -21% 35% -24% 3% -16% 108
17 Table 8. Scaup, total ducks (excluding scaup), total ducks, and Canada goose populations in Minnesota, Scaup Total Ducks (exc. scaup) Total ducks Canada geese Year Unad. PI VCF PI Unad. PI PI Unad. PI PI Unad. PI VCF PI , , , , , , , , , , , , , , , , , , , , , , , , , , , , , , , , , , , ,580 1, , , , , , ,806 8, , , , , , ,257 5, , , , , , ,405 5, , , , , , ,616 7, , , , , , ,314 7, , , , , , ,364 4, , , , , , ,663 6, , , , , , ,220 10, , , , , , ,399 6, , , , , , ,219 11, , , , , , ,790 14, , , , , , ,328 16, , , , , , ,465 19, , , , , , ,864 29, , , , , , ,791 39, , , , , , ,669 1,021,606 51, , , , , , , ,761 58, ,
18 Table 8. Cont. Scaup Total Ducks (exc. scaup) Total ducks Canada geese Year Unad. PI VCF PI Unad. PI PI Unad. PI PI Unad. PI VCF PI , , , , , ,191 42, , , , , , ,083 1,127,262 33, , , , , , , ,921 43, , , , ,477 1,115, ,147 1,320,095 48, , , , , , , ,241 58, , , , , , ,204 1,062,408 60, , , , , , , ,971 60, , , , , , , ,612 79, , , , , , , ,465 80, , , , , , , , , , , , , , , ,267 89, , , , ,951 1,171, ,967 1,224,143 78, , , , , , , ,925 87, , , , ,673 1,008, ,579 1,099,250 98, , , , , , , ,791 83, , , , , , , ,801 75, , , , , , , ,575 98, , , , , , , ,758 70, , , , , , , ,245 67, , , , , , , ,124 66, , , , , , , ,685 60, , , , , , , ,610 87, , , , , , , ,463 94, ,
19 Table 8. Cont. Scaup Total Ducks (exc. scaup) Total ducks Canada geese Year Unad. PI VCF PI Unad. PI PI Unad. PI PI Unad. PI VCF PI , , , , , ,001 63, , , , , , , ,236 90, ,427 Averages: 10-year 7, , , , , ,705 76, ,312 Long-term 20, , , , , ,545 47, ,994 % change from % 44% 140% -10% 10% -8% 14% 42% 13% 60% 10-year average 40% 3% 46% -9% -9% -7% -7% 18% -16% 1% Long-term average -48% 3% -43% -21% -15% -23% -18% 92% -24% 0% 111
20 Appendix A. Temperature and precipitation at selected cities in, or adjacent to, Minnesota May Waterfowl Survey Strata, 3 May - 31 May 2015 (Source: Minnesota Climatological Working Group, Temperature (F) for week ending: 3-May 10-May 17-May 24-May 31-May Total weekly precipitation (inches) Region City Avg.1 Depart 2 Avg.1 Depart 2 Avg.1 Depart 2 Avg.1 Depart 2 Avg.1 Depart 2 3-May 10-May 17-May 24-May 31-May NW Crookston Itasca m m m m m m NC Grand Rapids Park Rapids WC Montevideo Morris C Willmar m m m m m m m m m m St. Cloud EC Aitkin m m m Msp Airport SW Marshall Worthington SC Waseca New Ulm 53.8 m 57.6 m 54.3 m 51.9 m 61.2 m Statewide Average temperature ( F) for the week ending on the date shown. 2 Departure from normal temperature. M=missing data. 112
21 Waterfowl information is taken from the U.S. Fish and Wildlife Service report Waterfowl Population Status, 2015 by Joshua Dooley, Kathy Fleming, Pamela Garrettson, Walt Rhodes, and Nathan Zimpfer. The entire report is available on the Division of Migratory Bird Management website ( Figure 1 Estimates of North American breeding populations, 90% confidence intervals, and North American Waterfowl Management Plan population goal (dashed line) for selected species and number of water areas in May in Prairie Canada and Northcentral U.S (from: U.S. Fish and Wildlife Service 2015). 113
22 May Ponds Figure 1 (continued). 114
 of Eastern Prairie Population")
23 Figure 2. Estimated numbers (and 95% confidence intervals) of Eastern Prairie Population (indicated pairs) Canada geese. (from: U.S. Fish and Wildlife Service 2015). 115
 in Minnesota.")
24 2015 MINNESOTA SPRING CANADA GOOSE SURVEY Rebecca Peak, Wetland Wildlife Populations and Research Group INTRODUCTION This report presents results from the fifteenth year of a spring helicopter survey of resident Canada geese (Branta canadensis) in Minnesota. Minnesota Department of Natural Resources (MNDNR) personnel developed the survey per a request from the Mississippi Flyway Council to produce a statewide population estimate having 95% confidence intervals (ci) that are within ± 25% of the estimate for this bird species. METHODS MNDNR Wetland Group staff initiated surveys for resident Canada geese in 2001 (Maxson 2002). Using the boundaries of the Prairie Parkland, Eastern Broadleaf Forest, Tallgrass Aspen Parklands, and Laurentian Mixed Forest provinces, they divided the state into 3 ecoregions (Aaseng et al. 2005). They combined the Eastern Broadleaf Forest and Tallgrass Aspen Parklands provinces to create the Transition ecoregion, renamed the Prairie Parkland province the Prairie ecoregion, and the Laurentian Mixed Forest province the Forest ecoregion (Figure 1). Maxson (2002) excluded the 7-county Metro area from the Transition ecoregion and Lake County, Cook County, and Boundary Waters Canoe Area from the Forest ecoregion. Using Public Land Survey quarter section boundaries and ArcView, Maxson (2002) assigned quarter sections of the remaining counties to the appropriate ecoregion, which yielded 304,929 quarter section plots (hereafter plots). From , they used a double sampling design. First, Maxson (2002) randomly selected 900 plots within each ecoregion, which yielded a sampling frame of 2,700 total plots (Table 1). Maxson (2002) used National Wetland Inventory Circular 39 data and DNR 1:24000 lakes GIS layers to stratify plots by habitat quality using the following classification variables: 1) total acres of type 3, 4, and 5 wetlands; 2) total acres of type 3 wetlands; total acres of 1:24000 lakes and; 4) total acres of riverine habitat. This sampling design yielded 9 strata (Table 1) defined by the expected number of pairs of resident Canada geese: 1) no nesting habitat expect no geese, 2) limited nesting habitat habitat capable of supporting 1 or 2 pairs of geese, 3) prime nesting habitat habitat capable of supporting 3 or more pairs. They did not survey plots in the 0 pairs strata and the Forest ecoregion 3 pairs habitat-quality stratum did not contain any plots (Table 1). They implemented the second part of the double sampling design by randomly selecting 30 plots from the remaining 5 strata to survey each season, for a sample size of 150 plots. Rave (2008) eliminated the double sampling design and randomly selected 30 plots per strata from the entire sampling frame excluding the 0 pairs strata (n = 128,031 plots; Table 1). He also excluded Lake of the Woods and the Northwest Angle from the Forest ecoregion. They used the same stratification criteria and field protocols to survey resident Canada geese for all years. Thus, results should be comparable among years. Rave (2011) further modified the sampling frame to include a binary stratification variable, which permitted a domain analysis of total geese in a proposed intensive harvest goose hunting zone (Figure 1). Using proportional allocation per strata, they randomly selected 30 plots in the proposed hunting zone and 130 plots from outside the zone for a total of 160 plots (Figure 1). The Intensive Harvest Zone that was used from to delineate boundaries for an August Canada goose conservation action and an increase in daily bag limit (10 geese daily) during the September Canada goose season was larger than the proposed zone used here (see Minnesota Waterfowl Hunting Regulations Booklet, 2013, 2014, 2015). However, we continue to use the proposed zone to monitor changes in goose numbers in a portion of the intensive harvest area. 116

25 Ideally, we fly the survey plots during mid-incubation. Pilot Tom Pfingsten and I conducted the survey on 8 days between April 2015, which are the average start and end dates for the past fourteen years. We recorded Canada geese seen within plot boundaries as singles, pairs, or groups. We also recorded whether singles and pairs were observed with a nest. To calculate total number of resident Canada geese, we doubled the number of singles and pairs. RESULTS AND DISCUSSION The analysis yielded a population estimate (± 95% CI) of 249,988 (± 61,291) resident Canada geese for the sampling frame. The 2015 resident Canada goose population estimate was comparable to estimates calculated for 2013 and 2014 (Table 2). Relative error (95% CI half-width) was 24.5% of the estimate. The large annual confidence intervals do not indicate differences between any years, but a general pattern indicates an increase in population size from 2001 to 2006 and then again from 2007 to 2012, with population declines in 2007 and 2013 (Figure 2). The population has been generally stable at a lower level the last 3 years. Canada goose population estimates were similar to 2014 in all 3 Ecoregions (Table 2). The 2015 population estimate (± 95% CI) in the proposed Intensive Harvest Zone (Fig. 1) was 79,945 (±22,032). This was similar to the estimates (± 95% CI) from for this zone: 151,669 (+105,319), 127,220 (+64,628), 79,701 (+24,619), and 93,600 (±54,300), respectively. An estimated 32% of these geese were associated with the Intensive Goose Hunting zone in 2015, compared to 43, 31, 32, and 38% from We added 17,500 geese for the Twin Cities metro area (Cooper 2004), which yielded a statewide population estimate of 267,488 resident Canada geese (Table 2). The 2015 statewide population estimate represents the fifteenth consecutive year that this estimate has been above the state Canada goose population goal of 250,000 resident Canada geese. Of the total number of Canada geese we detected, 38.5% were singles, 56.4% pairs, and 5.1% groups (Table 3). We combined singles and pairs associated with nests to develop an index to nesting effort and used it to calculate a productivity estimate of 41.6% (Table 3). The proportion of productive Canada geese for 2015 was comparable to the estimates for 2013 and 2014 (Table 3). Weather conditions throughout May and June were important factors affecting Canada goose productivity. Mean ambient temperature in Minnesota during April 2015 was 54.2 F, which was 3.4 F above the century average (National Oceanic and Atmospheric Administration 2015). Median lake ice-out date for 2015 was 12 April (17 March 30 April, n = 100), which was 6 days earlier than median lake ice-out date previously recorded across the state (median = 18 April, 29 March 12 May, n = 100) (Minnesota Department of Natural Resources 2015). Our goal was to survey plots during mid-incubation. The above average temperature and early lake ice out suggests many pairs should have been in the incubation stage of the nesting cycle when we conducted the survey. ACKNOWLEDGMENTS Chris Scharenbroich assisted in randomly selecting plots and provided GPS coordinates of plots to the pilot. Tom Pfingsten piloted the helicopter and served as the second observer. Dave Rave provided guidance on conducting surveys and historical context for the surveys. John Giudice provided statistical support. John Giudice, Jeff Lawrence, and Dave Rave reviewed an earlier version of this report. This project was funded in part by the Wildlife Restoration (Pittman-Robertson) Program. 117
26 LITERATURE CITED Aaseng, N., J. Almendinger, R. Dana, T. Klein, M. Lee, and D. Wovcha Field Guide to the Native Plant Communities of Minnesota. State of Minnesota, Department of Natural Resources. Cooper, J Canada goose program report Unpublished report. Maxson, S. J Minnesota Spring Canada goose Survey. Unpublished report. Division of Fish and Wildlife, Minnesota Department of Natural Resources, St. Paul, Minnesota Minnesota Department of Natural Resources (2015) Lake ice out dates. National Oceanic and Atmospheric Administration. National Centers for Environmental Information. Rave, D. P Minnesota Spring Canada goose survey. Pages in Dexter, M. H., editor Status of Wildlife Populations, fall Unpublished Report, Division of Fish and Wildlife, Minnesota Department of Natural Resources, St. Paul, Minnesota. 300 pp. Rave, D. P Minnesota Spring Canada goose survey. Pages in Dexter, M. H., editor Status of Wildlife Populations, fall Unpublished Report, Division of Fish and Wildlife, Minnesota Department of Natural Resources, St. Paul, Minnesota. 327 pp. 118
27 Table 1. Sampling frames used to conduct spring Canada goose surveys in Minnesota from (n = 2,700 plots) and (n = 304,929 plots). Ecoregion is the combination of provinces across the state. Strata are determined by type and acres (ac) of wetlands and rivers per quarter section plot. Ecoregion Strata National Wetland Inventory Data N plots in sample frame by period a b,c Prairie 0 pairs Type 3, 4, and 5 wetlands <0.5 ac and rivers <10.0 ac all water , pairs Type 4 and 5 wetlands >0.5 ac but type 3 <15.0 ac or type 3, 4, and 5 <0.5 ac and rivers ,751 >10.0 ac all water 3 pairs Type 3 >15.0 ac but plot not all water 80 9,533 Transition 0 pairs Type 3, 4, and 5 wetlands <1.0 ac and rivers <8.0 ac or plot all water , pairs Type 3, 4, and 5 wetlands ac or >25.0 ac, but type 3 <15.0 ac or type 3, 4, and ,048 5 <1.0 ac and rivers >8.0 ac 3 pairs Type 3, 4, and 5 wetlands >25.0 ac, but type 3 >15.0 ac and plot not all water 95 8,015 Forest 0 pairs Type 3, 4, and 5 wetlands <2.0 ac and rivers <2.0 ac or plot all water , pairs Type 3, 4, and 5 wetlands >2.0 ac but plot not all water or type 3, 4, and 5 <2.0 ac and ,666 rivers >2.0 ac 3 pairs None 0 0 Total 2, ,929 a -From , double-sampling was used to estimate stratum weights and the survey plots were randomly drawn from a sample of 900 plots in each Ecoregion. b -The entire sampling frame was re-stratified in 2008 and Lake of the Woods and the NW Angle were removed from the sampling frame. The sampling frame was adjusted slightly in 2009 because of some processing errors in The population estimates for are based on the updated sampling frame. c - From , a portion of the potential survey plots were in the original proposed intensive harvest goose hunting zone (Fig. 1). These included 9,674 of the 1-2 pair plots and 3,400 of the >3 pair plots in the Prairie Ecoregion and 5,777 of the 1-2 pair plots and 1,479 of the > 3 pair plots in the Transition Ecoregion. 119
28 Table 2. Population estimates of resident Canada Geese for prairie, transition, and forest ecoregions, ecoregions combined ± 95% confidence interval (CI), the seven-county Twin cities metro area, and the state of Minnesota, (n = 150 plots and n = 160 plots ). N geese by ecoregion Year Prairie Transition Forest Combined 95% CI Metro Statewide ,360 95,470 92, ,220 69,500 20, , , ,900 33, , ,286 20, , , ,290 56, ,230 78,428 20, , , ,609 95, , ,303 20, , , ,286 57, ,754 90,541 17, , , ,085 67, , ,436 17, , ,151 99,274 25, ,933 80,167 17, , , ,490 30, ,372 69,055 17, , , ,737 23, ,496 70,607 17, , , ,902 57, ,234 70,760 17, , , ,711 91, , ,814 17, , , , , , ,344 17, , ,907 91,652 54, ,602 73,122 17, , , ,438 27, ,123 77,836 17, , , ,986 37, ,988 61,291 17, ,
29 Table 3. Percent of singles, pairs, groups, and an index to nesting effort (i.e. productive Canada geese) on the Minnesota spring Canada goose survey, Year Singles a Pairs a Groups Productive Canada geese b Survey period /14 to 5/02/ /26 to 5/11/ /22 to 5/01/ /22 to 5/04/ /20 to 5/03/ /24 to 5/05/ /23 to 4/28/ /23 to 5/05/ /21 to 5/01/ /15 to 4/20/ /21 to 4/29/ /16 to 4/23/ /06 to 5/14/ /21 to 5/04/ /20 to 4/29/2015 a Singles and pairs were doubled before calculating proportions b Productive Canada geese = singles + pairs with nests 121
30 Figure 1. Location of 160 quarter section plots surveyed during the 2015 spring Canada goose survey. Plots are distributed among the Prairie, Transition, and Forest ecoregions. Cross-hatched areas were not included in the survey. The polygon delineated in red designates the location of the proposed Intensive Canada goose hunting zone in
31 Figure 2. Resident Canada goose population estimates (± 95% CI) in Minnesota (excluding Metro), The management goal is 250,000 Canada geese (250,000 17,500 Metro geese = 232,500). 123
. Figure 1.")
32 Mourning dove information is taken from the U.S. Fish and Wildlife Service report by Seamans, M.E Mourning dove population status, U.S. Department of the Interior, Fish and Wildlife Service, Division of Migratory Bird Management, Washington, D.C. 22 pp. The entire report is available on the Division of Migratory Bird Management web site ( ). Figure 1. Breeding and wintering ranges of the mourning dove (adapted from Mirarchi and Baskett 1994). (From: Seamans, M.E Mourning dove population status, U.S. Department of the Interior, Fish and Wildlife Service, Division of Migratory Bird Management, Washington, D.C. 22 pp.) 124
33 Figure 2. Mourning dove management units with 2014 hunting and non-hunting states. (From: Seamans, M.E Mourning dove population status, U.S. Department of the Interior, Fish and Wildlife Service, Division of Migratory Bird Management, Washington, D.C. 22 pp.) Figure 3. Estimates and 95% confidence intervals of mourning dove absolute abundance in the Central Management Unit (CMU), Estimates based on band recovery and harvest data. (From: Seamans, M.E Mourning dove population status, U.S. Department of the Interior, Fish and Wildlife Service, Division of Migratory Bird Management, Washington, D.C. 22 pp.) 125
34 Table 1. Preliminary estimates and 95% confidence intervals (CI, expressed as the interval half width in percent) of mourning dove harvest and hunter activity for the Central management unit during the 2012, 2013 and 2014 seasons a. (From: Seamans, M.E Mourning dove population status, U.S. Department of the Interior, Fish and Wildlife Service, Division of Migratory Bird Management, Washington, D.C. 22 pp.) Management unit / State Active Hunters Hunter Days Afield Total Harvest CENTRAL 338, , ,100 1,108,700 ±11 1,185,300±10 1,333,600 ± 9 6,361,600 ±14 6,236,000 ±11 7,654,700 ±10 AR 21,400 ±22 8,900 ±42 19,900 ±21 57,600 ±26 30,100 ±57 47,900 ±28 494,200 ±30 155,900 ±46 347,900 ±29 CO 17,000 15,600 14,400 43,800 36,900 27, , ,900 ±18 ±15 ±14 ±26 ±19 ±16 ±26 ±25 173,100 ±19 IA b 12,900 ±9 9,200 ±9 b 49,400 ±14 27,100 ±12 b 214, 300 ±16 130,000 ±13 KS 12,200 31,900 26,200 49,100 93,000 70, , ,400 ±39 ±12 ±10 ±52 ±16 ±14 ±62 ±18 485,300 ±18 MN 6,800 7,700 6,900 21,600 17,000 20,200 65,400 53,500 ±52 ±53 ±51 ±48 ±39 ±59 ±75 ±30 54,800 ±29 MO 23,800 36,400 24,100 51, ,500 62, , ,600 ±29 ±11 ±12 ±50 ±18 ±15 ±81 ±28 374,000 ±17 MT 200 1,700 1, ,900 2,900 2,600 12,000 ±87 ±46 ±42 ±120 ±41 ±41 ±161 ± 41 8,500 ±37 NE 13,200 13,500 9,700 39,000 39,300 26, , ,800 ±17 ±16 ±12 ±17 ±19 ±13 ±20 ±24 172,900 ±15 NM 9,000 6,500 7,600 38,000 23,700 24, , ,000 ±11 ±9 ±10 ±17 ±13 ±15 ±17 ±15 115,200 ±15 ND 4,900 6,300 3,900 17,400 16,400 11,900 78,900 88,200 ±30 ±28 ±25 ±36 ±29 ±30 ±37 ±37 47,600 ±23 OK 15,700 23,300 19,100 49,200 69,400 56, , ,200 ±14 ±13 ±13 ±19 ±24 ±24 ±26 ±25 417,900 ±21 SD 4,500 6,200 6,400 14,700 17,500 17,500 65, ,300 ±22 ±22 ±21 ±28 ±26 ±24 ±28 ±31 106,800 ±25 TX 207, , , , , ,300 4,150,800 3,506,700 ±13 ±13 ±10 ±16 ±16 ±13 ±20 ±18 5,199,400 ±14 WY 2,700 3,100 1,500 6,300 7,200 3,400 25,300 34,200 ±32 ±19 ±26 ±38 ±19 ±23 ±40 ±19 21,100 ±25 a Hunter number estimates at the Management Unit and national levels may be biased high, because the HIP sample frames are state specific; therefore hunters are counted more than once if they hunt in >1 state. Variance is inestimable. b No estimate available. 126
. Figure 1.")
35 American Woodcock information is taken from the U.S. Fish and Wildlife Service report American Woodcock Population Status, Cooper, T.R. and R.D. Rau. U.S. Fish and Wildlife Service, Laurel, MD. 16 pp. The entire report is available on the Division of Migratory Bird Management home page ( ). Figure 1. Woodcock management regions, breeding range, singing-ground survey coverage, (from: Cooper, T.R. and R.D. Rau American woodcock population status, U.S. Fish and Wildlife Service, Laurel, MD. 16 pp.). 127
36 Table 1. Short term ( ), 10 year ( ), and long-term ( ) trends (% change per year a ) in the number of American woodcock heard during the Singing-ground Survey as determined by using the hierarchical log-linear modeling technique (Sauer et al. 2008) (from: Cooper, T.R. and R.D. Rau American woodcock population status, U.S. Fish and Wildlife Service, Laurel, MD. 16 pp.). Management Unit/State Number of Routes b n c % Change 95% CI d % Change 95% CI d % Change 95% lower upper lower upper lower CI d upper CENTRAL IL IN MB e MI MN OH ON WI a Median of route trends estimated used hierarchical modeling. To estimate the total percent change over several years, use: 100(% change/100+1) y )-100 where y is the number of years. Note: extrapolating the estimated trend statistic (% change per year) over time (e.g., 30 years) may exaggerate the total change over the period. b Total number of routes surveyed in 2015 for which data were received by 5 June, c Number of routes with at least one year of non-zero data between 1968 and d 95% credible interval, if the interval overlaps zero, the trend is considered non-significant. e Manitoba began participating in the Singing-ground survey in
37 Figure 2. Weighted annual indices of American woodcock recruitment, Dashed line is the average. (from: Cooper, T.R. and R.D. Rau American woodcock population status, U.S. Fish and Wildlife Service, Laurel, MD. 16 pp.). Figure 3. Annual indices of the number of woodcock heard on the Singing-ground Survey, The dashed lines represent the 95 th percentile credible interval. (from: Cooper, T.R. and R.D. Rau American woodcock population status, U.S. Fish and Wildlife Service, Laurel, MD. 16 pp.). 129
38 Table 2. Preliminary estimates of woodcock hunter numbers, days afield, and harvest for selected states, from the , , and Harvest Information Program surveys. (from: Cooper, T.R. and R.D. Rau American woodcock population status, U.S. Fish and Wildlife Service, Laurel, MD. 16 pp.). Management Unit / State Active woodcock hunters ( a ) Days afield ( a, c ) Harvest ( a, c ) Central Region n.a. b n.a. b n.a. b n.a. b 350,500 ± ,900 ± ,100 ± ,600 ± ,700 ± ,100 ± ,600 ± ,500 ± 23 IL 2,900 ± ± 175 1,600 ± ± 169 8,800 ± 131 3,500 ± 172 3,400 ± 119 2,600 ± 162 3,700 ± 195 1,900 ± 160 1,000 ± ± 132 IN 1,100 ± ± ± ± ,100 ± 86 1,500 ± 122 1,600 ± ± ,800 ± ± 84 1,400 ± ± 43 MI 28,400 ± 15 25,700 ± 17 30,000 ± 19 19,400 ± ,000 ± ,400 ± ,700 ± 24 87,500 ± ,900 ± 28 74,100 ± 28 79,300 ± 28 53,500 ± 29 MN 17,000 ± 29 11,200 ± 36 10,900 ± 37 13,500 ± ,900 ± 46 40,400 ± 34 74,700 ± 62 47,500 ± ,200 ± 42 31,000 ± 59 18,600 ± 57 23,900 ± 45 OH 3,100 ± ± 115 3,000 ± 63 1,600 ± ,200 ± 96 2,600 ± 83 8,600 ± 64 4,500 ± ,300 ± 74 1,500 ± 80 8,600 ± ± 90 WI 15,200 ±25 13,700 ± 28 14,500 ± 27 16,200 ± 25 69,000 ± 30 58,000 ± 33 60,000 ± 31 66,400 ± ,600 ± 31 40,400 ± 37 38,400 ± 24 49,300 ± 45 a All 95% Confidence Intervals are expressed as a % of the point estimate. b. Regional estimates of hunter numbers cannot be obtained due to the occurrence of individual hunters being registered in the Harvest Information Program in more than one state. c. Days afield and Harvest estimates are for the entire 18 state Central Region. 130
 does not include zero in the 95% credible interval, while a non-significant (NS) trend does include zero. (from: Cooper, T.R. and R.D. Rau. 2015.")

39 Figure 4. Ten-year trends in number of American woodcock heard on the Singing-ground Survey; , as determined by the hierarchical modeling method. A significant trend (S) does not include zero in the 95% credible interval, while a non-significant (NS) trend does include zero. (from: Cooper, T.R. and R.D. Rau American woodcock population status, U.S. Fish and Wildlife Service, Laurel, MD. 16 pp.). Figure 5. Long-term trends in number of American woodcock heard on the Singing-ground Survey; , as determined by the hierarchical modeling method. A significant trend (S) does not include zero in the 95% credible interval, while a non-significant (NS) trend does include zero. (from: Cooper, T.R. and R.D. Rau American woodcock population status, U.S. Fish and Wildlife Service, Laurel, MD. 16 pp.). 131
 breeding population survey in northwest Minnesota during 2012-2015.")
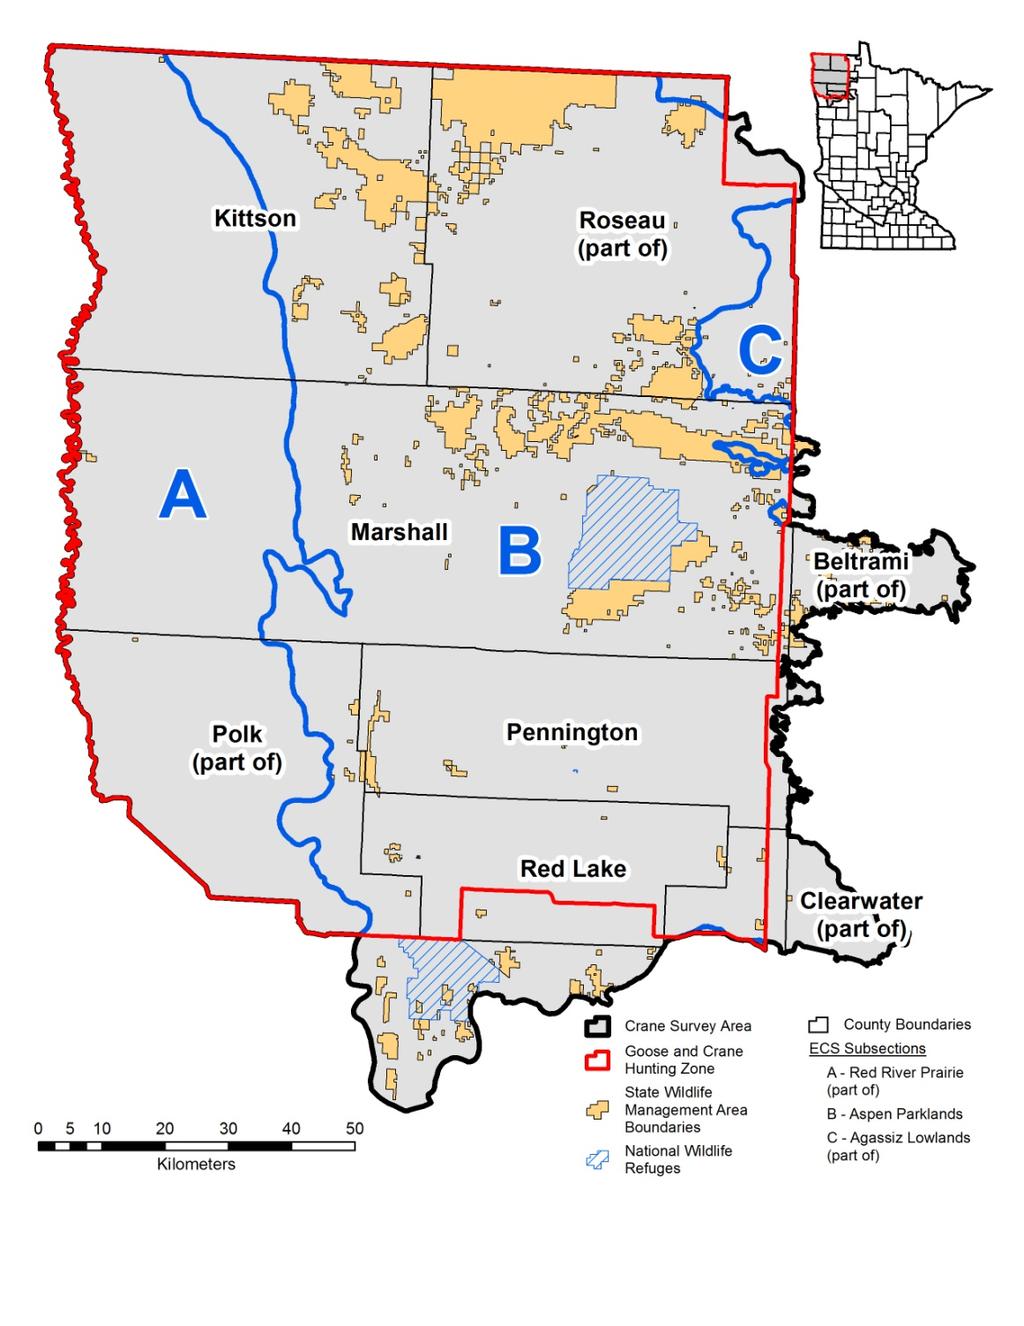
40 2015 NORTHWEST MINNESOTA SANDHILL CRANE BREEDING GROUND SURVEY Jeffrey S. Lawrence, Wetland Wildlife Populations and Research Group; John H. Giudice, Biometrics Unit Robert G. Wright, Minnesota Information Technology Services SUMMARY We conducted an annual sandhill crane (SACR, Grus canadensis) breeding population survey in northwest Minnesota during After the first year of the survey, we excluded the portion of the Red River Prairie Ecological Classification System (ECS) Subsection from the survey area due to low crane numbers in the agricultural landscape. We used 4 km 2 plots as the primary sampling unit. In 2015, we used a split-panel design and surveyed 129 plots: 69 plots that we surveyed in 2012 were revisited and a spatially balanced sample of 60 new plots selected using a generalized random-tessellation stratified (GRTS) design. We surveyed each sample plot once during May using a Bell OH-58 helicopter with a 2- person crew. We counted and classified all crane observations in each plot based on their social status (individuals, pairs, groups) and evidence of breeding status (e.g., nest, colts, territorial behavior). We estimated that there were 7,265, 5,550, and 2,285, and 4,845 SACR in the area of Aspen Parklands and some adjacent areas within the Northwest Goose and Crane Zone (NWGCZ) that was consistently surveyed in all 4 years ( ). Habitat conditions were different with dry conditions in 2012 and wet conditions in Survey conditions were very dry at the beginning of the survey in 2013 and 2015, but major precipitation events resulted in wet conditions for the majority of the survey. We believe that timing of the survey and arrival of nonbreeding cranes on the breeding grounds may have influenced the counts in 2014 and INTRODUCTION SACR in northwest Minnesota are part of the Mid-Continent Population (MCP), which is hunted in Canada and several Central Flyway states (Central Flyway Webless Migratory Bird Technical Committee 2006). In 2010, Minnesota began a hunting season on SACR in the NWGCZ (Figure 1). The majority of MCP SACR harvest in other states and provinces occurs on migration, staging, and wintering areas (Krapu et al. 2011); however, in northwestern Minnesota, harvest is comprised of locally-breeding cranes and likely migrant cranes from other MCP breeding areas. We previously reviewed the history and status of SACR and the hunting season (Lawrence et al. 2012). There were some indications that harvest of Minnesota-breeding SACR was greater than expected (Lawrence et al. 2011); thus, in 2012, we initiated a pilot survey of breeding SACR in northwestern Minnesota. When we began the survey, there was no template for a large-scale, aerial survey specifically designed for breeding SACR. Thus, we proposed conducting a pilot survey for three years to provide sufficient information for making intelligent survey-design choices, including developing and evaluating a stratification scheme (e.g., Zicus et al. 2008), answering questions about bias-precision-cost tradeoffs (e.g., Giudice et al. 2010), and identifying important sources of variation in estimates of abundance and population trends (Thompson et al. 1998:149). The survey was designed to provide an estimate of the number of breeding cranes in northwest Minnesota that was within ±25% of the true population size with 90% certainty (i.e., if we could replicate the sample survey many times, 90% of the population estimates will be within ±25% of the true population size). In 2012, we stratified 4 km 2 plots in the NWGCZ and adjoining Aspen Parkland Habitat based upon amount of expected crane nesting habitat in each plot (Lawrence et al. 2012), and surveyed 60 plots in more likely crane nesting habitat, mostly associated with the Aspen Parkland, (Figure 2) and 30 plots in less likely habitat, which was mostly associated with the Red River Valley. We also surveyed one 100- km 2 plot in an area with previous records of nesting cranes. We did not survey plots that were not expected to have any cranes. For the second and third years of this pilot survey, we used results from 132
41 2012 to modify the survey area and focus on parkland habitat where most of the breeding cranes were detected. The breeding population size estimates obtained from this survey, combined with data on crane harvest, harvest derivation, and other parameters will allow us to better manage harvest of cranes in northwest Minnesota and may provide insights to hunting cranes in other portions of their breeding range. The survey design will also provide the potential to monitor breeding crane populations in other areas, e.g. east-central Minnesota. Here, we describe the survey sampling scheme used in , present population estimates for the 4 years, and discuss future survey plans. STUDY AREA In 2012, we selected the NWGCZ and portions of the Aspen Parklands ecological subsection that extended beyond the NWGCZ as our primary sampling frame (Figure 2). This included the Aspen Parklands ecological subsection, northwestern portions of the Red River Prairie subsection, and a small portion of the Agassiz Lowlands subsection. Beginning in 2013, we reduced the size of the survey area to only include plots in the Aspen Parkland ECS subsection and the small area of Agassiz Lowland subsection that was within the NWGCZ. We did not survey any plots in the Red River Prairie ECS subsection because the likelihood of finding nesting cranes in this area was low (Lawrence et al. 2013). METHODS Sampling frame We used ArcGIS 10.2 (Environmental Systems Research Institute, Redlands, CA) to develop an overlay grid of 4-km 2 plots for the northwestern Minnesota study area (Figure 2). The grid was rotated approximately 2.5 degrees to orient it with Public Land Survey (PLS) based features such as roads and property boundaries. We treated 4-km 2 plots as the primary sampling unit (PSU) and in 2012 excluded any PSUs not located entirely within the boundary of the SACR survey area (Figure 2). In 2012, we also non-randomly selected a 100-km 2 plot, approximately overlaying Espelie Township (EspTwp) in eastern Marshall County, based on previous crane work by DNR staff (S. Maxson, unpublished DNR files). Beginning in 2013, we excluded the Red River Prairie survey area because first year results indicated that few breeding cranes used this area in May (Figure 3). We also included any PSUs on the border of the survey area where >50% of the plot was located within the boundary of the survey area rather than just PSUs that were located entirely within the survey area. Sampling design Details of sampling design for previous years are contained in previous reports (Lawrence et al. 2012, 2013, and 2014). We used descriptions of crane nesting habitat in northwest Minnesota (DiMatteo 1991, Provost et al. 1992, Maxson et al. 2008) and National Land Cover Data (NLCD; Fry et al. 2011) to identify potential crane habitat. NLCD is a Landsat-based land cover database created by the Multi- Resolution Land Characteristics (MRLC) Consortium, a partnership of Federal agencies led by the U.S. Geological Survey (USGS National Land Cover Database). We used NLCD (30 m cell resolution) to quantify the amount (m 2 ) of potential SACR habitat in each 4-km 2 plot. We defined SACR nesting habitat as NLCD cover class 95 (emergent herbaceous wetland) and other SACR habitat as NLCD cover classes 11 (open water) and 90 (woody wetlands). In 2012, we classified each 4-km2 plot into one of 4 categories: Stratum 1 (NLCD-1): > median amount of nesting habitat, Stratum 2 (NLCD-2): 0 < m2 of nesting habitat < median, Stratum 3 (NLCD-3): nesting habitat = 0 but other SACR habitat > 0, or 133
42 Stratum 4 (NLCD-4): no SACR habitat. We selected 60 plots from Stratum 1 and 2 combined and 30 plots from Stratum 3. We assumed that SACR density in the NLCD4 stratum was very low (approaching zero) and did not sample Stratum 4. We also surveyed a 100 km 2 plot (25 plots) generally overlaying Espelie Township to better understand distribution of cranes within good nesting habitat. In 2013 and 2014, we used the GRTS design to select 115 plots from all plots with potential crane habitat with no stratification (i.e. Strata 1, 2, and 3 combined). We also recalculated the 2012 estimates based upon the 2013 sample frame. In 2015, we modified the sampling design to provide a more powerful measure of change. Specifically, we employed a split-panel sampling design (Warren 1994, Urquhart and Kincaid 1999) that consisted of 69 revisit plots and 60 new plots (Figure 3). Revisit plots were originally selected and surveyed in 2012, and consisted of 58 stratum 1-2 plots, 6 stratum 3 plots, and 5 randomly-selected plots of the original 25 Espelie Township plots. The new plots were drawn from the remaining 2,884 stratum 1, 2, and 3 plots in the reduced sampling frame using a spatially balanced simple random sampling design. We treated the 2 panels as strata, with inclusion probabilities = 1 for plots in the revisit stratum, and used the GRTS design-based estimator (Kincaid and Olsen 2013) to compute sampling statistics and estimates of population size. We also used a mixed-model framework to generate model-assisted estimates of total and breeding SACR abundance during 2012 to We used plot counts as our response variable and the model contained fixed effects for strata and random effects for year and plot. We fit the model using the lme4 package (Bates et al. 2014) in R (R Core Team 2014). We weighted the predicted mean count for each stratum and year by stratum weights and multiplied by N (sampling frame size) to obtain modelassisted population estimates. We used a bootstrap procedure to obtain confidence intervals for the model-assisted population estimates. More specifically, we bootstrapped 200 sample datasets using withreplacement sampling of plots from each stratum and year, and then refit our mixed model to each bootstrap dataset to generate 200 population estimates for each year and target population (total and breeding SACR). We used the distribution of bootstrapped population estimates to compute percentile confidence intervals (90% CI). Because we only had 2 years (2012 and 2015) where our sample of revisit plots were surveyed, we did not attempt to include a slope parameter for year in our mixed model (i.e., to quantify the population trend). Instead, we treated revisit plots as a paired sample and compared mean change in plot counts and naïve occupancy between 2012 and 2015, which correspond to the first and last years in our time series. Target population(s) In all years, separating breeding and non-breeding components of the population was problematic. We recorded crane observations as singles, pairs, and groups. Groups of SACR likely contain mostly non-breeders (subadults, non-territorial adult birds, and, possibly, failed breeders), whereas the breeding status of singles and pairs is more difficult to determine (Hayes and Barzen 2006). Therefore, for the purposes of this survey, we classified crane observations as follows: 1. Breeding birds = singles or pairs that were observed with a nest or young, or birds that were suspected of having a nest or young (but it was not detected) based on their behavior (e.g. reluctance to fly or leave the area, broken-wing displays). 2. Groups = flocks of >3 cranes. 3. Status unknown = singles or pairs whose breeding status could not be determined (e.g., nest or young was not detected, and did not exhibit any territorial or defense behavior). For population estimates, we considered doubling observations of single breeding birds (e.g., similar to indicated pairs in waterfowl surveys), but this could result in a positive bias for the estimate of breeding birds. For example, if single breeding birds were truly paired and their mate was missed (not detected) because it was located off the survey plot, then the missed mate is accounted for when we expand the counts for sampling (i.e., it is not necessary to double the observed count). Conversely, if the mate was on the plot but was not detected, 134
43 then doubling the observed count is equivalent to applying a sightability correction factor = 2 for single crane observations. In reality, both cases likely occurred and we could not distinguish between them. Therefore, we used a conservative approach when estimating population size by taking observations of single birds at their face value (i.e., count = 1) regardless of their breeding status. Survey procedures The survey was conducted during mid-may, which is the peak incubation period for cranes in northwest Minnesota (DiMatteo 1991, Provost et al. 1992, Maxson et al. 2008). All plots were surveyed using Bell OH-58 [Jet Ranger] helicopter containing a pilot and one observer. Plots were surveyed 5-45 meters above ground level at km/hr, depending upon the land cover. In 2015, we used DNRSurvey ver. 2.11, an ArcGIS addin developed by Minnesota DNR Wildlife and MN.IT Services GIS staff. RESULTS Survey effort The 2015 survey was conducted on 5 days (5, 6, 12, 20, and 21 May) during a 17-day period. We averaged 26 plots/day (range: 11-38). The survey timing (Figure 4) almost encompassed the range of previous surveys and started 2 days earlier than other years (5 May) but ended only 2 days before our latest survey end date in The survey team (DNR pilot Brad Maas and observer Jeff Lawrence) spent an average of 9 min surveying each plot (range: 2 19 min), about 2 minutes longer that the in 2013 and 2014, and 1 minute shorter than in 2012 (Table 1). Sampling statistics We detected SACR on 64 (50%) of the 129 sample plots in 2015 compared to 32% in 2014 and approximately 45% in 2012 and 2013 (Table 2). Cranes were observed on 58% of the 60 randomly-selected plots in The average count per 'occupied' plot (>=1 SACR observed) was 2.8 birds, which was similar to last year's mean (2.4) but less than the conditional mean plot count in 2012 (4.9) and 2013 (4.4). In 2015 we counted 175 SACR on sample plots, of which 59% were pairs, 27% were singles, and 13% were in groups (Table 3). We observed 5 groups on sample plots, which ranged in size from 3 to 8 birds. We saw relatively more grouped SACR in 2012 (37% of cranes observed) and 2013 (42%) than in (15% and 13%, respectively; Table 3b). About 22% of observed pairs and singles exhibited some evidence of being breeding birds, which was lower than previous years (Table 3). In 2015 we detected 20 nests, similar to the 20 nests each in and 17 nests in Population estimates and distribution The estimated total number of cranes in the survey area in 2015 was 4,835 (90% CI: 3,516-6,153), which was similar to the 2013 estimate (5,547; 90% CI: 3,582-7,511) and greater than the 2014 estimate (2,285; 90% CI: 1,716-2,855; Table 4). These are minimum estimates because we did not adjust for detection probabilities (which are likely <1, at least for singles and pairs in dense cover). If our sample of singles and pairs exhibiting breeding behavior was representative, then the estimated total number of breeding SACR in the survey area in 2015 was 1,069 (90% CI: 674-1,465), which again was similar to the 2013 estimate (950; 90% CI: 691-1,210) and greater than the 2014 estimate (591; 90% CI: ; Table 4). The number of estimate breeding and unknown status (single and paired) cranes was similar in 2012 and 2015 (Figure 5). A model-assisted analysis of the survey data suggested population estimates from 2014 were likely biased low (Figure 6). In both cases (design-based vs. model-assisted estimates) the estimated mean annual change in IBB and total birds during was approximately -14% and -17%/yr, respectively. However, in all cases the slope of the trend line was not significantly different from zero (t-tests, P > 0.25). The lack of statistical significance in this case is not unexpected given we only have 4 data points (years). A more powerful metric of change is a comparison of the 69 plots surveyed in 2012 and 2015 (i.e., revisit plots). The number of single cranes observed on these plots was the same in 2012 and 2015 (n = 24 in each year), but the number of pairs declined from 43 to 22 and the number of birds in groups declined from 73 to 8. On average, we counted and fewer IBB/plot and total SACR/plot, respectively, in 2015 compared to 135
44 2012. These differences were statistically significant in both cases (paired t-tests, df = 68, P <= 0.025). In terms of naive occupancy (probability of observing >=1 SACR probability of detection=1), 67% of revisit plots did not change state from 2012 to 2015, but 22% changed from occupied to unoccupied and only 12% changed from unoccupied to occupied. Thus, there was a net decrease in naive probability of occupancy from 0.53 (90% CI: ) in 2012 to 0.39 (90% CI: ) in Habitat associations The relationships between SACR plot counts ( ) and remote-sensing habitat metrics were very weak (Figure 7). Conversely, the probability of observing >=1 SACR was positively associated with the amount of nesting cover in the plot (Figure 8). DISCUSSION Survey effort and design considerations In 2015, conditions started similar to 2012 (similar start date, drought conditions). In 2012, drought conditions persisted. In 2015, significant rainfall on May changes conditions to very wet with flooded basins and standing waters in some fields. This was similar to the change in habitat conditions we observed in Spring phenology has varied each year, too. We had record early spring phenology in 2012, very late phenology in 2013 and 2014, and closer to average phenology in We have tried to time the survey for peak crane nest incubation, but these annual changes have made this difficult. Timing of the SACR survey may be critical to getting consistent results. Population estimate The number of indicated breeding cranes (IBB) and total cranes have shown a downward trend during the 4- year period we have conducted surveys, but some of this decline may be due to other factors such as survey timing and habitat conditions. The number of breeders and unknown cranes (singles and pairs) was approximately 4,100 in both 2012, the year of the highest population count, and The model-assisted estimate suggests that the 2014 count was biased low, but additional years of data may be necessary to better understand this annual variation. The most powerful measure of change in crane numbers was the decline in the number of cranes observed on same plots between 2012 and Cranes have strong philopatry to their nesting territories (Krapu et al. 2011, Gerber et al. 2014), and we would expect similar numbers of IBB on the same plots if populations were stable. However, other factors influencing recruitment (e.g. flooded nests due to heavy precipitation in 2015) may influence the number of cranes seen on these plots. In addition, we recorded the same numbers of singles on these plots. Most singles are assumed to have a nesting mate nearby that was either undetected on the plot or off plot. The number of pairs on these plots in 2015 (n=22) was about ½ the number in 2012 (n=43), but we suspect many pairs have not started breeding yet. Cranes in groups have been included in our population estimates, yet the uneven distribution of groups makes them difficult to survey using the plot based design. In addition, plot data and anecdotal evidence suggests that groups were not present in large numbers on the northwest Minnesota breeding grounds when we conducted the survey in 2014 and The low number of groups observed in 2015 suggests that many nonbreeders had not yet returned to the breeding grounds and this may apply to nonbreeding pairs, too. We will continue to report the total breeding population including groups, yet the 4 breeding ground surveys conducted to date suggest that return dates for the nonbreeding component of the crane population may be highly variable. Cranes in groups, some cranes in pairs, and likely a few singles would comprise the nonbreeding component of the population. While the number of nonbreeding pairs returning in May maybe variable, we believe the total number of cranes observed as singles and pairs will provide the most reliable measure of the crane population in Northwest Minnesota. We plan to conduct the survey again in May
45 ACKNOWLEDGMENTS This project was funded by a grant from the U.S. Fish and Wildlife Service Webless Migratory Bird Program ( ) and the Minnesota Department of Natural Resources ( ). Special thanks to DNR pilots Brad Maas, who flew the survey in 2015 and John Heineman, who flew in They both did an exceptional job flying the helicopter and helping with the survey during all 3 years. Chris Scharenbroich prepared maps for the survey. LITERATURE CITED Bates, D., M. Maechler, B. M. Bolker, and S. Walker lme4: linear mixed-effects models using Eigen and S4.R package version < Central Flyway Webless Migratory Bird Technical Committee Management Guidelines for the Mid- Continent Population of Sandhill Cranes. Special Report in files of the Central Flyway Representative. Denver, Colorado. DiMatteo, J. J Biology of greater sandhill cranes of Agassiz National Wildlife Refuge, Marshall County, Minneosta. M.A. Thesis, St. Cloud State University. 181 pages. Fry, J., Xian, G., Jin, S., Dewitz, J., Homer, C., Yang, L., Barnes, C., Herold, N., and Wickham, J., Completion of the 2006 National Land Cover Database for the Conterminous United States, Photogrammetric Engineering & Remote Sensing, Vol. 77(9): Gerber, Brian D., James F. Dwyer, Stephen A. Nesbitt, Rod C. Drewien, Carol D. Littlefield, Thomas C. Tacha and Paul A. Vohs Sandhill Crane (Grus canadensis), The Birds of North America Online (A. Poole, Ed.). Ithaca: Cornell Lab of Ornithology; Retrieved from the Birds of North America Online: Giudice, J. H., J. R. Fieberg, M. C. Zicus, D. P. Rave, and R. G. Wright Cost and precision functions for aerial quadrat surveys: a case study of ring-necked ducks in Minnesota. Journal of Wildlife Management 74: Hayes, M. A., and J. A. Barzen Dynamics of breeding and non-breeding cranes in south-central Wisconsin. Passenger Pigeon 68: Kincaid, T. M., and A. R. Olsen spsurvey: spatial survey design and analysis. R package version 2.6. < Krapu, G. L., D. A. Brandt, K. L. Jones, and D. H. Johnson Geographic distribution of the Midcontinent Population of sandhill cranes and related management applications. Wildlife Monograph 175:1-38. Lawrence, J. S., G. A. Knutsen, and J. H. Giudice Webless Migratory Game Bird Program Request for Proposals FY12, Estimating numbers of breeding sandhill cranes in northwest Minnesota. Unpublished funding proposal submitted to U.S. Fish and Wildlife Service. 21 pages. Lawrence, J. S., J. H. Giudice, G. A. Knutsen, and R. G. Wright Estimating numbers of breeding sandhill cranes in northwest Minnesota Pages in Dexter, M. H., editor Status of Wildlife Populations, fall Unpublished Report, Division of Fish and Wildlife, Minnesota Department of Natural Resources, St. Paul, MN Lawrence, J. S., J. H. Giudice, G. A. Knutsen, and R. G. Wright Estimating numbers of breeding sandhill cranes in northwest Minnesota Pages in Dexter, M. H., editor Status of Wildlife Populations, fall Unpublished Report, Division of Fish and Wildlife, Minnesota Department of Natural Resources, St. Paul, MN 137
46 Lawrence, J. S., J. H. Giudice, G. A. Knutsen, and R. G. Wright Estimating numbers of breeding sandhill cranes in northwest Minnesota Pages in Dexter, M. H., editor Status of Wildlife Populations, fall Unpublished Report, Division of Fish and Wildlife, Minnesota Department of Natural Resources, St. Paul, Minnesota. 328 pp. Maxson, S. J., J. R. Fieberg, and M. R. Riggs Sandhill crane nest habitat selection and factors affecting nest success in northwestern Minnesota. Proceedings of the North American Crane Workshop 10: Provost, J. L., T. A. Provost, S. J. Maxson, and R. D. Crawford Breeding biology of greater sandhill cranes on the Roseau River Wildlife Management Area, Minnesota. Proceedings North American Crane Workshop 6: R Core Team R: A language and environment for statistical computing. R Foundation for Statistical Computing, Vienna, Austria. < Stevens, D. L., Jr. and A. R. Olsen Spatially balanced sampling of natural resources. Journal of American Statistical Association 99: Thompson, W. L., G. C. White, and C. Gowan Monitoring vertebrate populations. Academic Press, New York, New York, USA. Urquhart, N. S., and T. M. Kincaid Designs for detecting trend from repeated surveys of ecological resources. Journal of Agricultural, Biological, and Environmental Statistics 4: Warren, W. G The potential of sampling with partial replacement for fisheries surveys. ICES Journal of Marine Science 51: Zicus, M. C., D. P. Rave, J. R. Fieberg, J. H. Giudice, and R. G. Wright Distribution and abundance of Minnesota breeding Ring-necked Ducks Aythya collaris. Wildfowl 58:
47 Table 1. Survey effort (minutes) by activity for an aerial survey of sandhill cranes in Minnesota, May Survey Duration Year Design a n plots Start date End date Calendar days Survey days Total flight hrs Plots/ day Minutes/ plot 2012 GRTS-ST May 15-May GRTS-SRS May 23-May GRTS-SRS May 16-May SP12-GRTS May 21-May a -GRTS-ST3: generalized random-tessellation stratified with 3 strata; GRST-SRS: generalized random-tessellation stratified, simple random sample, SP12-GRTS: repeat 2012 Aspen Parkland plots, generalized random-tessellation stratified, simple random sample for remainder of plots Table 2. Sampling statistics a for an aerial survey of sandhill cranes in northwestern Minnesota, May Counts/occupied plot Sampling Year Strata allocation b n N srate n.occ p.occ min max med mean SE ~Optimal 115 3, SRS 115 2, SRS 115 2, SP-SRS 129 2, a n = sample size (4-km 2 plots), N = stratum size, srate = sampling rate, n.occ = number of occupied plots (>1 sandhill crane detected), p.occ = proportion of plots with >1 crane detected, and count statistics for occupied plots. b SRS = simple random sample, SP-SRS=Split plot-simple random sample. 139
48 Table 3. Social and breeding classification of sandhill crane observations, n by year Proportion by year Proportion of singles of pairs Social Class a Pairs (x2) Breeding birds Status unknown Singles Breeding birds Status unknown Groups Total a - Breeding birds = singles or pairs that were observed with a nest or young, or birds that were suspected of having a nest or young (but it was not detected) based on their behavior (e.g. reluctance to fly or leave the area, broken-wing displays); Groups = flocks of >3 cranes; or status unknown = singles or pairs whose breeding status could not be determined (e.g., nest or young was not detected, and did not exhibit any territorial or defense behavior). 140
49 Table 4. Population estimates (N) by indicated breeding status for sandhill cranes in northwestern Minnesota, May Year Survey Area Status Plots surveyed Total plots n plots with cranes Minimum cranes/plot Maximum cranes/plot Avg. birds/plot SE birds/plot ^ N SE LCB (90%) UCB (90%) CV % 2012 With Red Breeding birds b 115 3, , ,014 1, River Valley Groups 115 3, ,013 1, , Status unknown c 115 3, , ,069 3, Total 115 3, ,211 1,818 4,220 10, a Without Red Breeding birds b 2,953 1, ,857 River Valley Groups 2,953 3,100 1, ,742 Status unknown c 2,953 2, ,052 3,446 Total 2,953 7,264 1,885 4,163 10, Without Red Breeding birds b 115 2, , River Valley Groups 115 2, ,311 1, , Status unknown c 115 2, , ,763 2, Total 115 2, ,547 1,194 3,582 7, Without Red Breeding birds b 115 2, River Valley Groups 115 2, Status unknown c 115 2, , , Total 115 2, , ,716 2, Without Red Breeding birds b 129 2, , , River Valley Groups 129 2, , Status unknown c 129 2, , ,245 3, Total 129 2, , ,516 6, a 2012 data adjusted to reflect sampling frame. b Singles and pairs (x2) with a nest or young, or exhibiting some type of breeding or territorial behavior. c Singles and pairs (x2) without a nest or young, and no behavioral evidence that they were breeding birds. 141
50 142
, turquoise = NLCD-2 (0 < potential nesting")
.")
51 Figure 2. Sampling frame for the spring aerial survey of sandhill cranes, northwestern Minnesota. The primary sampling unit was 4-km 2 plots. Colored squares denote plots by strata as defined by National Land Cover Data: dark blue = NLCD-1 (>median amount of potential crane nesting cover [PNC]), turquoise = NLCD-2 (0 < potential nesting cover < median), gray = NLCD-3 (no nesting cover but other potential crane cover), white = NLCD-4 (no crane habitat). Black lines denote the boundaries of the survey area and blue lines note boundaries of ecological subsections. In 2012, we selected plots from strata 1-3 in the 3 subsections above (see text). After 2012, we excluded plots in the Red River Prairie ECS subsection (A above) and did not survey the 100-km 2 plot. Also, note there were additional plots on the edge of the survey area after
52 Figure 3. Distribution of sample plots (n = 129) and sandhill crane observations by type in the 2015 MNDNR spring aerial survey, northwestern Minnesota. Each sample plot was 4 km2 and the SACR survey area was 11,812 km2. 144


53 Figure 4. Number of plots surveyed by calendar date during the Northwestern Minnesota Sandhill Crane breeding population survey, plots were flown each year from 2012 to 2014 and 129 were flown in Figure 5. Number of cranes by social grouping in the Aspen Parklands survey area of northwestern Minnesota,
2016 WATERFOWL BREEDING POPULATION SURVEY MINNESOTA
 2016 WATERFOWL BREEDING POPULATION SURVEY MINNESOTA TITLE: Waterfowl Breeding Population Survey for Minnesota STRATA SURVEYED: Minnesota Strata 1, 2, and 3 DATES: May 2-May 16, 2016 DATA SUPPLIED BY: Minnesota
2018 WATERFOWL BREEDING POPULATION SURVEY, MINNESOTA
 2018 WATERFOWL BREEDING POPULATION SURVEY, MINNESOTA TITLE: Waterfowl Breeding Population Survey for Minnesota STRATA SURVEYED: Minnesota Strata 1, 2, and 3 DATES: May 7-21, 2018 DATA SUPPLIED BY: Minnesota
MIGRATORY BIRD POPULATIONS. Wetland Wildlife Populations and Research rd Street Bemidji, MN (218)
") MIGRATORY BIRD POPULATIONS Wetland Wildlife Populations and Research 102 23rd Street Bemidji, MN 56601 (218) 755-2973 93 94 2008 WATERFOWL BREEDING POPULATION SURVEY MINNESOTA Steve Cordts, Wetland Wildlife
MIGRATORY BIRD POPULATIONS Wetland Wildlife Populations and Research 102 23rd Street Bemidji, MN 56601 (218) 755-2973 93 94 2008 WATERFOWL BREEDING POPULATION SURVEY MINNESOTA Steve Cordts, Wetland Wildlife
ALASKA - YUKON WATERFOWL BREEDING POPULATION SURVEY. May 14 to June 5, 2007
 ALASKA - YUKON WATERFOWL BREEDING POPULATION SURVEY May 14 to June 5, 27 By Edward J. Mallek 1 Deborah J. Groves 2 U.S. Fish and Wildlife Service Fairbanks 1 and Juneau 2, Alaska TITLE: Waterfowl Breeding
David P. Rave, Michael C. Zicus, John R. Fieberg, John H. Giudice, and Robert G. Wright
 469 MINNESOTA S RING-NECKED DUCK BREEDING PAIR SURVEY David P. Rave, Michael C. Zicus, John R. Fieberg, John H. Giudice, and Robert G. Wright SUMMARY OF FINDINGS A pilot study was conducted in 2004-2006
2001 Waterfowl Breeding Population Survey for South Dakota and North Dakota
 University of Nebraska - Lincoln DigitalCommons@University of Nebraska - Lincoln US Fish & Wildlife Publications US Fish & Wildlife Service May 21 21 Waterfowl Breeding Survey for South Dakota and North
Spring waterfowl migration in the Uinta Basin of northeastern Utah
 Great Basin Naturalist Volume 37 Number 2 Article 13 6-30-1977 Spring waterfowl migration in the Uinta Basin of northeastern Utah Mary E. Sangster Gaylord Memorial Laboratory, Puxico, Missouri Follow this
Trends in Duck Breeding Populations,
 University of Nebraska - Lincoln DigitalCommons@University of Nebraska - Lincoln US Fish & Wildlife Publications US Fish & Wildlife Service 7-2-2010 Trends in Duck Breeding Populations, 1955-2010 Nathan
U.S. Fish & Wildlife Service Trends in Duck Breeding Populations
 U.S. Fish & Wildlife Service Trends in Duck Breeding Populations 1955 2015 July 2, 2015 Trends in Duck Breeding Populations, 1955 2015 Nathan L. Zimpfer, Walter E. Rhodes, Emily D. Silverman, Guthrie S.
Trends in Duck Breeding Populations
 University of Nebraska - Lincoln DigitalCommons@University of Nebraska - Lincoln US Fish & Wildlife Publications US Fish & Wildlife Service 2011 Trends in Duck Breeding Populations 1955-2011 Nathan L.
Atlantic. O n t h e. One of the best parts of fall is hearing the cacophony of honking,
 O n t h e Atlantic Flyway Keeping track of New Hampshire s waterfowl is an international affair. One of the best parts of fall is hearing the cacophony of honking, high-flying geese as they pass overhead.
Each spring, the Minnesota DNR coordinates statewide ruffed grouse (Bonasa
 2014 MINNESOTA SPRING GROUSE SURVEYS Charlotte Roy Forest Wildlife Populations and Research Group Minnesota Department of Natural Resources Grand Rapids, Minnesota 19 June 2014 SUMMARY OF FINDINGS Each
YUKON DELTA ALASKA HELICOPTER/FIXED WING COMPARATIVE WATERFOWL BREEDING POPULATION SURVEY. Progress Report III
 YUKON DELTA ALASKA HELICOPTER/FIXED WING COMPARATIVE WATERFOWL BREEDING POPULATION SURVEY Progress Report III Bruce Conant Migratory Bird Management - Juneau, Alaska Christian P. Dau Izembek National Wildlife
Fall Trumpeter Swan Survey of the High Plains Flock
 University of Nebraska - Lincoln DigitalCommons@University of Nebraska - Lincoln US Fish & Wildlife Publications US Fish & Wildlife Service 11-2006 Fall Trumpeter Swan Survey of the High Plains Flock Shilo
JANUARY WATERFOWL COUNTS, , AND SOME OBSERVATIONS ON LONG-TERM TRENDS
 JANUARY WATERFOWL COUNTS, 2005-2007, AND SOME OBSERVATIONS ON LONG-TERM TRENDS Bryan L. Swift New York State Department of Environmental Conservation 625 Broadway Albany, NY 12233-4750 INTRODUCTION The
2015 MINNESOTA SPRING GROUSE SURVEYS
 SUMMARY OF FINDINGS 2015 MINNESOTA SPRING GROUSE SURVEYS Charlotte Roy Forest Wildlife Populations and Research Group Minnesota Department of Natural Resources Grand Rapids, Minnesota 17 June 2015 Each
JANUARY WATERFOWL COUNTS, , AND SOME OBSERVATIONS ON LONG-TERM TRENDS
 JANUARY WATERFOWL COUNTS, 2005-2007, AND SOME OBSERVATIONS ON LONG-TERM TRENDS Bryan 1. Swift New York State Department of Environmental Conservation 625 Broadway Albany, NY 12233-4750 The New York State
Blue-winged Teal. Blue-winged Teal Minnesota Conservation Summary
 Credit Rebecca Field Blue-winged Teal Blue-winged Teal Minnesota Conservation Summary Audubon Minnesota Spring 2014 The Blueprint for Minnesota Bird Conservation is a project of Audubon Minnesota written
Fall Trumpeter Swan Survey of the High Plains Flock
 University of Nebraska - Lincoln DigitalCommons@University of Nebraska - Lincoln US Fish & Wildlife Publications US Fish & Wildlife Service 10-2009 Fall Trumpeter Swan Survey of the High Plains Flock Shilo
Each spring, the Minnesota DNR coordinates statewide ruffed grouse (Bonasa
 2016 MINNESOTA SPRING GROUSE SURVEYS Charlotte Roy Forest Wildlife Populations and Research Group Minnesota Department of Natural Resources Grand Rapids, Minnesota 10 June 2016 SUMMARY OF FINDINGS Each
Trends in Duck Breeding Populations,
 University of Nebraska - Lincoln DigitalCommons@University of Nebraska - Lincoln US Fish & Wildlife Publications US Fish & Wildlife Service 6-30-2000 Trends in Duck Breeding Populations, 1955-2000 Khristi
Baskett Slough National Wildlife Refuge BCS number: 47-4
 Baskett Slough National Wildlife Refuge BCS number: 47-4 Site description author(s) Daphne E. Swope, Research and Monitoring Team, Klamath Bird Observatory Primary contact for this site N/A Location (UTM)
Black Tern Sightings in Minnesota:
 Nongame Wildlife Program Division of Ecological Services Minnesota Department of Natural Resources Black Tern Sightings in Minnesota: 1990-1995 Submitted to the U.S. Fish and Wildlife Service, Region 3
MDWFP Aerial Waterfowl Survey Report. January 3-6, 2018
 MDWFP Aerial Waterfowl Survey Report January 3-6, 2018 Prepared by: Houston Havens Waterfowl Program Coordinator and Alec Conrad Private Lands Biologist Delta Region MS Department of Wildlife, Fisheries,
Trends in Duck Breeding Populations,
 University of Nebraska - Lincoln DigitalCommons@University of Nebraska - Lincoln US Fish & Wildlife Publications US Fish & Wildlife Service 27 Trends in Duck Breeding Populations, 1955-27 Khristi A. Wilkins
PRELIMINARY RESULTS FROM THE FORT NELSON, BRITISH COLUMBIA WATERBIRD INVENTORY PROJECT 2003 PROGRESS REPORT
 PRELIMINARY RESULTS FROM THE FORT NELSON, BRITISH COLUMBIA WATERBIRD INVENTORY PROJECT 2003 PROGRESS REPORT by: DUCKS UNLIMITED CANADA WESTERN BOREAL PROGRAM For Information regarding this project contact:
Red-breasted Merganser Minnesota Conservation Summary
 Credit Jim Williams Red-breasted Merganser Minnesota Conservation Summary Audubon Minnesota Spring 2014 The Blueprint for Minnesota Bird Conservation is a project of Audubon Minnesota written by Lee A.
Greater prairie-chickens (Tympanuchus cupido pinnatus) were surveyed in 16 of 17
 were surveyed in 16 of 17") 2014 MINNESOTA PRAIRIE-CHICKEN SURVEY Charlotte Roy Forest Wildlife Populations and Research Group Minnesota Department of Natural Resources Grand Rapids, Minnesota 8 August 2014 SUMMARY OF FINDINGS Greater
2014 MINNESOTA PRAIRIE-CHICKEN SURVEY Charlotte Roy Forest Wildlife Populations and Research Group Minnesota Department of Natural Resources Grand Rapids, Minnesota 8 August 2014 SUMMARY OF FINDINGS Greater
Ladd Marsh Wildlife Area BCS number: 49-3
 Oregon Coordinated Aquatic Bird Monitoring: Description of Important Aquatic Bird Site Ladd Marsh Wildlife Area BCS number: 49-3 Site description author M. Cathy Nowak, Ladd Marsh Wildlife Area Biologist
River s End Ranch BCS number: 48-21
 Oregon Coordinated Aquatic Bird Monitoring: Description of Important Aquatic Bird Site River s End Ranch BCS number: 48-21 Site description author(s) Martin St. Lewis, Area Manager, Summer Lake Wildlife
NORTH DAKOTA NAWCA PROJECTS
 NORTH DAKOTA NAWCA PROJECTS $54,280,370 $75,887,733 75 1,639,060 NAWCA GRANT AMOUNT TOTAL PARTNER CONTRIBUTION NUMBER OF PROJECTS TOTAL ACRES North Dakota currently has 75 NAWCA projects either completed
Tualatin River NWR and Wapato Lake BCS number: 47-37
 Tualatin River NWR and Wapato Lake BCS number: 47-37 ***NOTE: We were unable to determine all necessary information for this site description. If you would like to contribute the needed information to
Sauvie Island Wildlife Area BCS number: 47-28
 Sauvie Island Wildlife Area BCS number: 47-28 Site description author(s) Mark Nebeker, Oregon Department of Fish and Wildlife, Sauvie Island Wildlife Area Manager Primary contact for this site Mark Nebeker,
Fall 2001 Whooping Crane Migrational Survey Protocol Implementation Report
 Fall 2001 Whooping Crane Migrational Survey Protocol Implementation Report Prepared by Executive Director s Office For Committee s of the Platte River Cooperative Agreement June 5, 2002 I. Introduction
2018 Minnesota Spring Grouse surveys
 2018 Minnesota Spring Grouse surveys Charlotte Roy Forest Wildlife Populations and Research Group Minnesota Department of Natural Resources Grand Rapids, Minnesota 5 June 2018 SUMMARY OF FINDINGS The Minnesota
NEW YORK STATE WATERFOWL COUNT, JANUARY 1989
 NEW YORK STATE WATERFOWL COUNT, JANUARY 1989 The Federation of New York State Bird Clubs, Inc., held the 1989 winter Waterfowl Count from 14 through 22 Jan, with 15 Jan as the target date. All Regions
American Bittern Minnesota Conservation Summary
 Credit Jim Williams American Bittern Minnesota Conservation Summary Audubon Minnesota Spring 2014 The Blueprint for Minnesota Bird Conservation is a project of Audubon Minnesota written by Lee A. Pfannmuller
Sandhill Cranes and Waterfowl of the North Platte River Valley: Evaluation of Habitat Selection to Guide Conservation Delivery
 Sandhill Cranes and Waterfowl of the North Platte River Valley: Evaluation of Habitat Selection to Guide Conservation Delivery { Emily Munter, Wildlife Biologist U.S. Fish and Wildlife Service Nebraska
Habitat changes force waterfowl to flee the coast by large amount
 Habitat changes force waterfowl to flee the coast by large amount BY: SHANNON TOMPKINS HOUSTON CHRONICLE MARCH 2, 2016 Photo: Picasa While the Texas coast still winters the majority of the continent's
Marsh Bird and Amphibian Communities in the Thunder Bay AOC,
 Marsh and Amphibian Communities in the Thunder Bay AOC, 995. Purpose of the MMP The Marsh Monitoring Program (MMP) was established to provide baseline surveys of marsh bird and amphibian populations and
TERR 7 MIGRATORY WATERFOWL
 TERR 7 MIGRATORY WATERFOWL 1.0 EXECUTIVE SUMMARY During 2001 and 2002, the literature review, agency consultation, and habitat mapping were completed, and incidental sightings were recorded. Several species
Common Goldeneye Minnesota Conservation Summary
 Credit Jim Williams Common Goldeneye Minnesota Conservation Summary Audubon Minnesota Spring 2014 The Blueprint for Minnesota Bird Conservation is a project of Audubon Minnesota written by Lee A. Pfannmuller
Upper Klamath National Wildlife Refuge Complex Upper Klamath Unit and Hank s Marsh Unit BCS Number: 48-29
 Oregon Coordinated Aquatic Bird Monitoring: Description of Important Aquatic Bird Site Upper Klamath National Wildlife Refuge Complex Upper Klamath Unit and Hank s Marsh Unit BCS Number: 48-29 Site description
Black-crowned Night-heron Minnesota Conservation Summary
 Credit Deborah Reynolds Black-crowned Night-heron Minnesota Conservation Summary Audubon Minnesota Spring 2014 The Blueprint for Minnesota Bird Conservation is a project of Audubon Minnesota written by
THE COMMON LOON. Population Status and Fall Migration in Minnesota MINNESOTA ORNITHOLOGISTS UNION OCCASIONAL PAPERS: NUMBER 3
 THE COMMON LOON Population Status and Fall Migration in Minnesota MINNESOTA ORNITHOLOGISTS UNION OCCASIONAL PAPERS: NUMBER 3 Edited by Peder H. Svingen and Anthony X. Hertzel THE COMMON LOON Population
Peregrine Falcon Falco peregrinus
 Plant Composition and Density Mosaic Distance to Water Prey Populations Cliff Properties Minimum Patch Size Recommended Patch Size Home Range Photo by Christy Klinger Habitat Use Profile Habitats Used
Catalog of Upper Mississippi River and Great Lakes Region Joint Venture GIS Data March 2009 Version 1
 Catalog of Upper Mississippi River and Great Lakes Region Joint Venture GIS Data March 2009 Version 1 Compiled by: Bradly Potter Introduction This catalog contains descriptions of GIS data available from
Alvord Lake BCS number: 48-2
 Oregon Coordinated Aquatic Bird Monitoring: Description of Important Aquatic Bird Site Alvord Lake BCS number: 48-2 Site description author(s) Whitney Haskell, Data Management Intern, Klamath Bird Observatory
Malheur National Wildlife Refuge BCS number: 48-18
 Oregon Coordinated Aquatic Bird Monitoring: Description of Important Aquatic Bird Site Malheur National Wildlife Refuge BCS number: 48-18 Site description author(s) Sally Hall, Volunteer, Malheur NWR Roger
Paulina Marsh BCS number: 48-20
 Oregon Coordinated Aquatic Bird Monitoring: Description of Important Aquatic Bird Site Paulina Marsh BCS number: 48-20 Site description author(s) Nick David, Aquatic Project Lead, Klamath Bird Observatory
IMAGES OF NATURE. Show times
 ALBERTA WILDLIFE CARVING ASSOCIATION IMAGES OF NATURE 28TH. ANNUAL WILDFOWL & WILDLIFE CARVING COMPETITION 2013 At Sherwood Park Community League Log Cabin 50 Spruce Ave. SHERWOOD PARK, ALBERTA May 3 rd,
BREEDING WATERFOWL POPULATIONS IN THE PRAIRIE POTHOLE REGION OF NORTH DAKOTA
 BREEDING WATERFOWL POPULATIONS IN THE PRAIRIE POTHOLE REGION OF NORTH DAKOTA ROBERT AND HAROLD E. STEWART A. KANTRUD U.S. Bureau of Sport Fisheries and Northern Prairie Wildlife Research Jamestown, North
Alberta Conservation Association 2008/09 Project Summary Report
 Alberta Conservation Association 2008/09 Project Summary Report Project name: Waterfowl Nesting Habitat Enhancement Project leader: Velma Hudson Primary ACA staff on this project: Velma Hudson, Andy Murphy,
Progress on Marsh Bird Monitoring in Prairie Canada. Kiel Drake, Bird Studies Canada
 Progress on Marsh Bird Monitoring in Prairie Canada Kiel Drake, Bird Studies Canada PHJV area BCR11 (&6) Prairie MMP: JV-driven at inception 1. DSS Models: maps based on spphabitat models 2. Assess value
MIGRATION CYCLES (MODIFIED FOR ADEED)
") MIGRATION CYCLES (MODIFIED FOR ADEED) Overview: Students play a board game that simulates bird migration from the nesting area in Alaska to the wintering area and back again. Objectives: The student will:
MIGRATION CYCLES (MODIFIED FOR ADEED) Overview: Students play a board game that simulates bird migration from the nesting area in Alaska to the wintering area and back again. Objectives: The student will:
Friends of Crab Orchard Refuge
 Friends of Crab Orchard Refuge Quarterly Newsletter ISSUE 07 January 2019 this issue Attention P.1 Volunteer of the Quarter P.1 Deer Firearm Season P.1 Photography P.2 Creature Feature P.3 Water Bird Counts
Smith River Mouth BCS number: 86-6
 Smith River Mouth BCS number: 86-6 ***NOTE: We were unable to determine all necessary information for this site description. If you would like to contribute the needed information to this description,
DISTRIBUTION AND ABUNDANCE OF SEA DUCKS AND DIVING DUCKS ON LAKE ST. CLAIR AND W. LAKE ERIE
 DISTRIBUTION AND ABUNDANCE OF SEA DUCKS AND DIVING DUCKS ON LAKE ST. CLAIR AND W. LAKE ERIE Dave Luukkonen, Michigan DNR and Michigan State University Importance of Lake St. Clair and western Lake Erie
WATER BIRDS OF PALM BEACH COUNTY
 WATER BIRDS OF PALM BEACH COUNTY Presented by : The Audubon Society of the Everglades www.auduboneverglades.org Text and Photographs by Larry Hess Types of Water Birds Seen in Palm Beach County Ducks and
THE COMMON LOON. Population Status and Fall Migration in Minnesota MINNESOTA ORNITHOLOGISTS UNION OCCASIONAL PAPERS: NUMBER 3
 THE COMMON LOON Population Status and Fall Migration in Minnesota MINNESOTA ORNITHOLOGISTS UNION OCCASIONAL PAPERS: NUMBER 3 Edited by Peder H. Svingen and Anthony X. Hertzel THE COMMON LOON Population
M. Fast, B. Collins and M. Gendron 1
 Trends in breeding waterfowl in Canada M. Fast, B. Collins and M. Gendron 1 Canadian Biodiversity: Ecosystem Status and Trends 2010 Technical Thematic Report No. 8 Published by the Canadian Councils of
Wisconsin Bald Eagle and Osprey Nest Surveys 2015
 Wisconsin Bald Eagle and Osprey Nest Surveys 2015 Project Staff: Photo credit: Brian M. Collins Jim Woodford Rhinelander Steve Easterly Oshkosh Dean Edlin Alma Ryan Magana Spooner Carly Lapin - Rhinelander
3 rd Generation Thunderstorm Map. Predicted Duck Pair Accessibility to Upland Nesting Habitat in the Prairie Pothole Region of Minnesota and Iowa
 3 rd Generation Thunderstorm Map Predicted Duck Pair Accessibility to Upland Nesting Habitat in the Prairie Pothole Region of Minnesota and Iowa Grassland Bird Conservation Areas Wetland Reserve Program
ASSESSING HABITAT QUALITY FOR PRIORITY WILDLIFE SPECIES IN COLORADO WETLANDS
 C O L O R A D O P A R K S Dabbling Ducks & W I L D L I F E GADWALL TOM KOERNER, USFWS / AMERICAN WIGEON BILL GRACEY NORTHERN PINTAIL GEORGIA HART / MALLARD MICHAEL MENEFEE, CNHP / ALL TEAL PHOTOS TOM KOERNER,
Geographic Response Plan Map: GA-2. Raptor Nesting Area. Recreational Fishing. Sea Turtles. Shorebird Nesting Area. Wading birds Nesting Area
 81 7'30"W Geographic Response Plan Map: GA-2 81 0'0"W 32 15'0"N 32 15'0"N Union Creek «46 Jasper Beaufort «170 Sector Charleston Sava n nah «170 and 2 AH NATIONAL FE REFUGE Middle River GA1-07 Steam Boat
Waterfowl Aerial Surveys of Lake Murray, South Carolina: Report
 Waterfowl Aerial Surveys of Lake Murray, South Carolina: 2007 2008 Report A Final Report of Activities under Contract Agreement between The University of Georgia Research Foundation, Inc. Savannah River
AERIAL SURVEY OF BIRDS AT MONO LAKE ON AUGUST 24, 1973
 AERIAL SURVEY OF BIRDS AT MONO LAKE ON AUGUST 24, 1973 by Ronald M. Jurek Special Wildlife Investigations Wildlife Management Branch California Department of Fish and Game September 1973 Jurek, R.M. 1973.
Klamath Marsh National Wildlife Refuge BCS number: 48-16
 Oregon Coordinated Aquatic Bird Monitoring: Description of Important Aquatic Bird Site Klamath Marsh National Wildlife Refuge BCS number: 48-16 Site description author(s) Carol Damberg, Klamath Marsh NWR
Wisconsin Bald Eagle and Osprey Nest Surveys 2016
 Wisconsin Bald Eagle and Osprey Nest Surveys Project Staff: Jim Woodford Rhinelander Steve Easterly Oshkosh Dean Edlin Alma Dan Goltz Boscobel Michael Stelpflug La Crosse Nicholas Schroeder Alma Sharon
Warner Wetlands / Warner Valley BCS number: 48-31
 Oregon Coordinated Aquatic Bird Monitoring: Description of Important Aquatic Bird Site Warner Wetlands / Warner Valley BCS number: 48-31 Site description author(s) Vernon Stofleth, Lakeview BLM District
Stopover sites for migratory birds in the western Lake Erie basin. David Ewert The Nature Conservancy
 Stopover sites for migratory birds in the western Erie basin David Ewert The Nature Conservancy Migratory birds Anthropogenic threats to migrants Habitat loss, especially coastal Community composition/structure
Title Marsh Bird Habitat Restoration and Management on Private and Public land in Arkansas Mississippi Alluvial Valley
 Title Marsh Bird Habitat Restoration and Management on Private and Public land in Arkansas Mississippi Alluvial Valley Project Summary: Changes in habitat and hydrology have caused serious declines in
LOCATION OF SHARP-TAILED GROUSE AND GREATER PRAIRIE-CHICKEN DISPLAY GROUNDS IN RELATION TO NPPD AINSWORTH WIND ENERGY FACILITY
 LOCATION OF SHARP-TAILED GROUSE AND GREATER PRAIRIE-CHICKEN DISPLAY GROUNDS IN RELATION TO NPPD AINSWORTH WIND ENERGY FACILITY 2006-2011 NEBRASKA GAME AND PARKS COMMISSION Bill Vodehnal, District Manager,
Killin Wetland (Cedar Canyon Marsh) BCS number: 47-15
 BCS number: 47-15") Killin Wetland (Cedar Canyon Marsh) BCS number: 47-15 ***NOTE: We were unable to determine all necessary information for this site description. If you would like to contribute the needed information to
Killin Wetland (Cedar Canyon Marsh) BCS number: 47-15 ***NOTE: We were unable to determine all necessary information for this site description. If you would like to contribute the needed information to
PART FIVE: Grassland and Field Habitat Management
 PART FIVE: Grassland and Field Habitat Management PAGE 64 15. GRASSLAND HABITAT MANAGEMENT Some of Vermont s most imperiled birds rely on the fields that many Vermonters manage as part of homes and farms.
An assessment of invasive aquatic plant control as a management tool for Avian Vacuolar Myelinopathy
 An assessment of invasive aquatic plant control as a management tool for Avian Vacuolar Myelinopathy AVM presents a serious threat to avian health: management is needed J. Strom while Thurmond we continue
ACJV Salt Marsh Workshop: Black Duck Non-Breeding Habitat Conservation BDJV Partnership
 ACJV Salt Marsh Workshop: Black Duck Non-Breeding Habitat Conservation BDJV Partnership Albany, NY July 2015 ACJV Salt Marsh Workshop Outline: Acknowledgements Background Big Picture ABDU, Salt marsh,
Grassland Bird Survey Protocol Sauvie Island Wildlife Area
 Grassland Bird Survey Protocol Sauvie Island Wildlife Area Project Objective: Help determine if native grassland bird species are benefiting from restoration of grassland/pasture habitats at the Sauvie
Pacific Flyway Management Plan for the. Pacific Population of Western Canada Geese
 Pacific Flyway Management Plan for the Pacific Population of Western Canada Geese PACIFIC FLYWAY MANAGEMENT PLAN FOR THE PACIFIC POPULATION OF WESTERN CANADA GEESE Prepared for the Pacific Flyway Council
Note: Some squares have continued to be monitored each year since the 2013 survey.
 Woodcock 2013 Title Woodcock Survey 2013 Description and Summary of Results During much of the 20 th Century the Eurasian Woodcock Scolopax rusticola bred widely throughout Britain, with notable absences
Waterfowl in Ontario s Boreal Region
 Looking back, looking forward Prepared by Kenneth F. Abraham Peterborough, Ontario Prepared for Ducks Unlimited Canada Ontario August 2014 Black Scoter female with brood on 25 July 2006 near Peawanuck,
Blueprint for Minnesota Bird Conservation
 Blueprint for Minnesota Bird Conservation Recommendations for Minnesota s Tallgrass Aspen Parklands Region Spring 2014 The Blueprint for Minnesota Bird Conservation is a project of Audubon Minnesota written
Jackson Bottom Wetlands Preserve BCS Number: 47-14
 Jackson Bottom Wetlands Preserve BCS Number: 47-14 Site description author(s) Greg Gillson, Jackson Bottom Wetlands Preserve Primary contact for this site Ed Becker, Natural Resources Manager, Jackson
The importance of wing data for the monitoring and sustainable management of European ducks
 The importance of wing data for the monitoring and sustainable management of European ducks Richard Hearn Duck Specialist Group / Wildfowl & Wetlands Trust Photo John Anderson Why manage duck populations?
Wanaket Wildlife Area BCS number: 48-30
 Oregon Coordinated Aquatic Bird Monitoring: Description of Important Aquatic Bird Site Wanaket Wildlife Area BCS number: 48-30 Site description author(s) M. Cathy Nowak, ODFW, Ladd Marsh Wildlife Area
Population Status of Migratory Game Birds in Canada
 Population Status of Migratory Game Birds in Canada November 2015 Canadian Wildlife Service Waterfowl Committee CWS Migratory Birds Regulatory Report Number 45 Cat. No.: CW69-16/45-2016E-PDF ISBN: 978-0-660-04034-9
Fernhill Wetlands BCS number: 47-13
 Fernhill Wetlands BCS number: 47-13 ***NOTE: We were unable to determine all necessary information for this site description. If you would like to contribute the needed information to this description,
2017 Annual Volunteer Report
 2017 Annual Volunteer Report Volunteer Statistics Summary 23,164 DNR 280,419 Hours Donated 135 FTE s (Full Time Equivalents based on a 40-hour work week or 2,080 hours/year.) Volunteer hours are equivalent
Susitna-Watana Hydroelectric Project (FERC No ) Waterbird Migration, Breeding, and Habitat Use Study Plan Section 10.15
 Waterbird Migration, Breeding, and Habitat Use Study Plan Section 10.15") (FERC No. 14241) Waterbird Migration, Breeding, and Habitat Use Study Plan Section 10.15 Initial Study Report Part C: Executive Summary and Section 7 Prepared for Prepared by ABR, Inc. Environmental Research
(FERC No. 14241) Waterbird Migration, Breeding, and Habitat Use Study Plan Section 10.15 Initial Study Report Part C: Executive Summary and Section 7 Prepared for Prepared by ABR, Inc. Environmental Research
Keeyask Generation Project
 Keeyask Generation Project Terrestrial Effects Monitoring Plan Waterfowl Habitat Effects Monitoring Report TEMP-2016-02 Manitoba Conservation and Water Stewardship Client File 5550.00 Manitoba Environment
Sound CARE Project Portfolio
 Sound CARE Project Portfolio Ducks Unlimited and Sound CARE Sound CARE is a comprehensive initiative designed to restore, enhance, and protect wetland habitat to benefit waterfowl, other wetland-dependent
Mud Slough Wetland Reserve BCS number: 47-19
 Mud Slough Wetland Reserve BCS number: 47-19 ***NOTE: We were unable to determine all necessary information for this site description. If you would like to contribute the needed information to this description,
McKay Creek National Wildlife Refuge BCS number: 48-19
 Oregon Coordinated Aquatic Bird Monitoring: Description of Important Aquatic Bird Site McKay Creek National Wildlife Refuge BCS number: 48-19 Site description author(s) Howard Browers, Supervisory Wildlife
Birds! Are they canaries in a Cowichan Coal Mine? David Aldcroft Cowichan Watershed Board VIU Speaker Series January 2015
 Birds! Are they canaries in a Cowichan Coal Mine? David Aldcroft Cowichan Watershed Board VIU Speaker Series January 2015 For Discussion Tonight Who are you guys? Population trends New technology aiding
TOP PHOTOGRAPH: CYRUS MINNESOTA AREA BY JAMES AND MELISSA PETERSON, BOTTOM PHOTOGRAPHS: GREEN-WINGED TEAL BY SILL MARCHEL
 TOP PHOTOGRAPH: CYRUS MINNESOTA AREA BY JAMES AND MELISSA PETERSON, BOTTOM PHOTOGRAPHS: GREEN-WINGED TEAL BY SILL MARCHEL The DNR and its long-term duck plan are aiming to make western Minnesota prime
ILLINOI PRODUCTION NOTE. University of Illinois at Urbana-Champaign Library Large-scale Digitization Project, 2007.
 ILLINOI S UNIVERSITY OF ILLINOIS AT URBANA-CHAMPAIGN PRODUCTION NOTE University of Illinois at Urbana-Champaign Library Large-scale Digitization Project, 2007. Si8ic 3LEN C. SANDE RSO N ILLINOIS - NATURAL
Population Status of Migratory Game Birds in Canada
 Population Status of Migratory Game Birds in Canada (and Regulation Proposals for Overabundant Species) November 24 Canadian Wildlife Service Waterfowl Committee CWS Migratory Birds Regulatory Report Number
Keeyask Generation Project
 Keeyask Generation Project Terrestrial Effects Monitoring Plan Waterfowl Habitat Effects Monitoring Report TEMP-2018-11 Manitoba Sustainable Development Client File 5550.00 Manitoba Environment Act Licence
SPRING STAGING WATERFOWL ON THE NAKNEK RIVER, ALASKA PENINSULA, ALASKA, MARCH-MAY 2006
 SPRING STAGING WATERFOWL ON THE NAKNEK RIVER, ALASKA PENINSULA, ALASKA, MARCH-MAY 2006 Susan E. Savage Wildlife Biologist and William Murray Waterfowl Intern Key Words: Alaska Peninsula, American wigeon,
Tahkenitch Creek Estuary BCS number: 47-35
 Tahkenitch Creek Estuary BCS number: 47-35 ***NOTE: We were unable to determine all necessary information for this site description. If you would like to contribute the needed information to this description,