DISTRIBUTION AND ABUNDANCE OF SEABIRDS IN THE NORTHEASTERN CHUKCHI SEA,
|
|
|
- Gertrude Fisher
- 5 years ago
- Views:
Transcription


1 DISTRIBUTION AND ABUNDANCE OF SEABIRDS IN THE NORTHEASTERN CHUKCHI SEA, ADRIAN E. GALL ROBERT H. DAY PREPARED FOR CONOCOPHILLIPS ALASKA, INC. ANCHORAGE, ALASKA SHELL EXPLORATION & PRODUCTION COMPANY ANCHORAGE, ALASKA STATOIL USA E & P, INC. ANCHORAGE, ALASKA PREPARED BY ABR, INC. ENVIRONMENTAL RESEARCH & SERVICES FAIRBANKS, ALASKA
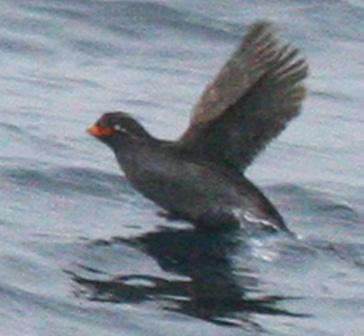
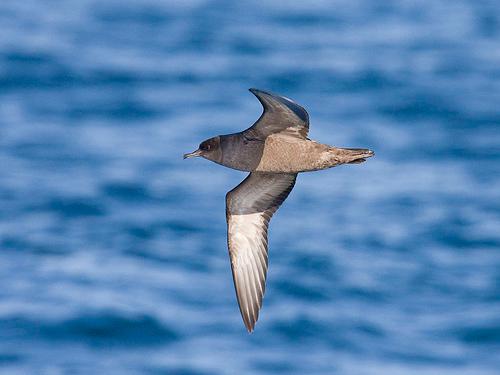
2 Inset: Selection of seabirds, by column, left to right: Sabine s Gull Pomarine Jaeger Thick-billed Murre Arctic Tern Dovekie Common Murre Northern Fulmar Least Auklet Tufted Puffin Crested Auklet Glaucous Gull Black-legged Kittiwake Short-tailed Shearwater
3 Distribution and Abundance of Seabirds in the Northeastern Chukchi Sea, Prepared for ConocoPhillips Company P.O. Box Anchorage, AK Shell Exploration & Production Company 3601 C Street, Suite 1334 Anchorage, AK and Statoil USA E & P, Inc 2700 Gambell St Anchorage, AK Prepared by Adrian E. Gall Robert H. Day ABR, Inc. Environmental Research & Services P.O. Box Fairbanks, AK September 2011 Printed on recycled paper.
4
5 Executive Summary In , we collected data on the distribution and abundance of seabirds in the northeastern Chukchi Sea in the vicinity of several oil and gas lease areas. The 3 study areas were ~ km (~ NM) northwest of the village of Wainwright and known as Klondike, Burger, and Statoil. The objectives of this study were to: (1) describe seasonal, spatial, and interannual variation in the distribution and abundance of seabirds; (2) describe seasonal and interannual changes in species-richness and speciescomposition; (3) compare our results with historical data available in the North Pacific Pelagic Seabird Database (NPPSD); and (4) explore relationships between seabirds and the physical and biological oceanography of the region. We conducted seabird surveys during 3 seasons that covered the entire open-water period of the northeastern Chukchi Sea: late summer (Jul/Aug), early fall (Aug/Sep), and late fall (Sep/Oct). The analyses of densities, species-richness, and species-composition used data collected only within the boundaries of the 3 study-area boxes, whereas data collected opportunistically within ~92 km (50 NM) of each study-area box were used when making comparisons with historical data. In 2008, sampling effort was greater in Klondike than in Burger, especially during the Jul/Aug cruise, because it generally had less ice cover. In 2009, we did not encounter any ice in the study areas during the sampling period, and sampling effort was similar between Klondike and Burger. In 2010, we sampled all 3 study areas in Jul/Aug and Aug/Sep but sampled only Burger in Sep/Oct. Seabirds were more abundant in the study areas in 2009 than in 2008 or 2010, although we recorded fewer species in In 2008, we recorded 4,646 individuals of 31 species on transect within the 2 study areas combined; in 2009, we recorded 31,579 individuals of 24 species on transect within the 2 study areas combined. In 2010, we added the Statoil study area and recorded 10,827 individuals of 29 species on transect within the 3 study areas combined. We had sufficient detections to generate reliable estimates of density for 8 focal species. Densities of each of the 8 focal species differed significantly among seasons, and these seasonal patterns differed among years. In 2008, seabirds were more abundant in the second half of the open-water period. In 2009, however, seabirds were more abundant in the first half of the open-water period. In 2010, densities appeared intermediate between 2008 and 2009, and seasonal patterns appeared more similar to 2009 than to The total density of seabirds was considerably higher in 2009 than it was in 2008 or 2010 and generally was higher in Klondike than in Burger in 2008 and There were no significant difference in densities among Klondike, Burger, and Statoil in Alcids were the most abundant species group in 2008 and 2010, and were the second-most abundant species group recorded in In 2008, densities of alcids were significantly higher in Klondike than in Burger during all three seasons, whereas, in 2009, densities were higher in Burger than in Klondike during Jul/Aug and Aug/Sep but were higher in Klondike than in Burger in Sep/Oct. In 2010, densities of alcids were similar among all 3 study areas and seasons. Tubenoses were the second-most-abundant species-group in 2008 and 2010 and were the most abundant species-group recorded in 2009, primarily because of large flocks of Short-tailed Shearwaters moving through Klondike in Aug/Sep. The maximal density of Short-tailed Shearwaters in 2009 was nearly 16 times the maximal density in 2008 or Multivariate analyses of the seabird community composition indicated that species-composition varied among seasons and among study areas and that the dominant pattern differed among years. The numerical iii Chukchi Seabird Synthesis
6 dominance of alcids in all study areas combined increased from 2008 to Klondike was numerically dominated by alcids and tubenoses in all years. Burger was numerically dominated by larids and tubenoses in 2008, and by alcids in 2009 and Statoil also was numerically dominated by alcids in We recorded 11 species on transect in the study areas that are classified as being of conservation concern. One (Spectacled Eider) is listed as a threatened species under the U.S. Endangered Species Act of 1973, as amended (ESA), 2 (Kittlitz s Murrelet and Yellow-billed Loon) are classified as candidate species under the ESA, and 2 (Red-throated Loon and Arctic Tern) are classified as species of conservation concern by the U.S. Fish and Wildlife Service. Spatial overlap between the NPPSD historical data set and the data set was greatest in Jul/Aug and, to some extent, Aug/Sep, but no historical transects were conducted within ~9 km of any study area in Sep/Oct. Consequently, comparisons between the 2 data sets have been made with several caveats. Densities from the historical data collected within the study areas suggest that total densities of seabirds in Klondike, Burger, and Statoil were similar between the historical data and densities in 2010, whereas densities in 2008 were lower and densities in 2009 were more than 6 times any historical values. Seasonal and spatial patterns of speciescomposition suggest that alcids and tubenoses are more abundant in the northeastern Chukchi Sea now than they were historically. We propose here that the structure of the seabird community differs substantially between the Klondike and Burger study areas and that these differences reflect what we believe are oceanographic differences between the 2 study areas, with Statoil straddling these two oceanographic systems. The Klondike study area appears to be a more pelagically-dominated system with a higher biomass of copepods than seen in Burger. The Burger study area appears to be a benthicallydominated system with higher abundance, biomass, and number of benthic taxa than Klondike. Diving alcids and Short-tailed Shearwaters that forage on large oceanic copepods and euphausiids are more abundant in Klondike, whereas surface-feeding or nearsurface-feeding larids that feed on zooplankton and fishes are more abundant in Burger. Statoil appears to represent elements of both of the other study areas. The distribution of seabirds, particularly the planktivorous species, may be strongly influenced by advective processes that transport oceanic species of zooplankton from the Bering Sea to the Chukchi Sea. This transport apparently differed among years and resulted in a broader northeastward intrusion of Bering Sea Water, higher abundance of large oceanic copepods and euphausiids, and greater abundance of planktivorous seabirds in both study areas, in 2009 than in 2008 or Chukchi Seabird Synthesis iv
7 Table of Contents Executive Summary...iii List of Figures... vi List of Tables...vii List of Appendices...viii Acknowledgments...viii Acronyms and Abbreviations... ix Introduction... 1 History of Previous Research... 1 Study Objectives... 2 Methods... 3 Study Area... 3 Oceanographic Structure... 3 Data Collection... 9 Data Analysis Density Calculations and Analyses Community Analyses Comparison with Historical Data Results Patterns of Abundance and Distribution Alcids Tubenoses Larids Phalaropes Loons Waterfowl Total Density Estimates Community Structure Conservation Status Comparison with Historical Data Discussion Oceanographic Relationships Species Distribution and Abundance Planktivorous Seabirds Omnivorous Seabirds Piscivorous Seabirds Rare Species Comparison with Historical Data Species of Conservation Concern Conclusions Literature Cited v Chukchi Sea Synthesis
8 Figure 1. Figure 2. Figure 3. Figure 4. Figure 5. Figure 6. Figure 7. Figure 8. Figure 9. Figure 10. Figure 11. Figure 12. Figure 13. Figure 14. Figure 15. Figure 16. Figure 17. Figure 18. Figure 19. Figure 20. List of Figures Locations of the Klondike, Burger, and Statoil study areas in the northeastern Chukchi Sea... 4 Vertical sections of temperature, and salinity in the Klondike and Burger study areas, Vertical sections of temperature and salinity in the Klondike and Burger study areas, Vertical sections of temperature and salinity in the Klondike and Burger study areas, Vertical sections of temperature and salinity in the Klondike, Burger, and Statoil study areas, Timing of boat-based surveys for marine birds in the Klondike, Burger, and Statoil study areas, 2008, 2009, and Mean density of Crested Auklets, Least Auklets, and Thick-billed Murres on transect in the Klondike, Burger, and Statoil study areas in 2008, 2009, and 2010, by study area and season Distribution of estimated densities of Crested Auklets recorded on transect in the Klondike, Burger, and Statoil study areas in 2008, 2009, and 2010, by season and year Distribution of estimated densities of Least Auklets recorded on transect in the Klondike, Burger, and Statoil study areas in 2008, 2009, and 2010, by season and year Distribution of estimated densities of Thick-billed Murres recorded on transect in the Klondike, Burger, and Statoil study areas in 2008, 2009, and 2010, by season and year Mean density of phalaropes, Short-tailed Shearwaters, and Northern Fulmars on transect in the Klondike, Burger, and Statoil study areas in 2008, 2009, and 2010, by study area and season Distribution of estimated densities of Short-tailed Shearwaters recorded on transect in the Klondike, Burger, and Statoil study areas in 2008, 2009, and 2010, by season and year Distribution of estimated densities of Northern Fulmars recorded on transect in the Klondike, Burger, and Statoil study areas in 2008, 2009, and 2010, by season and year Mean density of Black-legged Kittiwakes and Glaucous Gulls on transect in the Klondike, Burger, and Statoil study areas in 2008, 2009, and 2010, by study area and season Estimated densities of Black-legged Kittiwakes recorded on transect in the Klondike, Burger, and Statoil study areas in 2008, 2009, and 2010, by study area and year Estimated densities of Glaucous Gulls recorded on transect in the Klondike, Burger, and Statoil study areas in 2008, 2009, and 2010, by study area and year Estimated densities of phalaropes recorded on transect in the Klondike, Burger, and Statoil study areas in 2008, 2009, and 2010, by study area and year Estimated densities of total birds recorded on transect in the Klondike, Burger, and Statoil study areas and surrounding buffer zone in 2008, 2009, and 2010, by study area and year Species-richness of the seabird community recorded on transect in the Klondike, Burger, and Statoil study areas in 2008, 2009, and 2010 by study area and season Cluster analysis of Bray-Curtis similarities based on ln(x+1)-transformed density of seabirds recorded in the northern Chukchi Sea during 2008, 2009, and Chukchi Sea Synthesis vi
9 Figure 21. Figure 22. Figure 23. Figure 24. Figure 25. Figure 26. Figure 27. Figure 28. Figure 29. Figure 30. Figure 31. Nonmetric multidimensional scaling ordination plot of Bray-Curtis similarities for ln(x+1)-transformed density of seabirds recorded in the northern Chukchi Sea during 2008, 2009, and Species-composition of the seabird community on transect in the Klondike, Burger, and Statoil study areas, by season and year Counts of other species of conservation concern recorded on transect in the Klondike and Burger study areas in 2008, by species, study area, and season Counts of other species of conservation concern recorded on transect in the Klondike and Burger study areas in 2009, by species, study area, and season Counts of other species of conservation concern recorded on transect in the Klondike, Burger, and Statoil study areas in 2010, by species, study area, and season Counts of waterfowl species of conservation concern recorded on transect in the Klondike and Burger study areas in 2008, by species, study area, and season Counts of waterfowl species of conservation concern recorded on transect in the Klondike and Burger study areas in 2009, by species, study area, and season Counts of waterfowl species of conservation concern recorded on transect in the Klondike and Burger study areas in 2010, by species, study area, and season Estimated densities of total birds recorded on transect in the Klondike, Burger, and Statoil study areas and surrounding buffer zone in historical times, by study area and season Species-richness of the seabird community on transect in the Klondike and Burger study areas and surrounding buffer zones in historical times, by study area and season Species-composition of the seabird community in the Klondike, Burger, and Statoil study areas and surrounding buffer zones List of Tables Table 1. Species of seabirds identified during boat-based surveys in the northeastern Chukchi Sea, by study area and season Table 2. Species of seabirds identified during boat-based surveys in the northeastern Chukchi Sea, in the Statoil study area by season Table 3. Estimated densities of the 8 focal species of seabirds counted during boat-based marine surveys in the central Chukchi Sea, by study area and season, Table 4. Estimated densities of the 8 focal species of seabirds counted during boat-based marine surveys in the central Chukchi Sea, by study area and season, Table 5. Estimated densities of the 8 focal species of seabirds counted during boat-based marine surveys in the central Chukchi Sea, by study area and season, Table 6. Estimated total densities of seabirds counted during boat-based marine surveys in the northern Chukchi Sea, by study area, season, and year Table 7. Bird species in the northeastern Chukchi Sea that are of conservation concern vii Chukchi Sea Synthesis
10 Appendix A. Appendix B. Appendix C. Appendix D. List of Appendices List of all species recorded during boat-based marine surveys in the northeastern Chukchi Sea, Counts of all birds recorded on transects during boat-based marine surveys in the central Chukchi Sea, by study area and season, Counts of all birds recorded on transects during boat-based marine surveys in the central Chukchi Sea, by study area and season, Counts of all birds recorded on transect during boat-based marine surveys in the central Chukchi Sea, by study area and season, Acknowledgments ConocoPhillips Company (COP), Shell Exploration & Production Company (Shell), and Statoil USA E&P Inc. (Statoil) funded this research; in addition, COP provided project management and oversight. We thank Caryn Rea, James Darnall, and Jon Anderson of COP; Michael Macrander of Shell; and Karin Berentsen and Steinar Eldøy of Statoil for support and advice during all phases of this study. We also thank John Burns, Jeff Hastings, Blair Paktokak, Bob Shears, and Sheyna Wisdom of Olgoonik Fairweather; and David Aldrich, Abby Faust, Sarah Norberg, and Waverly Thorsen of Aldrich Offshore Services for logistical and operational support in the field; and the Captains and crew of the M/V Bluefin, M/V Norseman, and the M/V Westward Wind. In addition, we thank the other Principal Investigators and other scientists involved with this project; special thanks go to Thomas Weingartner of the Institute of Marine Sciences (IMS), University of Alaska Fairbanks, for insights into the physical oceanography of the Chukchi Sea, and to Arny Blanchard of IMS for statistical guidance. At ABR, we thank Lauren Attanas, Jennifer Boisvert, Stephen Murphy, Tim Obritschkewitsch, Jonathan Plissner, John Rose, Peter Sanzenbacher, and Tawna Morgan for help with the seabird sampling; Rebecca Baird, Matt Macander, Allison Zusi-Cobb, and Dorte Dissing for help with GIS work; Christopher Swingley for help with data management; Alex Prichard for statistical advice; Pamela Odom for report production; and Thomas DeLong for project support. Gary Drew of the USGS Alaska Science Center provided data from the North Pacific Pelagic Seabird Database (NPPSD); we have complied with published guidelines for the ethical use of these data. We thank Caryn Rea of COP, Steinar Eldøy of Statoil, and Michael Macrander of Shell for review of this report. Chukchi Sea Synthesis viii
11 Acronyms and Abbreviations ADFG ANOVA Aug BOEMRE Alaska Department of Fish and Game analysis of variance August Bureau of Ocean Energy Management, Regulation, and Enforcement C degrees centigrade CSESP CTD Chukchi Sea Environmental Studies Program Conductivity, temperature, depth sensor ESA U.S. Endangered Species Act of 1973 GIS GPS IDW Jul km MMS NEPA NOAA NM nmds NPPSD m OCSEAP Oct psu Sep USFWS USGS geographic information system global positioning system inverse distance weighting July kilometer Minerals Management Service National Environmental Policy Act National Oceanic and Atmospheric Administration Nautical mile Non-metric multidimensional scaling North Pacific Pelagic Seabird Database meter Outer Continental Shelf Environmental Assessment Program October practical salinity units September U.S. Fish and Wildlife Service U.S. Geological Survey ix Chukchi Sea Synthesis
12 Chukchi Sea Synthesis x
13 Introduction Introduction The Chukchi Sea has one of the highest rates of primary productivity in the world s oceans (Grebmeier et al. 2006). This extraordinary productivity supports rich benthic and planktonic communities that, in turn, support large communities of apex predators such as seabirds, seals, and whales. Although the region is icecovered for much of the year, the ice-free waters and the ice edges become important habitat for non-breeding, staging, and migratory seabirds from mid-july to mid-october. Of the colonial seabirds, Thick-billed Murres (Uria lomvia), Common Murres (U. aalge), and Black-legged Kittiwakes (Rissa tridactyla) in particular, nest in large numbers on cliffs along the Chukchi coast and are common offshore during July/August and August/September (Divoky 1987, Divoky and Springer 1988). Species that nest on the tundra, such as phalaropes and jaegers, move out to sea in August/September and join millions of migratory Short-tailed Shearwaters (Puffinus tenuirostris) foraging in the area (Divoky 1987, Divoky and Springer 1988). Finally, ice-associated gulls such as Ross s Gulls (Rhodostethia rosea) and Ivory Gulls (Pagophila eburnea) migrate from higharctic breeding areas in Russia and Canada into the Chukchi Sea as the ice advances southward in the late fall. As many as 5 million seabirds of at least 22 species were believed to use the American waters of the Chukchi Sea during the ice-free season in the 1980s (Divoky 1987). In addition to its rich marine resources, the Chukchi Sea is of great interest for offshore oil development. Exploration for offshore oil began in arctic Alaska in the 1970s and led to exploratory drilling of 5 wells in 1989 and Two of these wells, known as Klondike and Burger, are located west of the village of Wainwright. These areas were not pursued beyond exploration at that time, and there was no further activity until February 2008, when nearly 3 million acres in the Chukchi Sea were leased for oil exploration. Studies of marine ecology were conducted in the late 1970s and early 1980s as part of the National Oceanic and Atmospheric Administration s Outer Continental Shelf Environmental Assessment Program (OCSEAP), and there has been resurgence in oceanographic research during the past decade. This study was conducted to inform managers and industry about the recent distribution, abundance, and timing of seabirds using the northeastern Chukchi Sea. It forms one component of the Chukchi Sea Environmental Studies Program (CSESP), a multidisciplinary study of the marine ecology of this area. History of Previous Research Data on seabirds in the northeastern Chukchi Sea during the open-water season are limited, primarily because of the area s historic inaccessibility. Much of the interest in seabirds in this area has concentrated on mainland seabird colonies and on seabirds at sea in the vicinity of the Hope Basin, which lies immediately north of Bering Strait, in the southeastern Chukchi Sea. The focus of seabird colony research has been Cape Lisburne, which is part of the Alaska Maritime National Wildlife Refuge; data also have been collected at irregular intervals at Cape Thompson, ~50 miles south of Cape Lisburne. These colonies have been studied periodically since 1976 by David Roseneau and others at the U.S. Fish and Wildlife Service (USFWS) who built on earlier work begun on nesting seabirds by Swartz (1966) during the Cape Thompson environmental studies of the U.S. Atomic Energy Commission in the 1950s. Another area of research has focused on use of the coastal-lagoon systems of the northeastern Chukchi Sea by birds. The early work by Johnson (1993) and Johnson et al. (1993) described baseline use of the Chukchi lagoon systems, whereas recent work has focused on monitoring population trends of birds in all lagoon systems in northern and northwestern Alaska annually (e.g., Dau and Larned 2004 and related annual reports). There also have been extensive studies of eider migration at Barrow, which has perhaps the highest concentration of migrating waterfowl on this continent (Thompson and Person 1963; Woodby and Divoky 1982; Suydam et al. 1997, 2000a, 2000b; Day et al. 2004), and studies of migrating Ross's Gulls, which concentrate at Barrow in the fall (Divoky et al. 1988). Aerial surveys for and satellite telemetry of migrating and staging Spectacled (Somateria fischeri) and Steller s eiders (Polysticta stelleri), both of which are protected 1 Chukchi Seabird Synthesis
14 Introduction under the Endangered Species Act (ESA) of 1973, as amended (PL ; 16 USC 1531), in the Chukchi Sea have indicated that shallow, nearshore waters of Ledyard Bay and Peard Bay form important stopover areas for migrating Spectacled and King (Somateria spectabilis) eiders in both the summer and fall (Balogh 1997, Oppel et al. 2009). In fact, the USFWS designated the nearshore waters of Ledyard Bay as critical habitat for Spectacled Eiders in 2001 (Federal Register 2001). In comparison to the well-known coastal seabird community, few historical data on the at-sea distribution and abundance of seabirds are available for the offshore region of the northeastern Chukchi Sea. The earliest research was conducted by Jacques (1930), who surveyed birds in the Bering Sea and western Chukchi Sea in July August Later, Swartz (1967) examined the at-sea distribution of seabirds in the southern and central Chukchi during the environmental studies at Cape Thompson. The interest in oil development in arctic Alaska in the 1970s prompted a decade of research on seabirds and other marine organisms in this region. The main seabird studies in areas important for oil development were conducted by (1) Watson and Divoky (1972), who studied seabirds in the eastern Chukchi Sea from a U.S. Coast Guard icebreaker; (2) Divoky (1979), who described some aspects of the Chukchi Sea open-water and ice-edge avifauna; and (3) Divoky (1987), who studied seabirds throughout the Chukchi Sea in the early 1980s as part of OCSEAP. The latter report was never released by OCSEAP as part of its Environmental Assessment of the Alaskan Continental Shelf publication series, so it is not widely available or widely known. Another source of information on seabirds near this area is Divoky and Springer (1988), who provided an overview of the data available on seabirds in the southern Chukchi Sea for a Minerals Management Service (now Bureau of Ocean Energy Management, Regulation, and Enforcement [BOEMRE]) synthesis report. Studies conducted during the past 5 years are filling in some gaps in knowledge about the at-sea ecology of seabirds the northeastern Chukchi Sea. Recently, there has been ship-of-opportunity sampling of seabirds in the Chukchi Sea conducted primarily by the USFWS and BOEMRE. These data have not been published yet, but they have been contributed to the North Pacific Pelagic Seabird Database (NPPSD), a publicly available information resource maintained by the U.S. Geological Survey, that is updated periodically. The current version of that database includes data from USFWS surveys as recent as October Other ongoing studies that provide detail on the use of nearshore and offshore waters by birds include satellite telemetry studies of Spectacled Eiders (Sexson 2010); Long-tailed Ducks (Clangula hyemalis) and King Eiders (Dickson and Bowman 2008); and Red-throated (Gavia stellata) and Yellow-billed loons (G. adamsii; Rizzolo and Schmutz 2009). The present study, which was conducted in , provides information on the recent distribution and abundance of marine birds in the northeastern Chukchi Sea. Study Objectives In this study, we explored the distribution and abundance of seabirds in the northeastern Chukchi Sea in 3 areas where ConocoPhillips Company, Shell Exploration & Production Company, and Statoil USA E & P have several lease-blocks for offshore oil and gas exploration and development. The objectives of this study were to: (1) describe seasonal, spatial, and interannual variation in the distribution and abundance of seabirds; (2) describe seasonal and interannual changes in species-richness and species-composition; (3) compare our results with historical data that are publicly available in the NPPSD; and (4) explore relationships between seabirds and the physical and biological oceanography of the region. This study both provides baseline information on the recent distribution and abundance of seabirds in the lease areas and summarizes information on the historical distribution and abundance of seabirds in the northeastern Chukchi Sea in the vicinity of those lease areas. This information will be used for an analysis of potential impacts resulting from offshore exploration and development activities and will be included within a National Environmental Policy Act (NEPA) document required for exploration. Chukchi Seabird Synthesis 2
15 Methods Methods Study Area This study was conducted in the northeastern Chukchi Sea, in an area extending ~ km (~ NM ) west of the village of Wainwright, which is located on the northwestern coast of Alaska. The overall survey area is bounded by 2 currents flowing from the Chukchi Sea to the Arctic Ocean: the Central Channel Current, to the west, and the Alaska Coastal Current, to the east (Weingartner et al. 2005, 2008). The survey area included 3 study areas called Klondike, Burger, and Statoil (Figure 1). The Klondike study area was located on the eastern side of the Central Channel and near the inflow of Bering Shelf water, whereas the Burger study area was located to the northeast of Klondike and on the southern slope of Hanna Shoal. The Statoil study area was located to the north of both Klondike and Burger, with its western edge close to the Central Channel and the eastern half on Hanna Shoal. The Alaska Coastal Current flows east of all 3 study areas, exiting the area via Barrow Canyon. The Klondike and Burger study areas consisted of a core area of greatest interest for exploration that was ~18 km (~10 NM) on a side within a larger study-area box that was ~55 km (30 NM) on a side (Figure 1). The larger study-area box included a buffer zone around the proposed exploration area that provided spatial context for all of the scientific disciplines. The Statoil box was configured to encompass several Statoil lease blocks and had the same total area as Klondike and Burger. These ~3,087-km² (900-NM²) study-area boxes were the primary focus of all sampling. We surveyed along a series of parallel survey lines that ran north south through these study-area boxes. The primary sampling grid included lines on the eastern and western boundaries of each study area and lines spaced ~3.7 km (2 NM) apart within each study area, creating a set of 16 parallel survey lines in Klondike and Burger that each were ~55.6 km (30 NM) long. Because the Statoil box was not square, it had 19 parallel survey lines of variable length. In all study-area boxes, a sampling grid of secondary lines was offset from the primary lines by ~1.8 km (1 NM) and was sampled as time allowed, when the primary lines were obstructed by ice, or if nearby primary lines had been sampled under poor observation conditions. In addition to transects within the study areas, we also sampled opportunistically near both study areas (primarily when ice prevented us from sampling within the study areas themselves) and when transiting between Wainwright and the study areas. Some of these additional data are included in the comparison with the historical data set. OCEANOGRAPHIC STRUCTURE The Chukchi Sea is a shallow (~50-m-deep) shelf sea north of Bering Strait and south of the basin of the Arctic Ocean. The primary inflow of nutrient-rich water comes from the south through Bering Strait and has 3 main outflows to the Arctic Ocean (Weingartner et al. 2005, Woodgate et al. 2005, Grebmeier et al. 2006). The physical structure of the study areas in may be seen in a series of vertical sections of CTD data collected during each of the 3 research cruises (Figures 2 5). These vertical sections show temperature ( C) and salinity (psu [practical salinity units]) along a series of stations extending from the southwestern corner (far left side of plots) to the northeastern corner (at ~80 km along the X-axis) of the Klondike study area, then from the southwestern corner (at ~100 km along the X-axis) to the northeastern corner (far right side of plots) of the Burger study area, except for September/ October 2010, which displays data from Burger only because there was no sampling in Klondike or Statoil during that cruise. The physical oceanography of the 3 study areas is described in greater detail by Weingartner et al. (2011). In all 3 years, the water structure in the region was influenced by the influx of warm, saline water from the Bering Sea. The transport of this water mass varied among years, however, in both timing and magnitude (Weingartner et al. 2011). In 2008, overall water temperatures were cold, reflecting the presence of ice that lasted into August and a persistent deep pool of cold, high-salinity water that remained in Klondike until September and in Burger until October (Figure 2). The surface layers had a more complex temperature and salinity structure in August/September than in July/August (Figure 2, middle panel). Warm water was 3 Chukchi Seabird Synthesis


16 Methods 162 W 160 W 158 W Primary Survey Line Secondary Survey Line Klondike Core Area Burger Core Area NM Buffer of Study Areas na Shoa l 72 N Han 156 W Klondike Study Area B ar w ro C y an on! Barrow 72 N Statoil Study Area Burger Study Area 72 30'N 164 W 166 W 72 30'N 168 W! Atqasuk ntr Beaufort Sea Chukchi Sea 69 N Alaska 69 30'N! Point Lay 69 30'N 70 N C h a n n el 70 N al Point Franklin 69 N 70 30'N Ce! Wainwright 70 30'N Icy Cape Cape Lisburne 0 Point Hope Figure km UTM 3 NAD 1983 Depth in 10-meter increments! 168 W 'N 68 30'N! 166 W 164 W 162 W 160 W 158 W Locations of the Klondike, Burger, and Statoil study areas in the northeastern Chukchi Sea. Also shown are the locations of the survey lines and the buffer zones used for examining the historical data. Chukchi Seabird Synthesis 4

, and salinity (psu) in the")
.")
17 Methods Statoil Klondike Burger Sep/Oct Aug/Sep Jul/Aug Figure 2. Vertical sections of temperature ( C), and salinity (psu) in the Klondike and Burger study areas, 2008 (Weingartner et al. 2011). 5 Chukchi Seabird Synthesis

 and salinity (psu) in the")
.")
18 Methods Statoil Klondike Burger Sep/Oct Aug/Sep Jul/Aug Figure 3. Vertical sections of temperature ( C) and salinity (psu) in the Klondike and Burger study areas, 2009 (Weingartner et al. 2011). Chukchi Seabird Synthesis 6
19 Methods y g Statoil Klondike Burger Sep/Oct Aug/Sep Jul/Aug Figure 4. Vertical sections of temperature ( C) and salinity (psu) in the Klondike and Burger study areas, 2010 (Weingartner et al. 2011). 7 Chukchi Seabird Synthesis
20 Methods Statoil Klondike Burger Statoil Klondike Burger g g g p Statoil Klondike Burger Statoil Klondike Aug/Sep Aug/Sep Jul/Aug Jul/Aug Burger Figure 5. Vertical sections of temperature ( C) and salinity (psu) in the Klondike, Burger, and Statoil study areas, 2010 (Weingartner et al. 2011). Chukchi Seabird Synthesis 8
21 Methods intruding from the western edge of the Klondike study area (0 to ~30 km along the X-axis), whereas the surface layer over the northeastern corner of Klondike and most of Burger (~50 km to ~180 km along the X-axis) remained cold, low-salinity meltwater, with the 2 areas separated by warmer and saltier filaments. In September/October, the front between the 2 water masses became very distinct and centered near the zone between the 2 study-area boxes (Figure 2, bottom panel). In contrast, the study area in 2009 was ice-free at the beginning of sampling in August, and the water structure was nearly homogenous throughout both study areas during the entire study period. In July/August, water in the western part of the Klondike study area (0 to ~25 km along the X-axis) was warmer and more saline than water in the eastern half of Klondike and in Burger (Figure 3, top panel), although both study areas showed stratification and water temperatures that were similar and 4 7 C warmer than in In August/September, stratification was consistent across both study areas, with both the thermocline and halocline located m below the surface (Figure 3, middle panel), and, by September/ October, the hydrography was homogenous throughout both study areas and showed little stratification. The water-mass that covered all of Klondike and most of Burger was essentially uniform in temperature and salinity (Figure 3, bottom panel). A filament of cold, low-salinity meltwater remained at the surface in the northeastern corner of Burger (~150 km to 200 km along the X-axis), probably indicating the edge of a larger pool of meltwater over Hanna Shoal. In 2010, the timing and strength of intrusion of Bering Sea water appeared intermediate between the patterns seen in 2008 and The water structure over Klondike became warmer, less saline, and less stratified in August/September than in July/August, whereas the water over Burger and Statoil was stratified during the entire study period. In July/August, water in the western part of the Klondike study area (0 to ~25 km along the X-axis) was warmer and more saline than water in the eastern half of Klondike and in Burger (Figure 4, top panel). Water in Statoil was colder than in Klondike or Burger (Figure 5, top 2 panels), although all 3 study areas showed similar stratification. A salty pool of winter water lay across the bottom of much of Klondike and was colder and saltier in Burger and Statoil. In August/September, there was little stratification in the western half of Klondike. Stratification developed abruptly at a front on the eastern edge of Klondike (~60 km on the X-axis) and this strong stratification was consistent across Burger, with both the thermocline and halocline located ~20 m below the surface (Figure 4, middle panel). Statoil showed a structure intermediate between the other 2 study areas, with stratification that was strongest on the eastern edge and weakest on the western edge (Figure 5, bottom 2 panels). By this time, the pool of cold, salty winter water at the bottom was present only in Burger and the eastern half of Statoil. In September/October, water remained stratified over Burger, with tongues of warm water intruding along the thermocline on both the western and eastern edges of the study area (Figure 4, bottom panel). There was no oceanographic sampling over Klondike or Statoil during September/October Data Collection We conducted seabird surveys during 3 seasons covering the entire open-water period of the northeastern Chukchi Sea (Figure 6): late summer (hereafter Jul/Aug ), early fall (hereafter Aug/Sep ), and late fall (hereafter Sep/Oct ). These surveys were designed to quantify the distribution, abundance, and species composition of the seabird community within the 3 study areas. The surveys were conducted as consecutive 10-min counting periods (hereafter, transects) when the ship was moving along a straight-line course at a minimal velocity of 9.3 km/h (5 kt; Tasker et al. 1984, Gould and Forsell 1989). We collected data 9 12 h/day during daylight hours, weather and ice conditions permitting. Surveys generally were stopped when sea height was Beaufort 6 (seas ~2 3 m [~6 10 ft]) or higher, although we occasionally continued to sample if observation conditions still were good (e.g., if seas were at the lower end of Beaufort 6 and we were traveling with the wind). One observer stationed on the bridge of the vessel recorded all birds seen within a radius of 300 m in a 90 arc from the bow to the beam on one side of the ship (the count zone) and located and identified seabirds with 10 9 Chukchi Seabird Synthesis
22 Methods July/August August/September September/October Jul 18 Aug 19 Aug 22 Sep 22 Sep 12 Oct YEAR Aug 30 Aug 4 Sep 22 Sep 23 Sep 17 Oct Aug 27 Aug 28 Aug 19 Sep 1 Oct 8 Oct July August September October MONTH Figure 6. Timing of boat-based surveys for marine birds in the Klondike, Burger, and Statoil study areas, 2008, 2009, and binoculars. For each bird or group of birds, we recorded: species (to lowest possible taxon); total number of individuals; distance from the observer when sighted (in categories; 0 50 m [0 164 ft], m [ ft], m [ ft], m [ ft], m [ ft]); radial angle of the observation from the bow of the ship (to the nearest 1 ); number in each age-class (juvenile, subadult, adult, unknown age), if possible; habitat (air, water, flotsam/jetsam, ice); and behavior (flying, sitting, swimming, feeding, comfort behavior, courtship behavior, other). All birds on the water and in the count zone were counted, taking care to avoid recounting the same individuals. For flying birds, however, observers conducted scans for them ~1 time/min (the exact frequency varied with ship s speed) and recorded an instantaneous count (or snapshot ) of all birds flying within the count zone. This snapshot method reduces the bias of overestimating the density of flying birds (Tasker et al. 1984, Gould and Forsell 1989). Only those flying birds that entered the count zone from the sides or front were counted; flying birds that entered from behind the ship (i.e., an area that already had been surveyed) were not counted to avoid the possibility of counting ship-following birds. Observations of all birds were entered directly into a computer connected to a global positioning system (GPS) with DLog software (R. G. Ford Consulting, Portland, OR) in 2008 and TigerObserver software (TigerSoft, Las Vegas, NV) in 2009 and 2010; these programs timestamped and geo-referenced every observation entered in real time. In 2008, the primary GPS connected to the data-collection computer lost communication with satellites on 3 occasions (a total of 74 min during 2 d), resulting in missing locations for observations and transect cutoff points. To fill these GPS data gaps, we used the position track from the ship s meteorological station, which used a different GPS, by linking the time stamps of the records. In 2009 and 2010, we Chukchi Seabird Synthesis 10
23 Methods patched a few similar gaps in the location record (a total of 42 min during 2 d) by interpolating the ship s location from the last known waypoint using the ship s speed and the time of the observation. Data Analysis The analyses of densities, species-richness, and species-composition used data collected only within the boundaries of the 3 study-area boxes (Figure 1). Because the historical data set covered a much larger area, we included data collected opportunistically within ~90 km (50 NM) of each study area to increase our sampling area when making comparisons with the historical data (Figure 1). Data collected when traveling outside of the study-area boxes were recorded following the same sampling protocol as data collected when sampling within the study area. DENSITY CALCULATIONS AND ANALYSES We calculated densities (birds/km²) of birds within each study area from the combined counts of birds sitting on the water and snapshot counts of flying birds. The area for each transect was determined from the strip width (usually 300 m, unless limited by fog to 200 m) and the transect length (calculated from the start and stop coordinates recorded by the GPS). We aggregated transects with a minimal length of 2 km and a minimal area of 0.4 km² to calculate the average density for each survey line. Survey lines were 9 55 km (5 30 NM) long and were considered long enough to be robust to autocorrelation in seabird distribution (Haney 1991, Yen et al. 2004). We used the line densities to calculate means and variances in density in each study area in each season and year. This approach provides an index to bird abundance that can be used for inference about spatial and temporal trends and is comparable to the historical data from this area. We calculated log-normal, z-based, 2-sided 95% confidence intervals for the estimates of density with equations in Buckland et al. (2001: 77). Eight focal species were selected for statistical analyses from among the 10 most-abundant species in every year. These 8 focal species represented a variety of foraging methods, thereby providing an overview of functional ecological groups of the seabird community. We used repeated-measures ANOVAs in SPSS (2009) to examine differences between the Klondike and Burger study areas, among seasons, and among years for each species. The models included the additive effects of STUDY AREA and YEAR and the interactions between these main effects. We specified SEASON as the repeated measure. Repeated-measures ANOVAs in SPSS allow for unbalanced designs (SPSS 2009), as we had in this study because we did not sample in Klondike in Sep/Oct We examined the seasonal trend in Statoil in 2010 but did not include Statoil in the repeated-measures analysis because it was surveyed only twice and only in In all statistical tests, the level of significance ( ) was We also used the geo-located observations to generate maps of distribution and abundance for all birds combined and for individual species of interest. First, we assigned the density value of each transect to its respective transect centroid coordinate. We then used the inverse-distanceweighted (IDW) interpolation technique of the Spatial Analyst extension of ArcMap GIS software (Environmental Systems Research Institute, Inc., Redlands, CA) to generate contours of similar density, based on the mean density for each grid-cell centroid. To conduct the IDW analysis, we first overlaid a 1,000 1,000-m grid over the study area. The IDW interpolation technique calculated the distance-weighted mean density of up to 9 centroids within 7,000 m of each 1,000-m pixel in the study area. This analysis produced contoured portrayals of bird densities on maps for each of the 8 focal species within each of the 3 study areas. COMMUNITY ANALYSES We summarized seabird species-richness and species-composition by study area, season, and year (Magurran 2004). We aggregated individual species into 6 taxonomic species-groups prior to analysis: waterfowl (family Anatidae, including geese, swans, and ducks), loons (family Gaviidae), tubenoses (family Procellariidae, including fulmars and shearwaters), phalaropes (unusual shorebirds of the family Scolopacidae that spend most of their lives in water), larids (families Laridae and Stercorariidae, including gulls, terns, and jaegers), 11 Chukchi Seabird Synthesis
24 Methods and alcids (family Alcidae, including murres, guillemots, murrelets, auklets, and puffins). We used multivariate analyses and descriptive statistics to explore the changes in structure of the seabird community among seasons, study areas, and years. Data were grouped into sample units by study area, season, and year. The overall similarity in the species-composition of samples is determined by their closeness in the cluster dendrogram or ordination. This approach is useful for detecting patterns in overall community structure and similarities among species assemblages (Blanchard et al. 2010). We used cluster analysis and ordination (where new axes that summarize community structure are derived and can be plotted) for analysis of the seabird data from all study areas. These procedures consisted of 4 steps: 1. We calculated the Bray Curtis measure of similarity among Study Area*Season*Years (hereafter, samples ) to be classified. 2. We sorted the matrix of Bray-Curtis similarity coefficients to arrange the samples in a dendrogram (cluster analysis) and in a 2-dimensional plot (ordination). 3. We determined groups of samples within the dendrogram or ordination based on the agreement of the 2 multivariate procedures. 4. We determined the dominant species assemblages composing each sample. Data reduction prior to calculation of similarity coefficients consisted of eliminating observations that could not be identified to at least species-group level. The Bray Curtis coefficient (Bray and Curtis 1957) was used to calculate similarity matrices for cluster analysis and ordination and is defined as: where y ij = the jth species of sample i and y kj = the jth species of sample k. The Bray Curtis coefficient is widely used in marine benthic studies (A. Blanchard, pers comm.), and we have adapted it for use in this seabird study. For the present study, the Bray Curtis coefficient was used to calculate similarity matrices for natural logarithmtransformed density data [ln(bird km-² + 1)]. Cluster analysis is useful to summarize data by sorting samples into natural groupings based on their attributes, and the results are summarized in a dendrogram (Johnson and Wichern 1992). Similarity among sample groups is inferred from a dendrogram by interpreting the joining of branches in the plot. We constructed a dendrogram using a group-average agglomerative hierarchical cluster analysis (Clifford and Stephenson 1975) on STUDY AREA*SEASON*YEAR samples as entities to be classified and species-group density as their attributes. The grouping of samples into patterns reflecting species-composition similarities were interpreted as ecologically meaningful groupings. Non-metric multidimensional scaling (nmds; Kruskal and Wish 1978, Clarke and Green 1988) is used extensively to detect ecological patterns in species-composition data from the marine environment (e.g., Gray et al. 1988, Agard et al. 1993, Clarke 1993). As described by Gray et al. (1988)... nmds attempts to construct a map of the sites in which the more similar... samples,... in terms of species abundances, are nearer to each other on the map. The extent to which the relationships can be adequately represented in a 2-dimensional map (rather than 3 dimensions or higher) is summarized by a stress coefficient that should be 0.15 for a good fit (Clarke and Ainsworth 1993). Agreement in the groupings of samples in the cluster and nmds ordination provides evidence that the sample groupings represent a reasonable summary of the multidimensional relationships of the data. Cluster analysis and nmds analyses were conducted with the package vegan (Oksanen et al. 2011) in R. COMPARISON WITH HISTORICAL DATA We compared our data with historical data from the same area collected in The historical data were collected from a variety of ships by numerous observers and are stored in the Chukchi Seabird Synthesis 12
25 Results NPPSD (USGS 2010). Across all years, most transects were min in duration (~3 4.5 km [ NM] in length), and other important attributes of the sampling methods (e.g., transect width, exclusion of ship-following birds) were similar to methods used in this study. To increase sample sizes for comparison with data from this study, we used all historical transects that occurred within a ~ km (30 50-NM) buffer around each study box (Figure 1). We compared historical species-richness, species-composition, and total density in each study area with the data. Results Within the 3 study areas, we sampled a total of 6,040 km (3,260 NM) of transects in 2008; 5,144 km (2,772 NM) in 2009; and 5,531 km (2,987 NM) in In 2008, sampling effort was greater in Klondike (846 1,329 km/cruise [ NM/ cruise]) than in Burger (716 1,071 km/cruise [ NM/cruise]), especially during the Jul/Aug cruise, because Klondike generally had less ice cover than Burger did. In 2009, we did not encounter any ice in the study areas during the sampling period and sampling effort was similar in both study areas, with km ( NM) surveyed within each study area/cruise. In 2010, we added the Statoil study area and encountered a prolonged period of rough seas during the Jul/Aug cruise that limited sampling to km ( NM) within each of the 3 study areas. Sampling effort for the remainder of 2010 was similar to previous years, with km ( NM) surveyed within each study area/cruise. Patterns of Abundance and Distribution Seabirds were more abundant in the study areas in 2009 than they were in 2008 or 2010, although we recorded the fewest species in In 2008, we recorded 4,650 individuals of 31 species during surveys within the 2 study areas combined; we also recorded 2 other species only off-transect (Table 1). In 2009, we recorded 31,579 individuals of 24 species on transect within the 2 study areas combined; we saw no other species only off-transect. In 2010, we added the Statoil study area and recorded a total of 10,827 individuals of 29 species on transect within the 3 study areas combined; we also recorded 4 other species only off-transect (Table 2). ALCIDS Alcids were the most abundant species-group in 2008 and 2010, and were the second-mostabundant group in Densities of alcids in 2008 were significantly higher in Klondike than in Burger during all 3 seasons, whereas densities in 2009 were higher in Klondike than in Burger in Sep/Oct but higher in Burger than in Klondike in Jul/Aug and Aug/Sep (Figure 7, Tables 3 5). In 2010, densities of alcids as a group were similar among study areas, but individual species densities did differ among study areas. Of the 11 species of alcids recorded on transect within the study areas over the 3 years, Crested Auklets, Least Auklets, and Thick-billed Murres were abundant enough to model trends in distribution and abundance. Crested Auklets were the most abundant species recorded in all 3 years of the study (Figure 7, Tables 3 5). The maximal density in 2009 was nearly 7 times the maximal density in 2008 and 3 times that in Densities differed significantly among seasons and between study areas in all 3 years (P < for STUDY AREA*SEASON*YEAR): Crested Auklets were more abundant in Klondike than in Burger in 2008, more abundant in Burger than in Klondike in 2009, and not significantly different among study areas in In 2008, densities were low in both study areas in Jul/Aug and Aug/Sep and highest in Sep/Oct, especially in Klondike. In 2009, the seasonal pattern of abundance differed significantly between the 2 study areas. Densities in Klondike were low in Jul/Aug and highest in Aug/Sep and Sep/Oct, whereas densities in Burger were highest in Jul/Aug and Aug/Sep and declined in Sep/Oct. In 2010, there was no strong seasonal trend in abundance, and densities were similar among study areas in Jul/Aug and Aug/Sep. The only consistent spatial pattern for the distribution of Crested Auklets in both 2008 and 2009 was the abundance of Crested Auklets in Klondike and their near-absence from Burger in Sep/Oct (Figure 8). Patterns in 2009 indicated that 13 Chukchi Seabird Synthesis
26 Results Table 1. Species of seabirds identified during boat-based surveys in the northeastern Chukchi Sea, by study area and season. Species identified on-transect within the study area are designated as X8, X9 and/or X10, for 2008, 2009, and 2010, respectively. Species identified only off-transect in a given year are designated as OT8, OT9, and, OT10 for 2008, 2009, and 2010 respectively. Species seen only on-transect and only within the 30-NM buffer zone (used in the historical comparisons) are designated as B8, B9, B10, for 2008, 2009, and 2010 respectively. Species identified in the historical dataset within the study area or buffer zone, available from the North Pacific Pelagic Seabird Database, are designated as H. Study area/season Klondike Burger Species-group/species Late summer Early fall Late fall Late summer Early fall Late fall WATERFOWL Spectacled Eider X9 OT9 OT10 King Eider X8 X8 X8, OT10 X8, X10 Common Eider X8 X10 White-winged Scoter OT8 X8, OT10 Long-tailed Duck X8 X9, H X8, X9, B10 B9, H X8, X9, X10, H X8, B9, X10, H LOONS Red-throated Loon X8 Pacific Loon X8, X9, X10 X8, X9 X8, X9, X10 X8, X9, OT10 Arctic Loon H H H Common Loon H Yellow-billed Loon X8, X9 X8, X9 X8, X9, OT10 OT9 TUBENOSES Northern Fulmar X8, X9, X10 X8, X9, X10, H X8, X9 X8, X9, X10 X8, X9, X10 X8, X9, X10 Short-tailed Shearwater X8, X9, X10 X8, X9, X10, H X8, X9, B10, H X9, X10 X8, X9, X10, H X8, X9, X10 PHALAROPES Red-necked Phalarope X9, X10 X8, X9, X10 X8, X9 X9, X10 X8, X9, X10 X9 Red Phalarope X8, X9, X10, H X8, X10, H X8, X9 X9, OT10, H X8, X9, X10, H X9, X10 LARIDS Black-legged Kittiwake X8, X9, X10, H X8, X9, X10, H X8, X9, B10, H X8, X9, X10, H X8, X9, X10, H X8, X9, OT10, H Ivory Gull H H H X8, H Sabine's Gull X8, OT9, X10, H X8, X9, X10, H X8, X9 X8, OT9, X10, H OT8, X10 X9 Chukchi Seabird Synthesis 14
27 Results Table 1. Continued. Study area/season Klondike Burger Species-group/species Late summer Early fall Late fall Late summer Early fall Late fall LARIDS (cont'd.) Ross's Gull H OT9, H X8, X9, X10, H Herring Gull X8, H X9, H X8 X9, H X9, X10 X8 Glaucous-winged Gull OT8 Glaucous Gull X8, X10, H X8, X9, X10, H X8, X9, B10 X8, X9, X10, H X8, X9, X10, H X8, X9, X10, H Arctic Tern B8, H X8, X10 X9, X10, B8 OT8, X9 Pomarine Jaeger X8, X9, X10, H X8, X9, X10, H X8, X9 X8, X9, X10, H X8, X9, X10 Long-tailed Jaeger X9, X10, H OT8, OT10, H X9, H OT8, X10 Parasitic Jaeger X8, H X8, OT10, H X8, H X10, B8, H ALCIDS Dovekie X8 X8 H X8, X10 Common Murre X8, B10, H X9, X10, H X8, X9 B10, H X9, X10 X9 Thick-billed Murre X8, X9, X10, H X8, X9, X10, H X8, X9, H X8, X9, X10, H X9, X10, B8 X8, X9, X10 Black Guillemot X8, X10, H X8, X10, H B8, H X8, OT10 Pigeon Guillemot X8 X8 Kittlitz's Murrelet X10, H X9, X10, H X8, B9 X10, B9 X9 Ancient Murrelet X10 OT10 X10 X10 Parakeet Auklet X10, H X8, X9, X10, H X10, H X8, X10 Least Auklet X8, X9, X10 X8, X9, X10, H X8, X9, B10, H X9, X10, H X8, X9, X10 X8, X9, X10 Crested Auklet X8, X9, X10 X8, X9, X10, H X8, X9, B10, H X9, X10 X8, X9, X10, H X8, X9, X10 Horned Puffin X8, X9, X10, H X9 X8, X10, OT9 X10 Tufted Puffin X8, X9, X10, H OT9 X8 X10 15 Chukchi Seabird Synthesis
28 Results Table 2. Species of seabirds identified during boat-based surveys in the northeastern Chukchi Sea, in the Statoil study area by season. Species identified on-transect within the study area are designated as X10, for Species identified only off-transect are designated as OT10 for Species identified in the historical dataset within the study area or buffer zone, available from the North Pacific Pelagic Seabird Database, are designated as H. Study area/season Statoil Species-group/species Late summer Early fall Late fall WATERFOWL Spectacled Eider King Eider Common Eider OT10 White-winged Scoter Long-tailed Duck X10, H X10, H H LOONS Red-throated Loon X10 Pacific Loon X10 Arctic Loon H Common Loon Yellow-billed Loon TUBENOSES Northern Fulmar X10 X10 Short-tailed Shearwater X10 X10, H PHALAROPES Red-necked Phalarope X10 X10 Red Phalarope OT, H X10 LARIDS Black-legged Kittiwake X10, H X10, H Ivory Gull H Sabine's Gull X10 Ross's Gull H H OT10, H Herring Gull H X10 Glaucous-winged Gull Glaucous Gull X10, H X10, H H Arctic Tern Pomarine Jaeger X10, H X10 Long-tailed Jaeger H Parasitic Jaeger H H Chukchi Seabird Synthesis 16
29 Results Table 2. Continued. Study area/season Statoil Species-group/species Late summer Early fall Late fall ALCIDS Dovekie X10, H Common Murre H X10 Thick-billed Murre X10, H X10 Black Guillemot X10, H H Pigeon Guillemot Kittlitz's Murrelet X10 Ancient Murrelet X10 Parakeet Auklet X10 X10 Least Auklet X10, H X10 OT10 Crested Auklet X10 X10, H Horned Puffin X10 X10 Tufted Puffin X10 Crested Auklets were concentrated primarily in eastern Klondike in Jul/Aug, throughout Klondike in Aug/Sep, and in western Klondike in Sep/Oct, whereas they were concentrated in western Burger in all 3 seasons. In 2010, Crested Auklets were distributed throughout all 3 study areas in Jul/Aug and Aug/Sep, with densities following a similar pattern of spatially even distribution in Burger in Sep/Oct (Figure 8). Least Auklet densities differed significantly among seasons and among study areas in all 3 years (P < for STUDY AREA* SEASON*YEAR). Densities of Least Auklets were higher in Klondike than in Burger in all 3 seasons of 2008 and in Sep/Oct 2009, higher in Burger than in Klondike in Jul/Aug 2009, and similar between study areas in Jul/Aug 2010 and Aug/Sep 2009 (Figure 7, Tables 3 5). In 2010, densities were higher in Statoil than in both Burger and Klondike in Jul/Aug but higher in Burger than in both Klondike and Statoil in Aug/Sep In all 3 years, the seasonal pattern of abundance differed substantially among study areas. In 2008, densities of Least Auklets in Klondike were lowest in Jul/Aug, highest in Aug/Sep, and intermediate in Sep/Oct, whereas densities in Burger were zero in Jul/Aug and nearly zero in both Aug/Sep and Sep/Oct. In 2009, densities of Least Auklets in Klondike increased from Jul/Aug to Sep/Oct, whereas densities in Burger decreased from Jul/Aug to Sep/Oct. In 2010, densities increased sharply in Burger, increased moderately in Klondike, and remained similar in Statoil between Jul/Aug and Aug/Sep. The patterns of distribution of Least Auklets were strongest in 2008, with birds concentrating in the northeastern half of Klondike in Jul/Aug and Aug/Sep but in the southwestern half in Sep/Oct (Figure 9). In 2009, there was a shift in overall distribution from Burger in Jul/Aug to Klondike in Sep/Oct, whereas there was no apparent spatial pattern of distribution within either study area in Aug/Sep. In 2010, there was a shift southward in concentration from Statoil in Jul/Aug to Burger in Aug/Sep. We have no data to evaluate the spatial pattern in Sep/Oct Thick-billed Murre densities were consistently higher in Klondike than in Burger or Statoil and were lowest in Sep/Oct in all years (P < for STUDY AREA and SEASON; Figure 7, Tables 3 5). In 2008, densities in Klondike were highest in Jul/Aug and low in Aug/Sep and Sep/Oct, whereas densities in Burger were extremely low in all 3 seasons. In 2009, densities of Thick-billed Murres in Klondike were low in Sep/Oct, high in Aug/Sep, and intermediate in Jul/Aug, whereas densities in Burger again were extremely low in all 3 seasons. In 2010, densities 17 Chukchi Seabird Synthesis
30 Results (12.3) (30.7) (0.7) * * * * DENSITY (BIRDS/KM²) Thick-billed Murres Least Auklets Crested Auklets Jul/Aug Aug/Sep Sep/Oct Jul/Aug Aug/Sep Sep/Oct * * Jul/Aug Aug/Sep Sep/Oct Figure 7. Mean density (birds/km²) of Crested Auklets, Least Auklets, and Thick-billed Murres on transect in the Klondike, Burger, and Statoil study areas in 2008, 2009, and 2010, by study area and season. Error bars represent 95% confidence intervals. Asterisks indicate no data. Chukchi Seabird Synthesis 18
31 Results Table 3. Estimated densities (birds/km²) of the 8 focal species of seabirds counted during boat-based marine surveys in the central Chukchi Sea, by study area and season, Values in parentheses are 95% confidence intervals. Study area/season Species-group/ Klondike Burger species July/August August/September September/October July/August August/September September/October PHALAROPES ( ) 0.08 ( ) ( ) 0.0 (0) 0.14 ( ) 0.0 (0) TUBENOSES Northern Fulmar ( ) Short tailed Shearwater ( ) ( ) ( ) ( ) ( ) ( ) 0.0 (0) ( ) ( ) 0.01 ( ) ( ) LARIDS Black legged Kittiwake ( ) Glaucous Gull ( ) ( ) ( ) ( ) ( ) ( ) ( ) ( ) ( ) ( ) ( ) ALCIDS Thick billed Murre ( ) Least Auklet ( ) Crested Auklet ( ) ( ) ( ) ( ) ( ) ( ) ( ) ( ) 0.0 (0) 0.0 (0) 0.0 (0) ( ) ( ) ( ) ( ) ( ) 19 Chukchi Seabird Synthesis
32 Results Table 4. Estimated densities (birds/km²) of the 8 focal species of seabirds counted during boat-based marine surveys in the central Chukchi Sea, by study area and season, Values in parentheses are 95% confidence intervals. Study area/season Klondike Burger Species-group/species Late summer Early fall Late fall Late summer Early fall Late fall PHALAROPES 0.12 ( ) ( ) ( ) ( ) ( ) ( ) TUBENOSES Northern Fulmar ( ) Short tailed Shearwater ( ) ( ) ( ) ( ) ( ) ( ) ( ) ( ) 0.4 ( ) ( ) ( ) LARIDS Black legged Kittiwake ( ) Glaucous Gull 0.0 (0) ( ) ( ) ( ) 0.06 ( ) 0.02 ( ) ( ) ( ) ( ) ( ) ( ) ALCIDS Thick billed Murre 0.08 ( ) Least Auklet ( ) Crested Auklet ( ) ( ) ( ) ( ) 0.02 ( ) ( ) ( ) ( ) 0.25 ( ) ( ) ( ) ( ) ( ) ( ) ( ) ( ) Chukchi Seabird Synthesis 20
33 Results Table 5. Estimated densities (birds/km²) of the 8 focal species of seabirds counted during boat-based marine surveys in the central Chukchi Sea, by study area and season, Values in parentheses are 95% confidence intervals. Study area/season Klondike Burger Statoil Speciesgroup/species Late summer Early fall Late fall Late summer Early fall Late fall Late summer Early fall Late fall PHALAROPES ( ) ( ) ( ) ( ) ( ) ( ) ( ) TUBENOSES Northern Fulmar ( ) ( ) ( ) ( ) ( ) ( ) ( ) Short tailed Shearwater ( ) ( ) 0.01 ( ) ( ) ( ) ( ) ( ) LARIDS Black legged Kittiwake ( ) ( ) ( ) ( ) 0.0 (0) ( ) ( ) Glaucous Gull ( ) ( ) ( ) ( ) ( ) ( ) ( ) ALCIDS Thick billed Murre ( ) ( ) ( ) ( ) ( ) ( ) ( ) Least Auklet ( ) ( ) 0.04 ( ) 0.55 ( ) ( ) 0.21 ( ) 0.23 ( ) Crested Auklet ( ) ( ) ( ) ( ) ( ) ( ) ( ) 21 Chukchi Seabird Synthesis
34 Results of Thick-billed Murres in Klondike were high in Jul/Aug and low in Aug/Sep, and densities in Burger and Statoil were lower than densities in Klondike but followed a similar trend. Densities in Burger were near zero in Sept/Oct. The spatial pattern of distribution suggested higher densities in the southern half of Klondike in Jul/Aug 2008, Aug/Sep 2009 and 2010, and Sep/Oct 2008 and 2009, whereas there was no apparent spatial pattern of distribution within either Burger or Statoil (Figure 10). Of the other 9 species of alcids recorded, Ancient Murrelets were the most abundant, despite occurring only in 2010 and only on the Aug/Sep and Sep/Oct cruises (Appendices B D). They were present in all 3 study areas in Aug/Sep and were most abundant in Statoil. Parakeet Auklets were seen in Klondike in Aug/Sep of all 3 years; in Burger in Sep/Oct 2008 and 2010 and in Aug/Sep 2010; and in Statoil in Aug/Sep and Sep/Oct Common Murres occurred primarily in Klondike in Jul/Aug and Sep/Oct in 2008, in both Klondike and Burger in Aug/Sep and Sep/Oct in 2009, and in all 3 study areas in Aug/Sep In all 3 years, Tufted Puffins and Horned Puffins were seen primarily in Klondike in Jul/Aug. Kittlitz s Murrelets were rare in all 3 years and may have occurred in Klondike in Sep/Oct 2008 (we believe that the 5 unidentified murrelets were of this species), Aug/Sep 2009, and Jul/Aug and Aug/Sep 2010; and in Burger in Sep/Oct 2009 and Sep/Oct Black Guillemots and Dovekies also were seen in both Klondike and Burger, but only in low numbers and only in 2008 and Pigeon Guillemots were seen in both study areas and only in Jul/Aug TUBENOSES Tubenoses were the second-most-abundant species-group in 2008 and 2010 and the most abundant species-group in 2009, primarily because of large flocks of Short-tailed Shearwaters moving through Klondike in Aug/Sep (Figure 11). This species-group includes both non-breeding seasonal migrants and Northern Hemisphere residents. For example, Short-tailed Shearwaters migrate to the Bering and Chukchi seas from the Southern Hemisphere to feed during their non-breeding season, whereas Northern Fulmars are Northern Hemisphere breeders that nest in the Chukchi Sea and visit the study area during the open-water season. Short-tailed Shearwaters were the secondmost-abundant species in all 3 years of the study. The maximal density in 2009 was 30 times the maximal density in 2008 and 16 times the maximal density in 2010 (Figure 11, Tables 3 5). Short-tailed Shearwaters occurred in both study areas in Aug/Sep and Sep/Oct in 2008, in both study areas and in all 3 seasons in 2009, and in all 3 study areas in Jul/Aug and Aug/Sep in They generally were more abundant in Klondike than in Burger in 2008 and 2009 and occurred in similar, but lower, densities in Jul/Aug and Aug/Sep The highest densities were recorded in Statoil in Jul/Aug, and there was no significant difference in densities among the 3 study areas in Aug/Sep. In 2008, densities were lowest in Jul/Aug and high in Aug/Sep and Sep/Oct, when they are preparing to move from summer feeding areas back to breeding areas in the Southern Hemisphere. In 2009, densities were low at all times except for a large pulse of birds in Klondike in Aug/Sep. In 2010, densities were higher in Aug/Sep than in Jul/Aug, and we have no data to evaluate the trend in Sep/Oct. The distribution of Short-tailed Shearwaters tended to be clumped in 2008 and 2009, whereas it was more uniform across all 3 study areas in Aug/Sep 2010 (Figure 12). In 2008, they tended to occur in the northeastern half of Klondike and the southwestern half of Burger when they were present. In 2009, they concentrated in the western halves of both Klondike and Burger in Jul/Aug, were most abundant in the western half of Klondike in Aug/Sep, and concentrated in the western half of Klondike but the eastern half of Burger in Sep/Oct (Figure 12). In 2010, they concentrated in the western half of Statoil in Jul/Aug and were scattered across all 3 study areas in Aug/Sep, whereas they occurred in Burger in very low densities in Sep/Oct. Northern Fulmars were widespread, occurring in all study areas and in all 3 seasons during all years; their seasonal patterns of density did not differ significantly among the 3 study areas (P = for STUDY AREA*SEASON). Northern Fulmars were significantly more abundant in Klondike than in Burger in 2008 (Figure 11), whereas densities did not differ significantly Chukchi Seabird Synthesis 22


35 July/August August/September September/October Crested Auklet Density (birds/km 2 ) No data Outside study area 2009 Statoil Study Area km Burger Study Area 4 Klondike Study Area Point Franklin Wainwright! UTM 3 NAD 1983 Depth in 10-meter increments km 2010 Figure 8. Estimated densities (birds/km 2 ) of Crested Auklets recorded on transect in the Klondike, Burger, and Statoil study areas in 2008, 2009, and 2010, by season and year.


")

36 July/August August/September September/October Least Auklet Density (birds/km 2 ) No data Outside study area 2009 Statoil Study Area km Burger Study Area 4 Klondike Study Area Point Franklin Wainwright! UTM 3 NAD 1983 Depth in 10-meter increments km 2010 Figure 9. Estimated densities (birds/km 2 ) of Least Auklets recorded on transect in the Klondike, Burger, and Statoil study areas in 2008, 2009, and 2010, by season and year.


 of")
37 July/August August/September September/October Thick-billed Murre Density (birds/km 2 ) No data Outside study area 2009 Statoil Study Area km Burger Study Area 4 Klondike Study Area Point Franklin Wainwright! UTM 3 NAD 1983 Depth in 10-meter increments km 2010 Figure 10. Estimated densities (birds/km 2 ) of Thickbilled Murres recorded on transect in the Klondike, Burger, and Statoil study areas in 2008, 2009, and 2010, by season and year.
38
39 Results * * (98.6) DENSITY (BIRDS/KM²) 0 * * Northern Fulmars Short-tailed Shearwaters Phalaropes 0 Jul/Aug Aug/Sep Sep/Oct 0 Jul/Aug Aug/Sep Sep/Oct SEASON 0 * * Jul/Aug Aug/Sep Sep/Oct Figure 11. Mean density (birds/km²) of phalaropes, Short-tailed Shearwaters, and Northern Fulmars on transect in the Klondike, Burger, and Statoil study areas in 2008, 2009, and 2010, by study area and season. Error bars represent 95% confidence intervals. Asterisks indicate no data. 27 Chukchi Seabird Synthesis
40 Results between the 2 study areas in 2009 or 2010 (Figure 11; Tables 3 5).The seasonal abundance of Northern Fulmars differed among years, in that they were most abundant in Aug/Sep in 2008 and in Jul/Aug in 2009 but were low in all 3 study areas in Jul/Aug and Aug/Sep in Northern Fulmars were distributed across the entire Klondike study area in all 3 years (Figure 13) and across the entire Burger study area in 2009 and most of 2010, whereas they occurred primarily in the western half of Burger in 2008 and in Sep/Oct in LARIDS Larids were the third-most-abundant species group recorded during surveys. This group included gulls, terns, and jaegers. Of the 11 species of larids recorded on transect, Black-legged Kittiwakes and Glaucous Gulls were abundant enough in every year to examine patterns in distribution and abundance. Black-legged Kittiwakes were widespread, occurring in both study areas and in all 3 seasons during 2008 and 2009 (Figure 14, Tables 3 5). In 2010, Black-legged Kittiwakes occurred in all 3 study areas and in Jul/Aug and Aug/ Sep but were absent from Burger in Sep/Oct. Densities of Black-legged Kittiwakes differed significantly among seasons and between study areas in both years (P < for STUDY AREA*SEASON). Seasonal patterns differed more strongly between study areas in 2008, when densities were higher in Klondike in Jul/Aug and Sep/Oct but higher in Burger in Aug/Sep. In contrast, densities in 2009 were low and similar between study areas in Jul/Aug, highest and similar in Aug/Sep, and intermediate but higher in Klondike than in Burger in Sep/Oct. In 2010, seasonal patterns were similar to 2009, with low densities in Jul/Aug and high densities and no significant differences in density among the 3 study areas in Aug/Sep. There was little evidence of a spatial pattern in the distribution of Black-legged Kittiwakes within the study areas in any season or year (Figure 15). Glaucous Gulls also were widespread, occurring in all study areas and in all seasons surveyed except for Klondike in Jul/Aug 2009 (Figure 14, Tables 3 5). Densities of Glaucous Gulls differed significantly among seasons and between study areas in 2008 and 2009 (P 0.01 for STUDY AREA*SEASON*YEAR), and the seasonal pattern was similar among years. In all 3 years, densities of Glaucous Gulls in Klondike, Burger, and Statoil (in 2010) increased from Jul/Aug to Aug/Sep. Densities continued to increase from Aug/Sep to Sep/Oct in Klondike in 2008 and 2009 and in Burger in 2009 and 2010, whereas they declined in Burger during that period in There were no strong spatial patterns in the distribution of Glaucous Gulls within the study areas in any season or year (Figure 16). Of the other 9 species of larids, Sabine s Gulls, Arctic Terns, Pomarine Jaegers, and Parasitic Jaegers were most common in Aug/Sep, Ross s Gulls were recorded only in Burger and only in Sep/Oct, and Herring Gulls occurred primarily in early and Sep/Oct (Appendices B D). Sabine s Gulls and jaegers occurred primarily in Klondike, whereas Arctic Terns occurred in Klondike in 2008, in Burger in 2009, and in both study areas in Long-tailed Jaegers were seen off-transect on both study areas in Aug/Sep 2008 and on transect in both study areas in 2009 and Ivory Gulls occurred only in Burger, similar to the pattern seen for Ross s Gulls, and only in Sep/Oct A single Glaucous-winged Gull was seen only off-transect in Klondike and only in Jul/Aug 2008, after a storm with strong southerly winds. PHALAROPES Phalaropes were seen in patchy feeding flocks, primarily in Aug/Sep and Sep/Oct in 2008, in Jul/Aug and Aug/Sep in 2009, and in Aug/Sep in 2010 (Figure 11). Both Red and Red-necked phalaropes were seen feeding in mixed-species flocks, and numbers were pooled for estimates of density. In 2008, they were most abundant in Klondike in Sep/Oct and in Burger in Aug/Sep but, in both areas, the high counts occurred during transects surveyed in September and we saw few phalaropes in August and none in October. In 2009, phalaropes were most abundant in Burger and in both Jul/Aug and Aug/Sep, whereas numbers declined substantially in Sep/Oct. In 2010, phalaropes were more abundant in Aug/Sep than in Jul/Aug. The spatial pattern of distribution indicates that phalaropes occurred in clumps in the southern half of Burger in Aug/Sep in 2008 and the southern Chukchi Seabird Synthesis 28


")

41 July/August August/September September/October Short-tailed Shearwater Density (birds/km 2 ) No data Outside study area 2009 Statoil Study Area km Burger Study Area 4 Klondike Study Area Point Franklin Wainwright! UTM 3 NAD 1983 Depth in 10-meter increments km 2010 Figure 12. Estimated densities (birds/km 2 ) of Short-tailed Shearwaters recorded on transect in the Klondike, Burger, and Statoil study areas in 2008, 2009, and 2010, by season and year.
44. MARINE WILDLIFE Introduction Results and Discussion. Marine Wildlife Cook Inlet
 44. MARINE WILDLIFE 44.1 Introduction This study examined the distribution and abundance of marine-oriented wildlife (birds and mammals) during surveys conducted by ABR, Inc. Environmental Research & Services.
Winter Marine Bird Surveys
 Winter Marine Bird Surveys February 16-March 6 2012 Prepared by Gregory Mills, National Oceanic and Atmospheric Administration (NOAA) On behalf of Oregon Wave Energy Trust March 2012 This work was funded
Distribution and Abundance of Seabirds in the Northeastern Chukchi Sea, August September 2014
 Distribution and Abundance of Seabirds in the Northeastern Chukchi Sea, 2014 Adrian E. Gall Tawna C. Morgan Robert H. Day Prepared for ConocoPhillips Company Anchorage, Alaska and Shell Exploration & Production
Identifying Ecological Hotspots in the Bering, Chukchi, and Beaufort Seas
 Identifying Ecological Hotspots in the Bering, Chukchi, and Beaufort Seas Esri User Conference July 2018 image: Milo Burcham Erika Knight, Melanie Smith, Max Goldman, & Ben Sullender Audubon Alaska Audubon
GOA NAVY TRAINING ACTIVITIES FINAL SUPPLEMENTAL EIS/OEIS JULY 2016
 3.9 Birds 3.9 BIRDS 3.9.1 AFFECTED ENVIRONMENT For purposes of this Supplemental Environmental Impact Statement (EIS)/Overseas EIS (Supplemental EIS/OEIS), the Region of Influence (ROI) for birds remains
MARINE BIRDS. Comparison of populations of dominant marine bird between the western and eastern North Pacific are:
 MARINE BIRDS Marine birds are important components of North Pacific ecosystems. At least 137 sea bird species inhabit the North Pacific, with total abundance estimated to exceed 200 million birds. They
Seabird Mass Mortality Event on St. Paul, Pribilofs Lauren Divine, Co-Director ACSPI ECO Julia K Parrish, Executive Director COASST
 Seabird Mass Mortality Event on St. Paul, Pribilofs Lauren Divine, Co-Director ACSPI ECO Julia K Parrish, Executive Director COASST Paul Melovidov Aaron Lestenkof Ecosystem Conservation Office Island Sentinels
MARINE BIRD SURVEYS AT BOGOSLOF ISLAND, ALASKA, IN 2005
 AMNWR 05/18 MARINE BIRD SURVEYS AT BOGOSLOF ISLAND, ALASKA, IN 2005 Photo: Paul Hillman Heather M. Renner and Jeffrey C. Williams Key Words: Aleutian Islands, black-legged kittiwake, Bogoslof Island, Fratercula
Sea Duck Joint Venture Annual Project Summary for Endorsed Projects FY 2010 (October 1, 2009 to Sept 30, 2010)
") Sea Duck Joint Venture Annual Project Summary for Endorsed Projects FY 2010 (October 1, 2009 to Sept 30, 2010) Project Title: No. 2 Identification of Chukchi and Beaufort Sea Migration Corridor for Sea
Sea Duck Joint Venture Annual Project Summary for Endorsed Projects FY 2010 (October 1, 2009 to Sept 30, 2010) Project Title: No. 2 Identification of Chukchi and Beaufort Sea Migration Corridor for Sea
Seasonal distribution of short-tailed shearwaters and their prey in the Bering and Chukchi seas
 PICES S5, 8 Nov. 2016 Seasonal distribution of short-tailed shearwaters and their prey in the Bering and Chukchi seas B. Nishizawa 1, K. Matsuno 2, T. Yamamoto 3, E. A. Labunski 4, K. J. Kuletz 4, A. Yamaguchi
Species: Birds (seabirds, shorebirds, waterfowl, raptors, passerines) and marine mammals
 and marine mammals") Circumnavigation surveys Wildlife Inventory Plan Alaska Maritime National Wildlife Refuge Protocol #22 Version 1.2 Parameter: Populations (and occasionally boom-or-bust productivity) Species: Birds (seabirds,
Circumnavigation surveys Wildlife Inventory Plan Alaska Maritime National Wildlife Refuge Protocol #22 Version 1.2 Parameter: Populations (and occasionally boom-or-bust productivity) Species: Birds (seabirds,
Birds YELLOW-BILLED LOON
 BIRDS Birds YELLOW-BILLED LOON Gavia adamsii Description The Yellow-billed Loon is one of the largest of the five world loon species, all of which reside in Alaska. This loon was warranted but precluded
Project Number: H Project Title:
 Project Number: 3-H Project Title: PWS Herring Survey: Seasonal and Interannual Trends in Seabird Predation on Juvenile Herring PI Name: Dr. Mary Anne Bishop and Dr. Kathy Kuletz Time period covered: FY
Project Summary. Predicting waterbird nest distributions on the Yukon-Kuskokwim Delta of Alaska
 Project Summary 1. PROJECT INFORMATION Title Project ID Predicting waterbird nest distributions on the Yukon-Kuskokwim Delta of Alaska WA2012_22 Project Period July 1, 2012 to June 30, 2014 Report submission
STATUS OF SEABIRDS ON SOUTHEAST FARALLON ISLAND DURING THE 2010 BREEDING SEASON
 STATUS OF SEABIRDS ON SOUTHEAST FARALLON ISLAND DURING THE 2010 BREEDING SEASON P.M. Warzybok and R.W. Bradley Marine Ecology Division PRBO Conservation Science 3820 Cypress Drive #11 Petaluma, CA, 94954
Marbled Murrelet Effectiveness Monitoring, Northwest Forest Plan
 Marbled Murrelet Effectiveness Monitoring, Northwest Forest Plan 2017 Summary Report Northwest Forest Plan Interagency Regional Monitoring Program Photo credits: S.F. Pearson (top) May 2018 1 Marbled Murrelet
AERIAL SURVEY OF BIRDS AT MONO LAKE ON AUGUST 24, 1973
 AERIAL SURVEY OF BIRDS AT MONO LAKE ON AUGUST 24, 1973 by Ronald M. Jurek Special Wildlife Investigations Wildlife Management Branch California Department of Fish and Game September 1973 Jurek, R.M. 1973.
MLPA NCSR Baseline Seabird Nearshore Foraging and Feeding Flock Monitoring Protocol Point Blue Conservation Science
 MLPA NCSR Baseline Seabird Nearshore Foraging and Feeding Flock Monitoring Protocol 2014-2015 Point Blue Conservation Science OVERVIEW This document provides instructions for collecting data within the
Digital Aerial Baseline Surveys of Marine Wildlife
 Digital Aerial Baseline Surveys of Marine Wildlife In Support of New York State Offshore Wind Energy Seasonal PAC Webinar #8 Spring 2018 Dial-in number: 352-327-3264 Access code: 173655 Introduction Greg
First page. - Helping Seabirds Thrive -
 First page - Helping Seabirds Thrive - = Lots of food for wildlife Credit: Michelle Hester-Oikonos Ecosystem Knowledge meters WHAT S OUT THERE? Rockfish & Perch Filetail Catshark Flag Rockfish Rockfish
Wildlife distributions and habitat use on the mid-atlantic Outer Continental Shelf
 Wildlife distributions and habitat use on the mid-atlantic Outer Continental Shelf Jonathan Fiely-BRI Kate Williams Biodiversity Research Institute 27 Oct. 2015 Funding Organizations: U.S. Dept. of Energy
Seabird Monitoring on Alaska Maritime National Wildlife Refuge
 Community-Based Coastal Observing in Alaska: Aleutian Life Forum 2006 33 Seabird Monitoring on Alaska Maritime National Wildlife Refuge Vernon Byrd Alaska Maritime National Wildlife Refuge, Homer, Alaska
Summaries of Sub-regional Trends in Density Indices PROCEEDINGS 1
 Trends Observed for Selected Marine Bird Species during 1993- Winter Aerial Surveys, Conducted by the PSAMP Bird Component (WDFW) in the Inner Marine Waters of Washington State David R. Nysewander, Joseph
Marbled Murrelet Effectiveness Monitoring, Northwest Forest Plan
 Marbled Murrelet Effectiveness Monitoring, Northwest Forest Plan 2014 Summary Report Northwest Forest Plan Interagency Regional Monitoring Program Photo credits: M. Lance, WDFW (top), M.G. Shepard (bottom)
Susitna-Watana Hydroelectric Project (FERC No ) Waterbird Migration, Breeding, and Habitat Use Study Plan Section 10.15
 Waterbird Migration, Breeding, and Habitat Use Study Plan Section 10.15") (FERC No. 14241) Waterbird Migration, Breeding, and Habitat Use Study Plan Section 10.15 Initial Study Report Part C: Executive Summary and Section 7 Prepared for Prepared by ABR, Inc. Environmental Research
(FERC No. 14241) Waterbird Migration, Breeding, and Habitat Use Study Plan Section 10.15 Initial Study Report Part C: Executive Summary and Section 7 Prepared for Prepared by ABR, Inc. Environmental Research
WESTERN BIRDS SEABIRDS IN THE NORTHERN GULF OF ALASKA AND ADJACENT WATERS, OCTOBER TO MAY
 WESTERN BIRDS Volume 37, Number 4, 2006 SEABIRDS IN THE NORTHERN GULF OF ALASKA AND ADJACENT WATERS, OCTOBER TO MAY Robert H. Day, ABR, Inc. Environmental Research & Services, P. O. Box 80410, Fairbanks,
BLACK GUILLEMOTS IN A MELTING ARCTIC: RESPONDING TO SHIFTS IN PREY, COMPETITORS, AND PREDATORS GEORGE DIVOKY
 BLACK GUILLEMOTS IN A MELTING ARCTIC: RESPONDING TO SHIFTS IN PREY, COMPETITORS, AND PREDATORS GEORGE DIVOKY Friends of Cooper Island, 652 32 nd Ave. E, Seattle, WA 98112, USA. E-mail: divoky@cooperisland.org
431 West 7th Avenue, Suite 101 Anchorage, AK Tel: September 2016
 431 West 7th Avenue, Suite 101 Anchorage, AK 99501 Tel: 907-276-7034 www.ak.audubon.org 30 September 2016 William J. Douros West Coast Regional Director NOAA Office of National Marine Sanctuaries 99 Pacific
STATUS OF SEABIRDS ON SOUTHEAST FARALLON ISLAND DURING THE 2009 BREEDING SEASON
 STATUS OF SEABIRDS ON SOUTHEAST FARALLON ISLAND DURING THE 29 BREEDING SEASON P.M. Warzybok and R.W. Bradley Marine Ecology Division PRBO Conservation Science 382 Cypress Drive #11 Petaluma, CA, 94954
Statistical analyses to support guidelines for marine avian sampling
 Statistical analyses to support guidelines for marine avian sampling Brian Kinlan (NOAA) Elise F. Zipkin (USGS) Allan F. O Connell (USGS) Chris Caldow (NOAA) Allison Sussman (USGS) Mark Wimer (USGS) Special
Marine Mammal and Seabird Surveys
 Marine Mammal and Seabird Surveys Tidal Energy Demonstration Site Minas Passage, 2012 Submitted to: Fundy Ocean Research Centre for Energy (FORCE) Submitted by: Envirosphere Consultants Limited Windsor,
EEB 4260 Ornithology. Lecture Notes: Migration
 EEB 4260 Ornithology Lecture Notes: Migration Class Business Reading for this lecture Required. Gill: Chapter 10 (pgs. 273-295) Optional. Proctor and Lynch: pages 266-273 1. Introduction A) EARLY IDEAS
We Are Watching! The Long-term Monitoring Program of the Exxon Valdez Oil Spill Trustee Council. Mandy Lindeberg NMFS AFSC Auke Bay Laboratories
 We Are Watching! The Long-term Monitoring Program of the Exxon Valdez Oil Spill Trustee Council Mandy Lindeberg NMFS AFSC Auke Bay Laboratories EVOSTC: A Legacy of Significant Science and Ecosystem Approach
Baskett Slough National Wildlife Refuge BCS number: 47-4
 Baskett Slough National Wildlife Refuge BCS number: 47-4 Site description author(s) Daphne E. Swope, Research and Monitoring Team, Klamath Bird Observatory Primary contact for this site N/A Location (UTM)
Gregory Thomson. Alaska Maritime National Wildlife Refuge 95 Sterling Highway, Suite 1 Homer, Alaska 99602
 AMNWR 06/11 WILDLIFE OBSERVATIONS AT WALRUS ISLAND, PRIBILOF ISLANDS, ALASKA, JULY 20, 2006 Gregory Thomson Key Words: arctic fox, black-legged kittiwake, common murre, monitoring, northern fur seal, Pribilof
Use of Estuarine, Intertidal, and Subtidal Habitats by Seabirds Within the MLPA South Coast Study Region. Final Plan of Work.
 Use of Estuarine, Intertidal, and Subtidal Habitats by Seabirds Within the MLPA South Coast Study Region Final Plan of Work Project Leaders: Daniel P. Robinette and Jaime Jahncke (PRBO Conservation Science)
Smith River Mouth BCS number: 86-6
 Smith River Mouth BCS number: 86-6 ***NOTE: We were unable to determine all necessary information for this site description. If you would like to contribute the needed information to this description,
Roberts Bank Terminal 2 Project Field Studies Information Sheet
 July 2012 Port Metro Vancouver is continuing field studies in July as part of ongoing environmental and technical work for the proposed Roberts Bank Terminal 2 Project. Roberts Bank Terminal 2 Project
Alvord Lake BCS number: 48-2
 Oregon Coordinated Aquatic Bird Monitoring: Description of Important Aquatic Bird Site Alvord Lake BCS number: 48-2 Site description author(s) Whitney Haskell, Data Management Intern, Klamath Bird Observatory
Peregrine Falcon Falco peregrinus
 Plant Composition and Density Mosaic Distance to Water Prey Populations Cliff Properties Minimum Patch Size Recommended Patch Size Home Range Photo by Christy Klinger Habitat Use Profile Habitats Used
2. Survey Methodology
 Analysis of Butterfly Survey Data and Methodology from San Bruno Mountain Habitat Conservation Plan (1982 2000). 2. Survey Methodology Travis Longcore University of Southern California GIS Research Laboratory
United States Department of the Interior
 United States Department of the Interior FISH AND WILDLIFE SERVICE New England Field Office 70 Commercial Street, Suite 300 Concord, Nil 03301-5087 http://www.fws. gov/newengland Environmental Division
BREEDING STATUS AND POPULATION TRENDS OF SEABIRDS IN ALASKA, 2017
 BREEDING STATUS AND POPULATION TRENDS OF SEABIRDS IN ALASKA, 217 U.S. FISH AND WILDLIFE SERVICE AMNWR 218/2 BREEDING STATUS AND POPULATION TRENDS OF SEABIRDS IN ALASKA, 217 Compiled By: Donald E. Dragoo,
Development of Mid-Frequency Multibeam Sonar for Fisheries Applications
 Development of Mid-Frequency Multibeam Sonar for Fisheries Applications John K. Horne University of Washington, School of Aquatic and Fishery Sciences Box 355020 Seattle, WA 98195 phone: (206) 221-6890
Impact of the 1997/98 El Niño on Seabirds of the North East Pacific
 Impact of the 1997/98 El Niño on Seabirds of the North East Pacific Ken H. Morgan Canadian Wildlife Service, Environment Canada c/o Institute of Ocean Sciences P.O. Box 6000, Sidney, B.C., V8L 4B2 Canada
WWF-Canada - Technical Document
 WWF-Canada - Technical Document Date Completed: September 14, 2017 Technical Document Living Planet Report Canada What is the Living Planet Index Similar to the way a stock market index measures economic
Northern Spotted Owl and Barred Owl Population Dynamics. Contributors: Evan Johnson Adam Bucher
 Northern Spotted Owl and Barred Owl Population Dynamics Contributors: Evan Johnson Adam Bucher Humboldt State University - December, 2014 1 Abstract Populations of the Strix occidentalis caurina ( northern
LANZ AND COX ISLANDS PROVINCIAL PARK
 LANZ AND COX ISLANDS PROVINCIAL PARK PURPOSE STATEMENT AND ZONING PLAN March 2003 LANZ AND COX ISLANDS PROVINCIAL PARK Purpose Statement and Zoning Plan Primary Role The primary role of Lanz and Cox Islands
Red-breasted Merganser Minnesota Conservation Summary
 Credit Jim Williams Red-breasted Merganser Minnesota Conservation Summary Audubon Minnesota Spring 2014 The Blueprint for Minnesota Bird Conservation is a project of Audubon Minnesota written by Lee A.
DISTRIBUTION AND ABUNDANCE OF SEA DUCKS AND DIVING DUCKS ON LAKE ST. CLAIR AND W. LAKE ERIE
 DISTRIBUTION AND ABUNDANCE OF SEA DUCKS AND DIVING DUCKS ON LAKE ST. CLAIR AND W. LAKE ERIE Dave Luukkonen, Michigan DNR and Michigan State University Importance of Lake St. Clair and western Lake Erie
Chapter 2 : Aerial Survey Methods
 Chapter 2 : Aerial Survey Methods Emily E. Connelly, Melissa Duron, Iain J. Stenhouse, Kathryn A. Williams Introduction High-definition video aerial surveys were conducted by (BRI) and HiDef Aerial Surveying,
Chokecherry and Sierra Madre Wind Energy Project
 Chokecherry and Sierra Madre Wind Energy Project Intensive Avian Protection Planning Avian Protection Summary In 2010, PCW initiated a collaborative process with BLM, USFWS, and Wyoming Game and Fish Department
Tualatin River NWR and Wapato Lake BCS number: 47-37
 Tualatin River NWR and Wapato Lake BCS number: 47-37 ***NOTE: We were unable to determine all necessary information for this site description. If you would like to contribute the needed information to
Siletz Bay BCS number: 47-29
 Siletz Bay BCS number: 47-29 ***NOTE: We were unable to determine all necessary information for this site description. If you would like to contribute the needed information to this description, please
Statistical analyses to support guidelines for marine avian sampling
 Statistical analyses to support guidelines for marine avian sampling Brian Kinlan (NOAA) Elise F. Zipkin (USGS) Allan F. O Connell (USGS) Allison Sussman (USGS) Mark Wimer (USGS) Chris Caldow (NOAA) Special
Conceptual framework for food web links between seabirds and fish in the estuary, plume, and nearshore ocean of the Columbia River
 Conceptual framework for food web links between seabirds and fish in the estuary, plume, and nearshore ocean of the Columbia River Presented by: Jeannette E. Zamon Co-authors: Elizabeth M. Phillips, Troy
Jackson Bottom Wetlands Preserve BCS Number: 47-14
 Jackson Bottom Wetlands Preserve BCS Number: 47-14 Site description author(s) Greg Gillson, Jackson Bottom Wetlands Preserve Primary contact for this site Ed Becker, Natural Resources Manager, Jackson
Tiered Species Habitats (Terrestrial and Aquatic)
") Tiered Species Habitats (Terrestrial and Aquatic) Dataset Description Free-Bridge Area Map The Department of Game and Inland Fisheries (DGIF s) Tiered Species Habitat data shows the number of Tier 1, 2
Tiered Species Habitats (Terrestrial and Aquatic) Dataset Description Free-Bridge Area Map The Department of Game and Inland Fisheries (DGIF s) Tiered Species Habitat data shows the number of Tier 1, 2
Philip C. Stouffer Jason A. Zoller. LSU School of Renewable Natural Resources Final Report 30 June 2006
 Use of the Maurepas Swamp by Migrating Birds Determined by Radar Detection Objectives Philip C. Stouffer Jason A. Zoller LSU School of Renewable Natural Resources Final Report 3 June 26 The objective of
Determining Wintering Areas and Migrations Routes of Red-throated Loons (Gavia stellata) in Atlantic Offshore Waters Using Satellite Tracking
 in Atlantic Offshore Waters Using Satellite Tracking") Determining Wintering Areas and Migrations Routes of Red-throated Loons (Gavia stellata) in Atlantic Offshore Waters Using Satellite Tracking Red-throated Loon (Gavia stellata) released with satellite
Determining Wintering Areas and Migrations Routes of Red-throated Loons (Gavia stellata) in Atlantic Offshore Waters Using Satellite Tracking Red-throated Loon (Gavia stellata) released with satellite
Sauvie Island Wildlife Area BCS number: 47-28
 Sauvie Island Wildlife Area BCS number: 47-28 Site description author(s) Mark Nebeker, Oregon Department of Fish and Wildlife, Sauvie Island Wildlife Area Manager Primary contact for this site Mark Nebeker,
Fall Trumpeter Swan Survey of the High Plains Flock
 University of Nebraska - Lincoln DigitalCommons@University of Nebraska - Lincoln US Fish & Wildlife Publications US Fish & Wildlife Service 11-2006 Fall Trumpeter Swan Survey of the High Plains Flock Shilo
AERIAL SURVEY OF EMPEROR GEESE AND OTHER WATERBIRDS SOUTHWESTERN ALASKA, FALL Edward J. Mallek 1 and Christian P. Dau 2
 AERIAL SURVEY OF EMPEROR GEESE AND OTHER WATERBIRDS IN SOUTHWESTERN ALASKA, FALL 2008 By Edward J. Mallek 1 and Christian P. Dau 2 Key Words: aerial survey, emperor geese, waterbirds, southwest Alaska.
Fall Trumpeter Swan Survey of the High Plains Flock
 University of Nebraska - Lincoln DigitalCommons@University of Nebraska - Lincoln US Fish & Wildlife Publications US Fish & Wildlife Service 10-2009 Fall Trumpeter Swan Survey of the High Plains Flock Shilo
SEABIRD DISTRIBUTION AND ABUNDANCE Mason et al. 5
 SEABIRD DISTRIBUTION AND ABUNDANCE Mason et al. 5 Point Conception and Point Arguello, 15 in the Santa Barbara Channel, and five in San Pedro Channel. Oil and gas operations are scheduled to continue on
CLASS FOUR: Seabird Research Tools and Methods
 CLASS FOUR: Seabird Research Tools and Methods People study seabirds for many reasons. For example: Conservation Questions: e.g., what is causing a storm petrel population to decline? Behavioral Questions:
Catalog of Upper Mississippi River and Great Lakes Region Joint Venture GIS Data March 2009 Version 1
 Catalog of Upper Mississippi River and Great Lakes Region Joint Venture GIS Data March 2009 Version 1 Compiled by: Bradly Potter Introduction This catalog contains descriptions of GIS data available from
Project summary. Key findings, Winter: Key findings, Spring:
 Summary report: Assessing Rusty Blackbird habitat suitability on wintering grounds and during spring migration using a large citizen-science dataset Brian S. Evans Smithsonian Migratory Bird Center October
Marine mammal monitoring
 Marine mammal monitoring Overseas territories REMMOA campaigns : survey of marine mammals and other pelagic megafauna by aerial observation West Indies French Guiana / Indian Ocean / French Polynesia /
HOW THE OTHER HALF LIVES: MONARCH POPULATION TRENDS WEST OF THE GREAT DIVIDE SHAWNA STEVENS AND DENNIS FREY. Biological Sciences Department
 HOW THE OTHER HALF LIVES: MONARCH POPULATION TRENDS WEST OF THE GREAT DIVIDE SHAWNA STEVENS AND DENNIS FREY Biological Sciences Department California Polytechnic State University San Luis Obispo, California
Ladd Marsh Wildlife Area BCS number: 49-3
 Oregon Coordinated Aquatic Bird Monitoring: Description of Important Aquatic Bird Site Ladd Marsh Wildlife Area BCS number: 49-3 Site description author M. Cathy Nowak, Ladd Marsh Wildlife Area Biologist
OVERVIEW INTRODUCTION TO SHOREBIRDS MANAGEMENT FOR SHOREBIRDS TVA REGIONAL SHOREBIRD PROJECT ESTIMATING SHOREBIRD NUMBERS
 SHOREBIRD CONSERVATION AND MONITORING RESOURCES US SHOREBIRD CONSERVATOIN PLAN http://www.fws.gov/shorebirdplan WATERFOWL MANAGEMENT HANDBOOK - http://www.nwrc.usgs.gov/wdb/pub/wmh/contents.html MANOMET
Project Title: Migration patterns, habitat use, and harvest characteristics of long-tailed ducks wintering on Lake Michigan.
 Sea Duck Joint Venture Annual Project Summary FY 2016 (October 1, 2015 to Sept 30, 2016) Project Title: Migration patterns, habitat use, and harvest characteristics of long-tailed ducks wintering on Lake
Oregon Dunes National Recreation Area BCS Number: 47-5
 Oregon Dunes National Recreation Area BCS Number: 47-5 ***NOTE: We were unable to determine all necessary information for this site description. If you would like to contribute the needed information to
AERIAL SURVEY OF EMPEROR GEESE AND OTHER WATERBIRDS SOUTHWESTERN ALASKA, FALL 2003
 AERIAL SURVEY OF EMPEROR GEESE AND OTHER WATERBIRDS IN SOUTHWESTERN ALASKA, FALL 2003 Edward J. Mallek 1 and Christian P. Dau 2 November 2003 1 U. S. Fish and Wildlife Service 2 U. S. Fish and Wildlife
Farr wind farm: A review of displacement disturbance on dunlin arising from operational turbines
 Farr wind farm: A review of displacement disturbance on dunlin arising from operational turbines 2002-2015. Alan H Fielding and Paul F Haworth September 2015 Haworth Conservation Haworth Conservation Ltd
MPA Baseline Program. Annual Progress Report. Use of Estuarine, Intertidal, and Subtidal Habitats by Seabirds Within the MLPA South Coast Study Region
 MPA Baseline Program Annual Progress Report Principal Investigators - please use this form to submit your MPA Baseline Program project annual report, including an update on activities completed over the
Work Plan for Pre-Construction Avian and Bat Surveys
 Work Plan for Pre-Construction Avian and Bat Surveys, Steuben County, New York Prepared For: EverPower Wind Holdings, Inc. 1251 Waterfront Place, 3rd Floor Pittsburgh, PA 15222 Prepared By: Stantec Consulting
LOUISIANA BIRD RECORDS COMMITTEE
 LOUISIANA BIRD RECORDS COMMITTEE REPORT FORM This form is intended as a convenience in reporting observations of species on the Louisiana Bird Records Committee (LBRC) Review List. The LBRC recommends
Guidance note: Distribution of breeding birds in relation to upland wind farms
 Guidance note: Distribution of breeding birds in relation to upland wind farms December 2009 Summary Impacts of wind farms on bird populations can occur through collisions, habitat loss, avoidance/barrier
DISTRIBUTION, AND RELATIVE ABUNDANCE OF THE COMMON DOLPHIN DELPHINUS DELPHIS IN THE BAY OF BISCAY
 DISTRIBUTION, AND RELATIVE ABUNDANCE OF THE COMMON DOLPHIN DELPHINUS DELPHIS IN THE BAY OF BISCAY T. M. Brereton 1, A. D. Williams 2, & R. Williams 3 1Biscay Dolphin Research Programme, c/o 20 Mill Street,
State of the Estuary Report 2015
 1 State of the Estuary Report 2015 Summary PROCESSES Feeding Chicks, Brandt s Cormorant Prepared by Nadav Nur Point Blue Conservation Science State of the Estuary 2015: Processes Brandt s Cormorant Reproductive
Tahkenitch Creek Estuary BCS number: 47-35
 Tahkenitch Creek Estuary BCS number: 47-35 ***NOTE: We were unable to determine all necessary information for this site description. If you would like to contribute the needed information to this description,
Annual Report to SeaGrant. Agreement No. R/MPA-6B
 Annual Report to SeaGrant Agreement R/MPA-6B 09-015 Baseline Characterization of Newly Established Marine Protected Areas Within the North Central California Study Region - Seabird Colony and Foraging
Expansion Work Has Begun The perimeter dike for Cell 7 is now visible
 Summer/Fall 2017 In This Issue Poplar Island Expansion Wetland Cell 5AB Development Wildlife Update Birding tours on Poplar Island Expansion Work Has Begun The perimeter dike for Cell 7 is now visible
Marine birds, mammals, and PICES: Brief history and roadmap for the future
 Marine birds, mammals, and PICES: Brief history and roadmap for the future William J. Sydeman 1, George L. Hunt, Jr. 2, Douglas Bertram 3, Yutaka Watanuki 4, Rolf R. Ream 5, Kaoru Hattori 6, Hidehiro Kato
USFWS Migratory Bird Program
 USFWS Migratory Bird Program Updates for the Bird Conservation Committee North American Wildlife & Natural Resources Conference Norfolk, Va. ~ March 28, 2018 Presented by Sarah Mott & Ken Richkus U.S.
ANNE VALLEE (TRIANGLE ISLAND) ECOLOGICAL RESERVE
 ECOLOGICAL RESERVE") ANNE VALLEE (TRIANGLE ISLAND) ECOLOGICAL RESERVE PURPOSE STATEMENT February 2003 ANNE VALLEE (TRIANGLE ISLAND) ECOLOGICAL RESERVE Purpose Statement Ecological reserves are areas selected to preserve representative
ANNE VALLEE (TRIANGLE ISLAND) ECOLOGICAL RESERVE PURPOSE STATEMENT February 2003 ANNE VALLEE (TRIANGLE ISLAND) ECOLOGICAL RESERVE Purpose Statement Ecological reserves are areas selected to preserve representative
S/V Arctic Tern I Expedition Report World Wildlife Fund
 S/V Arctic Tern I - 2014 Expedition Report World Wildlife Fund Table of Contents Crew & Passengers... 2 Arctic Tern I and WWF... 3 Positioning cruise: sailing North... 4 Greenland: a study of resource
Roberts Bank Terminal 2 Project Field Studies Information Sheet
 January 2013 Port Metro Vancouver is continuing field studies in January as part of ongoing environmental and technical work for the proposed. The is a proposed new multi berth container terminal which
THE SHY ALBATROSS (THALASSARCHE CAUTA):
:") THE SHY ALBATROSS (THALASSARCHE CAUTA): Population Trends, Environmental and Anthropogenic Drivers, and the Future for Management and Conservation Rachael Louise Alderman (B.Sc. Hons) Submitted in fulfilment
THE SHY ALBATROSS (THALASSARCHE CAUTA): Population Trends, Environmental and Anthropogenic Drivers, and the Future for Management and Conservation Rachael Louise Alderman (B.Sc. Hons) Submitted in fulfilment
Cruise Report R/V Oceania, AREX 2006
 Powstańców Warszawy 55, PL - 81-712 Sopot, P.O. Box 68 January 20, 2007 Cruise Report R/V Oceania, AREX 2006 Ship: R/V Oceania Cruise: AREX 2006 Dates: 08.06.2006 19.07.2006 Port Calls: Gdansk (Poland)
Anthony Gonzon DE Division of Fish & Wildlife DNREC
 Anthony Gonzon DE Division of Fish & Wildlife DNREC Thousands of birds migrate through Delaware every Fall Fall migration Sept Nov Thousands more call Delaware home in winter Nov Mar Wide-ranging diversity
Our Natural Wonder: AMERICA S ARCTIC
 Our Natural Wonder: AMERICA S ARCTIC America s portion of the Arctic northern Alaska above the Arctic Circle is one of the world s most dynamic, intact ecosystems. America s Arctic is home to polar bears,
HIGH-FREQUENCY ACOUSTIC PROPAGATION IN THE PRESENCE OF OCEANOGRAPHIC VARIABILITY
 HIGH-FREQUENCY ACOUSTIC PROPAGATION IN THE PRESENCE OF OCEANOGRAPHIC VARIABILITY M. BADIEY, K. WONG, AND L. LENAIN College of Marine Studies, University of Delaware Newark DE 19716, USA E-mail: Badiey@udel.edu
Striking a Balance in America s Western Arctic:
 Striking a Balance in America s Western Arctic: The National Petroleum Reserve Alaska A Special Report by the Alaska State Office of National Audubon Society on The National Petroleum Reserve Alaska 2
AZA Continuing Classic Conservation
 AZA 2017 Continuing Classic Conservation Project Puffin and AZA: Partners Since 1990 Mary Roman Gunther Salisbury University mrgunther@salisbury.edu Egg Rock Update 2010 Field Experience for Aviculturists
Mallory NSHCF Report 2016 Field Season 1. Factors influencing population decline of marine birds. on Nova Scotia s Eastern Shore Islands
 Mallory NSHCF Report 2016 Field Season 1 Project Goal: Factors influencing population decline of marine birds on Nova Scotia s Eastern Shore Islands Final Report NSHCF 2016 Season Prepared by Mark Mallory
Upper Klamath National Wildlife Refuge Complex Upper Klamath Unit and Hank s Marsh Unit BCS Number: 48-29
 Oregon Coordinated Aquatic Bird Monitoring: Description of Important Aquatic Bird Site Upper Klamath National Wildlife Refuge Complex Upper Klamath Unit and Hank s Marsh Unit BCS Number: 48-29 Site description
HERON AND EGRET MONITORING RESULTS AT WEST MARIN ISLAND: 2003 NESTING SEASON
 HERON AND EGRET MONITORING RESULTS AT WEST MARIN ISLAND: 2003 NESTING SEASON A Report to the San Pablo Bay National Wildlife Refuge John P. Kelly a and Binny Fischer Cypress Grove Research Center, Audubon