Staying Power: The Future of Manufacturing in Massachusetts
|
|
|
- Amos Barrett
- 5 years ago
- Views:
Transcription

1 Staying Power: The Future of Manufacturing in Massachusetts Barry Bluestone Don Walsh Lauren Nicoll Chase Billingham With Alan Clayton-Matthews, Marc Horne, David Soule, and David Streim November 7, 2008
2 Manufacturing in Massachusetts: The Conventional Wisdom

3 Deindustrializing.
4 An Industrial Dinosaur

5 Dead as a Door Nail
6 Examining the Conventional Wisdom This new study of manufacturing, undertaken for the Commonwealth, is aimed at understanding: What Massachusetts firms still produce in the state Where it is produced What its future might be The challenges it faces to sustain or expand in-state operations What the state can do to support this important sector
7 Support for the New Study Commonwealth of Massachusetts through 2006 Economic Stimulus Funding Massachusetts Manufacturing Extension Program (Mass MEP) Massachusetts Alliance for Economic Development (MAED) The Boston Foundation
8 Study Partners Associated Industries of Massachusetts Berkshire Chamber of Commerce Berkshire Economic Development Council Boston Redevelopment Authority Boston Tooling and Machining Association 495/Metro West Corridor Partnership Mass BioTech Council Mass Business Roundtable Mass Insight Mass High Tech Council Mass MEDIC Mass Taxpayers Foundation Merrimack Valley Council Metro West Chamber of Commerce Neponset Valley Chamber of Commerce New England Council Quincy 2000 Regional Employment Board of Hampden County South Coast Development Partnership Taunton Development Corporation University of Massachusetts Western Massachusetts Economic Development Council
9 Study Components Analysis of historical data back to World War II New survey of more than 700 manufacturing firms in the state Interviews with the CEOs, owners, or managers of more than 100 surveyed firms

10 Massachusetts Manufacturing: An Historical Overview From World War II to the 21 st Century
11 Long-Term Manufacturing Employment Trends - WWII Mobilization for World War II saw Massachusetts manufacturing workforce swell from 534,000 in 1939 to 801,000 by 1943 Nearly 45% of the Commonwealth s workforce was employed in manufacturing compared to 38% of the workforce nationwide Massachusetts became the true arsenal of democracy
12 Manufacturing Employment Trends: Post-WWII With demobilization, the Massachusetts manufacturing workforce shrank by more than 100,000 between 1945 and By 1967, employment was down to 660,000 18% below its WWII peak But with the rise of the mini-computer industry led by DEC, Data General, Wang, and Prime, manufacturing employment by 1984 was still at 625,000 the rise of Rte 128
13 Manufacturing Employment Trends: 1984 to 2006 With the demise of the mini-computer market and growing competition for Massachusetts manufactured products, employment plummeted By 2006, manufacturing employment stood at just 299,000 Between 1984 and 2006, Massachusetts lost an average of 15,000 manufacturing jobs each year and the annual rate of decline was nearly twice as large during as it was between 1984 and 2000
14 Figure 1.1 Massachusetts Manufacturing Employment ( ) (with 2-Year Moving Average) , , , , in Thousands ,
15 Is Massachusetts Manufacturing Destined to Disappear? If the employment trend were to continue, Massachusetts would see its last manufacturing job disappear before BUT, as our analysis will demonstrate, this conclusion is much too pessimistic Indeed, there is reason to believe that the greatest loss in manufacturing employment is behind us and the future is shaping up to be quite bright

16 Massachusetts Manufacturing Today
17 Massachusetts Manufacturing: Still a Powerful Economic Sector 4 th largest employer in the Commonwealth Only healthcare, retail trade, and education sectors employ more Manufacturing employs more than all the hotels, restaurants, and bars in the state It employs 50,000 more than all professional & technical service industries It employs nearly 4X as many as all of the state s biotechnology companies put together It employs two-thirds more workers than all the state s banks, brokerage houses, and insurance companies combined
18 Massachusetts: Employment by Sector 2006 Healthcare 470,466 Retail 351,156 Education Manufacturing 309, ,477 Hotels & Food Services Professional & Technical Services 249, ,032 Finance & Insurance Administrative & Waste Services Construction Wholesale Trade Public Administration Other Services Information Services Transportation & Warehousing Management of Companies Arts & Entertainment Real Estate Utilities Agriculture, Forestry, Fishing Mining 179, , , , , ,703 93,164 92,511 62,123 47,356 44,592 12,988 6,633 1, , , , , , ,000
19 Massachusetts Manufacturing: Firm Births and Deaths While many manufacturing firms go out of business or leave the state each year, many new ones still start up or come to Massachusetts Even during the devastating recession of , over 900 manufacturing firms were established in Massachusetts
20 Manufacturing Births vs. Deaths: Year Initial Year Establishments Births (Adjusted) Deaths (Adjusted) Birth : Death Ratio , , , , , , , , ,121 N/A N/A N/A Total ,215 5,638
21 Massachusetts Manufacturing: Top 20 Key Sectors (2006) Computer and Electronic Products Navigational, Measuring, Electromedical, and Control Instruments Semiconductor and Other Electronic Components Other Miscellaneous Manufacturing (e.g. medical devices, jewelry, sporting goods, and toys) Plastic Products Printing Medical Equipment Communications Equipment Converted Paper Products Industrial Machinery Machine Shop Products Pharmaceuticals Aerospace Parts Bakery Products Architectural and Structural Metal Products Chemical Products and Preparations Fabrics Metalworking Machinery Cutlery and Tools Apparel
22 Massachusetts Manufacturing: Technology Intensity Industries categorized by technology intensity based on the ratio of R&D expenditure to value-added in an industry and the technology embodied in an industry s purchase of intermediate and capital goods Technology intensity taxonomy developed by the Organization for Economic Cooperation and Development (OECD)
23 Massachusetts Manufacturing: Low Tech to High Tech (1969=1.0) Massachusetts Manufacturing Employment by Sector (1969=1.00) High Tech: -12% Low Tech: -50% low-tech med-low-tech med-high-tech high-tech
24 The Big Surprise: Massachusetts Manufacturing: Rising Real Output/Larger Share of GSP Falling employment levels in manufacturing hide the fact that manufacturing output in the state has been rising steadily Between 1997 and 2006, the real gross state product originating in manufacturing has increased from $25 to $40 billion Manufacturing actually produces a larger share of total gross state product today than in 1997 rising from 10.9% to 13.3%
25 Massachusetts Manufacturing: Sharply Rising Productivity Employment in Massachusetts manufacturing has declined despite increased real output because of extraordinary productivity improvement Real output per worker has increased from $60,000 in 1997 to $133,600 in 2006 Massachusetts manufacturers have increased productivity 2X the U.S. manufacturing rate This productivity growth averages 4X productivity growth across all Massachusetts private sector industries Productivity has risen sharply as the result of the shift from lower productivity industries to higher productivity industries
26 Massachusetts Manufacturing: Workforce On average, less formal education required in manufacturing industries Despite less formal education, the $65,333 average annual wage in Massachusetts manufacturing is higher than the average wage in construction, real estate, government, education, and health care Average Massachusetts manufacturing annual wage 25% higher than average annual wage in the Massachusetts economy
27 Average Annual Salaries for Massachusetts Industry Sectors, 2006 Finance $103,834 Management of Companies Professional Technical Services Utilities Information Wholesale Trade MANUFACTURING $88,469 $87,920 $80,369 $77,517 $72,813 $65,333 Construction Real Estate Government Mining Education Healthcare Transportation & Warehousing Agriculture, Forestry, Fishing Administrative Services $54,938 $54,402 $53,973 $53,689 $46,555 $45,647 $43,430 $43,075 $35,680 Arts Retail Other Services Hotels & Food Services $31,086 $27,312 $26,773 $18,215 Massachusetts State Average Salary: $52,396 $0 $20,000 $40,000 $60,000 $80,000 $100,000 $120,000
28 Share of Massachusetts Payroll (2006)
29 Massachusetts Manufacturing: A Diverse Workforce
30 Massachusetts Manufacturing: But a Rapidly Aging Workforce Percentage of All Manufacturing Jobs Age : 49.6% 2000: 40.5% Age Category
31 Leading to Job Openings Given the likely retirement of more than 50,000 manufacturing workers over the next decade and given normal turnover of younger and prime age workers in this sector, it is likely that 100,000 or more jobs will need to be filled in this sector. A large number of these will be for production workers.
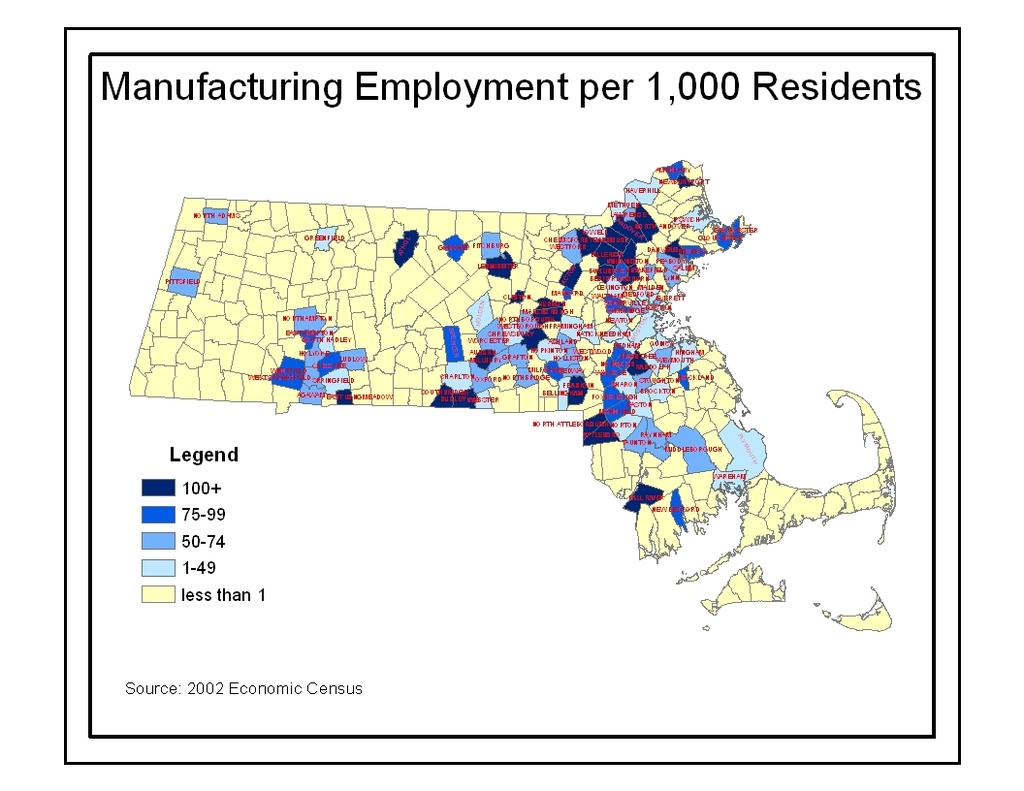
32 Massachusetts Manufacturing: Location Manufacturing is spread throughout the state Much of it is outside of Rte 495 Much of it is concentrated in our Older Industrial Cities and Towns
33
34 Massachusetts Manufacturing: Employment Forecast Forecast employment to 2016 based on a shift share analysis of Massachusetts using 4-digit NAICS code industries Use BLS national estimates of employment change for each 4-digit NAICS industry 2016 Forecast: Employment no less than 268,000 90% of current level Total 10 year loss forecast: 31,000 jobs (vs. 112,000 over past 10 years) Loss due primarily to continuing rapid increase in productivity
35 Projected Massachusetts Manufacturing Employment ( ) (in 000s) ,000 jobs PROJECTED -31,000 jobs
36 Manufacturing Losses since 2006 Between January 2006 and May 2008, manufacturing employment in Massachusetts has declined by 9,600 or 3.2% This is almost perfectly in line with the modest losses we projected based on data through 2006, despite the rapidly weakening national economy The Massachusetts loss is smaller than the 4.5% loss in manufacturing jobs nationwide
37 Massachusetts Manufacturing: Projected Employment Losses by Sector based on National Forecasts Cut and sewn apparel -58% Fabric finishing mills -40% Leather products -40% Computers & peripherals -34% Fabric mills -32% Pulp & paper mills -31% Non-ferrous metals -31%
38 Massachusetts Manufacturing: Projected Employment Gains by Sector based on National Forecasts Pharmaceuticals +24% Cement & concrete products + 7% Aerospace products & parts + 5% Architectural & structural metals + 5% Other food manufacturing + 2% Medical Equipment & Supplies + 1%
39 Massachusetts Manufacturing Employment may be even Stronger? Even with current near recession national conditions, the May 2008 Massachusetts manufacturing level was in line with this forecasted loss Declining value of the U.S. dollar may enhance domestic manufacturing Productivity growth could slow from its blistering pace, reducing job displacement
40 The CURP Survey Is there any corroborating evidence for this optimistic forecast? New evidence concerning the viability of manufacturing in Massachusetts
41 CURP Survey Sample Use InfoUSA.com commercial database to identify the population of Massachusetts manufacturers 9,630 manufacturing establishments Mailed survey to all 9,630 establishments 870 returned undelivered Received 706 survey responses out of a total of 8,670 Sample was roughly representative of all manufacturers by industry, size, sales, and Massachusetts location.
42 CURP Interviews Working with the state s leading economic development organizations, identified 104 firms for follow-up interviews Interviews conducted with CEOs, owneroperators, vice-presidents for manufacturing operations, human resource personnel, or public relations associates Questions similar to survey, but face-toface interviews permitted deeper elaboration
43 What Manufacturers tell us about their Companies Products, Sales, Geographic Dispersion, Suppliers, Customers, Competitors, Ownership, Manufacturing Processes, Workforce, Wages
44 Examples of Massachusetts Manufactured Products High Technology Aerospace components Printed circuit boards Bio-surgery products Fiber-optic components Infrared sensors Optical safety lens Radar equipment
45 Examples of Massachusetts Manufactured Products Medium-High Technology Ceramic components Machine tools Electrical & electronic switches High voltage cable assemblies Specialty chemicals Electrical marine supplies Oil-water separators Robotic systems for welding
46 Examples of Massachusetts Manufactured Products Medium-Low Technology Bearings Construction castings Fabricated metal parts HVAC duct work Decorative glass Band saw blades Floor tiles Lighting fixture Plastic food wrap Sailboats Snow shovels
47 Examples of Massachusetts Manufactured Products Low Technology Stacked heels for shoes & boots Offset printing Gaskets & gears Cannoli shells Beer Frozen seafood Frozen desserts Dried cranberries
48 Size of Massachusetts Manufacturing Firm by Employment Manufacturing Firm Size by Employment Level (Database) 40% 35% 35.6% 30% 25% 20% 19.0% 17.3% 15% 14.0% 10% 5% 0% 6.5% 4.8% 1.4% 0.5% 0.7% 0.1% 0.1% ,000-4,999 5,000-9,999 10,000+

49 Share of Massachusetts Manufacturing Employment by Size of Firm
50 Location of Primary Suppliers to Massachusetts Manufacturers

51 Location of Primary Customers of Massachusetts Manufacturers

52 Reasons Customers buy from Massachusetts Manufacturers
53 Ownership Structure of Massachusetts Manufacturers Ownership Structure of Massachusetts Manufacturers 80% 70% 69.5% 60% 50% 40% 30% 20% 16.8% 10% 6.5% 6.4% 0% Private family owneroperated Private investor-owned Publicly owned stock corporation Other 1.0% Missing
54 Ownership Structure of Massachusetts Manufacturers by Size of Firm Even among firms with 100+ employees, nearly 60% are familyowned or private investor-owned
55 Massachusetts Manufacturers: Year Company Founded Year Company Founded; Source-CURP Survey 16.00% % 12.00% 10.00% 8.00% 6.00% 4.00% 2.00% 0.00% Missing
56 Massachusetts Manufacturers: Workforce Education Requirements Percentage of Firms Reporting that a Majority or more of their Jobs Require Stated Amount of Formal Education High School Diploma or GED 62.8% Bachelor's Degree 12.3% Graduate Degree 1.5% 0.0% 10.0% 20.0% 30.0% 40.0% 50.0% 60.0% 70.0%

57 Massachusetts Manufacturers: Hourly Wage for Unskilled Production Workers

58 Massachusetts Manufacturers: Hourly Wage for Skilled Production Workers
59 Why have Manufacturers Stayed in Massachusetts?

60 Reasons for Staying in Massachusetts
61 Percent of Firms Using State or Local Incentive Programs Workforce Training Grants 25.3% Investment Tax Credits 25.2% R&D Tax Credits 12.5% Low Interest Loans 9.5% Tax Increment Financing 6.3% Loan Guarantees 5.1% Equity Financing 2.0% Site Finder Assistance 1.3% 0% 5% 10% 15% 20% 25% 30%
62 Manufacturers Expansion Plans Expanding Production? Expanding Employment?
63 Expected Production Levels in Massachusetts over Next Five Years Close Down: 5% 11% 5% Cease Production Downsize: 11% Reduce Production EXPAND: 55% 28% Sustain Production Expand Production 55% No Change: 28%
64 Expected Production Levels over the next Five Years
65 5-Year Projections by Percent of Firms 5 Employment Projections CONTRACT: 12.3% 12.3% 8.5% 27.5% Reduce Employment Maintain Current Level Expand by 25% + Expand by 11-24% 20.6% EXPAND: 60.2% NO CHANGE: 27.5% Expand by 1-10% 31.1%
66 Challenges Facing Massachusetts Manufacturers Assuring that manufacturing remains a strong economic sector in the Commonwealth depends on taking action to meet a number of key challenges What our Survey showed What the Interviews told us
67 Challenges High Cost of Health Insurance High Cost of Workers Compensation High Taxes High Energy Costs High Labor Costs Environmental Regulations Zoning and Building Code Regulations Inadequate Supply of Appropriately Skilled Labor
68 What s Not a Challenge? Massachusetts weather and climate Trade unions Transportation and infrastructure Ability to import skilled labor
69 The Recruitment Challenge The manufacturing workforce is aging rapidly Replacing retirees will be a major challenge for many manufacturers This is especially true of skilled craftsmen even more difficult to recruit than scientific R&D workers Recruiting entry level workers as hard as recruiting middle managers

70 The Difficulty in Recruiting Labor for Massachusetts Manufacturers
71 How Can Government Help?
72 20 Most Important Actions Government can take to Assist Manufacturing in Massachusetts: TOP 10 % of Surveyed Firms Reduce Cost of Health Insurance 92% Reduce Workers Comp Costs 78% Ensure Lower Cost Energy 75% Reduce Unemployment Comp Costs 74% More Business-Friendly State Gov t 72% Reduce State Income & Sales Tax 68% Reduce Local Property Tax 63% More Business-Friendly Local Gov t 62% Improve Vocational Schools 49% Streamline State & Local Regulations 47%
73 20 Most Important Actions Government can take to Assist Manufacturing in Massachusetts: NEXT 10 % of Surveyed Firms Provide Access to Capital 43% Connect Community Colleges to MFG 42% Improve K-12 Education 42% Promote Emerging Technologies 37% Improve Workforce Training Programs 33% Expand & Improve Higher Education 33% Promote Exports 32% Reduce Crime in Local Communities 32% Expand Supply of Worker Housing 29% Weaken Influence of Trade Unions 28%
74 Manufacturers Want a Little Respect: The Rodney Dangerfield Syndrome In the interviews with CEOs, owners, and managers, we heard many times that the state seems to pay little respect to the manufacturing sector. Everyone talks about biotech, nanotech, and financial services but this large important sector seems to be thought of as some kind of dinosaur. This must change With little respect and little knowledge of manufacturing s strength, few young people see a reason to train for jobs in this sector
75 A Healthy Manufacturing Sector helps the Commonwealth deal with key challenges Provides diversity to state output so that we can better weather economic downturns Provides jobs for many workers, particularly those who do not go on to college Provides economic vitality to older regions in the state
76 So.believe it or not Mass Manufacturing has real Staying Power!
Missouri Economic Indicator Brief: Manufacturing Industries
 Missouri Economic Indicator Brief: Manufacturing Industries Manufacturing is a major component of Missouri s $293.4 billion economy. It represents 13.1 percent ($38.5 billion) of the 2015 Gross State Product
The Evolution of Supply Chain Management
 What is it? Advanced manufacturing involves the simultaneous digital integration using information technology, of design, of innovative materials, enterprise management, logistical systems, and marketing
Promoting Foreign Direct Investment in The United States. Christopher Clement International Investment Specialist Invest in America
 Promoting Foreign Direct Investment in The United States Christopher Clement International Investment Specialist Invest in America FDI in the U.S. Economy 5.2 million $40 billion $55 billion $190 billion
Regional Data Snapshot
 Regional Data Snapshot Industry Cluster Analysis SET Session 1 Ozark Foothills, Missouri Table of Contents 01 Overview 03 Industry Cluster Analysis 02 Industry and Occupation 04 Occupations 01 overview
The State of Georgia Small Business
 The State of Georgia Small Business 2011 Table of Contents GEORGIA SMALL BUSINESS FACTS Georgia Small Businesses...3 Women-Owned Businesses...3 Minority-Owned Businesses...3 Firms and Employment in Georgia...3
Catalogue no X. Industrial Research and Development: Intentions
 Catalogue no. 88-202-X Industrial Research and Development: Intentions 2013 How to obtain more information For information about this product or the wide range of services and data available from Statistics
BeNChMARks MASSACHUSETTS A PUBLICATION OF THE UNIVERSITY OF MASSACHUSETTS. The Quarterly Review of Economic news & Insight. The State of the State
 MASSACHUSETTS BeNChMARks The Quarterly Review of Economic news & Insight premier issue fall 97 Volume One Issue 1 The State of the State All About Composite Indexes Regional Dynamics The New Economic Structure
THE U.S. SEMICONDUCTOR INDUSTRY:
 THE U.S. SEMICONDUCTOR INDUSTRY: KEY CONTRIBUTOR TO U.S. ECONOMIC GROWTH Matti Parpala 1 August 2014 The U.S. Semiconductor Industry: Key Contributor To U.S. Economic Growth August 2014 1 INTRO The U.S.
How New Jersey's Economy Benefits from International Trade & Investment
 How New Jersey's Economy Benefits from International Trade & Investment With more than 95 percent of the world s population and 80 percent of the world s purchasing power outside the United States, future
THE ECONOMIC OUTLOOK FOR THE U.S. AND THE CONSTRUCTION INDUSTRY
 THE ECONOMIC OUTLOOK FOR THE U.S. AND THE CONSTRUCTION INDUSTRY by William F. Ford, Ph.D. Weatherford Chair of Finance Middle Tennessee State University presented to The Roofing Industry Alliance for Progress
SEMICONDUCTOR INDUSTRY ASSOCIATION FACTBOOK
 Factbook 2014 SEMICONDUCTOR INDUSTRY ASSOCIATION FACTBOOK INTRODUCTION The data included in the 2014 SIA Factbook helps demonstrate the strength and promise of the U.S. semiconductor industry and why it
Adopted March 17, 2009 (Ordinance 09-15)
") ECONOMIC ELEMENT of the PINELLAS COUNTY COMPREHENSIVE PLAN Prepared By: The Pinellas County Planning Department as staff to the LOCAL PLANNING AGENCY for THE BOARD OF COUNTY COMMISSIONERS OF PINELLAS COUNTY,
ECONOMIC ELEMENT of the PINELLAS COUNTY COMPREHENSIVE PLAN Prepared By: The Pinellas County Planning Department as staff to the LOCAL PLANNING AGENCY for THE BOARD OF COUNTY COMMISSIONERS OF PINELLAS COUNTY,
Regional Data Snapshot
 Regional Data Snapshot Industry Cluster Analysis SET Session 1 Kaysinger Basin Region, Missouri Table of Contents 01 Overview 03 Industry Cluster Analysis 02 Industry and Occupation 04 Occupations 01 overview
Why is US Productivity Growth So Slow? Possible Explanations Possible Policy Responses
 Why is US Productivity Growth So Slow? Possible Explanations Possible Policy Responses Presentation to Nomura Foundation Conference Martin Neil Baily and Nicholas Montalbano What is productivity and why
Regional Data Snapshot
 Regional Data Snapshot Industry Cluster Analysis SET Session 1 East Central NM, New Mexico Table of Contents 01 Overview 03 Industry Cluster Analysis 02 Industry and Occupation 04 Occupations 01 overview
Key Industry Sectors Driving Regional Prosperity and Growth in San Diego and Imperial Counties
 Key Industry Sectors Driving Regional Prosperity and Growth in San Diego and Imperial Counties Sector vs. Occupational Cluster Sales and related occ. Office and admin support Other occ. clusters Industry
Regional Data Snapshot
 Regional Data Snapshot Industry Cluster Analysis SET Session 1 Glacial Lakes Region, South Dakota Table of Contents 01 Overview 03 Industry Cluster Analysis 02 Industry and Occupation 04 Occupations 01
The State of Innovation. Orlando Saez
 The State of Innovation Orlando Saez Separating fact from myth Myth Illinois is hostile to businesses. Fact Illinois is a good place to do business, and it s getting better everyday. Illinois Economy Highlights
The future of work. Nav Singh Managing Partner, Boston McKinsey & Company
 The future of work Nav Singh Managing Partner, Boston Since the Industrial Revolution, innovation has fueled economic growth Estimated global GDP per capita, $ 100,000 1st Industrial Revolution 2 nd Industrial
3 Economic Development
 3 Economic Development Introduction: The Economic Development Element of the Comprehensive Plan is intended to guide the climate for enterprise and commercial exchange in Buckley and reinforce the overall
Information Technology and the Japanese Growth Recovery
 Information Technology and the Japanese Growth Recovery By Dale W. Jorgenson (Harvard University) Koji Nomura (Keio University) 17 th ANNUAL TRIO CONFERENCE, December 10, 2004 @Keio University, Tokyo Economic
Haldimand County 2018 Community Profile
 Labour Force Key Indicators Haldimand County is home to a labour force of more than 27,000 persons. As illustrated in Table 12, the labour force participation and employment rates are above that of Ontario.
Disbursements (In thousands of dollars, not adjusted for inflation) Industry
 Industry") Wage and Salary by NAICS Industry for Iowa: 2001-2009 1 (In thousands of dollars, not adjusted for inflation) Industry 2001 2002 2003 2004 2005 2006 2007 2008 2009 Wage and salary disbursements by place
Wage and Salary by NAICS Industry for Iowa: 2001-2009 1 (In thousands of dollars, not adjusted for inflation) Industry 2001 2002 2003 2004 2005 2006 2007 2008 2009 Wage and salary disbursements by place
Insight: Measuring Manhattan s Creative Workforce. Spring 2017
 Insight: Measuring Manhattan s Creative Workforce Spring 2017 Richard Florida Clinical Research Professor NYU School of Professional Studies Steven Pedigo Director NYUSPS Urban Lab Clinical Assistant Professor
Executive Summary. Introduction:
 Recommendations for British Columbia s 2013 Budget AME BC s Pre-Budget Submission to the Select Standing Committee on Finance and Government Services - October 18, 2012 Introduction: Executive Summary
Life Sciences Outlook. Westchester County 2016
 Life Sciences Outlook Westchester County 2016 Westchester County Just a short distance from Manhattan, Westchester County is an ideal location to many firms looking to attract and retain talent. The access
Industry Outlook September 2015
 Industry Outlook September 2015 Manufacturing Matters in Canada A $620 billion industry 12% of GDP (18% in 2004) 1.7 million direct employees (2.2 million in 2004) The largest payroll of any business sector
Information Technology and the Japanese Growth Recovery
 Information Technology and the Japanese Growth Recovery By Dale W. Jorgenson (Harvard University) and Koji Nomura (Keio University) February 14, 2006 Economic Growth in the Information Age The Information
POWERING AMERICA S AND NEVADA S ADVANCED INDUSTRIES
 POWERING AMERICA S AND NEVADA S ADVANCED INDUSTRIES Metropolitan Policy Program at BROOKINGS Las Vegas, October 2014 1 2 3 4 Context What, why Trends Strategy 2 2 3 4 1 Context 3 Real GDP 2005Q1-2014Q2
 http://www.bls.gov/oco/ocos217.htm Assemblers and Fabricators Nature of the Work Training, Other Qualifications, and Advancement Employment Job Outlook Projections Data Earnings OES Data Related Occupations
BUSINESS EMPLOYMENT DYNAMICS
 BUSINESS EMPLOYMENT DYNAMICS First Quarter 2018 Office of Research Kurt Westby, Commissioner Andrew Condon, Director of Research WETHERSFIELD, November 7th, 2018 - (BED) data published quarterly by the
Comparative study of SME development in Uzbekistan and Kazakhstan. Lyubov Tsoy CWRD intern Supervisor Dai Chai Song
 Comparative study of SME development in Uzbekistan and Kazakhstan Lyubov Tsoy CWRD intern Supervisor Dai Chai Song 1. Background 2. SME development trends (1991-2013) 3. Factors that caused differences
ECONOMIC SNAPSHOT. A Summary of the San Diego Regional Economy UNEMPLOYMENT
 A Summary of the San Diego Regional Economy UNEMPLOYMENT San Diego Regional EDC analyzes key economic metrics that are important to understanding the regional economy and San Diego's standing relative
Software Production in Kyrgyzstan: Potential Source of Economic Growth
 400 INTERNATIONAL CONFERENCE ON EURASIAN ECONOMIES 2011 Software Production in Kyrgyzstan: Potential Source of Economic Growth Rahat Sabyrbekov (American University of Central Asia, Kyrgyzstan) Abstract
Lowndes County by the Numbers
 Lowndes County by the Numbers How Do We Compare With Peer and Aspirant Communities? 2011 Report DRAFT 05/06/2011 Insert a collage of blended pictures from around Valdosta This report has been prepared
Lowndes County by the Numbers
 Lowndes County by the Numbers How Do We Compare With Peer and Aspirant Communities? 2015 Report This report has been prepared for the Valdosta-Lowndes County Chamber of Commerce by the Center for Business
 Skip Navigation Links http://www.bls.gov/oco/ocos237.htm Woodworkers Nature of the Work Training, Other Qualifications, and Advancement Employment Job Outlook Projections Data Earnings OES Data Related
Public Policies and Incentives for Smart Manufacturing in Turkey
 Public Policies and Incentives for Smart Manufacturing in Turkey Dr. Sinan Tandoğan Head of Entrepreneurship Support, TUBITAK sinan.tandogan@tubitak.gov.tr Industrial Technologies 2016, Amsterdam 22.06.16
The Construction Market in Europe: A Supplier s Point of View
 The Construction Market in Europe: A Supplier s Point of View Dr. Walter Nussbaumer Abstract After the 2009 recession and the 2010 stagnation, recovery took place in 2011 when the World Construction Industry
Taking the Measure of St. Louis
 Taking the Measure of St. Louis The views expressed here are those of the speakers and do not necessarily represent the views of the Federal Reserve Bank of St. Louis or of the Federal Reserve System.
VTT TECHNOLOGY STUDIES. KNOWLEDGE SOCIETY BAROMETER Mika Naumanen Technology Studies VTT Technical Research Centre of Finland
 KNOWLEDGE SOCIETY BAROMETER Mika Naumanen Technology Studies VTT Technical Research Centre of Finland Knowledge society barometer Economic survey -type of tool to assess a nation s inclination towards
A TAXONOMY OF DIGITAL INTENSIVE SECTORS
 A TAXONOMY OF DIGITAL INTENSIVE SECTORS Flavio Calvino Chiara Criscuolo Luca Marcolin Mariagrazia Squicciarini OECD Directorate for Science, Technology and Innovation (STI) ESCoE Annual Conference on Economic
DELAWARE S FUTURE IN THE NEW ECONOMY
 DELAWARE S FUTURE IN THE NEW ECONOMY A REVIEW OF THE KAUFFMAN FOUNDATION S 2012 NEW ECONOMY INDEX REPORT Ken Anderson Director Entrepreneurial and Small Business Development Delaware Economic Development
A S TATE OF ACHIE V EMENT. West Virginia s welcoming business climate
 A S TATE OF ACHIE V EMENT West Virginia s welcoming business climate The Development Office was terrific. There was complete transparency, which builds a lot of confidence that you re working with an organization
ECONOMIC SNAPSHOT. A Summary of the San Diego Regional Economy UNEMPLOYMENT
 A Summary of the San Diego Regional Economy Brought to you by analyzes key economic metrics that are important to understanding the regional economy and San Diego s standing relative to other major metropolitan
San Diego, California Market Profile
 San Diego, California Market Profile Quick facts about San Diego 1 With its warm, year-round climate, 50 miles of sun-soaked coastline and world-famous attractions, San Diego is a top tourist destination.
ECONOMIC ELEMENT. of the PINELLAS COUNTY COMPREHENSIVE PLAN. Prepared By: The Pinellas County Planning Department. as staff to the
 ECONOMIC ELEMENT of the PINELLAS COUNTY COMPREHENSIVE PLAN Prepared By: The Pinellas County Planning Department as staff to the LOCAL PLANNING AGENCY for THE BOARD OF COUNTY COMMISSIONERS OF PINELLAS COUNTY,
Why is US Productivity Growth So Slow? Possible Explanations Possible Policy Responses
 Why is US Productivity Growth So Slow? Possible Explanations Possible Policy Responses Presentation to Brookings Conference on Productivity September 8-9, 2016 Martin Neil Baily and Nicholas Montalbano
COUNTRY REPORT: TURKEY
 COUNTRY REPORT: TURKEY (a) Why Economic Census? - Under what circumstances the Economic Census is conducted in your country. Why the economic census is necessary? - What are the goals, scope and coverage
III. THE REGIONAL FRAMEWORK
 THE SAN DIEGO REGIONAL ECONOMY III. THE REGIONAL FRAMEWORK The San Diego region, comprised solely of San Diego County, is one of California s most dynamic regions. The efforts of the University within
2012 Small Business Leadership Forum hosted by CFO Jeff Atwater and the Jim Moran Institute
 CONTENTS Please click on the presentation you would like to view Small Businesses and Florida s Economy Sean Snaith, PhD David Denslow, PhD Growing Your Small Business Jerry Cartwright Hugh Dailey September
The State of the Erie Economy
 The State of the Erie Economy Presentation to Presque Isle CPCU Society Chapter September 14, 2017 Kenneth Louie The Economic Research Institute of Erie Sam and Irene Black School of Business Penn State
MEMBERS OF THE TRADE REFORM ACTION COALITION (TRAC)
") MEMBERS OF THE TRADE REFORM ACTION COALITION (TRAC) An alliance of U.S. companies, trade associations, unions and workers in the automative parts, chemicals, coal, color televi sions, fiber/textile/apparel,
MEMBERS OF THE TRADE REFORM ACTION COALITION (TRAC) An alliance of U.S. companies, trade associations, unions and workers in the automative parts, chemicals, coal, color televi sions, fiber/textile/apparel,
COLUMBUS 2020 A REGIONAL GROWTH STRATEGY FOR CENTRAL OHIO
 COLUMBUS 2020 A REGIONAL GROWTH STRATEGY FOR CENTRAL OHIO Vision To achieve the strongest decade of growth in the Columbus Region s history Mission To strengthen the economic base of the 11-county Columbus
IP-Intensive Manufacturing Industries: Driving U.S. Economic Growth
 IP-Intensive Manufacturing Industries: Driving U.S. Economic Growth September 2017 About the Author Nam D. Pham is Managing Partner of ndp analytics, a strategic research firm that specializes in economic
E-COMMERCE AS A TOOL FOR DEVELOPMENT : ANALYTICAL AND REGIONAL PERSPECTIVE ARUN JACOB
 E-COMMERCE AS A TOOL FOR DEVELOPMENT : ANALYTICAL AND REGIONAL PERSPECTIVE ARUN JACOB CONTENTS Context Defining e-commerce Analysing digital trade : challenges and approaches Regional trends in digital
Governor Paterson breaks ground on GlobalFoundaries' Fab 2 project
 Governor Paterson breaks ground on GlobalFoundaries' Fab 2 project August 21, 2009 - Front Section Governor David Paterson, GlobalFoundries U.S. Inc., Advanced Micro Devices (AMD) and senior state officials
EXECUTIVE SUMMARY. Robot sales to the fabricated metal products industry, the chemical industry and the food industry increased substantially.
 2006 World Robot Market EXECUTIVE SUMMARY Total world-wide sales: 112,200 units, down 11% on 2005 World total stock of operational industrial robots: 951,000 units,3% greater than 2005 The world market
2017 Annual Report. Finney County Garden City Holcomb January 10, 2018
 2017 Annual Report Finney County Garden City Holcomb January 10, 2018 TABLE OF CONTENTS Purpose of the Annual Report... 3 2017 Partners & Board of Directors... 4 Mission Statement/Cooperative Partnership...
SASKATCHEWAN INSTITUTE MAY Ready, Set, Grow.
 SASKATCHEWAN INSTITUTE 2012 17 MAY 2017 Ready, Set, Grow. The interactivity really reinforced the point that innovation is not about reinventing, but about the creative process learning and creativity
An Introduction to China s Science and Technology Policy
 An Introduction to China s Science and Technology Policy SHANG Yong, Ph.D. Vice Minister Ministry of Science and Technology, China and Senior Fellow Belfer Center for Science and International Affairs
ECONOMIC SNAPSHOT. A Summary of the San Diego Regional Economy UNEMPLOYMENT
 A Summary of the San Diego Regional Economy Brought to you by San Diego Regional EDC analyzes key economic metrics that are important to understanding the regional economy and San Diego s standing relative
Innovation in U.S. Manufacturing
 Innovation in U.S. Manufacturing Robert D. Atkinson President, ITIF September 19, 2017 @RobAtkinsonITIF @ITIFdc About ITIF Independent, nonpartisan research and education institute focusing on intersection
US Productivity After the Dot Com Bust
 McKinsey Global Institute US Productivity After the Dot Com Bust Diana Farrell Martin Baily Jaana Remes December 2005 McKinsey Global Institute The McKinsey Global Institute (MGI) was established in 1990
Under the Patronage of His Highness Sayyid Faisal bin Ali Al Said Minister for National Heritage and Culture
 ORIGINAL: English DATE: February 1999 E SULTANATE OF OMAN WORLD INTELLECTUAL PROPERTY ORGANIZATION Under the Patronage of His Highness Sayyid Faisal bin Ali Al Said Minister for National Heritage and Culture
Economic engine of the midwest st. louis, missouri
 Economic engine of the midwest st. louis, missouri Advantage doing business here competitive St. Louis, Missouri is the dynamic, low-cost place to grow your business. From starting small to growing globally,
Chapter 5. Forms of Business Ownership and Organization
 Chapter 5 Forms of Business Ownership and Organization Learning Objectives 1 2 Discuss why most businesses are small businesses. Determine the contributions of small businesses to the economy. 7 Outline
The Florida Turnaround Story
 The Florida Turnaround Story In 2010, Florida was in a free fall. Florida lost more than 800,000 jobs, the real estate market had collapsed and tourism was on the decline. State debt had grown by about
Life Sciences. An evolving industry: Today s clusters creating tomorrow s breakthroughs. Long Island JLL Research
 Life Sciences Long Island 2017 An evolving industry: Today s clusters creating tomorrow s breakthroughs JLL Research Suffolk County Stony Brook University serves as an integral part of the research corridor
Office of International Business Development a Global, Strategic Approach to Creating and Keeping Jobs in Pennsylvania
 Pennsylvania Department of Community & Economic Development Office of International Business Development a Global, Strategic Approach to Creating and Keeping Jobs in Pennsylvania Pennsylvania s Profile
Innovation Destination. Thriving in the North. Business Development Guide. minnesota is the PRime location FoR breakthrough companies
 MINNESOTA 2018 in Business Development Guide t Guide EDITION livability.com/mn Thriving in the North Innovation Destination minnesota is the PRime location FoR breakthrough companies SPONSORED BY THE MINNESOTA
A STATE OF ACHIE V EMENT. West Virginia s welcoming business climate
 A STATE OF ACHIE V EMENT West Virginia s welcoming business climate The Development Office was terrific. There was complete transparency, which builds a lot of confidence that you re working with an organization
Objectives ECONOMIC GROWTH CHAPTER
 9 ECONOMIC GROWTH CHAPTER Objectives After studying this chapter, you will able to Describe the long-term growth trends in the United States and other countries and regions Identify the main sources of
Overview of Venture Equity
 Overview of Venture Equity SVB Analytics Report 2017 Written by SVB Analytics: Steve Liu Managing Director sliu@svb.com Sean Lawson Senior Manager slawson2@svb.com Steven Pipp Senior Associate spipp@svb.com
Creative North Carolina Measures
 Creative North Carolina Measures National research documents how much North Carolina s rich cultural heritage contributes to both our quality of life and economic stability. When communities have a strong
China s Sputnik Moment
 By Gorlen Zhou and Matthew Strauss September 29, 2017 Many economists express doubts about China s ability to move up the value chain to attain the status of a higher-income economy, especially since China
PLUS REVIEW Q Quarterly Economic Indicators 18 Counties of Northeast Ohio
 PLUS REVIEW Q2 Quarterly Economic Indicators 18 Counties of Northeast Ohio Unemployment in the Cleveland Plus region continues to trend lower than the national average. Manufacturing, which represents
Government of Puerto Rico Department of Labor and Human Resources Bureau of Labor Statistics BUSINESS EMPLOYMENT DYNAMICS: FOURTH QUARTER
 Government of Puerto Rico Department of Labor and Human Resources Bureau of Labor Statistics BUSINESS EMPLOYMENT DYNAMICS: FOURTH QUARTER 2011 TABLE OF CONTENTS Introduction.1 Business Employment Dynamics:
High Tech Industry in Georgia
 High Tech Industry in Georgia presentation to the General Assembly Budgetary Responsibility Oversight Committee Georgia Tech President G. Wayne Clough January 24, 2003 High-Tech Drives the Economy Compound
Dr. Greg Hallman Director, Real Estate Finance and Investment Center (REFIC) McCombs School of Business University of Texas at Austin
 McCombs School of Business University of Texas at Austin") Dr. Greg Hallman Director, Real Estate Finance and Investment Center (REFIC) McCombs School of Business University of Texas at Austin POWERPOINT PARTNER } The US Economy today, with a close look at jobs
Dr. Greg Hallman Director, Real Estate Finance and Investment Center (REFIC) McCombs School of Business University of Texas at Austin POWERPOINT PARTNER } The US Economy today, with a close look at jobs
Investment in Portugal
 Investment in Portugal Carlos Morgado Building On Success Global Tax Conference Lisbon, Portugal www.bakertillyinternational.com Portugal in a Nutshell 1.Portugal in a Nutshell 2.Economical Recent Developments
Guidelines to Promote National Integrated Circuit Industry Development : Unofficial Translation
 Guidelines to Promote National Integrated Circuit Industry Development : Unofficial Translation Ministry of Industry and Information Technology National Development and Reform Commission Ministry of Finance
Japan s business system has changed significantly since 2000, shifting toward
 1 Continuity and Change in Japan s Ecosystem for Venture-Capital backed Start-up Companies: Encouraging the Creation of Firms to Stimulate Economic Growth and Jobs Japan s business system has changed significantly
U.S. Small Business Administration Tim Jeffcoat, District Director Houston District Office
 U.S. Small Business Administration Tim Jeffcoat, District Director Houston District Office AGENDA Who Are We and What Do We Do and How Do We Do It and Who Does It and Why You Should Care Warning! Warning!
Life Sciences Outlook. New York City 2016
 Life Sciences Outlook City 2016 City is emerging as a leading destination for biotech startups and the larger life sciences industry. Investors have committed millions of dollars throughout the city and
Moving Ahead. Third-quarter Technology venture capital investment increased 33 percent yearover-year. percent quarter-over-quarter.
 Moving Ahead Third-quarter Technology venture capital investment increased 33 percent yearover-year but decreased 6 percent quarter-over-quarter October 2 PwC US venture capital funding for the Technology
About 32 percent of all carpenters the largest construction trade were selfemployed.
 http://www.bls.gov/oco/ocos202.htm Carpenters Nature of the Work Training, Other Qualifications, and Advancement Employment Job Outlook Projections Data Earnings OES Data Related Occupations Sources of
Kazakhstan Way of Innovation Clusterization K. Mukhtarova Al-Farabi Kazak National University, Almaty, Kazakhstan
 Journal of Social Sciences (COES&RJ-JSS) ISSN (E): 2305-9249 ISSN (P): 2305-9494 Publisher: Centre of Excellence for Scientific & Research Journalism, COES&RJ LLC Online Publication Date: 1 st January
The Evolution of Science and Technology: The Need for a New Policy Model. Jerald Hage, Director Center for Innovation,
 The Evolution of Science and Technology: The Need for a New Policy Model Jerald Hage, Director Center for Innovation, The Present Policy Model Characteristics: 1.Societal level; 2.Inputs of funding and
CALIFORNIA S MANUFACTURING INDUSTRIES: EMPLOYMENT AND COMPETITIVENESS
 CALIFORNIA S MANUFACTURING INDUSTRIES: EMPLOYMENT AND COMPETITIVENESS in the 21 st Century JUNE 2014 INSTITUTE FOR APPLIED ECONOMICS Los Angeles County Economic Development Corporation CALIFORNIA S MANUFACTURING
KANSAS BIOSCIENCE INDEX 2008
 Innovation Capacity Education Capacity Workforce Capacity KANSAS BIOSCIENCE INDEX 2008 Industrial Output Prepared by: Research & Development Capacity ACKNOWLEDGEMENTS The Bioscience Authority contracted
California in the 21st century: State of the State
 in the 21st century: State of the State Briefing Book CONFERENCE PARTNERS The Milken Institute gratefully acknowledges the support of the following companies, whose generous support helped make the in
A Compendium of National Statistics on Women-Owned Businesses in the U.S. Executive Summary and Data Report
 A Compendium of National Statistics on Women-Owned Businesses in the U.S. Executive Summary and Data Report Prepared for National Women s Business Council September 2001 Table of Contents Introduction...1
U.S. Corporate R&D Investment, Final Estimates
 U.S. Corporate R&D Investment, 1994 2000 Final Estimates Despite a slowing economy, public corporations headquartered in the United States almost doubled the growth rate of their investment in research
Canada s Engineering and Applied Science Technicians and Technologists. Assessing Their Economic Contribution
 Canada s Engineering and Applied Science Technicians and Technologists. Assessing Their Economic Contribution REPORT APRIL 2016 For the exclusive use of Eric Morin, ericm@aset.ab.ca, ASET. Canada s Engineering
Indiana Advanced industries employ 365,425 full-time workers. (2015)
") AMERICA'S ADVANCED INDUSTRIES industries employ 365,425 full-time workers. () These direct jobs supports an additional 292,340 indirect jobs in other industries in the region. industries produce $74.3
AMERICA'S ADVANCED INDUSTRIES industries employ 365,425 full-time workers. () These direct jobs supports an additional 292,340 indirect jobs in other industries in the region. industries produce $74.3
Coal. Johnston. Pontotoc. Murray. Garvin. Coal, Garvin, Johnston, Murray, Pontotoc; OK. Source: RDM, PCRD & ESRI
 Murray Coal, Garvin, Johnston, Murray, Pontotoc; OK Source: RDM, PCRD & ESRI Garvin Johnston Pontotoc Coal Economic & Demographic Attributes Value Remarks Source Population (2012) 95,884 People living
SAN DIEGO S QUARTERLY ECONOMIC SNAPSHOT
 SAN DIEGO S QUARTERLY ECONOMIC SNAPSHOT November 2017 SAN DIEGO HIGHLIGHTS IN THIS ISSUE Every quarter San Diego Regional EDC analyzes key economic indicators that are important to understanding the regional
BASED ECONOMIES. Nicholas S. Vonortas
 KNOWLEDGE- BASED ECONOMIES Nicholas S. Vonortas Center for International Science and Technology Policy & Department of Economics The George Washington University CLAI June 9, 2008 Setting the Stage The
Case Study Disclaimer. Participants Case Studies
 Case Study Disclaimer Participants Case Studies This case study were created for training purposes only by the participants of the Managing Structural Adjustment from Trade Reform Training Program. They