How to Read the Stock Chart
|
|
|
- Conrad Bond
- 6 years ago
- Views:
Transcription
1 How to Read the Stock Chart
2 Stock charts There are several different kinds of charts: line chart OHLC chart candlestick
3 Line charts The line chart is a single line with starting and ending points. The points may be a session s opening or closing price. The line chart is limited because it does not provide enough details to judge a stock s performance.
4 Chart courtesy of StockCharts.com
5 OHLC chart OHLC stands for open, high, low, close. The daily entry to the chart has three attributes: a vertical line stretching from the day s high to low price a small horizontal line attached to the left of the vertical line, representing the session s opening price a small horizontal line attached to the right of the vertical line, representing the session s closing price
6 Chart courtesy of StockCharts.com
7 Candlestick charts The most useful of all charts is the candlestick. This chart has a rectangular real body. A white real body appears when the price moved up A black real body appears when the price moved down. The top and bottom of the rectangle represent the session s opening and closing prices. Sticking out from the top and bottom are the shadows. These represent the range of trading during the session, from highest to lowest price.
8
9 Chart courtesy of StockCharts.com
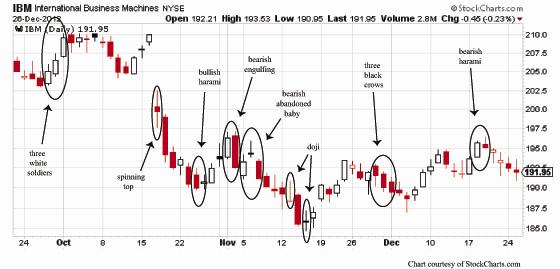
10 Candlestick reversal patterns Among the many useful patterns are single session, two session and threesession reversal signals. These predict a change of direction in price. However, all reversal signals should be confirmed before they are acted on. Confirmation may consist of other candlesticks and many other reversal indicators. Hundreds of different candlestick signals may be found. This section explains only a few of these. Some candlestick reversals Reversal indicators may be only one session: doji spinning top They may consist of two consecutive sessions: engulfing harami Reversals can also be found in three consecutive sessions: three white soldiers three black crows abandoned baby
11
12 Western technical analysis Traditional Western technical analysis is based on price patterns that signal reversal. There are dozens of signals. Some of the most useful include only a few demonstrated here. Western signals may confirm candlestick reversal indicators, such as candlesticks may serve as confirmation for Western signals. Some technical signals Technical signals may relate to the trading range: resistance support They may consist of tests of the border and reversal: head and shoulders inverse head and shoulders Technical signals also appear when the prior trading range changes and price breaks out to form a new range: gaps breakouts
13
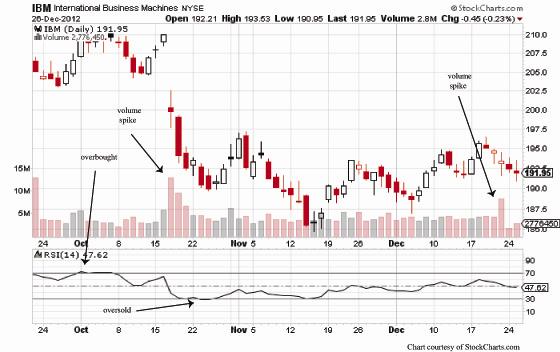
14 Volume indicators and momentum oscillators A volume indicator is any test of volume in relation to price. Volume indicators work as confirmation of reversal. One of the best confirmation signals is the volume spike, a one day or twoday rise in volume, followed by a return to normal levels. A momentum oscillator is a calculation of price averages. It tests the strength or weakness of a trend, as well as its speed of movement. As momentum begins to slow down, the index of a momentum oscillator is likely to move into overbought or oversold range. This foretells a likely reversal. Other technical signals Volume: indicators include calculated volume tests volume spikes are also good confirmation signals. Momentum: among the many volume indicators is the Relative Strength Index (RSI), which creates an index from 1 to 100. Above 70 indicates overbought; below 30 indicates oversold.
15
16 Conclusion Candlestick charts are the most useful format, as they summarize all price information in a visual manner. Candlestick reversals may be confirmed with traditional Western signals and price tests. Further confirmation comes from volume signals and from momentum oscillators.
by Ashwani Gujral Getting the best of East and West.
 by Ashwani Gujral Getting the best of East and West. Candlestick charting signals can be used in conjunction with Western indicators and the results achieved might be better than using them individually.
With Steve Nison, CMT President: Candlecharts.com
 With Steve Nison, CMT President: Candlecharts.com Legal Notice: This recording is Candlecharts.com and may not be copied, retransmitted, nor distributed in any manner whatsoever, including, but not limited
Equal open and close candles. ( known as doji candles ) Short body candles. Long body candles.
 Short body candles. Long body candles.") I have broken down the patterns into 3 categories: Equal open and close candles. ( known as doji candles ) Short body candles. Long body candles. Within these categories are both bullish reversal and bearish
I have broken down the patterns into 3 categories: Equal open and close candles. ( known as doji candles ) Short body candles. Long body candles. Within these categories are both bullish reversal and bearish
The Candlestick EXPRESS Class with Steve Nison
 With Steve Nison, CMT President: Candlecharts.com & the first to reveal candlesticks to the Western world Candlestick Charting Techniques Candles + Western Charting Tools Candles for Trade Management 1
Japanese candlestick charts, discussed in Chapter 3, are an alternative
 The Visual Investor: How to Spot Market Trends, Second Edition By John J. Murphy Copyright by John J. Murphy. APPENDIX B Japanese Candlesticks Japanese candlestick charts, discussed in Chapter 3, are an
If I was to suggest that the charts you are looking at could be literally speaking to you, would you think I had gone slightly mad?
 Section Two Get to know your Charts Runtime 10min 37s So we now have covered off the basics, you ve got your platform open, charts at the ready & your raring to find out how all these traders make mega
This strategy will identify a break of a trend and take advantage of the movement to the opposite direction.
 Thanks for checking out the RSI 80-20 Trading Strategy, You are going to benefit from this strategy by learning to trade divergence, and finding a low risk way to sell near the top or buy near the bottom
The advantage of candlestick charts is the ability to highlight trend weakness and reversal signals that may not be apparent on a normal bar chart.
 CANDLESTICKS CHART Candlesticks contain the same data as a normal bar chart but highlight the relationship between opening and closing prices. The narrow stick represents the range of prices traded during
Teodosi s Simple Oscillator-based System ( Forex Strategies Revealed - Simple System #8)
") ( Forex Strategies Revealed - Simple System #8) http://forex-strategies-revealed.com -DISCLAIMER- Virtually all of the information in this paper was sourced from the Forex Strategies Revealed website.
( Forex Strategies Revealed - Simple System #8) http://forex-strategies-revealed.com -DISCLAIMER- Virtually all of the information in this paper was sourced from the Forex Strategies Revealed website.
Use of Candlestick charts
 Use of Candlestick charts Candlestick chart was developed in 1700s in Japan by a man named Munehisa Homma, originally designed to trade rice futures in the 17th century, he invented a method to analyze
THE POWER OF JAPANESE CANDLESTICK CHARTS
 THE POWER OF JAPANESE CANDLESTICK CHARTS Founded in 1807, John Wiley & Sons is the oldest independent publishing company in the United States. With offi ces in North America, Europe, Australia and Asia,
CANDLESTICK TRADING STRATEGIES
 TAFX CANDLESTICK TRADING STRATEGIES Disclaimer is in no way affiliated or representative of any other company, organisation, club or society, and the views presented are solely our own opinions. The author(s)
Candlesticks by Louizos Alexander Louizos,
 CANDLESTICKS CHARTING As we mentioned before candlesticks behold some trend signals. In this chapter you will learn how to correctly evaluate trends using candlestick charts. Always remember: candlesticks
BULLISH ENGULFING. Confirmation: Suggested. No. of Sticks: 2
 BULLISH ENGULFING Type: Reversal Medium Engulfing Pattern is a pattern characterized by a large white real body engulfing a preceding small black real body, which appears during a downtrend. The white
THE MAJOR CANDLESTICKS SIGNALS
 THE MAJOR CANDLESTICKS SIGNALS Profit BIG with Candlesticks Master these Major Candlestick Signals it you want to Master the Market. Copyright @ Stephen W. Bigalow May not be duplicated or distributed
Chapter 3 THEORETICAL FRAMEWORK OF CANDLESTICK CHARTS. way about candlestick charts. The details of the same is shown as follows.
 Chapter 3 THEORETICAL FRAMEWORK OF CANDLESTICK CHARTS After the extensive review of literature, this chapter gives the conceptual and back ground of the technicalities of the study. The study covers about
Frontline FX: Key Candlestick Strategies for Profitable FX Trades Candlestick Essentials and Beyond for FX
 Frontline FX: With Steve Nison, CMT President: Candlecharts.com Easy to Understand Early Reversals Safety First East + West All FX markets All Time Frames Accelerates Analysis Current volatility in FX
Prepared by Dave Forster April 9, 2016
 Candlesticks Prepared by Dave Forster April 9, 2016 Who is this guy? Methods of Technical Analysis Technical Analysis Inputs Price vs. Volume How I approach Charting How a Candlestick is Constructed Neutral
Candlesticks for Intraday and Swing Trading. Day 1 with Steve Nison, CMT President: Candlecharts.com
 Candlesticks for Intraday and Swing Trading Day 1 with Steve Nison, CMT President: Candlecharts.com Slide 2 Media Comments Japan's Candlesticks Light Traders' Path - Wall Street Journal Whether you day
17 Money Making CandleStick Formations. you can use today in MarketClub
 17 Money Making CandleStick Formations you can use today in MarketClub Candlestick lines and charts Candlestick lines and charts -- traditional Japanese charts whose individual lines look like candles,
The Origins of Japanese Candlestick Charting
 The Origins of Japanese Candlestick Charting Munehisa Homma (1724-1803), also referred to as Sokyu Homma or Sokyu Honma, was a wealthy rice merchant and trader from Sakata, Japan who lived during during
SPECIAL REPORT: CANDLESTICK PATTERN SUMMARY
 SPECIAL REPORT: CANDLESTICK PATTERN SUMMARY Louise Bedford This Special Report is an extract from the Candlestick Charting Home Study Course. It is a handy, quick reference guide that you can refer to
Rick Saddler s Introduction to Trading with. Japanese Candlesticks
 Rick Saddler s with Japanese Candlesticks him Learning to Read Stock Charts With Japanese Candlesticks Rick Saddler Hit and Run Candlesticks Trading for Profits, LLC Phone: (417) - 848-3519 www.hitandruncandlesticks.com
This page intentionally left blank
 This page intentionally left blank Bloomberg Visual Guide to Candlestick Charting How to Use This Book The Bloomberg Visual series is meant to serve as the all-encompassing, yet easy-to-follow, guide on
The secrets of Candlestick Charts Unveiled
 NeW york ChICAgO LONDON DUBAI* TOkyO singapore sydney ADA The secrets of Candlestick Charts Unveiled By GFT Above all, Integrity. FUTURES FOREX CFDs Worldwide Leaders in Online Trading CD04U.041.102808
TEB Candle Patterns. Here is a trade I took. when I see one as clear as this one I will take it and say thanks!
 TEB Candle Patterns 1st Candle Formation: 3 Candle Reversal with Pin Candle One of my favourite candle formations is the 3 candle reversal.. variation with a big pin candle (nose or tail)the Pin is the
PCF s for TC2000 and TCNet Users 3 MAJOR SIGNALS. Volume II: The Hammer. The Shooting Star. The Harami
 PCF s for TC2000 and TCNet Users 3 MAJOR SIGNALS Volume II: The Hammer The Shooting Star The Harami A Candlestick Forum publication Years of Candlestick Analysis made available in concise formats. Information
FlashChart. Symbols and Chart Settings. Main menu navigation. Data compression and time period of the chart. Chart types.
 FlashChart Symbols and Chart Settings With FlashChart you can display several symbols (for example indices, securities or currency pairs) in an interactive chart. You can also add indicators and draw on
Planetary 2 Library P O W E R P L A Y S I I L I B R A R Y. Introduction: Benefits: Included in this Library: L I B R A R I E S
 Planetary 2 Library P O W E R P L A Y S I I L I B R A R Y Introduction: The Power Plays II library introduces some new studies as well as some already well known ones. It also gives you access to some
For next week support for the index is lies in the zone of and levels. The index can face its resistance at the level of &
 27 AUG 2018 GOLD: The bullion metal shows some strength and sustaining on major support level, after making the weekly low in previous trading week this week gold made big bullish candle on weekly chart.
Chifbaw Oscillator User guide
 Chifbaw Oscillator User guide www.chifbaw.com Indicator and document revision: 1.2 Known bugs: -The alert function system gives sometimes a fake alert when the indicator is initiated on a given currency
Steve Nison s Candlecharts.com Secrets of Intraday Candlesticks for Day and Swing Traders
 With Steve Nison, CMT President: Candlecharts.com Legal Notice: This webcast and recording is Candlecharts.com and may not be copied, retransmitted, nor distributed in any manner whatsoever, including,
Basic Technical Analysis
 Basic Technical Analysis Disclaimer You may from time to time be provided with marketing material, investment & financial related information and reports, including but not limited to research reports
Blips By David Duty CTA Price $99.00 Includes 60 Minutes of Video on Blips
 Blips By David Duty CTA www.commonsensecommodities.com Price $99.00 Includes 60 Minutes of Video on Blips Page 1 My name is David Duty and I m a CTA or Commodity Trading Advisor and I started trading commodities
Steve Nison s Quick Start Guide to Correctly Using Candlesticks. WithSteve Nison, CMT President: Candlecharts.com
 WithSteve Nison, CMT President: Candlecharts.com 1 Benefits of Nison Candlesticks Any market Any time frame Simple to apply Safety first trading Early reversals for razor sharp entries and exits Profit
TeleTrader FlashChart
 TeleTrader FlashChart Symbols and Chart Settings With TeleTrader FlashChart you can display several symbols (for example indices, securities or currency pairs) in an interactive chart. You can also add
Candlesticks. The Basics. Anatomy Of A Candlestick
 Candlesticks The Basics Japanese Candlesticks provide an excellent piece of the Technical Analysis puzzle. Each candle gives you the opening price, the low of the period, the high of the period and the
Candlestick Patterns (Every trader should know)
") Candlestick Patterns (Every trader should know) A doji represents an equilibrium between supply and demand, a tug of war that neither the bulls nor bears are winning. In the case of an uptrend, the bulls
Candlestick Patterns (Every trader should know) A doji represents an equilibrium between supply and demand, a tug of war that neither the bulls nor bears are winning. In the case of an uptrend, the bulls
Candlestick Charting Quick Reference Guide
 Quickly and easily master the common Candlestick Charting patterns, with the Candlestick Charting Quick Reference Guide www.yourtradingcoach.com Because you d rather be trading for a living! Disclaimer
Encyclopedia of Candlestick Charts
 Encyclopedia of Candlestick Charts Founded in 1807, John Wiley & Sons is the oldest independent publishing company in the United States. With offices in North America, Europe, Australia, and Asia, Wiley
Candles shed light on the market
 Candles shed light on the market By KIRA MCCAFFREY BRECHT When Steve Nison provided trade recommendations to brokers at Shearson Lehman Hutton, where he worked in the futures research department more than
Findings. A Number of Candles Do Not Work as Expected
 1 Findings Arguably, you are reading the most important chapter because it discusses the discoveries I made about candles while researching this book. You may already know some of them, but the others
Candlesticks: What they are and how to use them? NUS Investment Society Global Macro Department Gideon Wong & Devin Nathanael GM Research Analyst
 Candlesticks: What they are and how to use them? NUS Investment Society Global Macro Department Gideon Wong & Devin Nathanael GM Research Analyst Disclaimer NUS Invest is in no way affiliated or representative
Continued on the Next Page
 The Candlestick X-Ray Indicator Package: State-of-the-Art Pattern Detection Page 3 An Overview of the Candlestick X-Ray Features Page 5 The Complete List of Candlestick Patterns: 92 Fibonacci-Based Patterns
COPYRIGHTED MATERIAL. Candlesticks = Signals INTRODUCTION
 1 Candlesticks = Signals INTRODUCTION Traders and investors have been looking at charts for well over 85 years as Edwin Lefèvre wrote (1994, p. 61), I should say that a chart helps those who can read it
An Investor's Guide to Candlestick Patterns
 An Investor's Guide to Candlestick Patterns By Gordon Kristopher Dec 12, 2014. 03:34 PM What Are Candlestick Patterns in Technical Analysis? Candlestick patterns In technical analysis, candlestick patterns
Candlestick Patterns And Trading Strategies
 We have made it easy for you to find a PDF Ebooks without any digging. And by having access to our ebooks online or by storing it on your computer, you have convenient answers with candlestick patterns
21 CANDLESTICKS EVERY TRADER SHOULD KNOW. Dr. Melvin Pasternak
 21 CANDLESTICKS EVERY TRADER SHOULD KNOW Dr. Melvin Pasternak Working Title: 21 Candlesticks Every Trader Should Know Author: Dr. Melvin Pasternak Publisher: Marketplace Books Release Date: January 2006
Design and Implementation of Candlestick Chart Retrieval Algorithm for Predicting Stock Price Trend
 Design and Implementation of Candlestick Chart Retrieval Algorithm for Predicting Stock Price Trend Yoshihisa Udagawa Computer Science Department, Faculty of Engineering, Tokyo Polytechnic University Atsugi-city,
Encyclopedia Of Chart Patterns
 We have made it easy for you to find a PDF Ebooks without any digging. And by having access to our ebooks online or by storing it on your computer, you have convenient answers with encyclopedia of chart
Reversing candles. Three black crows. Exhibit 13.0 The three black crows pattern
 Three black crows Reversing candles Three black crows Exhibit 13.0 The three black crows pattern The pattern of upside gap two crows has two black candles gap upon the previous bullish real body. The three
The Candlestick Course
 A MARKETPLACE BOOK The Candlestick Course STEVE NISON John Wiley & Sons, Inc. The Candlestick Course John Wiley & Sons Founded in 1807, John Wiley & Sons is the oldest independent publishing company in
The Application of Japanese Candlestick Trading Strategies in Taiwan
 The Application of Japanese Candlestick Trading Strategies in Taiwan AUTHORS ARTICLE INFO JOURNAL FOUNDER YeongJia Goo DarHsin Chen YiWei Chang YeongJia Goo, DarHsin Chen and YiWei Chang (2007). The Application
The Stair Step Trade. Written By: Jason Ramus Copyright: 2017
 The Stair Step Trade Written By: Jason Ramus www.daytradingfearless.com Copyright: 2017 The Waterfall Introduction: Let me first say thank you for taking the time to read this amazing Book. I believe this
GBR/CAA SCORE SHEET CLUBMAN SCHEDULE Judge
 Venue: GBR/CAA SCORE SHEET CLUBMAN SCHEDULE Date: Round 1 Round 2 Round 3 Round 4 1 Rectangular Take-off Sequence 2 2 2 2 2 Two Inside Loops 3 Immelman Turn 2 2 2 2 4 One Outside Loop 2 2 2 2 5 Split S
Telemet Orion v5.0x New Features
 Telemet Orion v5.0x New Features What are: Trendlines Point and Figure Charts Candlesticks Trendlines Eight new trendline studies are offered in Telemet Orion v5.0x. Access these with the pull down menu
DOWNLOAD PDF ENCYCLOPEDIA OF CHART PATTERNS BULKOWSKI
 Chapter 1 : Encyclopedia of Candlestick Charts (ebook, PDF) von Thomas N. Bulkowski - Portofrei bei the In this revised and expanded second edition of the bestselling Encyclopedia of Chart Patterns, Thomas
Price Headley could be your personal trading coach!
 PRICE HEADLEY Price Headley could be your personal trading coach! Would you like to regularly talk with Price about the markets, stocks, options, superior indicators and most profitable methods? Would
High Profit Candlestick Patterns Stephen Bigalow
 We have made it easy for you to find a PDF Ebooks without any digging. And by having access to our ebooks online or by storing it on your computer, you have convenient answers with high profit candlestick
candelsticks 101 notes for web.notebook Candlesticks 101
 Candlesticks 101 1 The most basic skill needed for investing is... the ability to read a stock chart and then understand how that data can aid your investing success. One of the biggest mistakes of today's
Candlestick Formations
 Presents Candlestick Formations By Russ Horn 1 RISK DISCLOSURE STATEMENT / DISCLAIMER AGREEMENT Trading any financial market involves risk. This report and all and any of its contents are neither a solicitation
Copyright Page 1
 Copyright 2008 www.forex4noobs.com Page 1 ALL RIGHTS RESERVED. No part of this publication may be reproduced, stored in a retrieval system, or transmitted in any form or by any means, electronic, mechanical,
FOLLOW THE SMART MONEY: LET CANDLES & VOLUME GUIDE THE WAY
 FOLLOW THE SMART MONEY: LET CANDLES & VOLUME GUIDE THE WAY January 2009 By Todd Krueger Compared to the common bar chart, candlestick charts are visually more capable of revealing the psychology and sentiment
Copyright UCRP
 www.candlestickreversalpattern.com Copyright UCRP Introduction I don t want this book to have dozens of unnecessary pages of material that would do you no good in order to impress you. That s why I m going
Master Heikin-Ashi with this Trading Strategy
 Master Heikin-Ashi with this Trading Strategy Roman Sadowski - Humbletraders.com What is it? Heikin-Ashi chart looks like the candlestick chart but the method of calculation and plotting of the candles
A study on one-day candlestick patterns in the Chinese stock market
 A study on one-day candlestick patterns in the Chinese stock market Abstract This study addresses the absence of research dealing with the profitability of one-day candlestick patterns in the Chinese stock
A Statistical Analysis of the Predictive Power of Japanese Candlesticks
 Journal of International & Interdisciplinary Business Research Volume 5 Article 5 June 2018 A Statistical Analysis of the Predictive Power of Japanese Candlesticks Mohamed Jamaloodeen Georgia Gwinnett
Important Information and Disclaimer:
 Important Information and Disclaimer: TradeStation Securities, Inc. seeks to serve institutional and active traders. Please be advised that active trading is generally not appropriate for someone of limited
NCSS Statistical Software
 Chapter 147 Introduction A mosaic plot is a graphical display of the cell frequencies of a contingency table in which the area of boxes of the plot are proportional to the cell frequencies of the contingency
Hilbert Sine Wave Don't Trade Cycles Without It!
 Hilbert Sine Wave Don't Trade Cycles Without It! Summary of what you'll learn in the feature article below: The Hilbert Sine Wave is a unique indicator it combines the best characteristics of an oscillator
Neural pattern recognition with self-organizing maps for efficient processing of forex market data streams
 Neural pattern recognition with self-organizing maps for efficient processing of forex market data streams Piotr Ciskowski, Marek Zaton Institute of Computer Engineering, Control and Robotics Wroclaw University
Same Area, Different Perimeter; Same Perimeter, Different Area
 S E S S I O N 2. 5 A Same Area, Different Perimeter; Same Perimeter, Different Area Math Focus Points Using tiles to find the area and perimeter of a rectangle Understanding that rectangles can have the
Candlestick Charts: Your Complete Beginner's Guide To Reading Candlestick Charts Free Ebooks PDF
 Candlestick Charts: Your Complete Beginner's Guide To Reading Candlestick Charts Free Ebooks PDF Here's Exactly How To Read And Use Candlestick ChartsIf You're A Complete Beginner When It Comes To Candlestick
BunnyGirl s FAQ Rev 1.0
 BunnyGirl s FAQ Rev 1.0 Basic Entry & Exit Conditions Pairs traded EUR-USD, GBP-USD & USD-CHF. EUR-JPY traded sometimes. Other pairs have been tested for this strategy but were deemed not suitable. 5 WMA
Candlestick Charting
 Candlestick Charting FOR DUMmIES by Russell Rhoads Candlestick Charting FOR DUMmIES by Russell Rhoads Candlestick Charting For Dummies Published by Wiley Publishing, Inc. 111 River St. Hoboken, NJ 07030-5774
Candlestick Secrets for Profiting in Options Seminar Bonus module- Using NCS to set up option trades + Bouncing Ball strategy
 Bonus Module: Option trade setups using NCS+ The bouncing ball trade setup 1 For the FREE Ninja Trader (and other) platforms 2 Let NCS do the work for you! Save hours of research time Automatically find
SRDC Level II. By Orange Roshan. Compiled and Edited by Henry S. (Hensch)
") SRDC Level II By Orange Roshan Compiled and Edited by Henry S. (Hensch) No part of this document may be reproduced, without written permission of the author. Copyright 2006 SRDC Level II Orange Roshan
SRDC Level II By Orange Roshan Compiled and Edited by Henry S. (Hensch) No part of this document may be reproduced, without written permission of the author. Copyright 2006 SRDC Level II Orange Roshan
Predictive Indicators for Effective Trading Strategies By John Ehlers
 Predictive Indicators for Effective Trading Strategies By John Ehlers INTRODUCTION Technical traders understand that indicators need to smooth market data to be useful, and that smoothing introduces lag
Sentiment: The emotions, plans, or thought processes that lead up to the buying or selling of a security. I personally define sentiment this way.
 Hi Traders! I trust this article finds you well! I am sure many of you know my affinity for candlesticks and their importance as it relates to trading. A good saying to remember is, The stock market rewards
THE SECRET 01. Candlestick Charting. Strategies for Trading the Australian Markets. Louise Bedford. bjrlghtboolls
 THE SECRET 01 Candlestick Charting Strategies for Trading the Australian Markets Louise Bedford bjrlghtboolls First published in 2000 by Wrightbooks an imprint of John Wiley & Sons Australia, Ltd 42 McDougall
Math Grade 2. Understand that three non-zero digits of a 3-digit number represent amounts of hundreds, tens and ones.
 Number Sense Place value Counting Skip counting Other names for numbers Comparing numbers Using properties or place value to add and subtract Standards to be addressed in Number Sense Standard Topic Term
Second Grade Mathematics Goals
 Second Grade Mathematics Goals Operations & Algebraic Thinking 2.OA.1 within 100 to solve one- and twostep word problems involving situations of adding to, taking from, putting together, taking apart,
Encyclopedia Of Candlestick Charts Wiley Trading
 ENCYCLOPEDIA OF CANDLESTICK CHARTS WILEY TRADING PDF - Are you looking for encyclopedia of candlestick charts wiley trading Books? Now, you will be happy that at this time encyclopedia of candlestick charts
PICTURE CANDLES AND THE OVERALL TECHNICAL CHAPTER 4. #a+o ExEtm bd. "He Who Sits in a Well to Look at the Sky Can See But Little"
 CHAPTER 4 CANDLES AND THE OVERALL TECHNICAL PICTURE #a+o ExEtm bd "He Who Sits in a Well to Look at the Sky Can See But Little" A ;uputt"se book that I had translated states that, "Action that ignores
The secret meaning of Japanese Candlesticks
 The secret meaning of Japanese Candlesticks Part 2 By Vladimir Ribakov Creator of: www.vladimirforexsignals.com http://www.vladimirmarketsforecast.com/ www.forex-lst-syetem.com 2 nd edition, July 2013
Problem of the Month. Miles of Tiles. 5 in. Problem of the Month Miles of Tiles Page 1
 Problem of the Month Miles of Tiles Level A: You have a picture frame. You would like to decorate the frame by gluing tiles on it. The frame is a square shape. 14 in The frame is 1 inch wide all around.
EURAUD, EURUSD, GBPUSD, GBPCHF
 30 pip method This is an amazing strategy which can net you 20 30 pips every day. Once you hit 20 pips for the day stop. Trade this strategy either 1 hour after the London Open or if you are in USA, trade
SCHEMATIC MANOEUVRE ILLUSTRATIONS SCHEDULE P-13
 SCHEMATIC MANOEUVRE ILLUSTRATIONS SCHEDULE P-13 Take-off procedure ( not judged, not scored ) wind 120 0 Security line P-13.01: Half Clover Leaf with horizontal roll full roll P-13.01: Half Clover Leaf
On the effectiveness of candlestick chart analysis for the Brazilian stock market
 Available online at www.sciencedirect.com ScienceDirect Procedia Computer Science 22 (2013 ) 1136 1145 17 th International Conference in Knowledge Based and Intelligent Inrmation and Engineering Systems
CycleTools for CQG - Overview
 CycleTools for CQG - Overview by Brian R. Bell Introduction Do you want to trade short-term market cycles? Have you ever wished you had a way to measure them, a logical way to trade a cycling market? CycleTools
Number and Multiplication Concepts
 Number and Multiplication Concepts Factors, Multiples, and Primes Self-Check: Questions 1 2 1. Which numbers are multiples of 3? Show or tell how you know. Try Questions 1 and 2 to check your progress.
Tradeciety.com. My Trading Strategy. Name: Date:
 My Trading Strategy Name: Date: I am serious about my trading. I have enough and I want to see better results. I am committed to making a change and start treat trading like a profession. I am committed
FIBO-ABCD Strategy by John Tsai Version 1.0
 FIBO-ABCD Strategy by John Tsai 05.23.07 Version 1.0 The purpose of writing this ebook is to share the strategy I use to trade the Forex market. In this ebook, I will focus on EUR/USD pair all time, and
Numerical: Data with quantity Discrete: whole number answers Example: How many siblings do you have?
 Types of data Numerical: Data with quantity Discrete: whole number answers Example: How many siblings do you have? Continuous: Answers can fall anywhere in between two whole numbers. Usually any type of
Developing Algebraic Thinking
 Developing Algebraic Thinking DEVELOPING ALGEBRAIC THINKING Algebra is an important branch of mathematics, both historically and presently. algebra has been too often misunderstood and misrepresented as
Trendlines. Lesson 2.6 Created by Sebastian Kunysz
 Trendlines Lesson 2.6 Created by Sebastian Kunysz DISCLOSURE THIS VIDEO IS FOR DEMONSTRATION PURPOSES ONLY CombinePrepSchool.com provides this material for information and educational purposes only and
Name: Class: Date: Practice Problems
 Unit 3: Stretching and Shrinking Investigation 4: Similarity and Ratios Practice Problems Directions: Please complete the necessary problems to earn a maximum of 11 points according to the chart below.
Tables: Tables present numbers for comparison with other numbers. Data presented in tables should NEVER be duplicated in figures, and vice versa
 Tables and Figures Both tables and figures are used to: support conclusions illustrate concepts Tables: Tables present numbers for comparison with other numbers Figures: Reveal trends or delineate selected
The Candlestick Course
 We have made it easy for you to find a PDF Ebooks without any digging. And by having access to our ebooks online or by storing it on your computer, you have convenient answers with the candlestick course.
5.3 Trigonometric Graphs. Copyright Cengage Learning. All rights reserved.
 5.3 Trigonometric Graphs Copyright Cengage Learning. All rights reserved. Objectives Graphs of Sine and Cosine Graphs of Transformations of Sine and Cosine Using Graphing Devices to Graph Trigonometric