Blips By David Duty CTA Price $99.00 Includes 60 Minutes of Video on Blips
|
|
|
- Mildred Garrison
- 6 years ago
- Views:
Transcription

1 Blips By David Duty CTA Price $99.00 Includes 60 Minutes of Video on Blips Page 1
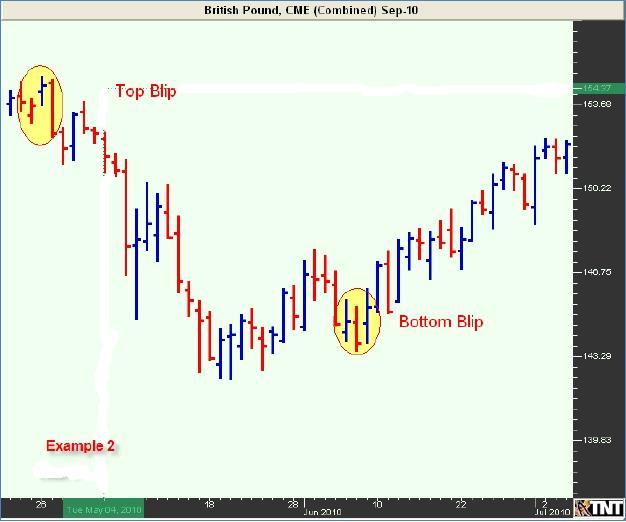
2 My name is David Duty and I m a CTA or Commodity Trading Advisor and I started trading commodities back in 1996 and I ve been teaching people to trade for over ten years. I m also the author of Common Sense Commodities, which was rated the #1 course on the market to learn to trade commodities. In this course you are going to learn about a highly effective chart pattern I call Blips. When you see the simplicity of this pattern and how to trade it you are going to be amazed to say the least. Blips can be used to trade any market. You can use them to trade commodities, stocks, or Forex. You will soon see that you can use these patterns to trade in any time frame also, so it doesn t matter if you are a Day Trader, Swing Trader or a long term Position Trader. I hope I have your undivided attention, because what you are about to learn could provide you with a comfortable living if you learn to trade it correctly. Let s jump right in and there is no better place to start than with what is a Blip? A Blip is usually a three day pattern. Now if you are day trading and using 5 or 10 minute charts you can just think of days as price bars. So I think I will just use the term bar or bars from now on in this course. So a Blip is a three bar pattern; that makes things easier! Let s take a look at a Blip formation in Example 1 on the next page. As you will see, there are two types of Blips; a Top Blip and a Bottom Blip. You are going to start seeing Blips on every chart that you look at from this point forward. If you are like most people, you are going to be amazed at both its simplicity and accuracy in indicating either a trend reversal or the start of a new trend, or in certain circumstances the continuation of the current trend. I want you to think about something. How important would it be for you to know when a Trend might be ending or when a new Trend might be starting? That s what I thought; very important! First, I need to teach you is and how to spot Blips on a chart. Like I said, a Blip is usually a three bar formation but sometimes it can take four days to form. First we are going to look at a three bar Blip. Keep in mind that there are two kinds of Blips, a Top Blip and a Bottom Blip. See Example 1. Page 2
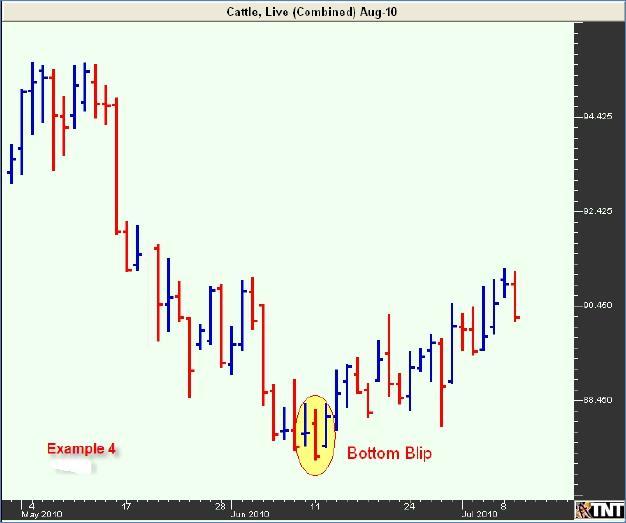
3 I m going to give you the rules for Blips and then show you some on a chart. After that, I m going to show you how to trade them. Rules for Blips Bottom Blips: a) Bar 1 must have higher highs and higher lows than Bar 2 b) Bar 2 must have lower highs and lower lows than Bar 1 c) Bar 3 must have higher highs and higher lows than Bar 2 which is the same as the rules for Bar 1. Top Blips: a) Bar 1 must have lower lows and lower highs than Bar 2 b) Bar 2 must have higher highs and higher lows than Bar 1 c) Bar 2 must have lower lows and lower highs than Bar 2 which is the same as the rules for Bar 1. You are going to find that you see Blips at major turning points such as trend reversals and you will also find them during markets that are trending. I m going to show you how to profit from both of them. First let s look at some Blips at major trend reversals on the following charts. Take a close look at each of the examples below. I want you to notice that the Blip Formations on each chart also met the above rules. I know that some worked out better than others. That is not the point right now as we will cover all of this as we go through this course. Page 3
4 Page 4

5 Page 5
6 Page 6

7 Page 7

8 Page 8

9 I look for Blips after a big rally or after a big downtrend. I guess you could say that I m looking for a major price reversal with a Blip. You can use the Blip to enter a trending market too which you will learn about later. By just looking at a Blip on a chart you might be thinking that you know how to trade them but hold on because I m going to show you several things that you need to be aware of in order to make sure you are not only trading the correct type Blip but also placing your order correctly and your stops correctly. Now that you know what a Blip looks like I want to explain some more rules that will help you tremendously when you start to trade them. Some of it is just common sense and some is based on what I have been teaching my for over ten years. They work better than anything else I ve ever seen. I m also the first person Page 9
 and Evening Stars (Top Blip).")
10 that I know of to have discovered them. At least no one that I know of has ever discussed anything like them that I m aware of. I will say that there are two Japanese Candlestick patterns that are like Blips and they are Morning Stars (Bottom Blip) and Evening Stars (Top Blip). I did not use Candles when I first started trading so I was not aware of them. I learned about them from Steve Nison who is the most recognized authority in the western world on Candles. Steve was the first person to interpret them from the original Japanese books. Let s discuss some of the other rules right now and we are going to start with a Top Blip and discuss the three bars one at a time. Now keep in mind that a Blip can be on a 5 minute, daily, weekly or even a monthly chart. The time frame is irrelevant and they work exactly the same way on all charts. As you can see in Example 8 that the Bar 2 closed in the lower 25% of the bars range which indicates weakness in the market. In other words the Bears won that round. But it s the next bar that tells the true story. Bar 3 which MUST also close low and the lower the better. And of course Bar 3 must follow the first set of rules in that it must have lower lows and lower highs than Bar 1. Ideally Bar 3 will also have lower lows than Bar 1 breaking any support that Bar 1 offered. Page 10

11 Now that you know what they look like and the rules you must apply you are probably sitting there thinking well this is a great little pattern but how the heck do I trade it? That s what we are going to talk about next. Of course, like in any trade, you need to have an entry point and a protective stop. You should also have profit targets so that you can figure out your Risk/Reward Ratio. Protective Stops Let s look at Example 9 so we can see where to enter the market and where to put our protective stop. Remember you need to know the difference between a stop loss vs stop limit too. Your entry point will depend on what your Risk Reward Ratio is and how aggressive or conservative you are. Of course the closer your stop is to your Entry Point the more aggressive the trade. So an Aggressive stop offers less financial risk but it offers more risk of being stopped out with a loss. On the other hand, a Conservative Stop has more financial risk it offers less chance of being stopped out. These are decisions that you alone can make.

12 Without knowing where your Exit point, or your profit target is, there is no way to figure your Risk Reward Ratio. This short course is not designed to teach you Profit Targets so I trust you already know how to find those. It should go without saying that a Bottom Blip works the same way, just reversed. But for sake of clarity I will also include an explanation in Example 10 below. Now you might be wondering what kind of order to use to enter the trade. You can use either a Stop or a Limit order. If you use a Stop Order you risk getting a bad fill if the market gaps on the open and if you use a Limit Order you run the risk of not getting filled at all. It s a true Catch-22 for sure. I think overall that a Stop Order is your best bet to trade Blips and I will give you some examples of why a little later. Gaps & Blips Next I want to discuss with you what you can do if you have a Gap between Bar 2 and Bar 3. Look at Example 11 so you will know what I m talking about. Page 12

13 Gaps often become Support and Resistance areas. If you are familiar with Japanese Candlestick Charts then you know that Gaps are called Windows. You might have heard the term Gaps always fill. I m not sure that they always fill but many times the price will come down and test the bottom of a Gap if the market Gaps up and test the top of the Gap if the market Gaps down. In Japanese Candlestick charting when a Gap fills they say that The Window Closed. We are also going to look at some Japanese Candlestick patterns to use with Blips in the next part. Spikes & Blips Next I want to discuss Spikes. If you don t know what a Spike is, it s a Bar with a huge range from high to low. I do NOT like to trade Blips that have big Spikes especially on Bar 3 since it can drastically alter your Risk Reward Ratio since many times you are going to put your protective stop just under or just over the high or low of Bar 3 depending on if it s a Top Blip or a Bottom Blip. Let s look at a Blip with a Spike so you can see what I mean. Page 13

14 As you can see in Example 12 there was a huge Spike up. If you were to place your protective stop under Bar 2, the bar before the Spike then you would have incurred a huge risk. So a good rule of thumb is not to trade Blips with big Spikes on Bar 3. However in this example if Bar 2 was a big Spike down bar then that would have been a good thing since the market might have tested new lows but was not able to hold them and the price rallied. Japanese Candles & Blips Remember earlier I said that Bar 2 should close in the upper 25% range for a Bottom Blip and the lower 25% range for a Top Blip? Well that s true in many cases but if you follow Japanese Candles then there are some exceptions to this rule. There are many Candle patterns that you could use with Blips but since this is not a course on Candles I m only going to cover a few of them. First, I m going to assume you don t know what a Japanese Candle even looks like, so I m going to cover them briefly. If you already know what they are you can just skip the next section. Page 14

15 Japanese Candlesticks A Primer Lesson from My Website Japanese Candlesticks are really quite easy to understand. I want each of you to go into this primer with that knowledge. Price information can be visually presented in a number of ways: Japanese Candlesticks are but one of them Since you are a Common Sense Commodities student, you already have an excellent foundation in bar charts. Bar charts represent the exact same information that Candlesticks do, but with some slight differences. The main difference being color. The color of a Candlestick represents where prices closed, it is similar to the right tick on the bar chart. Below is a down bar. As you can see, the right tick (highlighted) is lower that the left one, signifying a down close. Here is the corresponding Candlestick: Instead of the tick to the right signifying a lower close, we have a red (or in some cases black) shaded in "candle". Let's go over the terminology of the candle itself. First you have the "body" of the candle. That is the shaded in portion of the candle, regardless of color. Page 15
16 The red portion of the candle above is the "body". Next, you have the "wicks". Now you may be getting an idea of why they are called Candlesticks! The "wicks", either above the body or below the body, represent the high and low. So the wick above represents the high and the wick below represents the low. This is regardless of the color of the body. So you see, this is very similar to bar charts! Here is an example of an up candle or a candle with a higher close with the corresponding bar next to it. Look at the bar chart and imagine it is shaded in green and you have a up Candlestick! Both of these simply represent a higher close! Not too tough is it? The only difference in appearance to the red/down candle is that an up candle is shaded green (or sometime hollow/white depending on your charts) to signify the higher close. Now that we know what an up and down Japanese Candlestick looks like, let's discuss how we can put this to use. There are volumes written on Candlestick...but here's what you really need to know. No matter what the pattern or the candle, it must occur within the context of an established trend! So let's discuss some basic -- and very important -- Candlesticks. Trading with Candlesticks does not have to be complicated. Most Candlestick patterns involve one of just a few candles. They are "building blocks" to most Page 16

17 patterns so if you learn to recognize these you can trade Candlesticks with confidence! The Candlesticks we will discuss are the following: Doji Spinning Top Hammer Inverted Hammer Hanging Man The "Doji" is the most powerful Candlestick you can find. The reason being is that -- if you notice -- there is no "body". The open and close were at the same level! This represents a "pause" or "balance" or even lack of opinion. In the context of a trend, this is a powerful signal that a reversal may be setting up! This simply means that without an established trend in place, a Doji (or any Candlestick for that matter) has less significance. So in a choppy, directionless market, do not rely on Candlesticks alone! The open and close must appear at the same price level, wherever that may be along the high and low of the Candlestick itself. The Spinning Top below can be considered a "close cousin" to the Doji. Page 17
18 Rather than the open and close having to be at the same level, a Spinning Top has a small or narrow body. This too signifies a "pause", "balance", or lack of opinion, just not to the extreme degree of a Doji. Again, we look for these in the context of an established trend. So the ideas we want to make sure we get from Part Two are that we want to recognize Candlesticks that have a very narrow or no body. Why? Because it represents a "pause", "balance", or lack of an opinion. When we figure in that we are looking for these Candlesticks in the context of an established trend we realize that we are now seeing the beginning of a possible shift. What do we do once we see a candle? Ok. So what do we do when we see a Candlestick like a Doji or Spinning Top? Simple, we return to out tried and true CSC principles. In other words, we look at the current trend, support and/or resistance, 50% Levels, common numbers, chart patterns, and then we confirm direction with our indicators! It's all starting to make sense now I hope...because all we are doing by using Candlesticks is making ourselves aware of potential reversals on the chart! Imagine a Blip with Bar 2 being a Doji! Imagine seeing a Spinning Top at major Support or Resistance! Seek to simplify, not to complicate. What about a Doji at a 50% Level! Here are a few more Candlesticks we should learn to recognize: Page 18
19 The Candlestick above is called a "Hammer". Unlike Doji and Spinning Tops which can be used in both uptrends and downtrends, a "Hammer" is a Candlestick to look for when prices are in a downtrend. So if in the context of an established DOWNTREND you see a "Hammer", think to yourself: This is a pause, and could possibly be setting up support for a reversal. Are prices in at a prior support level? Are prices at a common number? Is this Hammer occurring on Bar 2 of a Bottom Blip? Is this weekly or monthly support? Is this near or at a 50% Level? A "cousin" to the Hammer would be the "Inverted Hammer". We still look for an "Inverted Hammer" (just like its cousin the Hammer) in a downtrend. And we should ask ourselves the same questions we would if we saw a Hammer. Finally we have the "Hanging Man" which looks just like a Hammer but we should keep an eye out for this Candlestick in an UPTREND. Page 19
20 When we see a "Hanging Man", we should think to ourselves: This is a pause, and could possibly be setting up resistance for a reversal. Are prices in at a prior resistance level? Are prices at a common number? Is this Hammer occurring on Bar 2 of a Top Blip? Is this weekly or monthly resistance? Is this near or at a 50% Level? Again, be sure that the current trend and your indicators confirm what the Candlestick is telling you. Here are a few examples: Are prices forming a Top Blip, with a Bar 2 Doji, and the Slow Stochastic hooking down through the 80% level? Are prices near or at the 50% Level with Slow Stochastics hooking above the 20% levels? What is the MACD Histogram doing? Does it confirm the Candlestick and the price level reversing? Is there divergence? You can see there are multiple ways we can put Candlesticks to use. Think of them as "alerts" that get your attention to potential reversals. End of Primer on Japanese Candlesticks Now that you have an understanding of what Japanese Candlesticks are let s look at some Blips on charts with some Candle Patterns that you can use. Page 20

21 Candles - Doji & Spinning Tops As I explained, a Doji candle shows indecision in the market because it opened and closed at the same, or very close to the same price. Neither the Bulls nor the Bears won that round. They often precede a change in trend or at least a pause in trend. So when you see a Doji on Bar 2 where a Blip could be forming, pay close attention to Bar 3 which is the bar that will often confirm the change in direction suggested by the Doji, as well as it confirms the Blip. Let s look at one on a chart. See Example 13. You can see that each of these Blips with Doji on Bar 2 had a reversal in the current trend and good profits could have been made on each one. Remember that Spinning Tops Candles are just a fat Doji where the market opened and closed very close to each other but not exactly at the same price. You would trade a Spinning Top exactly like you would the Doji when trading Blips. Also both the Doji and Spinning Top candles need to have long wicks on both the top and bottom. If not, they can be an entirely different Candlestick formation. Page 21

22 If you are interested in learning more about Candlestick charting drop me an and I will give you some suggestions on some books or videos that you might like. Let s look at a chart with both a Doji and Spinning Top so you can see the difference. Als o don t worry too much whether a candle on Bar 2 is a Doji or a Spinning Top because you will trade both of them the same way. I m very cautious when I see a Doji or Spinning Top on Bar 3 since it indicates a possible reversal. I want Bar 3 to be a confirmation bar not a reversal bar. Page 22
 and the Hammer represents a bottom in the market (the market is Hammering out a")
23 Hanging Man & Hammers A Hanging Man is a topping formation (Bearish) and a Hammer is a bottoming formation (Bullish). They are exactly the same shape candle. The only difference is that the Hanging Man represents a top in the market (the market hung itself) and the Hammer represents a bottom in the market (the market is Hammering out a bottom). See Example 16. Page 23

24 Both the Hanging Man and the Hammer are excellent indicators as long as Bar 3 confirms them. Take a look at Example 14 again and look at the third bar from the right in what was almost a Bar 3 of a Top Blip. You could call this a Hanging Man. Page 24

25 Inside Bars So far we have only looked at a Blip that consist of three bars but if you recall at the first of this course I mentioned that Blips are sometimes a four bar pattern. Well this is where the Inside Bar comes into play. An Inside Bar is simply where the current bar traded inside the highs and lows of the previous bar. This means that an Inside Bar could be on the left or on the right of Bar 2. I do not like Inside Bars that show up after Bar 3 and usually won t trade them as a Blip. Let s look at one below so you can get a visual image of what they look like. See Example 18. Page 25

26 When you have a Blip formation that has an inside day before or after Bar 2 act as if it does not even exist. Simply put, just disregard it completely. Look at Example 19 below where we have an Inside bar after Bar 2. On Diagram 11 I ve put the same diagram up except that I have erased the Inside Bar. So this is what it would look like with that bar erased. You would then trade it like you would any other Blip formation. Page 26

27 Blip Reversals Not all Blips work all the time. Sometimes we have what I call a Blip Reversal. All this is that sometimes a Top Blip reverses and becomes a Bottom Blip or a Bottom Blip reverses and becomes a Top Blip. In Example 21, I ve drawn out what a Blip Reversal looks like. We will look at some charts with some Blip Reversals on a chart also. After that I will show you how you can trade them. As you can see, Example A confirmed and did what we thought it would. If we had placed our Buy-Stop order above the high of Bar3, we would have been filled on Bar4. But what happens if Bar4 reverses, and does not go above Bar3? Well, this is the Blip Reversal, as I call it, and is shown in Example B. Page 27
28 In Example C, what was previously a Bottom Blip has now changed and become a new Top Blip! Now in Example C, if you had entered the market using a Buy- Stop order, you would not have been filled and would have stayed out of a bad trade, since the price did not exceed the high of Bar3 and your Buy-Stop order was above Bar3. This is why you should not use Market on Open Orders or Market on Close orders on Blips. Page 28
29 An Alternate Way to Trade Blips Now that you know we don t live in a perfect world, I m going to show you an alternative method for trading Blips. You probably know about bracketing a Channel or a Trading Range? You can do the same thing with a Blip. Look at Example 22 Below. In the Example Top Blip Forms you see a possible trade here to short the market on the formation of a Top Blip. This is the normal way to trade these Blips. Now, here s the twist on how to trade a Blip. You place two orders! Your first order would to be go short, and place your Sell-Stop order below the low of Bar3. Page 29
30 But at the same time, you place another Buy-Stop order to go long above the high of Bar3. These would be an OCO order (One Cancels the Other), so the order that gets filled first cancels the other order. This way, you can t have two orders at the same time. The only order you would be in is the one that gets filled first. Now, if you got filled short when the price broke below the low of Bar3 you are probably pretty happy, because the Blip did what you expected it to do. It dropped. On the other hand, if it didn t drop, but rallied because it was a Blip Reversal, you got filled going long at a break above the high of Bar3. It s a win-win situation. The question now is, where do you place your stops? What you should do is tell your broker that when one order fills, the other order becomes your protective Stop Loss order. Again, this is just using some Common $ense in your trading. Blips on Weekly and Monthly Charts Keep in mind that you will also find Blips on the Weekly and Monthly Charts. When you do, they are extremely powerful indicators, and I would try and find a way to trade them by looking at a Daily Chart and finding a good set-up. Off the top of my head, I can t think of any formation or technical indicator that is not more powerful on a Weekly or Monthly chart than it is on a Daily Chart. Many inexperienced traders don t watch the Weekly or Monthly charts as closely as they should. Don t be one of them. Watch them closely! See Examples 23 and 24 below. Page 30

31 Page 31

32 Blips as Continuation Patterns You will often use Blips as a Continuation Pattern. What I mean is there is an uptrend in price and you are looking for the price to continue you can watch for a Bottom Blip to form at the top of the range. Let s take a look at a few charts where we have a Bottom Blip at the top of a trend and a Top Blip at the Bottom of a trend and then we will discuss how to trade them. Page 32

33 As I mentioned on the above chart we have a Bottom Blip in an uptrend. You can view Bottom Blips in an uptrend as a continuation pattern. You will see these often on charts that you are watching. However I want you to use a little common sense for a moment and look closely at the Bottom Blip in Example 25. Notice that Bar 1 of the Blip has higher highs than Bar 3 which makes Bar 1 resistance. For obvious reasons you would not want to enter a trade long here since your order would be just under the resistance of Bar 1 which would be a stupid thing to do. Don t get bent out of shape; I did not say you were stupid. I said that would be a stupid thing to do. Now based on what you have learned so far what else could you be looking at here? As you can see, Bar 1 is a Spinning Top which represents a possible pause or reversal in trend doesn t it? Also Bar 2 is a Doji, the strongest reversal candle pattern. Then, like I mentioned there is that nasty resistance just above the high of Bar 3. So now what do you do? You certainly don t buy the market here and there is no reason to sell the market, yet anyway. So you sit and wait, that s what you do. But what are you waiting for? You guessed it, a Blip Reversal. Page 33

34 Obviously the same rules will apply to a Bottom Blip in a downtrend. Just be aware of what s going on around the Blips when you see them. See what happened with the above Blip Reversal in Example 27! I bet you anything you are chomping at the bit to start trading Blips. But please wait because there is a whole lot more that we are going to be covering. Page 34

35 Exiting With Blips I feel pretty sure that by now you have thought about using Blips to exit a trade. Let s use the above chart in another example to show you how I would use a Blip to exit a trade. See Example 28. Page 35

36 Blips at Support & Resistance Levels Just like I mentioned in the above example, you can use a Blip to exit a trade when it forms resistance especially if it does a Blip Reversal. When you start looking for Blips they will start to jump off the chart because they are so obvious. I m sure if you have been looking at some other charts since you began this course you spotted dozens of them if not hundreds. And of course, they have been there all along. Aren t you glad you are learning about trading Blips! Page 36

37 Using Indicators & Blips I m almost positive that you are using one or more indicators with your charts and so do I. The two that are my favorite to use with Blips are MACD and Slow Stochastics. Let s first look at the definition of these two indicators and then we will look at how to use them when trading Blips. Stochastics: Markets that are heading higher tend to close near the top of the daily range, while markets that are heading lower tend to close near the bottom of the range. Stochastics was invented by George Lane and attempts to measure this. Stochastics is displayed as two lines. The main line is called the %K, and the second line is called %D, (which is a moving average of %K). Most of the time, the %K is shown as a solid line and the %D as a broken or dotted line. Page 37
 or the %D (darker line) falls below a specific level and then rises above that level. Sell when the Oscillator rises above a specific level.")
38 Most people use one or all of the following methods to interpret this indicator. 1. Buy when either the %K (lighter line) or the %D (darker line) falls below a specific level and then rises above that level. Sell when the Oscillator rises above a specific level. I use 80 and 20 in my software but some people use 70 and 30. Every market is a little different. Look at a chart and switch between the above settings and see which one more closely reflects what the market actually did. Usually one is much more accurate than the other. 2. Buy when the %K line rises above (crosses) the %D line, and sell when the %K line falls below (crosses) the %D line. 3. Many people look for divergence where prices are making new highs yet the Oscillator is not making or surpassing previous highs. See Example 30 below: Page 38

39 On the chart above, notice that at each trend reversal, Slow Stochastics was showing an overbought, or oversold, condition. You can use this indicator to help confirm what you feel could be a trend reversal based on what the chart is showing you. Did you catch the Double Bottom? Look at the previous chart at where the current price is. Based on Stochastics, what do you think the price may do? What I see is that Stochastics is getting into the overbought area above 90, and if it drops back below 90 and the lines cross, we might have a price reversal. Can you tie this into the fact that there is strong resistance just above the current price? Could there be a major 50% level about to form? Let s also look at the same chart and use the Fast Stochastics indicator. Which one do you think is more accurate? I tend to use the Slow Stochastics much more than I do Fast Stochastics, but this is a personal decision. You might like Fast Stochastics better. The major difference between Slow and Fast Stochastics is this that Fast Stochastics adds a more sensitive %K line. Most traders, including myself, prefer the Slow Stochastics and feel it gives a more reliable reading. Page 39

40 In Example 31, trading has ended. Let s take a look at the next contract month chart and see what the price did. Could you have used Stochastics to determine beforehand the direction the price should have gone? Notice on the next two charts that the price continued to rally for a couple of weeks, and that Stochastics went above 90 and stayed there until the price started to drop. As soon as the Slow, and Fast, Stochastics dropped below 90 and the lines crossed, the trend reversed. I tend to think that the Slow Stochastics is a more reliable indicator but then again, it s a matter of personal preference. Page 40

41 MACD: Moving Average Convergence/Divergence The MACD is one of my favorite indicators and I have found it to be extremely reliable most of the time. See Example 34. Page 41

42 Notice how uncannily accurate the MACD was on the above chart. Now, I think you can see why I like this indicator so much. Can you imagine seeing a Double Bottom, Bottom Blip, and MACD crossing all at the same time? It happens, but you have to be watching for it. I call these events Hammer Trades because if you see them but don t trade them, then you need to hit yourself in the head with a hammer. Maybe that will knock some Common Sense into you. Don t you just love all the puns that can be made with common sense? Not only can you tell when to get into a market with this, you can also use it to tell you when to get out of a market. Watch it closely! Look at the following chart as well. It s the same chart as above, except it has both the Slow Stochastics and the MACD showing on the same chart. Page 42

43 You should learn how to use some of the indicators together. I like to use Slow Stochastics and MACD at the same time. Notice in the above chart how often both indicators reflected a change in direction at the same time. Are you beginning to catch on yet? If not, don t worry about it, you will. After all, all it takes is a little Common Sense! There s that pun again! I hope you have enjoyed reading this course. I know that these Blips can be highly rewarding if used properly. I have students who tell me that almost all they trade now are Blips and they are trading fulltime for a living. I hope you can do the same. Page 44
44 DISCLAIMER THE INFORMATION CONTAINED HEREIN IS BELIEVED TO BE RELIABLE BUT CANNOT BE GUARANTEED AS TO RELIABILITY, ACCURACY, OR COMPLETENESS. COMMON SENSE COMMODITIES, AND/OR DAVID G. DUTY, WILL NOT BE RESPONSIBLE FOR ANYTHING, WHICH MAY RESULT FROM ONE S RELIANCE ON THIS MATERIAL, NOR THE OPINIONS EXPRESSED HEREIN. DISCLOSURE OF RISK: THE RISK OF LOSS IN TRADING FUTURES AND OPTIONS CAN BE SUBSTANTIAL; THEREFORE, ONLY GENUINE RISK FUNDS SHOULD BE USED. FUTURES AND OPTIONS MAY NOT BE SUITABLE INVESTMENTS FOR ALL INDIVIDUALS, AND INDIVIDUALS SHOULD CAREFULLY CONSIDER THEIR FINANCIAL CONDITION IN DECIDING WHETHER TO TRADE. OPTION TRADERS SHOULD BE AWARE THAT THE EXERCISE OF A LONG OPTION WOULD RESULT IN A FUTURES POSITION. HYPOTHETICAL PERFORMANCE RESULTS HAVE MANY INHERENT LIMITATIONS, SOME OF WHICH ARE DESCRIBED BELOW. NO REPRESENTATION IS BEING MADE THAT ANY PERSON WILL, OR IS LIKELY TO, ACHIEVE PROFITS OR LOSSES SIMILAR TO THOSE SHOWN IN THIS COURSE. IN FACT, THERE ARE FREQUENTLY SHARP DIFFERENCES BETWEEN HYPOTHETICAL PERFORMANCE RESULTS AND THE ACTUAL RESULTS SUBSEQUENTLY ACHIEVED BY ANY PARTICULAR TRADING METHOD. ONE OF THE LIMITATIONS OF HYPOTHETICAL PERFORMANCE RESULTS IS THAT THEY ARE GENERALLY PREPARED WITH THE BENEFIT OF HINDSIGHT. IN ADDITION, HYPOTHETICAL TRADING DOES NOT INVOLVE FINANCIAL RISK, AND NO HYPOTHETICAL TRADING RECORD CAN COMPLETELY ACCOUNT FOR THE IMPACT OF FINANCIAL RISK IN ACTUAL TRADING. FOR EXAMPLE, THE ABILITY TO WITHSTAND LOSSES OR TO ADHERE TO A PARTICULAR TRADING PROGRAM, IN SPITE OF TRADING LOSSES, ARE MATERIAL POINTS WHICH CAN ALSO ADVERSELY AFFECT ACTUAL TRADING RESULTS. THERE ARE NUMEROUS OTHER FACTORS RELATED TO THE MARKETS, IN GENERAL, OR TO THE IMPLEMENTATION OF ANY SPECIFIC TRADING PROGRAM WHICH CANNOT BE FULLY ACCOUNTED FOR IN THE PREPARATION OF HYPOTHETICAL PERFORMANCE RESULTS AND ALL OF WHICH CAN ADVERSELY AFFECT ACTUAL TRADING RESULT.
45
by Ashwani Gujral Getting the best of East and West.
 by Ashwani Gujral Getting the best of East and West. Candlestick charting signals can be used in conjunction with Western indicators and the results achieved might be better than using them individually.
The Stair Step Trade. Written By: Jason Ramus Copyright: 2017
 The Stair Step Trade Written By: Jason Ramus www.daytradingfearless.com Copyright: 2017 The Waterfall Introduction: Let me first say thank you for taking the time to read this amazing Book. I believe this
Candlestick Charting Quick Reference Guide
 Quickly and easily master the common Candlestick Charting patterns, with the Candlestick Charting Quick Reference Guide www.yourtradingcoach.com Because you d rather be trading for a living! Disclaimer
Teodosi s Simple Oscillator-based System ( Forex Strategies Revealed - Simple System #8)
") ( Forex Strategies Revealed - Simple System #8) http://forex-strategies-revealed.com -DISCLAIMER- Virtually all of the information in this paper was sourced from the Forex Strategies Revealed website.
( Forex Strategies Revealed - Simple System #8) http://forex-strategies-revealed.com -DISCLAIMER- Virtually all of the information in this paper was sourced from the Forex Strategies Revealed website.
The secret meaning of Japanese Candlesticks
 The secret meaning of Japanese Candlesticks Part 2 By Vladimir Ribakov Creator of: www.vladimirforexsignals.com http://www.vladimirmarketsforecast.com/ www.forex-lst-syetem.com 2 nd edition, July 2013
CANDLESTICK TRADING STRATEGIES
 TAFX CANDLESTICK TRADING STRATEGIES Disclaimer is in no way affiliated or representative of any other company, organisation, club or society, and the views presented are solely our own opinions. The author(s)
SPECIAL REPORT: CANDLESTICK PATTERN SUMMARY
 SPECIAL REPORT: CANDLESTICK PATTERN SUMMARY Louise Bedford This Special Report is an extract from the Candlestick Charting Home Study Course. It is a handy, quick reference guide that you can refer to
Use of Candlestick charts
 Use of Candlestick charts Candlestick chart was developed in 1700s in Japan by a man named Munehisa Homma, originally designed to trade rice futures in the 17th century, he invented a method to analyze
The Candlestick EXPRESS Class with Steve Nison
 With Steve Nison, CMT President: Candlecharts.com & the first to reveal candlesticks to the Western world Candlestick Charting Techniques Candles + Western Charting Tools Candles for Trade Management 1
Candlestick Formations
 Presents Candlestick Formations By Russ Horn 1 RISK DISCLOSURE STATEMENT / DISCLAIMER AGREEMENT Trading any financial market involves risk. This report and all and any of its contents are neither a solicitation
Prepared by Dave Forster April 9, 2016
 Candlesticks Prepared by Dave Forster April 9, 2016 Who is this guy? Methods of Technical Analysis Technical Analysis Inputs Price vs. Volume How I approach Charting How a Candlestick is Constructed Neutral
Frontline FX: Key Candlestick Strategies for Profitable FX Trades Candlestick Essentials and Beyond for FX
 Frontline FX: With Steve Nison, CMT President: Candlecharts.com Easy to Understand Early Reversals Safety First East + West All FX markets All Time Frames Accelerates Analysis Current volatility in FX
Candlesticks: What they are and how to use them? NUS Investment Society Global Macro Department Gideon Wong & Devin Nathanael GM Research Analyst
 Candlesticks: What they are and how to use them? NUS Investment Society Global Macro Department Gideon Wong & Devin Nathanael GM Research Analyst Disclaimer NUS Invest is in no way affiliated or representative
Candles shed light on the market
 Candles shed light on the market By KIRA MCCAFFREY BRECHT When Steve Nison provided trade recommendations to brokers at Shearson Lehman Hutton, where he worked in the futures research department more than
This strategy will identify a break of a trend and take advantage of the movement to the opposite direction.
 Thanks for checking out the RSI 80-20 Trading Strategy, You are going to benefit from this strategy by learning to trade divergence, and finding a low risk way to sell near the top or buy near the bottom
17 Money Making CandleStick Formations. you can use today in MarketClub
 17 Money Making CandleStick Formations you can use today in MarketClub Candlestick lines and charts Candlestick lines and charts -- traditional Japanese charts whose individual lines look like candles,
Candlesticks for Intraday and Swing Trading. Day 1 with Steve Nison, CMT President: Candlecharts.com
 Candlesticks for Intraday and Swing Trading Day 1 with Steve Nison, CMT President: Candlecharts.com Slide 2 Media Comments Japan's Candlesticks Light Traders' Path - Wall Street Journal Whether you day
Basic Technical Analysis
 Basic Technical Analysis Disclaimer You may from time to time be provided with marketing material, investment & financial related information and reports, including but not limited to research reports
Findings. A Number of Candles Do Not Work as Expected
 1 Findings Arguably, you are reading the most important chapter because it discusses the discoveries I made about candles while researching this book. You may already know some of them, but the others
If I was to suggest that the charts you are looking at could be literally speaking to you, would you think I had gone slightly mad?
 Section Two Get to know your Charts Runtime 10min 37s So we now have covered off the basics, you ve got your platform open, charts at the ready & your raring to find out how all these traders make mega
Chifbaw Oscillator User guide
 Chifbaw Oscillator User guide www.chifbaw.com Indicator and document revision: 1.2 Known bugs: -The alert function system gives sometimes a fake alert when the indicator is initiated on a given currency
Candlesticks by Louizos Alexander Louizos,
 CANDLESTICKS CHARTING As we mentioned before candlesticks behold some trend signals. In this chapter you will learn how to correctly evaluate trends using candlestick charts. Always remember: candlesticks
Equal open and close candles. ( known as doji candles ) Short body candles. Long body candles.
 Short body candles. Long body candles.") I have broken down the patterns into 3 categories: Equal open and close candles. ( known as doji candles ) Short body candles. Long body candles. Within these categories are both bullish reversal and bearish
I have broken down the patterns into 3 categories: Equal open and close candles. ( known as doji candles ) Short body candles. Long body candles. Within these categories are both bullish reversal and bearish
Steve Nison s Quick Start Guide to Correctly Using Candlesticks. WithSteve Nison, CMT President: Candlecharts.com
 WithSteve Nison, CMT President: Candlecharts.com 1 Benefits of Nison Candlesticks Any market Any time frame Simple to apply Safety first trading Early reversals for razor sharp entries and exits Profit
The advantage of candlestick charts is the ability to highlight trend weakness and reversal signals that may not be apparent on a normal bar chart.
 CANDLESTICKS CHART Candlesticks contain the same data as a normal bar chart but highlight the relationship between opening and closing prices. The narrow stick represents the range of prices traded during
The secrets of Candlestick Charts Unveiled
 NeW york ChICAgO LONDON DUBAI* TOkyO singapore sydney ADA The secrets of Candlestick Charts Unveiled By GFT Above all, Integrity. FUTURES FOREX CFDs Worldwide Leaders in Online Trading CD04U.041.102808
THE POWER OF JAPANESE CANDLESTICK CHARTS
 THE POWER OF JAPANESE CANDLESTICK CHARTS Founded in 1807, John Wiley & Sons is the oldest independent publishing company in the United States. With offi ces in North America, Europe, Australia and Asia,
With Steve Nison, CMT President: Candlecharts.com
 With Steve Nison, CMT President: Candlecharts.com Legal Notice: This recording is Candlecharts.com and may not be copied, retransmitted, nor distributed in any manner whatsoever, including, but not limited
Steve Nison s Candlecharts.com Secrets of Intraday Candlesticks for Day and Swing Traders
 With Steve Nison, CMT President: Candlecharts.com Legal Notice: This webcast and recording is Candlecharts.com and may not be copied, retransmitted, nor distributed in any manner whatsoever, including,
Rick Saddler s Introduction to Trading with. Japanese Candlesticks
 Rick Saddler s with Japanese Candlesticks him Learning to Read Stock Charts With Japanese Candlesticks Rick Saddler Hit and Run Candlesticks Trading for Profits, LLC Phone: (417) - 848-3519 www.hitandruncandlesticks.com
The Origins of Japanese Candlestick Charting
 The Origins of Japanese Candlestick Charting Munehisa Homma (1724-1803), also referred to as Sokyu Homma or Sokyu Honma, was a wealthy rice merchant and trader from Sakata, Japan who lived during during
FOLLOW THE SMART MONEY: LET CANDLES & VOLUME GUIDE THE WAY
 FOLLOW THE SMART MONEY: LET CANDLES & VOLUME GUIDE THE WAY January 2009 By Todd Krueger Compared to the common bar chart, candlestick charts are visually more capable of revealing the psychology and sentiment
Chapter 3 THEORETICAL FRAMEWORK OF CANDLESTICK CHARTS. way about candlestick charts. The details of the same is shown as follows.
 Chapter 3 THEORETICAL FRAMEWORK OF CANDLESTICK CHARTS After the extensive review of literature, this chapter gives the conceptual and back ground of the technicalities of the study. The study covers about
Copyright Page 1
 Copyright 2008 www.forex4noobs.com Page 1 ALL RIGHTS RESERVED. No part of this publication may be reproduced, stored in a retrieval system, or transmitted in any form or by any means, electronic, mechanical,
Sentiment: The emotions, plans, or thought processes that lead up to the buying or selling of a security. I personally define sentiment this way.
 Hi Traders! I trust this article finds you well! I am sure many of you know my affinity for candlesticks and their importance as it relates to trading. A good saying to remember is, The stock market rewards
THE 4 PILLARS OF INVESTING Technicals: Module 2 TRANSCRIPTION
 THE 4 PILLARS OF INVESTING Technicals: Module 2 TRANSCRIPTION 2 The 4 Pillars of Investing A transcription of TECHNICALS MODULE 1 2 3 4 This is about change in trend, and if we want to follow the trend,
Japanese candlestick charts, discussed in Chapter 3, are an alternative
 The Visual Investor: How to Spot Market Trends, Second Edition By John J. Murphy Copyright by John J. Murphy. APPENDIX B Japanese Candlesticks Japanese candlestick charts, discussed in Chapter 3, are an
THE MAJOR CANDLESTICKS SIGNALS
 THE MAJOR CANDLESTICKS SIGNALS Profit BIG with Candlesticks Master these Major Candlestick Signals it you want to Master the Market. Copyright @ Stephen W. Bigalow May not be duplicated or distributed
Hilbert Sine Wave Don't Trade Cycles Without It!
 Hilbert Sine Wave Don't Trade Cycles Without It! Summary of what you'll learn in the feature article below: The Hilbert Sine Wave is a unique indicator it combines the best characteristics of an oscillator
X-Man s Super Simple System
 X-Man s Super Simple System The 1H E/U method. 1. Timeframe 1 hour timeframe 2. Pair EUR/USD Once this pair is mastered then you can add another pair etc. 3. Main Indicators Synergy bars, Traders Dynamic
FIBO-ABCD Strategy by John Tsai Version 1.0
 FIBO-ABCD Strategy by John Tsai 05.23.07 Version 1.0 The purpose of writing this ebook is to share the strategy I use to trade the Forex market. In this ebook, I will focus on EUR/USD pair all time, and
SRDC Level II. By Orange Roshan. Compiled and Edited by Henry S. (Hensch)
") SRDC Level II By Orange Roshan Compiled and Edited by Henry S. (Hensch) No part of this document may be reproduced, without written permission of the author. Copyright 2006 SRDC Level II Orange Roshan
SRDC Level II By Orange Roshan Compiled and Edited by Henry S. (Hensch) No part of this document may be reproduced, without written permission of the author. Copyright 2006 SRDC Level II Orange Roshan
Copyright UCRP
 www.candlestickreversalpattern.com Copyright UCRP Introduction I don t want this book to have dozens of unnecessary pages of material that would do you no good in order to impress you. That s why I m going
EURAUD, EURUSD, GBPUSD, GBPCHF
 30 pip method This is an amazing strategy which can net you 20 30 pips every day. Once you hit 20 pips for the day stop. Trade this strategy either 1 hour after the London Open or if you are in USA, trade
COPYRIGHTED MATERIAL. Candlesticks = Signals INTRODUCTION
 1 Candlesticks = Signals INTRODUCTION Traders and investors have been looking at charts for well over 85 years as Edwin Lefèvre wrote (1994, p. 61), I should say that a chart helps those who can read it
PCF s for TC2000 and TCNet Users 3 MAJOR SIGNALS. Volume II: The Hammer. The Shooting Star. The Harami
 PCF s for TC2000 and TCNet Users 3 MAJOR SIGNALS Volume II: The Hammer The Shooting Star The Harami A Candlestick Forum publication Years of Candlestick Analysis made available in concise formats. Information
First Tutorial Orange Group
 First Tutorial Orange Group The first video is of students working together on a mechanics tutorial. Boxed below are the questions they re discussing: discuss these with your partners group before we watch
Would You Like To Earn $1000 s With The Click Of A Button?
 Would You Like To Earn $1000 s With The Click Of A Button? (Follow these easy step by step instructions and you will) - 100% Support and all questions answered! - Make financial stress a thing of the past!
BULLISH ENGULFING. Confirmation: Suggested. No. of Sticks: 2
 BULLISH ENGULFING Type: Reversal Medium Engulfing Pattern is a pattern characterized by a large white real body engulfing a preceding small black real body, which appears during a downtrend. The white
Would You Like To Earn $1000 s With The Click Of A Button?
 Would You Like To Earn $1000 s With The Click Of A Button? (Follow these easy step by step instructions and you will) This e-book is for the USA and AU (it works in many other countries as well) To get
How to Read the Stock Chart
 How to Read the Stock Chart Stock charts There are several different kinds of charts: line chart OHLC chart candlestick Line charts The line chart is a single line with starting and ending points. The
To accomplish great things, we must not only act, but also dream; not only plan, but also believe! ~ A. France
 Fluidity Trader Chat Room w/cynthia E. - Wednesday, January 02, 2019: Page Begin Page End Chat Roll Time Wednesday 1.02.19 1 11 CENTRAL Time Zone 6:30 *** Hello Fluidity Team Traders Welcome! *** 6:30
Module 5, Lesson 1 Webinars That Convert Automated Planning Phase: The Automated Webinar Funnel
 Module 5, Lesson 1 Webinars That Convert Automated Planning Phase: The Automated Webinar Funnel Oh my goodness, get up and do a little happy dance right now because you have made it to Module 5, The Automated
9 Financially Devastating Mistakes Most Option Traders Make
 9 Financially Devastating Mistakes Most Option Traders Make Fortunes have been made and lost in the world of option trading. And those fortunes that were lost may very well have been lost due to making
Neural pattern recognition with self-organizing maps for efficient processing of forex market data streams
 Neural pattern recognition with self-organizing maps for efficient processing of forex market data streams Piotr Ciskowski, Marek Zaton Institute of Computer Engineering, Control and Robotics Wroclaw University
Reversing candles. Three black crows. Exhibit 13.0 The three black crows pattern
 Three black crows Reversing candles Three black crows Exhibit 13.0 The three black crows pattern The pattern of upside gap two crows has two black candles gap upon the previous bullish real body. The three
Trendlines. Lesson 2.6 Created by Sebastian Kunysz
 Trendlines Lesson 2.6 Created by Sebastian Kunysz DISCLOSURE THIS VIDEO IS FOR DEMONSTRATION PURPOSES ONLY CombinePrepSchool.com provides this material for information and educational purposes only and
Continued on the Next Page
 The Candlestick X-Ray Indicator Package: State-of-the-Art Pattern Detection Page 3 An Overview of the Candlestick X-Ray Features Page 5 The Complete List of Candlestick Patterns: 92 Fibonacci-Based Patterns
Would You Like To Earn $1000 s With The Click Of A Button?
 Would You Like To Earn $1000 s With The Click Of A Button? (Follow these easy step by step instructions and you will) This e-book is for the USA and AU (it works in many other countries as well) To get
The Best Trading Year Ever
 THE BOOKER REPORT From Rob Booker January 2016 Start a subscription in 60 seconds here. In this issue: 1.The Best Trading Year Ever 2.The 5 Trades I Love Right Now 3.How to Get Anything You Want 4.Conquering
Chapter 14. The Top 10 Trading Mistakes
 Chapter 14 The Top 10 Trading Mistakes I want to talk about the top ten common mistakes that most Forex traders make and more importantly how you can overcome them. So let s start right at the very beginning.
We're excited to announce that the next JAFX Trading Competition will soon be live!
 COMPETITION Competition Swipe - Version #1 Title: Know Your Way Around a Forex Platform? Here s Your Chance to Prove It! We're excited to announce that the next JAFX Trading Competition will soon be live!
THE ROSEN MARKET TIMING LETTER
 THE ROSEN MARKET TIMING LETTER PRECIOUS METALS - FOREX - STOCK INDICES - COMMODITIES Time is more important than price; when time is up price will reverse. W.D.Gann RONALD L. ROSEN January, 2013 rrosen5@tampabay.rr.com
Unlimited Pay Check. By Richel Gates.
 Unlimited Pay Check By Richel Gates www.unlimitedpaycheck.com Congratulations! You Now Have The Rights To Pass This Book Away To Your Friends Or Subscribers. Terms and Conditions LEGAL NOTICE The Publisher
21 CANDLESTICKS EVERY TRADER SHOULD KNOW. Dr. Melvin Pasternak
 21 CANDLESTICKS EVERY TRADER SHOULD KNOW Dr. Melvin Pasternak Working Title: 21 Candlesticks Every Trader Should Know Author: Dr. Melvin Pasternak Publisher: Marketplace Books Release Date: January 2006
Tommy s Revenge Trading Method 2.0 (Module 2 Part 1)
") 1 Welcome to Tommy s Revenge Module 2 Part 1. I m not sure how many parts will be in this section. I think if we participate together we can make a module that s beneficial to all of us Be aware that anything
1 Welcome to Tommy s Revenge Module 2 Part 1. I m not sure how many parts will be in this section. I think if we participate together we can make a module that s beneficial to all of us Be aware that anything
An Investor's Guide to Candlestick Patterns
 An Investor's Guide to Candlestick Patterns By Gordon Kristopher Dec 12, 2014. 03:34 PM What Are Candlestick Patterns in Technical Analysis? Candlestick patterns In technical analysis, candlestick patterns
How to get more quality clients to your law firm
 How to get more quality clients to your law firm Colin Ritchie, Business Coach for Law Firms Tory Ishigaki: Hi and welcome to the InfoTrack Podcast, I m your host Tory Ishigaki and today I m sitting down
Frequently Asked Questions About the Club
 Frequently Asked Questions About the Club March 2006 I know how to play chess, but I m not quite ready for tournament play. Would I be able to play casual, unrated games at your Club? Definitely. You re
Finally, The Truth About Why Your Home Didn t Sell and Your Mad As Heck
 Finally, The Truth About Why Your Home Didn t Sell and Your Mad As Heck Do you know the difference between passive selling and active marketing? Until you do, you won t even have a chance of selling in
Candlestick Patterns (Every trader should know)
") Candlestick Patterns (Every trader should know) A doji represents an equilibrium between supply and demand, a tug of war that neither the bulls nor bears are winning. In the case of an uptrend, the bulls
Candlestick Patterns (Every trader should know) A doji represents an equilibrium between supply and demand, a tug of war that neither the bulls nor bears are winning. In the case of an uptrend, the bulls
A New Twist on an Old Technique Has Advisors Making $25,000 a Week
 A New Twist on an Old Technique Has Advisors Making $25,000 a Week With Zero Marketing Costs Table of Contents If You Build It They Will Come... 2 How I wrote $5 million in 3 Months, without a cent in
How to Overcome the Top Ten Objections for Financial Advisors
 How to Overcome the Top Ten Objections for Financial Advisors I began my career selling investments over the phone, and I know how hard it is to compete with someone a prospect may already be doing business
Candlestick Charts: Your Complete Beginner's Guide To Reading Candlestick Charts By Christopher Daniels
 Candlestick Charts: Your Complete Beginner's Guide To Reading Candlestick Charts By Christopher Daniels For seasoned traders, candlesticks hold no secrets. However, for beginners they can seem intimidating
The Secret to High Performance Trading. Discover Where your strength and weaknesses lie
 The Secret to High Performance Trading Discover Where your strength and weaknesses lie 1 Being able to perform as a winning trader requires action without a lot of theory and discussion start right now!
2 Well, she always bragged that she s above me, which means she s better than me. But I will show her one day. I know; you do. But I never liked her.
 1 A CONVERSATION BETWEEN THE LUMP OF CLAY AND THE MASTER POTTER LUMP OF CLAY Ouch! That hurts! Who picked me up? Can I ask what are you re doing? Well...? No, no, I m listening. You tell me. Well, aren
I find my greatest pleasure, and so my reward, in the work that precedes what the world calls success. ~Thomas Edison
 Fluidity Trader Chat Room w/cynthia E. - Friday, January 18, 2019: Page Begin Page End Chat Roll Time Friday 1.18.19 1 11 CENTRAL Time Zone 6:30 *** Hello Fluidity Team Traders Welcome! *** 6:30 *** DAILY
Delphine s Case Study: If you only do one thing to learn English a day... what should it be? (Including my 10~15 a day Japanese study plan)
") Delphine s Case Study: If you only do one thing to learn English a day... what should it be? (Including my 10~15 a day Japanese study plan) Julian: Hi, Delphine! How s it going? Delphine: Nice to meet
Delphine s Case Study: If you only do one thing to learn English a day... what should it be? (Including my 10~15 a day Japanese study plan) Julian: Hi, Delphine! How s it going? Delphine: Nice to meet
Split Testing 101 By George M. Brown
 Split Testing 101 By George M. Brown By: George M Brown Page 1 Contents Introduction... 3 What Exactly IS Split Testing?... 4 Getting Started... 6 What is Website Optimizer?... 7 Setting Up Your Google
The Candlestick Course
 We have made it easy for you to find a PDF Ebooks without any digging. And by having access to our ebooks online or by storing it on your computer, you have convenient answers with the candlestick course.
Sample funnel written for The Barefoot Writer a series of four s. 1
 Sample email funnel written for The Barefoot Writer a series of four emails. EMAIL 1 Subject: Evict doubt and invite the writer s life in! Dear , I always wanted to be a writer. But I knew writing
If...Then Unit Nonfiction Book Clubs. Bend 1: Individuals Bring Their Strengths as Nonfiction Readers to Clubs
 If...Then Unit Nonfiction Book Clubs Bend 1: Individuals Bring Their Strengths as Nonfiction Readers to Clubs Session 1 Connection: Readers do you remember the last time we formed book clubs in first grade?
What is a Chart? Lesson 1.4 Created by Sebastian Kunysz
 What is a Chart? Lesson 1.4 Created by Sebastian Kunysz DISCLOSURE THIS VIDEO IS FOR DEMONSTRATION PURPOSES ONLY CombinePrepSchool.com provides this material for information and educational purposes only
Candlestick Secrets for Profiting in Options Seminar Bonus module- Using NCS to set up option trades + Bouncing Ball strategy
 Bonus Module: Option trade setups using NCS+ The bouncing ball trade setup 1 For the FREE Ninja Trader (and other) platforms 2 Let NCS do the work for you! Save hours of research time Automatically find
Webinar Module Eight: Companion Guide Putting Referrals Into Action
 Webinar Putting Referrals Into Action Welcome back to No More Cold Calling OnDemand TM. Thank you for investing in yourself and building a referral business. This is the companion guide to Module #8. Take
FOUR SIMPLE TRADING GOALS
 FOUR SIMPLE TRADING GOALS (THAT MAY NOT APPEAR TO HAVE ANYTING TO DO WITH TRADING) http:// 3.28.16 2 P a g e THE FOUR GOALS Goals in trading are the elusive end of the rainbow most of the time. You know
Grandma always said, crumbs is bread
 Grandma always said, crumbs is bread How do you eat an elephant? One. Bite. At. A. Time. Yes, well, my grandmother would say it like this. Crumbs is bread. Her family came to the United States from Sweden
The Exciting World of Bridge
 The Exciting World of Bridge Welcome to the exciting world of Bridge, the greatest game in the world! These lessons will assume that you are familiar with trick taking games like Euchre and Hearts. If
Telemet Orion v5.0x New Features
 Telemet Orion v5.0x New Features What are: Trendlines Point and Figure Charts Candlesticks Trendlines Eight new trendline studies are offered in Telemet Orion v5.0x. Access these with the pull down menu
Okay Jason, for the first question, can you please tell me what your background is and how you began your career as a trader?
 Jason Fielder is a 10 year trading veteran, and though you ve never seen him on CNBC, he s become a widely followed and respected trading guru because he s helped thousands of traders with the systems
Winning by Overcoming Objections
 Winning by Overcoming Objections Discover How To Easily Handle Objections Without Fear enjoy success, admiration and magnetic attraction with your new confidence A Free Training Guide for Network Marketers
Worksheets :::1::: Copyright Zach Browman - All Rights Reserved Worldwide
 Worksheets :::1::: WARNING: This PDF is for your personal use only. You may NOT Give Away, Share Or Resell This Intellectual Property In Any Way All Rights Reserved Copyright 2012 Zach Browman. All rights
GOAL SETTING NOTES. How can YOU expect to hit a target you that don t even have?
 GOAL SETTING NOTES You gotta have goals! How can YOU expect to hit a target you that don t even have? I ve concluded that setting and achieving goals comes down to 3 basic steps, and here they are: 1.
The Patch THE DESTINY CHRONICLES. The Destiny Chronicles: The Patch by Mike Matthews
 THE DESTINY CHRONICLES The Patch Chicago native Mike Matthews cleverly chronicles some of the most intriguing aspects of human relationships that he has encountered. Based on real events, The Destiny Chronicles
The $25,000 a Week Dominator Roulette Strategy Profit Plan!
 Martin J. Silverthorne The $25,000 a Week Dominator Roulette Strategy Profit Plan! Silverthorne Publications, Inc. The $25,000 Dominator Roulette Profit Plan COPYRIGHT 2009 Silverthorne Publications Inc.
Episode 11: A Proven Recipe to Get Out of a Slump
 Ed Gandia: Hi, everyone, Ed Gandia here. You know I don t think there is a selfemployed professional out there who s immune from hitting a rough patch every once in a while. Now a lot of the information
EP72: Market Trends.
 EP72: Market Trends Announcer: We love to hold on to this belief that discretion is really important and I think a lot of the times we like to hold on to that is because it gives us that easy out. It gives
 VIP Power Conversations, Power Questions Hi, it s A.J. and welcome VIP member and this is a surprise bonus training just for you, my VIP member. I m so excited that you are a VIP member. I m excited that
So you want. to improve your. English? How to take the pain out of learning
 So you want to improve your English? How to take the pain out of learning Great! You have come to the right place to get some insights into what could be negatively influencing your improvement and what
UNDERSTANDING LAYER MASKS IN PHOTOSHOP
 UNDERSTANDING LAYER MASKS IN PHOTOSHOP In this Adobe Photoshop tutorial, we re going to look at one of the most essential features in all of Photoshop - layer masks. We ll cover exactly what layer masks