The Pennsylvania State University. The Graduate School. Department of Engineering Science and Mechanics
|
|
|
- Dennis Berry
- 5 years ago
- Views:
Transcription
1 The Pennsylvania State University The Graduate School Department of Engineering Science and Mechanics STRUCTURAL HEALTH MONITORING OF FATIGUE CRACK GROWTH IN ALUMINUM STRUCTURES USING ULTRASONIC GUIDED WAVES A Thesis in Engineering Mechanics by Hwanjeong Cho 2010 Hwanjeong Cho Submitted in Partial Fulfillment of the Requirements for the Degree of Master of Science August 2010
2 The thesis of Hwanjeong Cho was reviewed and approved* by the following: Clifford J. Lissenden Professor of Engineering Science and Mechanics Thesis Advisor Joseph L. Rose Paul Morrow Professor of Engineering Science and Mechanics in Design and Manufacturing Bernhard R. Tittmann Schell Professor of Engineering Science and Mechanics Judith A. Todd P. B. Breneman Department Head Head of the Department of Engineering Science and Mechanics *Signatures are on file in the Graduate School
3 iii ABSTRACT The aging of aircraft fleets is a significant reliability and maintenance concern. The longer the legacy fleet remains in service, the more likely fatigue cracks are to initiate and grow. Structural health monitoring (SHM) provides an economical way to maintain airworthiness of aging fleets. This work focuses on methods for monitoring fatigue cracks growing from multiple fastener holes in aluminum structures using ultrasonic guided waves so as to evaluate the remaining useful life of the structure. It examines the applicability of ultrasonic guided waves for a structure in between a simple laboratory experiment specimen and a complex real component. It considers a sparse array of transducers for the sake of less expense. Accordingly, five 12.7 mmdiameter fastener holes were introduced in an equally spaced manner in planar aluminum structures. These fastener holes serve as stress raisers, when sinusoidal tensile in-plane stress is applied so as to induce fatigue cracks at the edge of the holes. Ten 6.35 mm-diameter Piezoelectric Wafer Active Sensors (PWAS) were mounted in a pattern such that the scattering waves can be well detected as the crack grows although later analysis showed that six transducers would suffice. A Finite Element Analysis (FEA) model was built and analyzed to evaluate the most effective transducer pattern. Ultrasonic guided waves signals were collected in throughtransmission mode from all pairs of transmitters and receivers in the array by a data acquisition system at a predetermined interval. In order to detect, locate, and visualize the progress of the crack, the transmission coefficient was calculated and integrated into the Reconstruction Algorithm for Probabilistic Inspection of Damage (RAPID) technique. The RAPID technique was modified as necessary to remove the complexity of scattering caused by the multiple fastener holes based on the knowledge that a fatigue crack is anticipated to initiate along the centerline of the fastener holes. Two types of structures were tested: one is a plate with open holes and the
4 other is a bolt-jointed structure. A fatigue crack, invisible to the eye, was detected and located in the bolted joint by sending ultrasonic guided waves across the joint. iv
5 v TABLE OF CONTENTS LIST OF FIGURES... vii LIST OF TABLES... x ACKNOWLEDGEMENTS... xi Chapter 1 Introduction Ultrasonic Guided Waves in SHM Ultrasonic Guided Wave Excitation in a Free Plate... 5 Chapter 2 Experimental Methods Hardware Material Mechanical Test Apparatus Ultrasonic Guided Wave System Software LabVIEW Virtual Instrument (VI) Developed Data Analysis Chapter 3 Results Results of Finite Element Analysis Simulation Results from Structure A-1 and A Fatigue Cracks Wave Signals Transducer Array Evaluation based on Comparison with FEA Results Damage Visualization based on the TC-based RAPID Technique Results from Structure B Fatigue Cracks Wave Signals Potential of Sparse Array Chapter 4 Conclusions and Future Work Summary Conclusions Future Work Bibliography Appendix A User s Manual of the DAQ System... 71
6 vi Appendix B Circuitry Block Diagram of the Virtual Instrument Appendix C Selected Wave Signals Appendix D Nontechnical Abstract
7 vii LIST OF FIGURES Figure 1-1 Guided waves in a free plate... 5 Figure 1-2 Dispersion curves for 2mm-thickness aluminum alloy 6061-T6 plate: different color shows points corresponding to guided wave propagation of three different modes Figure 1-3 Group velocity curves for 2mm-thickness aluminum alloy 6061-T6 plate: different color shows points corresponding to wave-packet velocity of three different modes Figure 2-1 Sketches of the test structures Figure 2-2 Bolt-jointed test structure in MTS 810 test machine Figure 2-3 PWAS bonded on the aluminum test structure Figure 2-4 Frequency response of the transducer: the transducer has the active bandwidth between 300 KHz~400 KHz Figure 2-5 Wave signals at 350 KHz: the group velocity measurement provides the mode identification as S0 mode Figure 2-6 Electrodes on the top surface of the PWAS Figure 2-7 Layout of angle-beam transducer scanning experiment (example: 300, 76.2 mm away) Figure 2-8 Amplitudes of the wave-front according to the distance from the transducer Figure 2-9 Wave-fronts of a single transducer at different distances: the transducer has the maximum amplitude wave-front around θ=90, and the wave-front spreads as it propagates away Figure 2-10 Sketches of transducer arrays Figure 2-11 The geometry of FEA model Figure 2-12 The DAQ System components Figure 2-13 Angle-beam transducer examines a crack initiation at bolted joint area Figure 2-14 Front panel of the VI Figure 2-15 Structure of the VI: Two while loops consist of the main function frame... 28
8 Figure 2-16 Stress analysis around fastener holes: A crack is expected to occur around the center-line, Hot-Spots, that are center area of each probability ellipse Figure 2-17 Modification of probability distribution ellipse Figure 3-1 Snap shots of wave propagations for T1 with different crack size (0mm, 12mm, 20mm): Figures (a), (c), and (e) show the scattered S0 mode at 36 usec after guided waves excited at the transducer T1. (b), (d), and (f) show the scattered A0 mode at 56 usec Figure 3-2 Snap shots of wave propagations for T2 with different crack size (0mm, 12mm, 20mm) : Figures (a), (c), and (e) show the scattered S0 mode at 30 usec after guided waves excited at the transducer T2. (b), (d), and (f) show the scattered A0 mode at 50 usec Figure 3-3 Snap shots of wave propagations for T3 with different crack size (0mm, 12mm, 20mm) : Figures (a), (c), and (e) show the scattered S0 mode at 32 usec after guided waves excited at the transducer T3. (b), (d), and (f) show the scattered A0 mode at 52 usec Figure 3-4 Three components of the scattered wave: a diffracted wave, a reflected wave and leaky-creeping waves Figure 3-5 Magnitude of displacements from FEA results: Magnitude changes were observed from the wave paths in the vicinity of the crack growing from the center hole Figure 3-6 Fatigue cracks at 12.7 mm diameter hole of the structures A-1 and A Figure 3-7 Wave signals that passed the vicinity of the crack (with the max tensile load) Figure 3-8 Wave signals that passed the vicinity of the crack (without the tensile load) Figure 3-9 Comparisons of transmission coefficients between the FEA and the experimental data for the staggered array with the max tensile loading Figure 3-10 Comparisons of transmission coefficients between the FEA and the experimental data for the in-line array with the max tensile loading Figure 3-11 The transmission coefficients from selected wave paths in the structure A-2: the transmission coefficient in the max tensile loading shows ability of monitoring crack growth, it provides an idea about the threshold value as ± 0.2. Also, (b) and (d) indicate the different crack growth rate Figure 3-12 The transmission coefficients from selected wave paths in the structure A-2: the transmission coefficient in the max tensile loading shows ability of monitoring crack growth. (b) indicates that the diffracted wave can be used for monitoring the crack growth in horizontal direction. Also (d) shows the transmission coefficient depends on the crack viii
9 ix Figure 3-13 Comparison of TC-based RAPID technique to SDC-based RAPID technique: TC-based RAPID is able to detect, to locate, and to visualize the growth of fatigue cracks Figure dimensional plot of the angle-beam scanning signals Figure 3-15 Fatigue cracks in the test structures Figure 3-16 Comparison of the wave signals of structure A-2 and B that have same path Figure 3-17 Wave signals that propagated in the vicinity of the cracked joint and an undamaged joint in the structure B Figure 3-18 The transmission coefficients of the wave signals that propagated in the vicinity of the cracked joint and an undamaged joint in the structure B before 480,000 cycles Figure 3-19 The transmission coefficients of the wave signals that propagated in the vicinity of the cracked joint and an undamaged joint in the structure B after 480,000 cycles Figure 3-20 Schematic of a sparse in-line array: it needs only a half number of transducer required for the in-line array of the structure A Figure 3-21 The Hilbert transformed wave signals for the sparse in-line array under the max-tensile loading condition Figure 3-22 The transmission coefficient for the sparse in-line array under the maxtensile loading condition... 64
10 x LIST OF TABLES Table 1-1 Benefits of Guided Waves for SHM (from Rose [5])... 3 Table 2-1 Properties of PWAS Table 2-2 Properties of the FEA model Table 3-1 Crack growth in the test structure A-1 and A
11 xi ACKNOWLEDGEMENTS I would like to especially thank my adviser Dr. Clifford J. Lissenden for his patient support on this work. He encouraged me to try something I had never even thought of. His belief made me possible to find interest in engineering work that had slept for long time and to seek a better solution in every aspect of this work. It will be a valuable ingredient for the rest of my career. I also want to express my thank to the superior graduate students in the ultrasonics laboratory in Engineering Science and Mechanics. They did not hesitate to give me heartful advice that expands my humble knowledge on ultrasonic guided waves. I also appreciate the technicians who supported the marathon-like experiments. Their continuous support made this work done in time. Finally, I express gratitude to the Center of Excellence in Structural Health Monitoring at the Pennsylvania State University for financial support.
12 Chapter 1 Introduction Over the last several decades, engineers and policy decision makers have been concerned with the accelerated obsolescence of structural and mechanical systems such as aircraft, storage vessels, transportation pipelines, and bridges. The recent NBI (National Bridge Inventory) document in 2009 indicates that approximately 600,000 highway bridges throughout the United States are structurally deficient or functionally obsolete that need to be repaired or replaced. Furthermore, the number of deficient/obsolete bridges has increased for the last 5 years rather than decreased, indicating that the problem is worsening rather than improving [1]. Nevertheless, the total freight shipment by the highways in 2020 is expected to be 18,130 tons which is 73% and 21% greater than in 1998 and 2010 respectively [2]. The United States Air Force (USAF) still operates B-52 bombers and KC-135 tankers aged more than 40 years. Even F-15 and F-16 fighter jets that play a major role in pursuing the air superiority have been flying more than 15 years. However, the USAF is going to spend $1.1 billion for KC-153 tanker programmed-depot maintenance (PDM) that extends the remaining useful life until a next new tanker-airplane begins to replace the service. Besides, the USAF is considering extending the service lives of other aircraft. Together with rapid increases of costs for new acquisition and procurement, this simultaneous aging will challenge the administrators with daunting technical and institutional questions over the next 20 years [3]. The two main technical challenges described in [3] are fatigue cracking and fatigue-induced corrosion in the aged airframe structures and propulsion systems. Structural health monitoring (SHM) is an emerging technique of great interest with the potential for solving the problem of damage detection in structural and mechanical systems.
13 2 Farrar and Worden [4] discussed an introduction to SHM including challenges, and definitions of terms involved. They define SHM as The process of implementing a damage identification strategy for aerospace, civil and mechanical engineering infrastructure. The most attractive advantage of SHM is to make condition-based maintenance (CBM) possible. CBM can lower the overall cost of maintenance by reducing the labor, the disposable parts, and the time needed for routine periodic inspections. It will also minimize maintenance-induced damage happening during the routine inspections that will enhance the fleet readiness. More than that, SHM application is able to collect the data regarding the current health of individual structures. The real-time assessment on the fleet can alleviate the concerns of the decision makers and let them blueprint the overall resource allocation plan. 1.1 Ultrasonic Guided Waves in SHM In recent several years, ultrasonic guided waves have become a promising technique for SHM implementation on many structural and mechanical systems, especially plate-like structures and even more complicated structures such as aircraft wings, multilayered composites, and buried pipes. More and more researchers are reporting evidence of the usefulness of ultrasonic guided waves and their unique applications in SHM. Rose [5] discussed the recent progress of guided waves in SHM, giving excellent overall perspective, as well as benefits and various types of applications investigated for both academic and industrial research. The benefits of using guided waves stated by Rose [5] are quoted in Table 1-1. Among these benefits, the ability of inspecting over long distances from a single probe position is the most distinctive advantage over conventional ultrasonic bulk waves. For this longrange capability, interrogating a wide planar or curved surface of interest with multiple distributed sensors becomes possible. It is well demonstrated by several researchers.
14 3 Van Velsor et al [6] located simulated corrosion and pitting defects on a pipe surface using guided waves having different frequencies, and characterized the progression of the defects. Breon et al [7] monitored the inner surface of a pipe elbow, where wall thinning was gradually introduced by acid, using ultrasonic guided waves that were generated by multiple transducers mounted on the outer surface. Zhao et al [8] detected a loose rivet and different size of saw-cuts on the rivet hole in an E-2 surveillance airplane wing that has multiple joints of stiffeners and spars using guided waves propagating in the wing skin. Yan et al [9] investigated and located defects in a welded plate and an impact-damaged composite plate using ultrasonic guided waves. Table 1-1 Benefits of Guided Waves for SHM (from Rose [5]) 1 Inspection over long distances from a single probe position By mode and frequency tuning, establish wave resonances and excellent overall defect detection and sizing potential. Often greater sensitivity than that obtained in standard normal beam ultrasonic inspection or other NDT techniques. Ability to inspect hidden structures and structures under water, coatings, insulations, and concrete with excellent sensitivity. 5 Cost effectiveness because of inspection simplicity and speed All of the research introduced in the preceding paragraph used the Signal Difference Coefficient (SDC) based Reconstruction Algorithm for Probabilistic Inspection of Damage (SDC-based RAPID) technique in order to detect defects and to visualize their location. The physical intuition placed on this algorithm is that a defect would cause the most significant change in the direct wave path of transmitting transducer (transmitter) and receiving transducer (receiver). The probability of defect existence at a certain point within the reconstruction region decreases away from the line-of-sight between the two transducers. Hence the algorithm uses SDC for extracting the evidence of defects from the collected wave signals, which builds the
15 4 probability gradient of an ellipse having the transmitter and receiver at its foci. The probability of a defect in the whole reconstruction region is, consequently, a linear summation of each probability contributed by all pairs of transmitters and receivers. A primary advantage of the RAPID technique is the flexibility of implementation. In addition to SDC that qualifies overall defect status, many other quantifiable features that can account for the health of a structure can be used with the RAPID technique such as amplitude changes, time of flight (TOF), frequency shift, and mode conversions, so that evaluating the defect becomes possible with tomography based on different features. Another favorable benefit of guided waves for SHM implementation is excellent overall defect detection and sizing potential. Ultrasonic guided waves reflect and diffract when impinging on a defect in a wave guide; sometimes the waves still transmit through the defect depending on its shape. Thus, those scattering waves ought to carry the information regarding the defect status. More than that, the scattering waves can usually be collected by multiple receivers distributed around. Therefore it is possible to interrogate the existence of defects in the area and to estimate their size by extracting the information from the collected guided wave signals. Particularly, cracks have been listed on the top of researchers subjects for Non-Destructive Evaluation (NDE). Much research has been performed in order to investigate the scattering of guided waves from cracks of various length and depth. Alleyne and Cawley [10] showed that the sensitivity of individual guided wave to particular notches depends on the frequency-thickness product, the type of mode, and the geometry of the notch. Chang and Mal [11] studied the frequency content of reflected and transmitted guided waves from a rivet hole with finite-element models and validating experiments. Ihn and Chang [12] developed a damage index to estimate the size of fatigue crack growing from a notch in an aluminum coupon. Lu et al [13] investigated the behavior of the reflection and transmission coefficient upon different crack lengths and frequencies. Lissenden et al [14] showed that amplitude ratio and the SDC have good potential

16 5 for characterizing a fatigue crack emanating from a single fastener hole in an aluminum plate, and examined the SDC-based RAIPD technique to monitor an electrical discharge machining (EDM) slot grown from one of multiple fastener holes in an aluminum plate. The main interest of these researchers is feature extraction from scattering guided waves that quantifies the length of cracks simulated or created in a laboratory. 1.2 Ultrasonic Guided Wave Excitation in a Free Plate The fundamental difference between ultrasonic guided waves and bulk waves is the existence of the boundary conditions that the solution must satisfy together with the governing equations of elastodynamics. When waves impinge on an elastic wave guide of finite thickness such as plates, rods, and hollow cylinder, multiple mode conversions occur at the boundaries. Longitudinal waves convert to other longitudinal waves and shear waves, shear waves convert to other shear waves and longitudinal waves. This is illustrated in Figure 1-1 along with a coordinate system that will be used for derivation of a wave propagation solution. Figure 1-1 Guided waves in a free plate For certain waves of a given frequency and a velocity, a series of constructive interferences propagates along with the geometry of the wave guide. This wave packet results in guided wave
17 6 propagation for the frequency and velocity that continuously satisfies the given boundary conditions. Unlike bulk waves, the solutions of guided waves need to take account of boundary conditions in addition to the field equations that require various mathematical methods depending on the geometry of wave guides. Rose [15] discussed the solutions of free plates, multiple layers, hollow cylinders and so forth, as well as miscellaneous other topics. Guided waves in a traction free plate of isotropic material are known as Lamb waves. The equations of motion, strain-displacement equations, and the constitutive equations for isotropic material are: (1-1) (1-2) (1-3) In these equations,,,,,, are stresses, strains, displacements, body forces, Kronecker s delta, mass density, and Lame s constants respectively. If the stress and strain are eliminated by substituting Eq. 1-2 and 1-3 into Eq. 1-1, then Navier s equation of motion in linear elastodynamics can be obtained as follows, (1-4) For plane wave propagation in the direction in a free plate, the solution must comply with 4 boundary conditions as follows,
18 (1-5) 7 (1-6) To solve Eq. 1-4 that satisfies these boundary conditions, several different approaches can be employed. The most popular method is the method of potentials [15]. By using Helmholtz decomposition, the displacement vector of Eq. 1-4 is decomposed into scalar potential Φ and vector potential Ψ that yield two wave equations for longitudinal and shear waves; plane strain is assumed in direction for simplicity. The results are, (1-7) h (1-8) where. Under the assumption of time harmonic motion in the free plate, it is possible to begin with two assumed solutions as follow, (1-9) (1-10) where.
19 8 Substitution Eq. 1-9 and 1-10 into Eq. 1-7 and 1-8 yields, (1-11) (1-12) where. Then the displacement and stress terms can be rewritten as follows (the harmonic exponential term from all expressions is omitted for brevity), (1-13) (1-14) (1-15) (1-16) In order to find the unknown coefficients A and B, application the given boundary conditions, Eq. 1-5 and 1-6, to Eq. 1-13, 1-14, 1-15, and 1-16 yields 2 characteristic equations for non-trivial solutions in accordance with the wave structure across the thickness; separating symmetric and anti-symmetric modes with respect to the -axis.
20 9 (1-17) (1-18) These Rayleigh-Lamb frequency relations represent that the two separated mode satisfy the equations of motion and the boundary conditions, and they can propagate in the plate independently of each other. The equations do not have analytical solutions. Hence they need to be solved by numerical methods. The roots of these equations provide the conditions at which guided wave propagation can occur, and they can be plotted as dispersion curves in the frequency and phase velocity domain. Furthermore, guided waves propagate as a wave packet that has different frequency and velocity content, yields a group velocity of the guided wave that provides another parameter that can be measured by experimental methods. Figure 1-2 shows the dispersion curves for 2mm-thickness 6061-T6 aluminum alloy plate for frequency and phase velocity with indication of the driving frequency used for this thesis work, and Figure 1-3 shows the corresponding group velocity curves.
21 10 A1 S mm/usec at 350 KHz 2.08 mm/usec at 350 KHz A0 Figure 1-2 Dispersion curves for 2mm-thickness aluminum alloy 6061-T6 plate: different color shows points corresponding to guided wave propagation of three different modes. S mm/usec at 350 KHz A0 A mm/usec at 350 KHz Figure 1-3 Group velocity curves for 2mm-thickness aluminum alloy 6061-T6 plate: different color shows points corresponding to wave-packet velocity of three different modes.
22 11 A successful SHM execution can be described by a four-step process: 1. Detecting damage, 2. Locating the damage, 3. Characterizing the type and severity of the damage, 4. Evaluating the remaining useful life of the structure. This work focuses on methods of the first three steps for monitoring fatigue cracks growing from multiple fastener holes in aluminum structures using ultrasonic guided waves so as to evaluate the remaining useful life of the structure. It examines the applicability of ultrasonic guided waves for a structure in between a simple laboratory experiment specimen and a complex real component. It considers a sparse array of transducers for the sake of less expense. Accordingly, five 12.7 mmdiameter fastener holes were introduced in an equally spaced manner in planar aluminum structures. As the fastener holes serve as good stress raisers, sinusoidal tensile in-plane stress was applied so as to induce fatigue cracks at the edge of the holes. Ten 6.35 mm-diameter Piezoelectric Wafer Active Sensors (PWAS) were mounted in a pattern such that the scattering waves can be well detected as the crack grows. A Finite Element Analysis (FEA) model was built and analyzed to evaluate the most effective transducer pattern. Ultrasonic guided waves signals were collected in through-transmission mode from all pairs of transmitters and receivers in the array by a data acquisition system at a predetermined interval. In order to detect, locate, and visualize the progress of the crack, the transmission coefficient was calculated and integrated into the RAPID technique. The RAPID technique was modified as necessary to remove the complexity of scattering caused by the multiple fastener holes based on the knowledge that a fatigue crack is anticipated to initiate along the centerline of the fastener holes. Two types of structures were tested: one is a plate with open holes and the other is a bolt-jointed structure.

23 Chapter 2 Experimental Methods 2.1 Hardware Material In order to demonstrate the applicability of ultrasonic guided waves on complex structures, the experiments were designed to examine two types of test structures simulating the one between a laboratory experiment and an industrial application scale. One has multiple open fastener holes, the other has a double-lap joint with multiple holes. Figure 2-1 shows the sketches of the test structures. (a) Test structure A-1

24 13 (b) Test structure A-2 (c) Test structure B Figure 2-1 Sketches of the test structures
25 14 A 2mm-thickness aluminum alloy 6061-T6 was used for the structures: 1. The test structure A-1 was 305 mm 610 mm (12 inch 24 inch) one-piece rectangular plate that has two 12.7 mm (1/2 inch)-diameter fastener holes. The holes were mechanically punched to prevent rough surface around the edge of holes that can cause inadvertent early crack initiation at a wrong place. The fastener holes were equally spaced by 76.2 mm (3 inches) apart from the center of each hole. The test structure A-2 was 457 mm 610 mm (18 inch 24 inch) one-piece rectangular plate that has five open fastener holes to add uncertainty to the location of crack initiation. The holes were also equally spaced by 76.2 mm, mechanically punched, and laid 225mm (9 inches) away from the top edge of the plate to have enough space for instrumentation. 2. The other test structure B was 457 mm 610 mm (18 inch 24 inch) three-pieceassembled rectangular plate. The three pieces were cut for a double-lap joint and the holes for each piece were fabricated in the same way as for the structure A-1 and A-2. Then the plates were assembled by five sets of 12.7 mm (1/2 inch)-diameter ASTM A354 Grade 8 bolts and ASTM A563 Grade C nuts for a jointed structure. Double-nuts with two flat washers for each outer side were equipped to prevent the nuts lose out during cyclic loading. Also, in order to have uniform clamping force on the jointed area and to avoid partial loading on certain bolts, the nuts were tightened by a 40.7 N m (30 lbs ft) torque using a torque wrench Mechanical Test Apparatus MTS Systems Corporations 810 material test machine was the main frame for experiments. Figure 2-2 shows the experimental set-up for the structure B.

26 15 Lug and Grips MTS 810 Test Machine Control Console Test Structure DAQ System Figure 2-2 Bolt-jointed test structure in MTS 810 test machine The test structures were mounted on the test bed with high-strength steel grips and lugs fastened by 34 pairs of bolt and nut to uniformly distribute the axial loading across the cross section of the structures. Also the vertical center-axis of the structures was aligned with the actuator and the upper fixture to induce perpendicular far-field stress and to prevent unwanted vibrations or bending moments in the test structure. For the fastener holes serve for good stress raisers, sinusoidal tensile load oscillating between 53.4 KN (12,000 lbs) ~ 2.7 KN (600 lbs) at 5 Hz frequency for the structure A-1, 71.2 KN (16,000 lbs) ~ 2.7 KN (600 lbs) at the same frequency for the structure A-2 and B was applied, so as to induce fatigue cracks at the area of interest; for the structure B, 35.6 N ~ 2.7 KN loading was applied until 480,000 cycles.
 were used to generate and detect guided waves in the test structures. The physical properties given by the manufacturer are presented in Table 2-1.")
27 Ultrasonic Guided Wave System Transducers 6.35 mm-diameter PWAS (Piezoelectric Wafer Active Sensor) disks with wrap-around terminals (Piezo Kinetics Incorporated s ND ) were used to generate and detect guided waves in the test structures. The physical properties given by the manufacturer are presented in Table 2-1. Table 2-1 Properties of PWAS Diameter (mm) Thickness (mm) d33 (m/v) Frequency in Radial Mode(KHz) Frequency in Thickness Mode(KHz) ,005 Figure 2-3 shows the PWAS with soldered lead wires. J-B Weld two-compound epoxy was used to bond the transducers to the aluminum surface. For the sake of robust bonding during tensile loading, the surface was abraded by 200-grade abrasive-paper first and by 400-grade with acetone before bonding transducers. Abraded Surface Positive Electrode Negative Electrode Figure 2-3 PWAS bonded on the aluminum test structure
 equally spaced along a line.")

28 17 First, a frequency sweep experiment was performed to examine the responsive frequency region of the transducer. Guided wave signals were acquired every 10 KHz from 250 KHz to 450 KHz from three transducers that were 76.2 mm (3 inches) equally spaced along a line. The group velocity was calculated from time-of-flight measurements to identify the guided wave mode. Accordingly, 350 KHz (frequency in radial resonance) for S0 mode was selected for this thesis work. Figures 2-4 and 2-5 show the bandwidth and the group velocity measurement results respectively. A group velocity of 5.32 mm/usec is calculated in Figure 2-5 which compares favorably to 5.19 mm/usec for the S0 mode, as shown in Figure 1-3. (a) From T1 R2 (76.2 mm away) (b) From T1 R3 (152.4mm away) Figure 2-4 Frequency response of the transducer: the transducer has the active bandwidth between 300 KHz~400 KHz. t = 14.3usec that is 76.2 mm mm Figure 2-5 Wave signals at 350 KHz: the group velocity measurement provides the mode identification as S0 mode.
 18 θ R Warp-around negative electrode Figure 2-6 Electrodes on the top surface of the PWAS Hence, it is expected not to generate a constant amplitude wave front.")

29 Additionally, the transducer has a wrap-around negative electrode on the top-surface as shown in Figure 2-6. Front direction (θ=90 ) 18 θ R Warp-around negative electrode Figure 2-6 Electrodes on the top surface of the PWAS Hence, it is expected not to generate a constant amplitude wave front. The wave-front of a single transducer was investigated by an angle-beam transducer scanning experiment. Figure 2-7 shows the layout of the experiment. While a single transducer was generating guided waves, a Plexiglas angle-beam transducer received guided waves every 10 degrees for all directions in 25.4 mm increments for radii ranging from 25.4 mm (1 inch) to mm (6 inches). The angle-beam transducer was arranged for receiving the fundamental symmetric mode by using Snell s law to calculate the angle (30 ). The coordinate system for this experiment is illustrated in Figure 2-6. θ=300 R Transmitting line Angle-beam transducer Figure 2-7 Layout of angle-beam transducer scanning experiment (example: 300, 76.2 mm away)
30 19 It is observed that the transducer produces a maximum amplitude around θ=90, and the wave-front spreads out away from the transducer as shown in Figure 2-8 and 2-9. Figure 2-8 shows plots of amplitudes as a function of angular orientation θ from 25.4 mm (1 inch) to mm (6 inches). The result of this experiment provided information for selecting the suitable transducer orientation that the front-faces (θ=90 ) of the two transducer placed in a line with a fastener hole were arranged to confront each other across the hole. 3-dimensional plots of the amplitude distributions were presented in Figure 2-9 according to the distances. Figure 2-8 Amplitudes of the wave-front according to the distance from the transducer

31 20 (a) At 25.4 mm away (b) At 50.8 mm away (c) At 76.2 mm away (d) At mm away (e) At 127 mm away (f) At mm away Figure 2-9 Wave-fronts of a single transducer at different distances: the transducer has the maximum amplitude wave-front around θ=90, and the wave-front spreads as it propagates away.

, so that the least number of transducers is desired; ten")
32 Transducer Array Two types of transducer array were investigated; one was a staggered array and the other was an in-line array. Figure 2-10 illustrates the two transducer arrays for aluminum plate specimens with five holes. The number of sensors is one of the main concerns for SHM system design and implementation. More sensors require more cost, space, wiring, and effort to maintain them. Especially for aerospace applications, the weight of a SHM system is one of the key considerations (along with electrical power consumption), so that the least number of transducers is desired; ten and twelve transducer patterns for the five hole aluminum plates were selected for collecting data in through-transmission for each arrangement. Depending on the placement of the transmitter and receiver, the area of possible interrogation changes and the scattered waves also vary. Hence, it is important to have an appropriate array. (a) Staggered array (b) In-line array Figure 2-10 Sketches of transducer arrays
33 22 3-dimensional FEA models were built to analyze the interaction between guided waves, the holes, and a crack. The properties of the FEA model were given in Table 2-2. The models were designed to simulate the primary wave paths for both arrays. A 2 mm thick 136 mm 136 mm plate model was constructed with the material properties of 6061-T6 aluminum alloy. Five 6.35 mm-diameter circles were place 75.2 mm below the fastener holes for wave generation. 5 KPa circular symmetric surface traction was applied with 5-cycle tone burst signals at 350 KHz on each circle (PWAS). A crack was introduced at the edge of the center hole and increased every 4 mm up to 20 mm. For each crack size and each excitation, the magnitude of the displacement vector data was collected at five points corresponding to the PWAS receivers positions. The minimum element size was set to be less than 10 % of the slowest guided wave mode (A0) wavelength. ABAQUS Explicit was used to solve the models. Figure 2-11 shows the geometry of the FEA model and meshed features. Results will be given in the chapter 3. Table 2-2 Properties of the FEA model Young s modulus Poisson s ratio Mass density Number of elements through the plate thickness Crack width 68.3 GPa ,713 kg / m mm

")
 A")


34 Receiving Points 23 Crack Excitation Circles (a) 3-dimensional FEA model (b) A 12.7 mm diameter hole with 4mm crack Figure 2-11 The geometry of FEA model
35 Data Acquisition A Data Acquisition System (DAQ System) has been developed to manipulate the transducers and to collect wave signals from them. The DAQ System comprises of mainly four hardware components and one software: 1. US Ultratek PCIUT-3100T pulse/digitizer card generates tone-burst signals to a transmitter and receives the wave signals from a receiver. 2. The transducers are connected to Pickering Interfaces PCI S switching card. The switching card opens or closes the electrical circuit between the pulse-out pin and a transmitter, the receiving-in pin and a receiver. 3. Magma PCI expansion box accommodates the pulse/digitizer and the switching card. 4. All of these hardware are manipulated by a laptop computer. 5. A LabVIEW Virtual Instrument (VI) was developed to manage all resources of the DAQ system. Detailed explanation regarding operation and usage of the DAQ System is described in Appendix A. Figure 2-12 shows the schematic of the DAQ System components. Figure 2-12 The DAQ System components
36 25 Throughout the experiments, 300 V 5 cycle-tone-burst signals of 350 KHz were excited to a transmitter. A 10 db attenuator was used to regulate the high-voltage signals. The other receivers detected guided wave signals to interrogate crack growth in the test structures. Each transducer had its turn as a transmitter, while the others acted as receivers. The signals were collected at 50 MHz sampling frequency and every time 10 signals were averaged; for firmly fixed transducers, 10 averages were enough to remove noise. 0 db gain factor was used for the structure A-1, A-2, while 10 db and 15 db were used for the structure B before and after 480,000 cycles respectively. To reduce noise in wave signals, 5.9 MHz low-pass filter and 14 KHz highpass filter were enabled. Initially, ultrasonic guided wave signals from all pairs of transmitters and receivers were collected every 10,000 cycles at under full load 71.2 KN (16,000 lbs) and 0 N respectively; 55.4 KN (12,000 lbs) and 0 N were used for the structure A-1 due to the reduced cross section. Mechanical cycling was then started and interrupted for ultrasonic monitoring at both zero load and max load. These two tensile loading environments provide an opportunity for characterizing the behavior of ultrasonic guided waves under different crack conditions; the tensile loading will open the crack for the plates with open holes. However, it may not for the bolt-jointed structure due to prestress from the bolts. Then, once a first crack initiation was found by the examiner, the wave signals were collected every 4 mm crack length increment as measured by a calipers. The length was determined by perpendicular distance from the edge of holes. In the case of the bolt-jointed structure, the wave signals were recorded every 10,000 cycles until final failure because a fatigue crack was not visible (it was hidden inside the joint). To help the examiner decide further progress of loading, a Plexiglas angle-beam transducer was used to monitor crack initiation and growth from the edge of holes for only the structure B. Figure 2-13 shows the photo of the angle-beam transducer examining the bolted joint area.

37 26 End edge of mid-plate Row of bolts 343 mm 305 mm Figure 2-13 Angle-beam transducer examines a crack initiation at bolted joint area The angle-beam transducer excited S0 mode at 500 KHz and detected reflected signals from 305 mm below the row of holes in the mid-plate of the structure B. This pulse-echo signal acquisition repeated every 10 mm from the left end-edge of the structure. 2.2 Software LabVIEW Virtual Instrument (VI) Developed The Virtual Instrument (VI) was designed to enhance the experimental efficiency and accuracy. The controllers and indicators were arranged as functional categories: pulse control, digitizer control, filter control, miscellaneous control, and others. In order to function as desired, the VI uses various mathematical applications within LabVIEW. The main function frame consists of two important logics, while loops and resetting of parameters. The main idea of this structure is based on a DAQ system in the ultrasonics laboratory. A distinct feature compared to

38 27 the currently existing DAQ systems is the ability of automatically acquiring averaged wave signals from up to 44 transducers in both through-transmission mode and pulse-echo mode. Figure 2-14 shows the front panel of the VI. The detailed circuitry block-diagram is illustrated in Appendix B. Figure 2-14 Front panel of the VI The While Loops The ultrasonic data acquisition continuously records a digitized wave signal since the DAQ System constantly repeats generating, receiving, and displaying the signals. The repetition is accomplished by using a while loop in the VI algorithm. In order to continuously run the loop, the VI needs two while-loops in its construction; one is an outer loop and the other is an inner loop. Figure 2-15 shows the structure of the VI.

39 28 Figure 2-15 Structure of the VI: Two while loops consist of the main function frame A while loop works until a particular condition is satisfied, such as the user pushing a STOP button or a logical Boolean output of true or false is generated by the VI algorithm. A STOP button is given on the front panel for the outer loop as the stop condition, while a RESET button is given on the front panel to stop the inner loop. So, if the VI is started, it would begin the first iteration of the outer loop after initializing the switching card: 1. First, it reads and sets all parameters needed to operate the pulse and the switching cards. For example, a frequency is needed to generate waves, and a sampling frequency is needed to digitize the received waves. Then the VI builds an array containing all combinations of transmitter-receiver pair call numbers. The numbers are going to be used to build a circuit between the switching card and transducers. 2. For the next step, the VI runs the inner loop as a sub-function of the outer loop. This inner loop is always supposed to begin its own iterations after other sub-functions in the outer loop are completed and while the outer loop is still in the first iteration.
40 29 3. After that, the inner loop runs until the RESET button on the front panel is clicked. During on inner loop iteration, the VI sends an excitation signal to a transmitter, receives the transmitted wave signal from a receiver, and displays the received wave signal on the scope. This is repeated until it is reset. This rapid and endless repetition is the reason why the wave appears to be moving on the scope. Meanwhile, if the RESET button is clicked, the VI will start the second iteration of the outer loop starting from its first step, Read/Set parameters. The VI s could run both loops until the STOP button is pushed Resetting of Parameters One more important feature is that the user can vary the frequency of the excited wave by clicking the frequency controller anytime without interfering with the data acquisition. This is possible because the VI checks whether any modification in parameters has occurred at every iteration of the inner loop and will automatically reset the inner loop when any change has happened. Thus, the VI will end the inner loop and start another iteration of the outer loop starting from Read/Set Parameters, so the modification can be effective in new signals Data Analysis Hilbert Transform Many preceding studies have observed that the amplitude of guided waves reflected or transmitted from defects is dependent on the geometry of cracks such as depth and length [10], [11], [12], and [13]. Hence it is well known that more energy of the incident guided wave dissipates as the crack grows. This behavior can be characterized using the instantaneous wave
41 30 characteristics that are referred as envelope and phase. Among many approaches, the Hilbert transform is a popular one for ultrasonic NDE and SHM. For an arbitrary time series, the Hilbert transform is defined as [13], (2-1) Then, the so-called analytical signal of can be obtained as, (2-2) where the envelope and instantaneous frequency are derived as follows respectively, (2-3) The real part of the analytical signal represents the original signal. The imaginary part is the version of the real sequence that is phase-shifted in 90. The Hilbert transform is useful in characterizing the instantaneous attributes of a wave signal and energy distribution in the time domain [13]. The instantaneous frequency is the time rate of change of the instantaneous phase angle. Throughout this work, the Hilbert transform was used for the main technique to analyze the signals of interest. For the experiment on the active band width of a single transducer, the wave signals were Hilbert-transformed and plotted with different colors using mesh.m in MATLAB. Also, the Hilbert transform was used to extract the group velocity. For the wave-
42 front study, the same method was also used to observe the amplitude distribution and its progress in the outward radial direction (as described in section ) Transmission Coefficient using the Hilbert Transform For the envelop represents the energy distribution of an arbitrary time series, the transmission coefficient is obtained by dividing the amplitude of the energy peak in the predetermined time domain by that of the incident energy peak of the baseline signal in the time domain. The relation between the crack length and the transmission coefficients was well investigated at different frequencies by Lu et al. [13] using FEA modeling and experiments. Especially for the transmission coefficient, the linear reduction behavior as crack length increases provides a good quantitative assessment on the damage that exists in the wave path. Since it is expected for a crack to grow as more cyclic loading is applied, the transmission coefficient that compares a damaged-state to a base-state, usually non-damaged, ought to provide a possibility of interrogating the crack length existing in the current structure as follows, (2-4) where refer the time domain of interest. Therefore, the transmission coefficient is calculated for every set of signals collected during the predetermined interval. The time domain was adjusted for the first arriving wave mode envelope of each wave path. To remove the noise that still exists, a Fast Fourier transform (FFT) is taken for all the wave signals and then the frequency content outside the center frequency ± 150 KHz
43 32 was removed. Afterwards, an Inverse Fast Fourier transform (IFFT) was performed on the filtered signals to reconstruct them to the time domain. For the FEA data, the transmission coefficient was based on the magnitude of the displacement vector that corresponds the wave signals to be obtained from receivers. Two mathematical scripts that are hilbert.m, fft.m and ifft.m in MATLAB were used to execute these calculations TC-based RAPID Technique for Improved Visualization The transmission coefficient (TC) was integrated into the RAPID algorithm instead of SDC in order to detect and visualize a crack and cracked hole. Also, the RAPID technique has been modified to remove complexity caused by multiple reflections of scattered waves from the fastener holes. SDC calculates a statistical comparison of the current state of the structure with the state of the structure at the time a sensor array was installed [6]. SDC quantifies how much two signals are statistically different. However, the quantitative relation between SDC and crack length has not been fully studied. This leads to the TC-based RAPID algorithm. Because TC is supposed to mostly decrease from 1 to 0 as a crack grows [13], it is integrated by being subtracted from 1 so that the damage value is going to increase from 0 to 1 for crack growth. For improved visualization of cracks from multiple fastener holes, static stress was analyzed by a FEA model. Figure 2-16 shows the map of the stress distribution when an 80 MPa tensile traction is applied to a plate with 5 fastener holes.


44 33 Hot-Spots Figure 2-16 Stress analysis around fastener holes: A crack is expected to occur around the centerline, Hot-Spots, that are center area of each probability ellipse It is observed that the normal stresses are concentrated along the hole centerline, especially at the very edge of holes called Hot-Spots. This leads to the expectation that cracks will initiate along the hole s centerline so that the probability of crack existence increases with proximity to the centerline. Therefore, it is reasonable to modify the probability ellipse to a centric distribution for the plate with open holes. Figure 2-17 shows the ellipse modification. Figure 2-17 Modification of probability distribution ellipse
45 34 Furthermore, as the distance between a transmitter and receiver becomes larger, the scattering waves are likely to undergo multiple reflections in all direction by the holes, and follow different wave paths and arrive at nearly the same time. This can contradict the physical intuition that a defect would cause the most significant change in the direct wave path of a transmitter and receiver so that the probability gradient can occur at wrong place. Therefore, it is required to select appropriate pairs of the transmitter and receiver that comply the physical background utmost for improved visualization; if the more number of transducer apply, the more pairs would become useful that results in more redundancy. Eq. 2-5 describes to mathematical representation of the modified RAPID technique. (2-5) where, In Eq. 2-5, is the probability that a crack exist at a point inside of the reconstruction region. is the probability of pair of transmitter and receiver that are selected by for the plate with open holes. is the radius of the
46 35 centric gradient of pair of transmitter and receiver, and is the distance between a point and the center of the centric gradient. determines the radius of in accordance with the position of the transmitter and receiver; was set as 1.1 for this work. was divided by half for due to double overlapped probability ellipse in the wave path.
47 Chapter 3 Results 3.1 Results of Finite Element Analysis Simulation The results of finite element simulation demonstrated an effective way for monitoring crack growth at a fastener hole. Snap shots of wave propagation from transmitter 1, 2, and 3 for three different crack lengths (no crack, 12mm, and 20mm) are presented in Figure 3-1, 3-2, and 3-3 respectively. Figures 3-1 and 3-3 represent the in-line array, while Figure 3-2 represents the staggered array. Each column of pictures was taken when the fundamental mode is scattered, left column is for S0 mode and right column is for A0 mode. It is clearly shown that the two fundamental modes propagate in the plate independently of each other with different velocity. S0 mode is faster than A0 mode as predicted by the group velocity information (refer to Figure 1-3). Because of the circular symmetric surface traction on the excitation area, the waves appear to have two concentric circles of wave, and most energy of S0 mode is distributed at the center of plate, while A0 mode is at the outer surface. It is also shown that the scattered wave field changes as the crack grows. As shown in Figure 3-4, the scattered wave from an open hole with a crack can be divided into three components: a diffracted wave from the crack tip, a reflected wave from the crack surface and leaky-creeping waves from the edge of the hole. These three component waves from all wave paths in the figures were observed to be changed as the crack grows. The diffracted wave was dislocated from its initial location to the crack growth direction, the reflected wave expanded due to enlargement of the crack surface, and the leaky-creeping wave from the cracked edge also dissipates. Hence, the magnitude changes of wave signals ought to be detected by receiver A, B
48 37 and C. These scattered waves are observed to behave independently from each wave mode. By the way, the component waves of A0 mode were not clearly identifiable because the other waves reflected from other free edges are overlapped that implies A0 mode is less effective unless the damage characterization feature is able to filter out the non-informative waves. However, the diffracted wave is shown to be changed with different sensitivity depending on the transducer array. Since the incident waves of the in-line array impinge into the crack tip with steeper angle than the staggered array, the diffracted wave dislocates more as the crack grows. It will result in higher sensitivity of the transmission coefficient, and will be shown in the following section.
 (b) No crack (at 56 usec) R6 R7 R8 D R9 R10 L R6 R7 R8 R9 D R10 L R S0 R A0 T1 T2 T3 T4 T5 T1 T2 T3 T4 T5 (c) 12 mm crack (at")
 (f) 20 mm crack (at 56 usec) Figure 3-1 Snap shots of wave propagations for T1 with different crack size (0mm, 12mm,")
, (d), and (f) show the scattered A0 mode at 56 usec.")
49 38 Representing in-line array R6 R7 R8 R9 D* R10 R6 R7 R8 R9 D R10 L** L R*** S0 R A0 T1 T2 T3 T4 T5 T1 T2 T3 T4 T5 (a) No crack (at 36 usec) (b) No crack (at 56 usec) R6 R7 R8 D R9 R10 L R6 R7 R8 R9 D R10 L R S0 R A0 T1 T2 T3 T4 T5 T1 T2 T3 T4 T5 (c) 12 mm crack (at 36 usec) (d) 12 mm crack (at 56 usec) R6 D R7 R8 R9 R10 R6 R7 R8 D R9 R10 L L R S0 R A0 T1 T2 T3 T4 T5 T1 T2 T3 T4 T5 (e) 20 mm crack (at 36 usec) (f) 20 mm crack (at 56 usec) Figure 3-1 Snap shots of wave propagations for T1 with different crack size (0mm, 12mm, 20mm): Figures (a), (c), and (e) show the scattered S0 mode at 36 usec after guided waves excited at the transducer T1. (b), (d), and (f) show the scattered A0 mode at 56 usec. * D indicates Diffracted wave, ** L indicates Leaky-Creeping wave, *** R indicates Reflected wave
 12 mm crack (at 30 usec) (d) 12 mm crack (at 50 usec) R6 R7 D R8 R9 R10 R6 R7 D R8 R9 R10 L L R S0 R A0 T1 T2 T3 T4 T5 T1 T2 T3 T4 T5 (e) 20 mm")
, (d), and (f) show the scattered A0 mode at 50 usec.")
50 39 Representing staggered array R6 R7 R8 R9 R10 R6 R7 R8 R9 R10 D* L** D L R*** S0 R A0 T1 T2 T3 T4 T5 T1 T2 T3 T4 T5 (a) No crack (at 30 usec) (b) No crack (at 50 usec) R6 R7 D R8 R9 L R10 R6 R7 R8 D R9 L R10 R R S0 A0 T1 T2 T3 T4 T5 T1 T2 T3 T4 T5 (c) 12 mm crack (at 30 usec) (d) 12 mm crack (at 50 usec) R6 R7 D R8 R9 R10 R6 R7 D R8 R9 R10 L L R S0 R A0 T1 T2 T3 T4 T5 T1 T2 T3 T4 T5 (e) 20 mm crack (at 30 usec) (f) 20 mm crack (at 50 usc) Figure 3-2 Snap shots of wave propagations for T2 with different crack size (0mm, 12mm, 20mm) : Figures (a), (c), and (e) show the scattered S0 mode at 30 usec after guided waves excited at the transducer T2. (b), (d), and (f) show the scattered A0 mode at 50 usec. * D indicates Diffracted wave, ** L indicates Leaky-Creeping wave, *** R indicates Reflected wave A0
 12 mm crack (at 32 usec) (d) 12 mm crack (at 52 usec) D R6 R7 R8 R9 L R10 R6 D R7 R8 L R9 R10 R S0 R A0 T1 T2 T3 T4 T5 T1 T2 T3 T4 T5 (e) 20 mm")
, (d), and (f) show the scattered A0 mode at 52 usec.")
51 40 Representing in-line array R6 R7 R8 R9 D* L** R10 R6 R7 D R8 L R9 R10 R*** S0 R A0 T1 T2 T3 T4 T5 T1 T2 T3 T4 T5 (a) No crack (at 32 usec) (b) No crack (at 52 usec) R6 D R7 R8 L R9 R10 R6 R7 D R8 L R9 R10 R S0 R A0 T1 T2 T3 T4 T5 T1 T2 T3 T4 T5 (c) 12 mm crack (at 32 usec) (d) 12 mm crack (at 52 usec) D R6 R7 R8 R9 L R10 R6 D R7 R8 L R9 R10 R S0 R A0 T1 T2 T3 T4 T5 T1 T2 T3 T4 T5 (e) 20 mm crack (at 32 usec) (f) 20 mm crack (at 52 usec) Figure 3-3 Snap shots of wave propagations for T3 with different crack size (0mm, 12mm, 20mm) : Figures (a), (c), and (e) show the scattered S0 mode at 32 usec after guided waves excited at the transducer T3. (b), (d), and (f) show the scattered A0 mode at 52 usec. * D indicates Diffracted wave, ** L indicates Leaky-Creeping wave, *** R indicates Reflected wave

52 41 Figure 3-4 Three components of the scattered wave: a diffracted wave, a reflected wave and leaky-creeping waves Three adjacent transducers across a hole from a transmitter were selected for the effective receivers to monitor crack growth (the reflected wave is of no interest in detection and visualization technique discussed in section ): is for the staggered array, and is for the in-line array, where T and R are the transducer number given in Figure 2-7, and T and R are not in a row at the same time. This selection also well complies with the physical intuition for the TC-based RAPID technique discussed in section Figure 3-5 shows several examples of the magnitude of the displacement vector from selected wave paths that take account of the scattered wave field in the vicinity of the crack. As the crack grows, the successive magnitude changes are observed from all signals. It is shown that the wave signal collected at the position for detecting the leaky-creeping wave is more sensitive to each crack increment in both transducer arrays, while the wave signals for the diffracted waves are less. This observation will be evaluated by calculating the transmission coefficient in the following section
 T2 R7 (for the staggered array) (b) T2 R9 (for the staggered array) (c)")

53 42 Legend Schematic of wave paths No crack 4 mm at hole II 8 mm at hole II (c) (a) (d) (b) 12 mm at hole II 16 mm at hole II 20 mm at hole II FEA model (a) T2 R7 (for the staggered array) (b) T2 R9 (for the staggered array) (c) T3 R6 (for the in-line array) (d) T3 R8 (for the in-line array) Figure 3-5 Magnitude of displacements from FEA results: Magnitude changes were observed from the wave paths in the vicinity of the crack growing from the center hole.

 are presented in Table 3-1, while Figure 3-6 shows photos of cracks.")
54 Results from Structure A-1 and A Fatigue Cracks Fatigue cracks initiated from the edge of the open holes in the structure A-1 and A-2. This result confirms that an open fastener hole in a plate subjected to tensile loading is able to concentrate stress at its free edge, and the localized micro-scale damage that occurs when the cyclic loading oscillates within even less than the yield strength can accumulate and evolve to a fatigue crack. The detailed crack growth of the structures A-1 and A-2 (refer to Figure 2-1 and 2-10) are presented in Table 3-1, while Figure 3-6 shows photos of cracks. Table 3-1 Crack growth in the test structure A-1 and A-2 Structure A-1 (2 holes) Structure A-2 (5 holes) Cycles Hole Ⅰ Hole Ⅱ Hole Ⅰ Hole Ⅲ Hole Ⅳ Cycles L Edge R Edge L Edge R Edge L Edge L Edge R Edge L Edge 66, , , , , , , , , , , , , , , , mm 16mm (a) 4mm crack of hole II, the structure A-1 (b) 16mm crack of hole III, the structure A-2 Figure 3-6 Fatigue cracks at 12.7 mm diameter hole of the structures A-1 and A-2
55 Wave Signals The wave signals of the structures A-1 and A-2 show good agreement with the FEA results. The S0 mode was well detected by surface mounted transducers and arrived near the time calculated by the FEA models and by the group velocity. The amplitude changes were also found in the wave signals that passed the vicinity of the fatigue crack in both tensile load environments; it is noticeable that the cracks never passes the line of sight between the transmitter and receiver laid between two adjacent holes. The wave signals of equivalent propagation paths with the waves in Figure 3-5 with respect to the crack positions are presented in Figure 3-7 and 3-8 for maximum tension load (open-crack) and zero load (closed-crack) respectively. Each wave path has almost same amplitude between the max load and zero load condition before the crack initiated, however, they shows difference in amplitude as soon as the crack initiated in both transducer arrays. This observation explains that the closed-crack still transfers the wave energy across the crack surfaces. Clearly, crack monitoring at the max tensile load is more effective than monitoring under zero load because the crack faces are separated and more of the wave is reflected. The cracks in the FEA models are considered to be open-cracks due to no computing elements between the crack faces. Therefore, the behavior of the waves with the max tensile load agrees with the ones of FEA wave signals. The wave signals collected at the position for detecting the leaky-creeping wave reduce as soon as the crack initiated in both staggered and in-line array, and they shows good linear relationships with the crack size. However, the wave signals for detecting the diffracted wave show linear relations after initial increase, but the behaviors appear to have discrepancy with the FEA models according to the transducer array. It will also be compared and contrasted by calculating the transmission coefficient in the following section
56 45 Legend No crack 4 mm at hole II,III 8 mm at hole II,III 12 mm at hole II,III 16 mm at hole II,III 20 mm at hole II,III 24 mm at hole II,III 28 mm at hole II,III 32 mm at hole II,III Schematic of wave paths (a) (c) (d) (b) Structure A-1 Structure A-2 Structure A-1 with 53 KN Structure A-2 with 71 KN (a) T2 R5 (for the staggered array) Structure A-1 with 53 KN (b) T3 R9 (for the in-line array) Structure A-2 with 71 KN (c) T2 R6 (for the staggered array) (d) T3 R8 (for the in-line array) Figure 3-7 Wave signals that passed the vicinity of the crack (with the max tensile load)
57 46 Legend No crack 4 mm at hole II,III 8 mm at hole II,III 12 mm at hole II,III 16 mm at hole II,III 20 mm at hole II,III 24 mm at hole II,III 28 mm at hole II,III 32 mm at hole II,III Schematic of wave paths (a) (c) (d) (b) Structure A-1 Structure A-2 Structure A-1 with 0 N Structure A-2 with 0 N (a) T2 R5 (for the staggered array) Structure A-1 with 0 N (b) T3 R9 (for the in-line array) Structure A-2 with 0 N (c) T2 R6 (for the staggered array) (d) T3 R8 (for the in-line array) Figure 3-8 Wave signals that passed the vicinity of the crack (without the tensile load)
58 Transducer Array Evaluation based on Comparison with FEA Results The transmission coefficient was calculated to compare the FEA results and the experimental data of both transducer arrays and tensile loading conditions. Figures 3-9 and 3-10 show comparisons for selected waves from the FEA and the experimental data of the staggered and in-line array and the max and zero tensile loading conditions. The selected wave signals have come from the same path of the waves shown previously in Figure 3-7 and 3-8. The FEA predicted transmission coefficients are in excellent agreement with the experimental results in the maximum tensile loading condition in both transducer arrays. It confirms that the discussion in the previous section that the open-crack shows good agreement with the FEA results. Furthermore, the transmission coefficient appears to have excellent potential as a feature for crack length characterization as part of an SHM system. Figure 3-9 and 3-10 indicate that an array with line-of-sight paths intersecting open holes is preferred because: 1. As shown in (c) and (d) of Figure 3-9 and 3-10, the transmission coefficient of the wave in the leaky-creeping wave path has good linear proportional relation to the crack length in both transducer arrays. 2. The behavior of the transmission coefficient of the wave path in both arrays has excellent agreement with FEA model simulations. It supports the discussion in the previous section 3.1. As a result, the line-of-sight wave paths can be considered as more effective in terms of sensitivity and congruity. Also, as shown in (a) and (b) of Figure 3-9 and 3-10, the transmission coefficient of the wave in the diffracted wave path can be used for an additional wave that can characterize the crack growth direction.
 T2 R9 (for the staggered array) (d) T2,6 R6,2 (for the staggered array) Figure 3-9 Comparisons of transmission coefficients between the FEA and the experimental")
59 48 Schematic of wave paths (a) (c) (b) (d) FEA model Structure A-1 FEA Result Structure A-1 with 0 and 53 KN (a) T2 R7 (for the staggered array) FEA Result (b) T2,5 R5,2 (for the staggered array) Structure A-1 with 0 and 53 KN (c) T2 R9 (for the staggered array) (d) T2,6 R6,2 (for the staggered array) Figure 3-9 Comparisons of transmission coefficients between the FEA and the experimental data for the staggered array with the max tensile loading
 T3 R3 (for the in-line array) (d) T3,8 R8,3 (for the in-line array) Figure 3-10 Comparisons of transmission coefficients between the FEA and the experimental data")
60 49 Schematic of wave paths (a) (c) (d) (b) FEA model Structure A-2 FEA Result Structure A-2 with 0 N and 71 KN (a) T3 R6 (for the in-line array) FEA Result (b) T3,9 R9,3 (for the in-line array) Structure A-2 with 0 N and 71 KN (c) T3 R3 (for the in-line array) (d) T3,8 R8,3 (for the in-line array) Figure 3-10 Comparisons of transmission coefficients between the FEA and the experimental data for the in-line array with the max tensile loading
61 Damage Visualization based on the TC-based RAPID Technique The behavior of the transmission coefficient, obtained from the Hilbert transform of the wave form, over the entire experiment on the structure A-2 is shown in Figures 3-11 and The abscissa values are given by the step that the ultrasonic monitoring was executed at the interval described in the chapter 2, so as the steps before 9 represent 10,000 cycle intervals and the steps after 9 represent 4 mm-crack increments. It confirms that the transmission coefficient could be a good characterization feature. The open-crack shows more sensitivity to the crack growth as shown in Figure (b) and (d) of Figure 3-11 well indicate the different crack growth rate at hole I and III respectively; (d) is steeper than (b) due to larger increment, 4mm (refer to Table 3-1). Overall transmission coefficient stays within 1±0.2 before the crack interrupts the wave propagation. The initial scatter could be associated with variable environmental conditions and sensor break-in. Perhaps a threshold value as 0.2 would be useful to avoid false positive indications. As a result, the transmission coefficient for the leaky-creeping wave can be considered as a good quantified feature with sizing potential. Additionally, Figure 3-12 also shows that crack monitoring at the max tensile load is more effective than monitoring under zero load. (b) of Figure 3-12 indicates that the transmission coefficient for the diffracted wave can be used as additional useful feature for monitoring the crack growth in horizontal direction. Building on the previous evaluation, the transmission coefficient-based RAPID technique demonstrates improved damage visualization. The output plots of the TC-based RAPID are shown in Figure The holes where cracks initiated and grew (hole I, III, and IV) were well identified and located, while the SDC-based RAPID cannot indicate. Since the damage value is calculated from the quantitative assessment of the crack length, the intensity of the color in the plots and enlargement of the contour represents the progress of the crack.
62 51 Schematic of wave paths (a) and (b) (c) and (d) Structure A-2 Structure A-2 with 0 N Structure A-2 with 71 KN Crack Initiation at Hole I Crack Initiation at Hole I (a) T1,6 R6,1 (for the in-line array) Structure A-2 with 0 N (b) T1,6 R6,1 (for the in-line array) Structure A-2 with 71 KN Crack Initiation at Hole III Crack Initiation at Hole III (c) T3,8 R8,3 (for the in-line array) (d) T3,8 R8,3 (for the in-line array) Figure 3-11 The transmission coefficients from selected wave paths in the structure A-2: the transmission coefficient in the max tensile loading shows ability of monitoring crack growth, it provides an idea about the threshold value as ± 0.2. Also, (b) and (d) indicate the different crack growth rate.
 Structure A-2 with 0 KN (b) T3,9 R9,3 (for the in-line array) Structure A-2 with 71 KN No nearby crack No nearby crack (c) T4,10 R10,4 (for the in-line array) (d) T4,10 R10,4 (for the")
63 52 Schematic of wave paths (a) and (b) (c) and (d) Structure A-2 Structure A-2 with 0 KN Structure A-2 with 71 KN Crack Initiation at Hole III Crack Initiation at Hole III (a) T3,9 R9,3 (for the in-line array) Structure A-2 with 0 KN (b) T3,9 R9,3 (for the in-line array) Structure A-2 with 71 KN No nearby crack No nearby crack (c) T4,10 R10,4 (for the in-line array) (d) T4,10 R10,4 (for the in-line array) Figure 3-12 The transmission coefficients from selected wave paths in the structure A-2: the transmission coefficient in the max tensile loading shows ability of monitoring crack growth. (b) indicates that the diffracted wave can be used for monitoring the crack growth in horizontal direction. Also (d) shows the transmission coefficient depends on the crack.
64 53 SDC-based RAPID for Structure A-2 with 71 KN* TC-based RAPID for Structure A-2 with 71 KN* Fastener holes (a) At 10,000 cycles (b) At 80,000 cycles 4mm (c) At 90,696 cycles 8mm (d) At 101,376 cycles 12mm (e) At 109,806 cycles * Output plots of the SDC-based RAPID(left column) and the TC-based RAPID(right column) techniques for the same wave signals are compared.
 At 126,987 cycles 7.3mm 28mm 9.0mm 3.7mm (i) At 130,258 cycles 8.0mm 32mm 12.8mm 5.")
65 54 SDC-based RAPID for Structure A-2 with 71 KN TC-based RAPID for Structure A-2 with 71 KN 3.6mm 16mm (f) At 117,003 cycles 4.8mm 20mm 2.3mm (g) At 122,905 cycles 6.6mm 24mm 6.0mm (h) At 126,987 cycles 7.3mm 28mm 9.0mm 3.7mm (i) At 130,258 cycles 8.0mm 32mm 12.8mm 5.6mm (j) At 133,005 cycles Figure 3-13 Comparison of TC-based RAPID technique to SDC-based RAPID technique: TCbased RAPID is able to detect, to locate, and to visualize the growth of fatigue cracks.
66 Results from Structure B Fatigue Cracks During the fatigue test on the structure B, the double-lap joint of five sets of bolts and nuts served as a firm connection for transferring the cyclic loading without any visible vibration and bending movement. The PWAS mounted on the two different plates connected by clamping force of the joint were well excited and detected ultrasonic guided waves. Also, the angle-beam scanning was able to detect the fatigue crack completely hidden by the outer plates with good sensitivity. The first indication of a crack in the test structure B was found at 500,000 cycles. The echo signal from the end-edge of the mid-plate weakened, while the one from the vicinity of the row of joints appeared, expanded and strengthened its amplitude. The echo signal from the fatigue crack arrived at around 115 usec, which is close to the expected arrival time of the S0 mode that travels 610 mm that is two times of the distance from the transducer to the row of joints (refer to Figure 2-13). It is observed that the echo signal expanded as more load cycles are applied. Figure 3-14 shows 3-dimensional mesh plots of the Hilbert transformed wave signals. Upon this observation, the experiment was stopped at 530,000 cycles to disassemble the bolted joint and to measure the crack length. (a) of Figure 3-15 shows the photo of cracks initiated near the hole I (refer to (b) of Figure 2-10). Because of chafing between the clamped aluminum surfaces, fretting damage occurred in the vicinity of the bolt hole. It indicates that the axial loading was transferred not by the bearing force on the hole edge, but by the friction force between the plate surfaces. This effect of the clamping force increased the number of cycles required to induce a fatigue crack. As a consequence, two fatigue cracks were initiated from the damaged surfaces, so that the crack did not intersect the hole, and the crack occurred after far
![56 more cyclic loadings were applied to the structure than the structure A-1 and A-2. This similar effect of clamping force on the fatigue behavior of bolted plate is found in Chakherlou et al [16].](/docs-images/83/88431230/images/67-0.jpg "(b) of Figure 3-15 shows the fracture surface after completion of the experiment. The experiment was resumed after reassembling the bolted joint with the same torque.")
67 56 more cyclic loadings were applied to the structure than the structure A-1 and A-2. This similar effect of clamping force on the fatigue behavior of bolted plate is found in Chakherlou et al [16]. (b) of Figure 3-15 shows the fracture surface after completion of the experiment. The experiment was resumed after reassembling the bolted joint with the same torque. After all, the specimen was failed at 536,310 cycles. Echoes from the end-edge Reflection from the crack Near-field noise (a) At 0 cycle (b) At 500,000 cycles Reflection from the crack Reflection from the crack (c) At 530,000 cycles (d) At 535,000 cycles Figure dimensional plot of the angle-beam scanning signals


68 57 36mm 12mm (a) Cracks at hole I Figure 3-15 Fatigue cracks in the test structures (b) crack surface Wave Signals It is observed that the ultrasonic guided wave of S0 mode is able to propagate through the bolt-jointed surfaces clamped only by mechanical pressure without any adhesive medium inbetween them, and the guided wave can be used for monitoring a fatigue crack to be grown underneath the outer skin. As shown in Figure 3-16, the first arriving wave of the structure B arrived at the time of the same wave path with the structure A-2, and the following wave envelope shows distinct shapes that indicate the mode conversion at the interfaces of the joint. Structure A-2 with 71 KN Structure B with 0N (a) T1 R6 (for the in-line array) (b) T1 R6 (for the in-line array) Figure 3-16 Comparison of the wave signals of structure A-2 and B that have same path
69 58 Figure 3-17 shows several selected wave signals that propagated in the vicinity of the cracked joint (hole I) and an undamaged joint (hole III) in the structure B. The signals from the transmitter and receiver vertically laid in in-line with the cracked joint showed successive reduction in amplitude as the crack grew, while the other wave forms remained unchanged. However, the relative amount of the amplitude reduction is different according the loading applied. As shown in (a) and (b) of Figure 3-17, the no-tensile loading condition shows continuous amplitude reduction, while the max-tensile loading condition shows the acute drop at the last crack increment. The corresponding transmission coefficient of the wave signals in Figure 3-17 are presented in Figure 3-18 and Figure 3-18 shows the transmission coefficient of the waves collected before 480,000 cycles, while Figure 3-19 shows after 480,000 cycles. The transmission coefficient in Figure 3-19 provides the possibility of monitoring the health of boltjointed area that is more complicated structure than the plate with open holes. Also, the stable behavior of the transmission coefficient before a crack initiated that is shown in Figure 3-18 supports the usefulness of the guided waves.
70 59 Legend Schematic of wave paths 480,000 cycles 490,000 cycles 500,000 cycles 510,000 cycles 520,000 cycles 530,000 cycles (a) and (b) (c) and (d) Structure B Structure B with 0 N Structure B with 71 KN (a) T1 R6 (for the in-line array) (b) T1 R6 (for the in-line array) Structure B with 0 N Structure B with 71 KN (c) T3 R8 (for the in-line array) (d) T3 R8 (for the in-line array) Figure 3-17 Wave signals that propagated in the vicinity of the cracked joint and an undamaged joint in the structure B
71 60 Schematic of wave paths (b) and (b) (c) and (d) Structure B Structure B with0 N Structure B with 71 KN (a) T1,6 R6,1 (for the in-line array) (b) T1,6 R6,1 (for the in-line array) Structure B with 0 N Structure B with 71 KN (c) T3,8 R8,3 (for the in-line array) (d) T3,8 R8,3 (for the in-line array) Figure 3-18 The transmission coefficients of the wave signals that propagated in the vicinity of the cracked joint and an undamaged joint in the structure B before 480,000 cycles.
72 61 Schematic of wave paths (c) and (b) (c) and (d) Structure B Structure B with 0 N Structure B with 71 KN (a) T1 R6 (for the in-line array) (b) T1 R6 (for the in-line array) Structure B with 0 N Structure B with 71 KN (c) T3 R8 (for the in-line array) (d) T3 R8 (for the in-line array) Figure 3-19 The transmission coefficients of the wave signals that propagated in the vicinity of the cracked joint and an undamaged joint in the structure B after 480,000 cycles

 for the structure A-2 while it is still able to monitor all fastener holes.")
73 Potential of Sparse Array A sparse in-line array is investigated to monitor fatigue crack growth. Less number of transducers ought to provide benefits in cost and weight of the SHM system. Figure 3-20 illustrates the schematic of a sparse in-line array that takes advantage of wave paths that intersect fastener holes. Figure 3-20 Schematic of a sparse in-line array: it needs only a half number of transducer required for the in-line array of the structure A-2. This sparse array requires only half the number of transducers (T2, T4, T7, and T9) for the structure A-2 while it is still able to monitor all fastener holes. Thereupon, the transmission coefficient on the first arriving wave packet (time widow: 40usec ~ 65 usec) was calculated from the wave signals of the structure A-2 that correspond to the wave paths in Figure The Hilbert transformed wave signals and the transmission coefficient are presented in Figure 3-21 and 3-22 for the max tensile loading condition. The abscissa values for Figure 3-22 and legend for Figure 3-21 are given by the step (refer the previous section 3.3.3). As a result, the waves in the vicinity show successive amplitude reduction as the crack grows at hole III for the maxtensile loading condition.
 and (d) (a) and (b) Structure A-2 Structure A-2 with 71 KN Structure A-2 with 71 KN (a) T2 R9 (for the sparse")
 (d) T7 R4 (for the sparse in-line array) Figure 3-21 The Hilbert transformed wave signals for the sparse in-line array under the")
74 63 Legend Step 1 Step 2 Step 3 Step 4 Step 5 Step 6 Step 7 Step 8 Step 9 Step 10 Step 11 Step 12 Step 13 Step 14 Step 15 Step 16 Step 17 Schematic of wave paths (c) and (d) (a) and (b) Structure A-2 Structure A-2 with 71 KN Structure A-2 with 71 KN (a) T2 R9 (for the sparse in-line array) (b) T9 R2 (for the sparse in-line array) Structure A-2 with 71 KN Structure A-2 with 71 KN (c) T4 R7 (for the sparse in-line array) (d) T7 R4 (for the sparse in-line array) Figure 3-21 The Hilbert transformed wave signals for the sparse in-line array under the maxtensile loading condition
 (b) T4,7 R7,4 (for the sparse in-line array) Figure 3-22 The transmission coefficient for the sparse in-line array under the max-tensile loading")
75 64 Schematic of wave paths Structure A-2 Structure A-2 with 71 KN Structure A-2 with 71 KN Crack Initiation at Hole III Crack Initiation at Hole III (a) T2,9 R9,2 (for the sparse in-line array) (b) T4,7 R7,4 (for the sparse in-line array) Figure 3-22 The transmission coefficient for the sparse in-line array under the max-tensile loading condition
76 Chapter 4 Conclusions and Future Work 4.1 Summary The first three steps for a structural health monitoring implementation on several aluminum alloy structures have been presented and discussed: 1. Detecting damage, 2. Locating the damage, 3. Characterizing the type and severity of the damage. Two different types of aluminum alloy planar structures have been tested; a plate with multiple open holes and an assembled plate-like structure containing a double-lap bolted joint, that approximately represent aircraft wing and fuselage structures. Multiple fastener holes served as stress raisers for inducing fatigue cracks at open holes in the plate. The bolted joint worked as a firm connection for transferring the cyclic loads, and was a site for fretting damage in the vicinity of fastener holes, which eventually evolved to fatigue cracks hidden by the outer skins. Understanding of guided waves mechanics in a free plate offered opportunities to generate ultrasonic guided waves in those structures. The multiple surface-mounted piezoelectric wafer active sensors in an effective pattern were excited and detected ultrasonic guided waves transversing the area of interest in both the single plate and bolted joint construction. The knowledge gained from investigation of frequency response and wave-front profile of a single transducer made it possible to handle a network in a suitable way and to arrange them in an effective way for interrogating the current state of the structures. Also, the angle-beam scanning technique verified the evidence of fatigue crack initiation and growth inside of the bolted joint with good sensitivity, which assisted the examiner to proceed with the experiment. Development
77 66 of an ultrasonic data acquisition system enabled execution of effective and accurate SHM experiments. Furthermore, finite element analysis of ultrasonic guided wave propagation in a plate with multiple open fastener holes and a crack grown incrementally helped develop a best strategy to evaluate the effective transducer array and analyze the collected wave signals. The wave propagation data from the FEA models showed good agreement with the wave signals of the experiments. The array was designed to receive the scattering waves in the vicinity of the crack and to provide a linear relation between the crack length and the measured variable (transmission coefficient). The Hilbert transform was applied to the collected wave signals to envelope the wave form. The transmission coefficient from the wave transformation was calculated and diagnosed to extract quantified data for detecting and locating the crack. The data was integrated into the RAPID technique for visualization. The RAPID technique was modified based on the prior knowledge of static stress analysis in order to have improved visualization. 4.2 Conclusions As a result, the experiments supported by the FEA simulations in this thesis work have led to the following conclusions: 1. Finite element simulation demonstrated an effective way to monitor crack growth at a fastener hole. Two scattering waves, a diffracted wave from the crack tip and a leakycreeping wave from the edge of the hole, have been identified as informative waves for characterizing the fatigue crack initiation and growth.
78 67 2. The transmission coefficient obtained from the Hilbert transform of the wave form appears to have excellent potential as a feature for crack length characterization as part of an SHM system. 3. A transducer array with line-of-sight paths intersecting open holes has been identified as a preferable pattern for plates containing open holes. It can detect the scattering wave with high sensitivity, and agrees well with FEA model predictions. 4. The transmission coefficient-based RAPID technique has demonstrated improved damage visualization. It can identify the hole at which a crack initiates, as well as visualize the crack growth. 5. The ultrasonic guided wave S0 mode at 350 KHz is able to propagate through the bolt-jointed surfaces (clamped only by mechanical pressure without any adhesive medium in-between them), and the guided wave can be used to monitor a fatigue crack growing underneath the outer skin. 6. A sparse in-line transducer array for the plate with open holes shows a strong linear relation between crack growth and transmission coefficient, which implies that the sparse array is able to monitor fatigue crack growth, while providing cost benefits for the structural health monitoring system. 4.3 Future Work This study provides many opportunities for future work. First, it is worth pursuing several improvements to the damage characterization feature and the RAPID technique. The amplitude of ultrasonic guided waves can be vulnerable to environmental conditions like mechanical vibration from a rotating propulsion system or electrical surge from a power supply, so that other damage characterization feature such as frequency shift and time of flight can be explored. Since it is
79 68 possible for the features to be quantified, the damage factor based on the quantitative assessment can be integrated into the RAPID technique. Moreover, the RAPID technique can be modified in a more precise manner. The damage trace on the TC-based RAPID output plot does not project the actual size of the crack detected and located. Therefore, an ability of projecting the actual severity of the damage is worth of study. It can be approached by two different paths. One is to adjust that determines the size of the probability gradient. Studying the proportional relation of to the size of damage trace will be worthwhile. The other is to adjust the probability gradient. The probability ellipse used in this work is based on the physical intuition that concerns unidirectional in-plane tensile loading. Therefore, based on fracture mechanics, future work may study a different shape of probability gradient that concerns the history of loading direction and which may improve the accuracy of the RAPID technique. In addition to that, many aerospace vehicles developed in the recent days are made from composite material. For example, Boeing 787 Dreamliner is made of composite material approximately 50 percent of the primary structure including the fuselage and wings. Perhaps it will lead this work to examining a composite planar structure that contains multiple joints. Depending on the stacking layout of the composite material, some changes can be implemented on the shape of the probability gradient. It should rely on extensive knowledge of damage development in composite materials. If successful, it will be able to pinpoint the location of damage by overcoming the skewing angle problem of ultrasonic guided waves in composite materials.
80 69 Bibliography 1. Federal Highway Administration. National Bridge Inventory, Deficient Bridges by State and Highway System, (accessed April ). 2. Federal Highway Administration. Office of Freight Management and Operation, Freight Facts and Figures 2004, docs/ 04factsfigures/index.htm (accessed April ). 3. Gebman, J. R., Challenges and Issues with the Further Aging of U.S. Air Force Aircraft: Policy Options for Effective Life-Cycle Management of Resources, RAND Corporation, (accessed April ). 4. Farrar, C. R. and Worden, K., An introduction to structural health monitoring, Philosophical Transactions of the Royal Society A, Vol. 365, (2007). 5. Rose, J. L., Ultrasonic Guided Waves in Structural Health Monitoring, Advances in Nondestructive Evaluation, Key Engineering Materials Vols (2004). 6. Breon, L. J., Van Velsor, J. K. and Rose, J. L., Guided Wave Damage Detection Tomography for Structural Health Monitoring in Critical Zones of Pipelines, Materials Evaluation, Vol. 65, (2007). 7. Van Velsor, J. K., Gao, H. and Rose, J. L., Guided-wave tomographic imaging of defects in pipe using a probabilistic reconstruction algorithm, Insight, Vol. 49, No. 9, (2007). 8. Zhao, X., Gao, H., Zhang, G., Ayhan, B., Yan, F., Kwan, C. and Rose, J. L., Active health monitoring of an aircraft wing with embedded piezoelectric sensor/actuator network: I. Defect detection, localization and growth monitoring, Smart Mater. Struct., Vol. 16, (2007).
81 70 9. Yan, F., Royer Jr., R. L. and Rose, J. L., Ultrasonic Guided Wave Imaging Techniques in Structural Health Monitoring, Journal of Intelligent Material Systems and Structures, Vol. 21, (2010). 10. Alleyne, D. N. and Cawley, P., The Interaction of Lamb Waves with Defects, IEEE Transactions on Ultrasonics, Ferroelectrics and Frequency Control, Vol. 39, No. 3, (1992). 11. Chang, Z. and Mal, A., Scattering of Lamb waves from a rivet hole with edge cracks, Mechanics of Materials, Vol. 31, (1999). 12. Ihn, J B. and Chang F. K., Detection and monitoring of hidden fatigue crack growth using a built-in piezoelectric sensor/actuator network: I. Diagnostics, Smart Material Structure, Vol. 13, (2004). 13. Lu, Y., Ye, L., Su, Z. and Yang, C., Quantitative assessment of through-thickness crack size based on Lamb wave scattering in aluminium plates, NDT&E International, Vol. 41, No. 1, (2008). 14. Lissenden, C. J., Cho, H. and Kim, C. S., Fatigue Crack Growth Monitoring of an Aluminum Joint Structure, Review of Progress in QNDE (to be published). 15. Rose, J. L., Ultrasonic Waves in Solid Media, Cambridge University Press, Cambridge, UK(1999). 16. Chakherlou, T. N., Oskouei, R. H. and Vogwell, J., Experimental and numerical investigation of the effect of clamping force on the fatigue behavior of bolted plates, Engineering Failure Analysis, Vol. 15, (2008).
82 Appendix A User s Manual of the DAQ System
83 72
84 73
85 74
86 75
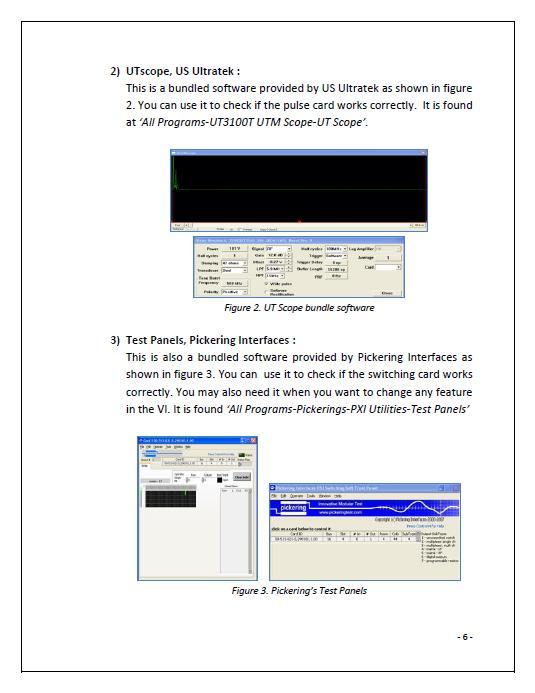
87 76
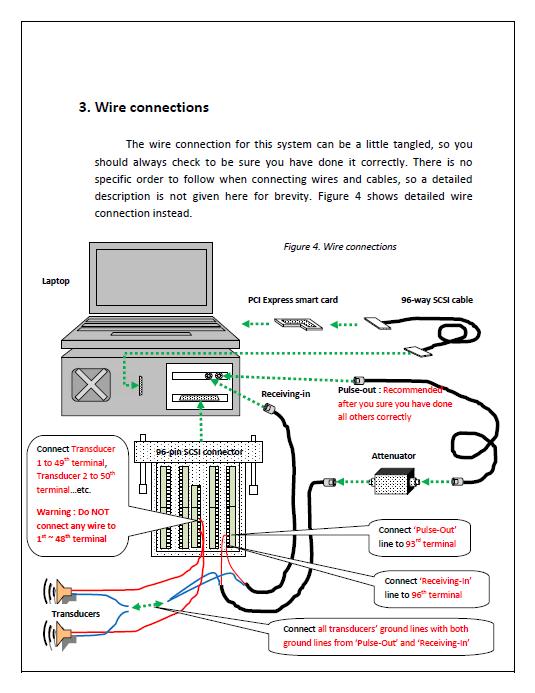
88 77
89 78
90 79
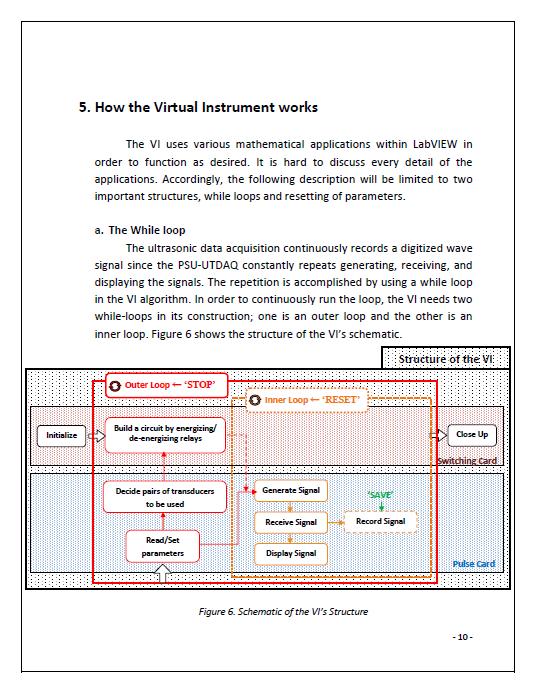
91 80
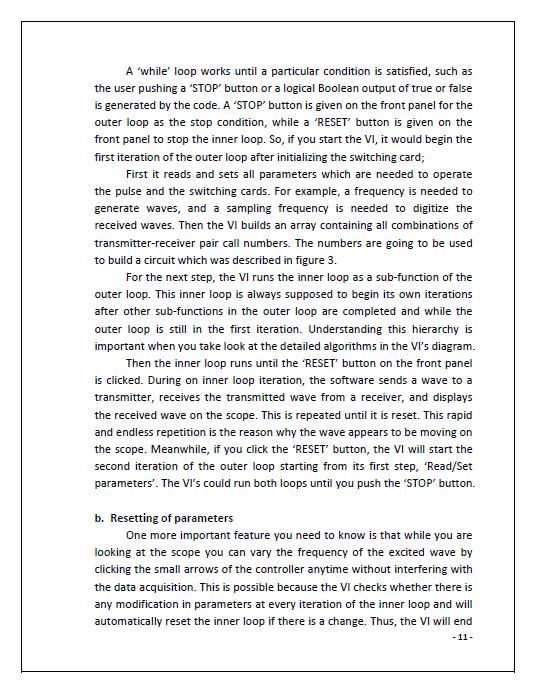
92 81
93 82
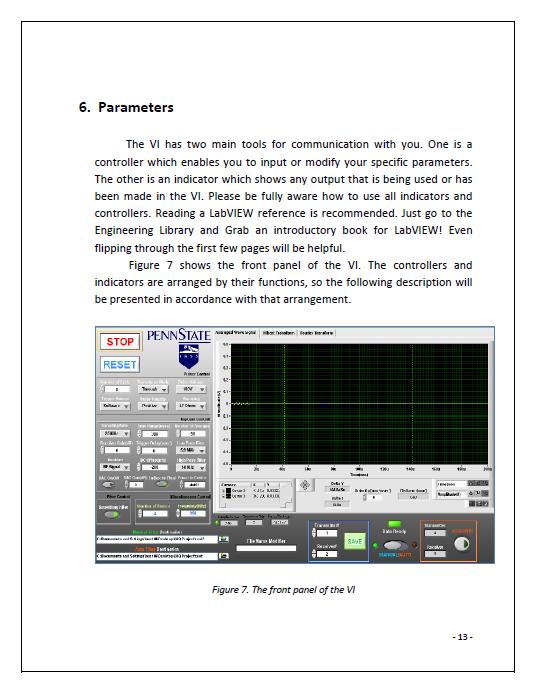
94 83
95 84
96 85
97 86
98 87
99 88
100 89
101 90
102 91
103 92
104 93
105 94
106 95
107 Appendix B Circuitry Block Diagram of the Virtual Instrument The whole circuitry block diagram of the Virtual Instrument (VI) developed for this work is presented. Due to limited space, the VI is cut as consecutive section and arranged orderly from left to right at the next t fourteen pages. Please, refer to the figure as below. 1 st page 3 rd page 5 th page 7 th page 9 th page 11 th page 13 th page 2 nd page 4 th page 6 th page 8 th page 10 th page 12 th page 14 th page Figure B-1 The circuitry block diagram of the VI
108 To be continued at the next page
109 To be continued at the next page Continued from the previous page

110 To be continued at the next page Continued from the previous page

111 To be continued at the next page Continued from the previous page

112 To be continued at the next page Continued from the previous page

113 To be continued at the next page Continued from the previous page

114 To be continued at the next page Continued from the previous page

115 To be continued at the next page Continued from the previous page

116 To be continued at the next page Continued from the previous page

117 To be continued at the next page Continued from the previous page

118 To be continued at the next page Continued from the previous page

119 To be continued at the next page Continued from the previous page

120 To be continued at the next page Continued from the previous page
FATIGUE CRACK GROWTH MONITORING OF AN ALUMINUM JOINT STRUCTURE
 FATIGUE CRACK GROWTH MONITORING OF AN ALUMINUM JOINT STRUCTURE C. J. Lissenden 1, H. Cho 1, and C. S. Kim 1 1 Department of Engineering Science and Mechanics, The Pennsylvania State University, University
Ultrasonic Guided Waves for NDT and SHM
 Ultrasonic Guided Waves for NDT and SHM Joseph L. Rose Paul Morrow Professor Engineering Science & Mechanics Department Penn State University Chief Scientist FBS,Inc. CAV Presentation May 4, 2009 The difference
Co-Located Triangulation for Damage Position
 Co-Located Triangulation for Damage Position Identification from a Single SHM Node Seth S. Kessler, Ph.D. President, Metis Design Corporation Ajay Raghavan, Ph.D. Lead Algorithm Engineer, Metis Design
A Numerical study on proper mode and frequency selection for riveted lap joints inspection using Lamb waves.
 More Info at Open Access Database www.ndt.net/?id=18676 A Numerical study on proper mode and frequency selection for riveted lap joints inspection using Lamb waves. Mohammad. (. SOORGEE Nondestructive
CIRCULAR LAMB AND LINEAR SHEAR HORIZONTAL GUIDED WAVE ARRAYS FOR STRUCTURAL HEALTH MONITORING
 CIRCULAR LAMB AND LINEAR SHEAR HORIZONTAL GUIDED WAVE ARRAYS FOR STRUCTURAL HEALTH MONITORING Thomas R. Hay, Jason Van Velsor, Joseph L. Rose The Pennsylvania State University Engineering Science and Mechanics
Quasi-Rayleigh Waves in Butt-Welded Thick Steel Plate
 Quasi-Rayleigh Waves in Butt-Welded Thick Steel Plate Tuncay Kamas a) Victor Giurgiutiu b), Bin Lin c) a) Mechanical Engineering University of South Carolina 3 Main Str. 2928 Columbia SC b) Mechanical
Finite element simulation of photoacoustic fiber optic sensors for surface rust detection on a steel rod
 Finite element simulation of photoacoustic fiber optic sensors for surface rust detection on a steel rod Qixiang Tang a, Jones Owusu Twumasi a, Jie Hu a, Xingwei Wang b and Tzuyang Yu a a Department of
ULTRASONIC GUIDED WAVE FOCUSING BEYOND WELDS IN A PIPELINE
 ULTRASONI GUIDED WAVE FOUSING BEYOND WELDS IN A PIPELINE Li Zhang, Wei Luo, Joseph L. Rose Department of Engineering Science & Mechanics, The Pennsylvania State University, University Park, PA 1682 ABSTRAT.
SPARSE ARRAY TOMOGRAPHY SYSTEM FOR CORROSION EXTENT MONITORING H. Bian, H. Gao, J. Rose Pennsylvania State University, University Park, PA, USA
 SPARSE ARRAY TOMOGRAPHY SYSTEM FOR CORROSION EXTENT MONITORING H. Bian, H. Gao, J. Rose Pennsylvania State University, University Park, PA, USA Abstract: A sparse array guided wave tomography system is
Quantitative Crack Depth Study in Homogeneous Plates Using Simulated Lamb Waves.
 More Info at Open Access Database www.ndt.net/?id=18675 Quantitative Crack Depth Study in Homogeneous Plates Using Simulated Lamb Waves. Mohammad. (. SOORGEE, Aghil. YOUSEF)-KOMA Nondestructive Testing
Title: Reference-free Structural Health Monitoring for Detecting Delamination in Composite Plates
 Title: Reference-free Structural Health Monitoring for Detecting Delamination in Composite Plates Authors (names are for example only): Chul Min Yeum Hoon Sohn Jeong Beom Ihn Hyung Jin Lim ABSTRACT This
Structural Integrity Monitoring using Guided Ultrasonic Waves
 Structural Integrity Monitoring using Guided Ultrasonic Waves Paul Fromme Department of Mechanical Engineering University College London NPL - May 2010 Structural Integrity Monitoring using Guided Ultrasonic
Application of Ultrasonic Guided Waves for Characterization of Defects in Pipeline of Nuclear Power Plants. Younho Cho
 Application of Ultrasonic Guided Waves for Characterization of Defects in Pipeline of Nuclear Power Plants Younho Cho School of Mechanical Engineering, Pusan National University, Korea ABSTRACT State-of-art
Generation Laser Scanning Method for Visualizing Ultrasonic Waves Propagating on a 3-D Object
 1st International Symposium on Laser Ultrasonics: Science, Technology and Applications July 16-18 2008, Montreal, Canada Generation Laser Scanning Method for Visualizing Ultrasonic Waves Propagating on
Validation of a Lamb Wave-Based Structural Health Monitoring System for Aircraft Applications
 Validation of a Lamb Wave-Based Structural Health Monitoring System for Aircraft Applications Seth S. Kessler, Ph.D. Dong Jin Shim, Ph.D. SPIE 222 2005Third Street Cambridge, MA 02142 617.661.5616 http://www.metisdesign.com
Piezoelectric Wafer Active Sensor Guided Wave Imaging
 Piezoelectric Wafer Active Sensor Guided Wave Imaging Lingyu Yu and Victor Giurgiutiu Mechanical Engineering Department, University of South Carolina, Columbia, SC 29208 yu3@engr.sc.edu, giurgiut@engr.sc.edu
Time Reversal FEM Modelling in Thin Aluminium Plates for Defects Detection
 ECNDT - Poster 39 Time Reversal FEM Modelling in Thin Aluminium Plates for Defects Detection Yago GÓMEZ-ULLATE, Instituto de Acústica CSIC, Madrid, Spain Francisco MONTERO DE ESPINOSA, Instituto de Acústica
Ultrasonic Guided Wave Applications
 Ultrasonic Guided Wave Applications Joseph L. Rose Penn State University April 29-30, 2013 2013 Center for Acoustics and Vibrations meeting What is a Guided Wave? (Guided wave requires boundary for propagation
Detection of Protective Coating Disbonds in Pipe Using Circumferential Guided Waves
 17th World Conference on Nondestructive Testing, 25-28 Oct 2008, Shanghai, China Detection of Protective Coating Disbonds in Pipe Using Circumferential Guided Waves Jason K. Van Velsor Pennsylvania State
Application of Guided Wave Technology to Tube Inspection
 ECNDT 2006 - Th.3.1.5 Application of Guided Wave Technology to Tube Inspection T. VOGT, D. ALLEYNE, B. PAVLAKOVIC, Guided Ultrasonics Limited, Nottingham, United Kingdom 1. Introduction Abstract. The inspection
ULTRASONIC GUIDED WAVE ANNULAR ARRAY TRANSDUCERS FOR STRUCTURAL HEALTH MONITORING
 ULTRASONIC GUIDED WAVE ANNULAR ARRAY TRANSDUCERS FOR STRUCTURAL HEALTH MONITORING H. Gao, M. J. Guers, J.L. Rose, G. (Xiaoliang) Zhao 2, and C. Kwan 2 Department of Engineering Science and Mechanics, The
Piezoelectric transducer excitation for guided waves propagation on pipeline with flexural wave modes
 9 th European Workshop on Structural Health Monitoring July 10-13, 2018, Manchester, United Kingdom Piezoelectric transducer excitation for guided waves propagation on pipeline with flexural wave modes
Penn State University ESM Ultrasonics R&D Laboratory Joseph L. Rose Research Activities
 Penn State University ESM Ultrasonics R&D Laboratory Joseph L. Rose Research Activities Crack Detection in Green Compacts The Center for Innovative Sintered Products Identifying cracked green parts before
Guided Wave Travel Time Tomography for Bends
 18 th World Conference on Non destructive Testing, 16-20 April 2012, Durban, South Africa Guided Wave Travel Time Tomography for Bends Arno VOLKER 1 and Tim van ZON 1 1 TNO, Stieltjes weg 1, 2600 AD, Delft,
In-Situ Damage Detection of Composites Structures using Lamb Wave Methods
 In-Situ Damage Detection of Composites Structures using Lamb Wave Methods Seth S. Kessler S. Mark Spearing Mauro J. Atalla Technology Laboratory for Advanced Composites Department of Aeronautics and Astronautics
Inspection of pipe networks containing bends using long range guided waves
 Inspection of pipe networks containing bends using long range guided waves Ruth Sanderson TWI Ltd. Granta Park, Great Abington, Cambridge, CB21 6AL, UK 1223 899 ruth.sanderson@twi.co.uk Abstract Guided
Long Range Ultrasonic Testing - Case Studies
 More info about this article: http://www.ndt.net/?id=21145 Prawin Kumar Sharan 1, Sheethal S 1, Sri Krishna Chaitanya 1, Hari Kishore Maddi 1 1 Sievert India Pvt. Ltd. (A Bureau Veritas Company), 16 &
Investigation on Sensor Fault Effects of Piezoelectric Transducers on Wave Propagation and Impedance Measurements
 Investigation on Sensor Fault Effects of Piezoelectric Transducers on Wave Propagation and Impedance Measurements Inka Buethe *1 and Claus-Peter Fritzen 1 1 University of Siegen, Institute of Mechanics
SELECTION OF MATERIALS AND SENSORS FOR HEALTH MONITORING OF COMPOSITE STRUCTURES
 SELECTION OF MATERIALS AND SENSORS FOR HEALTH MONITORING OF COMPOSITE STRUCTURES 1,2 Seth. S. Kessler and 1 S. Mark Spearing 1 Technology Laboratory for Advanced Composites Department of Aeronautics and
Multiple crack detection of pipes using PZT-based guided waves
 Multiple crack detection of pipes using PZT-based guided waves *Shi Yan 1), Ji Qi 2), Nai-Zhi Zhao 3), Yang Cheng 4) and Sheng-Wenjun Qi 5) 1), 2), 3), 4) School of Civil Engineering, Shenyang Jianzhu
A New Lamb-Wave Based NDT System for Detection and Identification of Defects in Composites
 SINCE2013 Singapore International NDT Conference & Exhibition 2013, 19-20 July 2013 A New Lamb-Wave Based NDT System for Detection and Identification of Defects in Composites Wei LIN, Lay Siong GOH, B.
Ultrasonic Guided Wave Testing of Cylindrical Bars
 18th World Conference on Nondestructive Testing, 16-2 April 212, Durban, South Africa Ultrasonic Guided Wave Testing of Cylindrical Bars Masanari Shoji, Takashi Sawada NTT Energy and Environment Systems
A NEW APPROACH FOR THE ANALYSIS OF IMPACT-ECHO DATA
 A NEW APPROACH FOR THE ANALYSIS OF IMPACT-ECHO DATA John S. Popovics and Joseph L. Rose Department of Engineering Science and Mechanics The Pennsylvania State University University Park, PA 16802 INTRODUCTION
ISO INTERNATIONAL STANDARD. Non-destructive testing Acoustic emission inspection Secondary calibration of acoustic emission sensors
 INTERNATIONAL STANDARD ISO 12714 First edition 1999-07-15 Non-destructive testing Acoustic emission inspection Secondary calibration of acoustic emission sensors Essais non destructifs Contrôle par émission
Assessment of lamination defect near the inner surface based on quasi-symmetric circumferential Lamb waves
 5 th Asia Pacific Conference for Non-Destructive Testing (APCNDT27), Singapore. Assessment of lamination defect near the inner surface based on quasi-symmetric circumferential Lamb waves Ziming Li, Cunfu
Professor Emeritus, University of Tokyo, Tokyo, Japan Phone: ;
 17th World Conference on Nondestructive Testing, 25-28 Oct 2008, Shanghai, China New Ultrasonic Guided Wave Testing using Remote Excitation of Trapped Energy Mode Morio ONOE 1, Kenji OKA 2 and Takanobu
GUIDED WAVES FOR DAMAGE MONITORING IN PLATES FOR NOTCH DEFECTS
 Int. J. Engg. Res. & Sci. & Tech. 2014 Ramandeep Singh et al., 2014 Research Paper ISSN 2319-5991 www.ijerst.com Vol. 3, No. 2, May 2014 2014 IJERST. All Rights Reserved GUIDED WAVES FOR DAMAGE MONITORING
DAMAGE DETECTION IN PLATE STRUCTURES USING SPARSE ULTRASONIC TRANSDUCER ARRAYS AND ACOUSTIC WAVEFIELD IMAGING
 DAMAGE DETECTION IN PLATE STRUCTURES USING SPARSE ULTRASONIC TRANSDUCER ARRAYS AND ACOUSTIC WAVEFIELD IMAGING T. E. Michaels 1,,J.E.Michaels 1,B.Mi 1 and M. Ruzzene 1 School of Electrical and Computer
A Novel Crack Location Method Based on the Reflection Coefficients of Guided Waves
 18th World Conference on Non-destructive Testing, 16-20 April 2012, Durban, South Africa A Novel Crack Location Method Based on the Reflection Coefficients of Guided Waves Qiang FAN, Zhenyu HUANG, Dayue
Module 2 WAVE PROPAGATION (Lectures 7 to 9)
") Module 2 WAVE PROPAGATION (Lectures 7 to 9) Lecture 9 Topics 2.4 WAVES IN A LAYERED BODY 2.4.1 One-dimensional case: material boundary in an infinite rod 2.4.2 Three dimensional case: inclined waves 2.5
Module 2 WAVE PROPAGATION (Lectures 7 to 9) Lecture 9 Topics 2.4 WAVES IN A LAYERED BODY 2.4.1 One-dimensional case: material boundary in an infinite rod 2.4.2 Three dimensional case: inclined waves 2.5
Instantaneous Baseline Damage Detection using a Low Power Guided Waves System
 Instantaneous Baseline Damage Detection using a Low Power Guided Waves System can produce significant changes in the measured responses, masking potential signal changes due to structure defects [2]. To
Detection of Cracks at Rivet Holes in Thin Plates Using Lamb-Wave Scanning
 University of Texas at El Paso DigitalCommons@UTEP Departmental Technical Reports (CS) Department of Computer Science 2-1-2003 Detection of Cracks at Rivet Holes in Thin Plates Using Lamb-Wave Scanning
Experimental and theoretical investigation of edge waves propagation and scattering in a thick plate with surface-breaking crack-like defect
 Experimental and theoretical investigation of edge waves propagation and scattering in a thick plate with surface-breaking crack-like defect Mikhail V Golub 1, Artem A Eremin 1,2 and Maria V Wilde 3 1
MODELING AND EXPERIMENTATION OF THICKNESS MODE E/M IMPEDANCE AND RAYLEIGH WAVE PROPAGATION FOR PIEZOELECTRIC WAFER ACTIVE SENSORS ON THICK PLATES
 Proceedings of the ASME 214 Conference on Smart Materials, Adaptive Structures and Intelligent Systems SMASIS214 September 8-1, 214, Newport, Rhode Island, USA SMASIS214-7571 MODELING AND EXPERIMENTATION
CRACK SIZING USING A NEURAL NETWORK CLASSIFIER TRAINED WITH DATA OBTAINED FROM FINI1E ELEMENT MODELS
 CRACK SIZING USING A NEURAL NETWORK CLASSIFIER TRAINED WITH DATA OBTAINED FROM FINI1E ELEMENT MODELS Kornelija Zgonc, Jan D. Achenbach and Yung-Chung Lee Center for Quality Engineering and Failure Prevention
EMBEDDED NON-DESTRUCTIVE EVALUATION FOR DAMAGE DETECTION USING PIEZOELECTRIC WAFER ACTIVE SENSORS
 Scientific Bulletin of the Politehnica University of Timisoara Transactions on Mechanics Special Issue The 11 th International Conference on Vibration Engineering Timisoara, Romania, September 27-3, 25
APPLICATION OF ULTRASONIC GUIDED WAVES FOR INVESTIGATION OF COMPOSITE CONSTRUCTIONAL COMPONENTS OF TIDAL POWER PLANTS
 The 12 th International Conference of the Slovenian Society for Non-Destructive Testing»Application of Contemporary Non-Destructive Testing in Engineering«September 4-6, 2013, Portorož, Slovenia More info
NONDESTRUCTIVE EVALUATION OF CLOSED CRACKS USING AN ULTRASONIC TRANSIT TIMING METHOD J. Takatsubo 1, H. Tsuda 1, B. Wang 1
 NONDESTRUCTIVE EVALUATION OF CLOSED CRACKS USING AN ULTRASONIC TRANSIT TIMING METHOD J. Takatsubo 1, H. Tsuda 1, B. Wang 1 1 National Institute of Advanced Industrial Science and Technology, Tsukuba, Japan
DETECTION AND SIZING OF SHORT FATIGUE CRACKS EMANATING FROM RIVET HOLES O. Kwon 1 and J.C. Kim 1 1 Inha University, Inchon, Korea
 DETECTION AND SIZING OF SHORT FATIGUE CRACKS EMANATING FROM RIVET HOLES O. Kwon 1 and J.C. Kim 1 1 Inha University, Inchon, Korea Abstract: The initiation and growth of short fatigue cracks in a simulated
AIR FORCE INSTITUTE OF TECHNOLOGY
 DAMAGE DETECTION USING LAMB WAVES FOR STRUCTURAL HEALTH MONITORING THESIS Jeffrey Stevan Crider II, Captain, USAF AFIT/GA/ENY/7-M5 DEPARTMENT OF THE AIR FORCE AIR UNIVERSITY AIR FORCE INSTITUTE OF TECHNOLOGY
Keywords: Guided wave, structural health monitoring, HCSS, disbond, damage index. More Info at Open Access Database
 More Info at Open Access Database www.ndt.net/?id=15090 Detection of Disbond in a Honeycomb Composite Sandwich Structure Using Ultrasonic Guided Waves and Bonded PZT Sensors Shirsendu Sikdar 1, a, Sauvik
Rayleigh Wave Interaction and Mode Conversion in a Delamination
 Rayleigh Wave Interaction and Mode Conversion in a Delamination Sunil Kishore Chakrapani a, Vinay Dayal, a and Jamie Dunt b a Department of Aerospace Engineering & Center for NDE, Iowa State University,
Probability of Detection Assessment of a Guided Wave Structural Health Monitoring System
 Title: Probability of Detection Assessment of a Guided Wave Structural Health Monitoring System Authors: Gregory Jarmer Seth Kessler PAPER DEADLINE: **May 31, 2015** PAPER LENGTH: **8 PAGES MAXIMUM **
VD3-71 universal eddy current flaw detector application for field inspection of aeronautical engineering
 VD3-71 universal eddy current flaw detector application for field inspection of aeronautical engineering Introduction. The Document reviewed by http://engineermind.com/ By ahmed@engineermind.com The need
REFLECTION AND TRANSMISSION OF LAMB WAVES AT DISCONTINUITY IN PLATE Z. Liu NDT Systems & Services AG, Stutensee, Germany
 REFLECTION AND TRANSMISSION OF LAMB WAVES AT DISCONTINUITY IN PLATE Z. Liu NDT Systems & Services AG, Stutensee, Germany Abstract: Lamb waves can be used for testing thin plate and pipe because they provide
vibro-acoustic modulation
 17th World Conference on Nondestructive Testing, 25-28 Oct 28, Shanghai, ChinaContact defect detection in plates using guided wave and vibro-acoustic modulation Jingpin JIAO 1, Bruce W. DRINKWATER 2, Simon
INFLUENCE OF SENSOR STATISTICS ON PIEZOELECTRIC AND MAGNETO- ELASTIC DAMAGE DETECTION
 Proceedings of the ASME Conference on Smart Materials, Adaptive Structures and Intelligent Systems SMASIS September 9-,, Stone Mountain, Georgia, USA SMASIS- INFLUENCE OF SENSOR STATISTICS ON PIEZOELECTRIC
The Development of Laser Ultrasonic Visualization Equipment and its Application in Nondestructive Inspection
 17th World Conference on Nondestructive Testing, 25-28 Oct 2008, Shanghai, China The Development of Laser Ultrasonic Visualization Equipment and its Application in Nondestructive Inspection Bo WANG 1,
Non-Destructive Method Based on Rayleigh-Like Waves to Detect Corrosion Thinning on Non- Accessible Areas
 19 th World Conference on Non-Destructive Testing 2016 Non-Destructive Method Based on Rayleigh-Like Waves to Detect Corrosion Thinning on Non- Accessible Areas Laura TAUPIN 1, Frédéric JENSON 1*, Sylvain
Sensitivity analysis of guided wave characters for transducer array optimisation on pipeline inspections
 Sensitivity analysis of guided wave characters for transducer array optimisation on pipeline inspections Xudong Niu 1), Hugo R. Marques 2) and *Hua-Peng Chen 3) 1),3) Department of Engineering Science,
Reference wavelets used for deconvolution of ultrasonic time-of-flight diffraction (ToFD) signals
 signals") 17th World Conference on Nondestructive Testing, 25-28 Oct 2008, Shanghai, China Reference wavelets used for deconvolution of ultrasonic time-of-flight diffraction (ToFD) signals Farhang HONARVAR 1, Amin
17th World Conference on Nondestructive Testing, 25-28 Oct 2008, Shanghai, China Reference wavelets used for deconvolution of ultrasonic time-of-flight diffraction (ToFD) signals Farhang HONARVAR 1, Amin
Failure of Engineering Materials & Structures. Code 34. Bolted Joint s Relaxation Behavior: A FEA Study. Muhammad Abid and Saad Hussain
 Failure of Engineering Materials & Structures Code 3 UET TAXILA MECHNICAL ENGINEERING DEPARTMENT Bolted Joint s Relaxation Behavior: A FEA Study Muhammad Abid and Saad Hussain Faculty of Mechanical Engineering,
EWGAE 2010 Vienna, 8th to 10th September
 EWGAE 2010 Vienna, 8th to 10th September Frequencies and Amplitudes of AE Signals in a Plate as a Function of Source Rise Time M. A. HAMSTAD University of Denver, Department of Mechanical and Materials
Use of Lamb Waves High Modes in Weld Testing
 Use of Lamb Waves High Modes in Weld Testing Eduardo MORENO 1, Roberto OTERO 2, Bernaitz ARREGI 1, Nekane GALARZA 1 Benjamín RUBIO 1 1 Fundación Tecnalia R&I, Basque Country, Spain Phone: +34 671 767 083,
RECENT ADVANCEMENTS IN THE APPLICATION OF EMATS TO NDE
 RECENT ADVANCEMENTS IN THE APPLICATION OF EMATS TO NDE D. MacLauchlan, S. Clark, B. Cox, T. Doyle, B. Grimmett, J. Hancock, K. Hour, C. Rutherford BWXT Services, Non Destructive Evaluation and Inspection
1/2/2016. Lecture Slides. Screws, Fasteners, and the Design of Nonpermanent Joints. Reasons for Non-permanent Fasteners
 Lecture Slides Screws, Fasteners, and the Design of Nonpermanent Joints Reasons for Non-permanent Fasteners Field assembly Disassembly Maintenance Adjustment 1 Introduction There are two distinct uses
Experimental investigation of crack in aluminum cantilever beam using vibration monitoring technique
 International Journal of Computational Engineering Research Vol, 04 Issue, 4 Experimental investigation of crack in aluminum cantilever beam using vibration monitoring technique 1, Akhilesh Kumar, & 2,
Design of a Piezoelectric-based Structural Health Monitoring System for Damage Detection in Composite Materials
 Design of a Piezoelectric-based Structural Health Monitoring System for Damage Detection in Composite Materials Seth S. Kessler S. Mark Spearing Technology Laboratory for Advanced Composites Department
A Lamb Wave Based SHM of Repaired Composite Laminated Structures
 2nd International Symposium on NDT in Aerospace 2 - We.2.B. A Lamb Wave Based SHM of Repaired Composite Laminated Structures Constantinos SOUTIS* and Kalliopi DIAMANTI Aerospace Engineering, The University
Guided Wave Inspection of Supported Pipe Locations Using Electromagnetic Acoustic Transducers
 Guided Wave Inspection of Supported Pipe Locations Using Electromagnetic Acoustic Transducers by Nicholas Andruschak A thesis submitted in conformity with the requirements for the degree of Master of Applied
S. GURESH 4 JAN 2017 S. JOHNSON 4 JAN 2017
 PAGE 2 OF 15 1.0 PURPOSE This Inspection Method describes the methodology for Ultrasonic Examination using manual and semi-automatic techniques by the contact and immersion longitudinal wave method and
Experimental Investigation of Crack Detection in Cantilever Beam Using Natural Frequency as Basic Criterion
 INSTITUTE OF TECHNOLOGY, NIRMA UNIVERSITY, AHMEDABAD 382 481, 08-10 DECEMBER, 2011 1 Experimental Investigation of Crack Detection in Cantilever Beam Using Natural Frequency as Basic Criterion A. A.V.Deokar,
DEEP FLAW DETECTION WITH GIANT MAGNETORESISTIVE (GMR) BASED SELF-NULLING PROBE
 BASED SELF-NULLING PROBE") DEEP FLAW DETECTION WITH GIANT MAGNETORESISTIVE (GMR) BASED SELF-NULLING PROBE Buzz Wincheski and Min Namkung NASA Langley Research Center Hampton, VA 23681 INTRODUCTION The use of giant magnetoresistive
DEEP FLAW DETECTION WITH GIANT MAGNETORESISTIVE (GMR) BASED SELF-NULLING PROBE Buzz Wincheski and Min Namkung NASA Langley Research Center Hampton, VA 23681 INTRODUCTION The use of giant magnetoresistive
DEFECT SIZING IN PIPE USING AN ULTRASONIC GUIDED WAVE FOCUSING TECHNIQUE
 DEFECT SIZING IN PIPE USING AN ULTRASONIC GUIDED WAVE FOCUSING TECHNIQUE Jing Mu 1, Li Zhang 1, Joseph L. Rose 1 and Jack Spanner 1 Department of Engineering Science and Mechanics, The Pennsylvania State
Nondestructive Evaluation Tools to Improve the Inspection, Fabrication and Repair of Bridges
 Report # MATC-MU: 280 Final Report WBS: 25-1121-0003-280 Nondestructive Evaluation Tools to Improve the Inspection, Fabrication and Repair of Bridges Glenn Washer, Ph.D. Associate Professor Civil and Environmental
Adhesive Thickness Measurement on Composite Aerospace Structures using Guided Waves
 19 th World Conference on Non-Destructive Testing 2016 Adhesive Thickness Measurement on Composite Aerospace Structures using Guided Waves Laura TAUPIN 1, Bastien CHAPUIS 1, Mathieu DUCOUSSO 2, Frédéric
A Simulation Study of Attenuation Factors in a Gas Pipeline Guided Wave Testing
 Proceedings of the 4th Iranian International NDT Conference Feb 26-27, 2017, Olympic Hotel, Tehran, Iran IRNDT 2017 A Simulation Study of Attenuation Factors in a Gas Pipeline Guided Wave Testing M. J.
Response spectrum Time history Power Spectral Density, PSD
 A description is given of one way to implement an earthquake test where the test severities are specified by time histories. The test is done by using a biaxial computer aided servohydraulic test rig.
PVP PVP
 Proceedings Proceedings of the ASME of the 2 ASME Pressure 2 Vessels Pressure & Vessels Piping Division & Piping / K-PVP Division Conference PVP2 July July 7-22, 7-2, 2, Baltimore, Maryland, USA USA PVP2-738
Keywords: Ultrasonic Testing (UT), Air-coupled, Contact-free, Bond, Weld, Composites
, Air-coupled, Contact-free, Bond, Weld, Composites") Single-Sided Contact-Free Ultrasonic Testing A New Air-Coupled Inspection Technology for Weld and Bond Testing M. Kiel, R. Steinhausen, A. Bodi 1, and M. Lucas 1 Research Center for Ultrasonics - Forschungszentrum
Single-Sided Contact-Free Ultrasonic Testing A New Air-Coupled Inspection Technology for Weld and Bond Testing M. Kiel, R. Steinhausen, A. Bodi 1, and M. Lucas 1 Research Center for Ultrasonics - Forschungszentrum
Resonance Tube Lab 9
 HB 03-30-01 Resonance Tube Lab 9 1 Resonance Tube Lab 9 Equipment SWS, complete resonance tube (tube, piston assembly, speaker stand, piston stand, mike with adaptors, channel), voltage sensor, 1.5 m leads
RELIABILITY OF GUIDED WAVE ULTRASONIC TESTING. Dr. Mark EVANS and Dr. Thomas VOGT Guided Ultrasonics Ltd. Nottingham, UK
 RELIABILITY OF GUIDED WAVE ULTRASONIC TESTING Dr. Mark EVANS and Dr. Thomas VOGT Guided Ultrasonics Ltd. Nottingham, UK The Guided wave testing method (GW) is increasingly being used worldwide to test
FATIGUE CRACK CHARACTERIZATION IN CONDUCTING SHEETS BY NON
 FATIGUE CRACK CHARACTERIZATION IN CONDUCTING SHEETS BY NON CONTACT STIMULATION OF RESONANT MODES Buzz Wincheski, J.P. Fulton, and R. Todhunter Analytical Services and Materials 107 Research Drive Hampton,
1. Enumerate the most commonly used engineering materials and state some important properties and their engineering applications.
 Code No: R05310305 Set No. 1 III B.Tech I Semester Regular Examinations, November 2008 DESIGN OF MACHINE MEMBERS-I ( Common to Mechanical Engineering and Production Engineering) Time: 3 hours Max Marks:
Determination of the width of an axisymmetric deposit on a metallic pipe by means of Lamb type guided modes
 Acoustics 8 Paris Determination of the width of an axisymmetric deposit on a metallic pipe by means of Lamb type guided modes M. El Moussaoui a, F. Chati a, F. Leon a, A. Klauson b and G. Maze c a LOMC
Array Eddy Current for Fatigue Crack Detection of Aircraft Skin Structures
 Array Eddy Current for Fatigue Crack Detection of Aircraft Skin Structures Eric Pelletier, Marc Grenier, Ahmad Chahbaz and Tommy Bourgelas Olympus NDT Canada, NDT Technology Development, 505, boul. du
ASSESSMENT OF WALL-THINNING IN CARBON STEEL PIPE BY USING LASER-GENERATED GUIDED WAVE
 ASSESSMENT OF WALL-THINNING IN CARBON STEEL PIPE BY USING LASER-GENERATED GUIDED WAVE DOYOUN KIM, YOUNHO CHO * and JOONHYUN LEE Graduate School of Mechanical Engineering, Pusan National University Jangjeon-dong,
MODELLING AND EXPERIMENTS FOR THE DEVELOPMENT OF A GUIDED WAVE LIQUID LEVEL SENSOR
 Proceedings of the National Seminar & Exhibition on Non-Destructive Evaluation NDE 2011, December 8-10, 2011 MODELLING AND EXPERIMENTS FOR THE DEVELOPMENT OF A GUIDED WAVE LIQUID LEVEL SENSOR Subhash N.N
Maximizing the Fatigue Crack Response in Surface Eddy Current Inspections of Aircraft Structures
 Maximizing the Fatigue Crack Response in Surface Eddy Current Inspections of Aircraft Structures Catalin Mandache *1, Theodoros Theodoulidis 2 1 Structures, Materials and Manufacturing Laboratory, National
NOVEL ACOUSTIC EMISSION SOURCE LOCATION
 NOVEL ACOUSTIC EMISSION SOURCE LOCATION RHYS PULLIN, MATTHEW BAXTER, MARK EATON, KAREN HOLFORD and SAM EVANS Cardiff School of Engineering, The Parade, Newport Road, Cardiff, CF24 3AA, UK Abstract Source
Excitation and reception of pure shear horizontal waves by
 Excitation and reception of pure shear horizontal waves by using face-shear d 24 mode piezoelectric wafers Hongchen Miao 1,2, Qiang Huan 1, Faxin Li 1,2,a) 1 LTCS and Department of Mechanics and Engineering
EFFECT OF SURFACE COATINGS ON GENERATION OF LASER BASED ULTRASOUND
 EFFECT OF SURFACE COATINGS ON GENERATION OF LASER BASED ULTRASOUND V.V. Shah, K. Balasubramaniam and J.P. Singh+ Department of Aerospace Engineering and Mechanics +Diagnostic Instrumentation and Analysis
Ultrasonic Air-Coupled Non-Destructive Testing of Aerospace Components
 ECNDT 2006 - We.1.1.5 Ultrasonic Air-Coupled Non-Destructive Testing of Aerospace Components Rymantas KAZYS, Andrius DEMCENKO, Liudas MAZEIKA, Reimondas SLITERIS, Egidijus ZUKAUSKAS, Ultrasound Institute
ENHANCEMENT OF SYNTHETIC APERTURE FOCUSING TECHNIQUE (SAFT) BY ADVANCED SIGNAL PROCESSING
 BY ADVANCED SIGNAL PROCESSING") ENHANCEMENT OF SYNTHETIC APERTURE FOCUSING TECHNIQUE (SAFT) BY ADVANCED SIGNAL PROCESSING M. Jastrzebski, T. Dusatko, J. Fortin, F. Farzbod, A.N. Sinclair; University of Toronto, Toronto, Canada; M.D.C.
ENHANCEMENT OF SYNTHETIC APERTURE FOCUSING TECHNIQUE (SAFT) BY ADVANCED SIGNAL PROCESSING M. Jastrzebski, T. Dusatko, J. Fortin, F. Farzbod, A.N. Sinclair; University of Toronto, Toronto, Canada; M.D.C.
HEALTH MONITORING OF ROCK BOLTS USING ULTRASONIC GUIDED WAVES
 HEALTH MONITORING OF ROCK BOLTS USING ULTRASONIC GUIDED WAVES C. He 1, J. K. Van Velsor 2, C. M. Lee 2, and J. L. Rose 2 1 Beijing University of Technology, Beijing, 100022 2 The Pennsylvania State University,
Multi-Mode and Multi-Frequency Differential Lamb Wave Imaging with in situ Sparse Transducer Arrays
 ECNDT 26 - Tu.1.3.3 Multi-Mode and Multi-Frequency Differential Lamb Wave Imaging with in situ Sparse Transducer Arrays Jennifer E. MICHAELS and Thomas E. MICHAELS, School of Electrical and Computer Engineering,
EXPERIMENTAL ANALYSIS OF BOLT LOOSENING DYNAMICS CHARACTERISTIC IN A BEAM BY IMPACT TESTING
 EXPERIMENTAL ANALYSIS OF BOLT LOOSENING DYNAMICS CHARACTERISTIC IN A BEAM BY IMPACT TESTING Meifal Rusli, Candra Mardianto and Mulyadi Bur Department of Mechanical Engineering, Faculty of Engineering,
Resonance Tube. 1 Purpose. 2 Theory. 2.1 Air As A Spring. 2.2 Traveling Sound Waves in Air
 Resonance Tube Equipment Capstone, complete resonance tube (tube, piston assembly, speaker stand, piston stand, mike with adaptors, channel), voltage sensor, 1.5 m leads (2), (room) thermometer, flat rubber
Experimental Evaluation of Metal Composite Multi Bolt Radial Joint on Laminate Level, under uni Axial Tensile Loading
 RESEARCH ARTICLE OPEN ACCESS Experimental Evaluation of Metal Composite Multi Bolt Radial Joint on Laminate Level, under uni Axial Tensile Loading C Sharada Prabhakar *, P Rameshbabu** *Scientist, Advanced
Hybrid Passive/Active Impact Detection & Localization for Aerospace Structures Seth S. Kessler and Eric B. Flynn. Metis Design Corporation
 Hybrid Passive/Active Impact Detection & Localization for Aerospace Structures Seth S. Kessler and Eric B. Flynn Metis Design Corporation IWSHM-2013 ABSTRACT This paper presents finding from a recent set