Read and understand the safety and operational information in this manual.
|
|
|
- Valentine Gibson
- 5 years ago
- Views:
Transcription
1
2 Safety Summary The following safety precautions apply to both operating and maintenance personnel and must be followed during all phases of operation, service, and repair of this instrument. Before applying power to this instrument: Read and understand the safety and operational information in this manual. Apply all the listed safety precautions. Verify that the voltage selector at the line power cord input is set to the correct line voltage. Operating the instrument at an incorrect line voltage will void the warranty. Make all connections to the instrument before applying power. Do not operate the instrument in ways not specified by this manual or by B&K Precision. Failure to comply with these precautions or with warnings elsewhere in this manual violates the safety standards of design, manufacture, and intended use of the instrument. B&K Precision assumes no liability for a customer s failure to comply with these requirements. Category rating The IEC standard defines safety category ratings that specify the amount of electrical energy available and the voltage impulses that may occur on electrical conductors associated with these category ratings. The category rating is a Roman numeral of I, II, III, or IV. This rating is also accompanied by a maximum voltage of the circuit to be tested, which defines the voltage impulses expected and required insulation clearances. These categories are: Category I (CAT I): Category II (CAT II): Category III (CAT III): Category IV (CAT IV): Measurement instruments whose measurement inputs are not intended to be connected to the mains supply. The voltages in the environment are typically derived from a limited-energy transformer or a battery. Measurement instruments whose measurement inputs are meant to be connected to the mains supply at a standard wall outlet or similar sources. Example measurement environments are portable tools and household appliances. Measurement instruments whose measurement inputs are meant to be connected to the mains installation of a building. Examples are measurements inside a building s circuit breaker panel or the wiring of permanentlyinstalled motors. Measurement instruments whose measurement inputs are meant to be connected to the primary power entering a building or other outdoor wiring. Do not use this instrument in an electrical environment with a higher category rating than what is specified in this manual for this instrument. You must ensure that each accessory you use with this instrument has a category rating equal to or higher than the instrument s category rating to maintain the instrument s category rating. Failure to do so will lower the category rating of the measuring system. 1
3 Electrical Power This instrument is intended to be powered from a CATEGORY II mains power environment. The mains power should be 115 V RMS or 230 V RMS. Use only the power cord supplied with the instrument and ensure it is appropriate for your country of use. Ground the Instrument To minimize shock hazard, the instrument chassis and cabinet must be connected to an electrical safety ground. This instrument is grounded through the ground conductor of the supplied, three-conductor AC line power cable. The power cable must be plugged into an approved three-conductor electrical outlet. The power jack and mating plug of the power cable meet IEC safety standards. Do not alter or defeat the ground connection. Without the safety ground connection, all accessible conductive parts (including control knobs) may provide an electric shock. Failure to use a properly-grounded approved outlet and the recommended three-conductor AC line power cable may result in injury or death. Unless otherwise stated, a ground connection on the instrument s front or rear panel is for a reference of potential only and is not to be used as a safety ground. Do not operate in an explosive or flammable atmosphere. Do not operate the instrument in the presence of flammable gases or vapors, fumes, or finely-divided particulates. The instrument is designed to be used in office-type indoor environments. Do not operate the instrument In the presence of noxious, corrosive, or flammable fumes, gases, vapors, chemicals, or finely-divided particulates. In relative humidity conditions outside the instrument s specifications. In environments where there is a danger of any liquid being spilled on the instrument or where any liquid can condense on the instrument. In air temperatures exceeding the specified operating temperatures. In atmospheric pressures outside the specified altitude limits or where the surrounding gas is not air. In environments with restricted cooling air flow, even if the air temperatures are within specifications. In direct sunlight. This instrument is intended to be used in an indoor pollution degree 2 environment. The operating temperature range is 0 C to 40 C and 20% to 80% relative humidity, with no condensation allowed. Measurements made by this instrument may be outside specifications if the instrument is used in non-office-type environments. Such environments may include rapid temperature or humidity changes, sunlight, vibration and/or mechanical shocks, acoustic noise, electrical noise, strong electric fields, or strong magnetic fields. 2
4 Do not operate instrument if damaged If the instrument is damaged, appears to be damaged, or if any liquid, chemical, or other material gets on or inside the instrument, remove the instrument s power cord, remove the instrument from service, label it as not to be operated, and return the instrument to B&K Precision for repair. Notify B&K Precision of the nature of any contamination of the instrument. Clean the instrument only as instructed Do not clean the instrument, its switches, or its terminals with contact cleaners, abrasives, lubricants, solvents, acids/bases, or other such chemicals. Clean the instrument only with a clean dry lint-free cloth or as instructed in this manual. Not for critical applications This instrument is not authorized for use in contact with the human body or for use as a component in a life-support device or system. Do not touch live circuits Instrument covers must not be removed by operating personnel. Component replacement and internal adjustments must be made by qualified service-trained maintenance personnel who are aware of the hazards involved when the instrument s covers and shields are removed. Under certain conditions, even with the power cord removed, dangerous voltages may exist when the covers are removed. To avoid injuries, always disconnect the power cord from the instrument, disconnect all other connections (for example, test leads, computer interface cables, etc.), discharge all circuits, and verify there are no hazardous voltages present on any conductors by measurements with a properly-operating voltage-sensing device before touching any internal parts. Verify the voltage-sensing device is working properly before and after making the measurements by testing with known-operating voltage sources and test for both DC and AC voltages. Do not attempt any service or adjustment unless another person capable of rendering first aid and resuscitation is present. Do not insert any object into an instrument s ventilation openings or other openings. Hazardous voltages may be present in unexpected locations in circuitry being tested when a fault condition in the circuit exists. Fuse replacement must be done by qualified service-trained maintenance personnel who are aware of the instrument s fuse requirements and safe replacement procedures. Disconnect the instrument from the power line before replacing fuses. Replace fuses only with new fuses of the fuse types, voltage ratings, and current ratings specified in this manual or on the back of the instrument. Failure to do so may damage the instrument, lead to a safety hazard, or cause a fire. Failure to use the specified fuses will void the warranty. Servicing 3
5 Do not substitute parts that are not approved by B&K Precision or modify this instrument. Return the instrument to B&K Precision for service and repair to ensure that safety and performance features are maintained. For continued safe use of the instrument Do not place heavy objects on the instrument. Do not obstruct cooling air flow to the instrument. Do not place a hot soldering iron on the instrument. Do not pull the instrument with the power cord, connected probe, or connected test lead. Do not move the instrument when a probe is connected to a circuit being tested. Safety Symbols Symbol Name Description DANGER indicates a hazardous situation which, if not avoided, will result in death or serious injury. WARNING indicates a hazardous situation which, if not avoided, could result in death or serious injury CAUTION indicates a hazardous situation which, if not avoided, will result in minor or moderate injury Caution Refer to the text near the symbol. Electric Shock hazard Alternating current (AC) Chassis ground Earth ground On (Power) This is the In position of the power switch when instrument is ON. Off (Power) This is the Out position of the power switch when instrument is OFF. NOTICE is used to address practices not related to physical injury. 4
6 Contents 1 Product Overview Package Contents Dimensions Input Power Requirements Fuse Fuse Replacement Power-up Front Panel Rear Panel Built-in Help 11 2 Front Panel 13 3 Display 15 4 General Spectrum Analysis Frequency Center Frequency Start/Stop Frequency Freq Step Peak to CF CF to Step Span Span Amplitude Ref Level Attenuator RF Preamp Units Scale Scale Type Ref Offset Corrections Auto Tune 20 5 Settings Bandwidth Menu Resolution Bandwidth Video Bandwidth Video to Resolution Bandwidth Ratio Average Type Trace Trace Averaging Math Detect Sweep Sweep Time Sweep Rule Single/Continuous sweeping Trigger 26 5
7 5.5.1 Free Run Video External Limit Limit Switch Edit Test Setup TG TG TG Level TG Level Offset Normalize Demod Demod (AM/FM) Earphone Volume Demod Time 29 6 Measurement Setup Channel Power ACPR Occupied BW T-Power Meas Off ACPR OBW 31 7 Markers Spec Analyzer Mode Normal Marker Delta Markers Delta Pair Markers Off Reflection Measurement Marker Table Marker To Marker Functions Noise Marker N db BW Frequency Counter Read Out peak Search Config 38 8 System Settings Language Power On/Preset Interface Config System Info Data and Time Self Test display file Browser Open/Load 41 6
8 8.2.3 Type Save Create Folder Delete Operate preset couple help save LIMITED THREE-YEAR WARRANTY Service Information 47 7
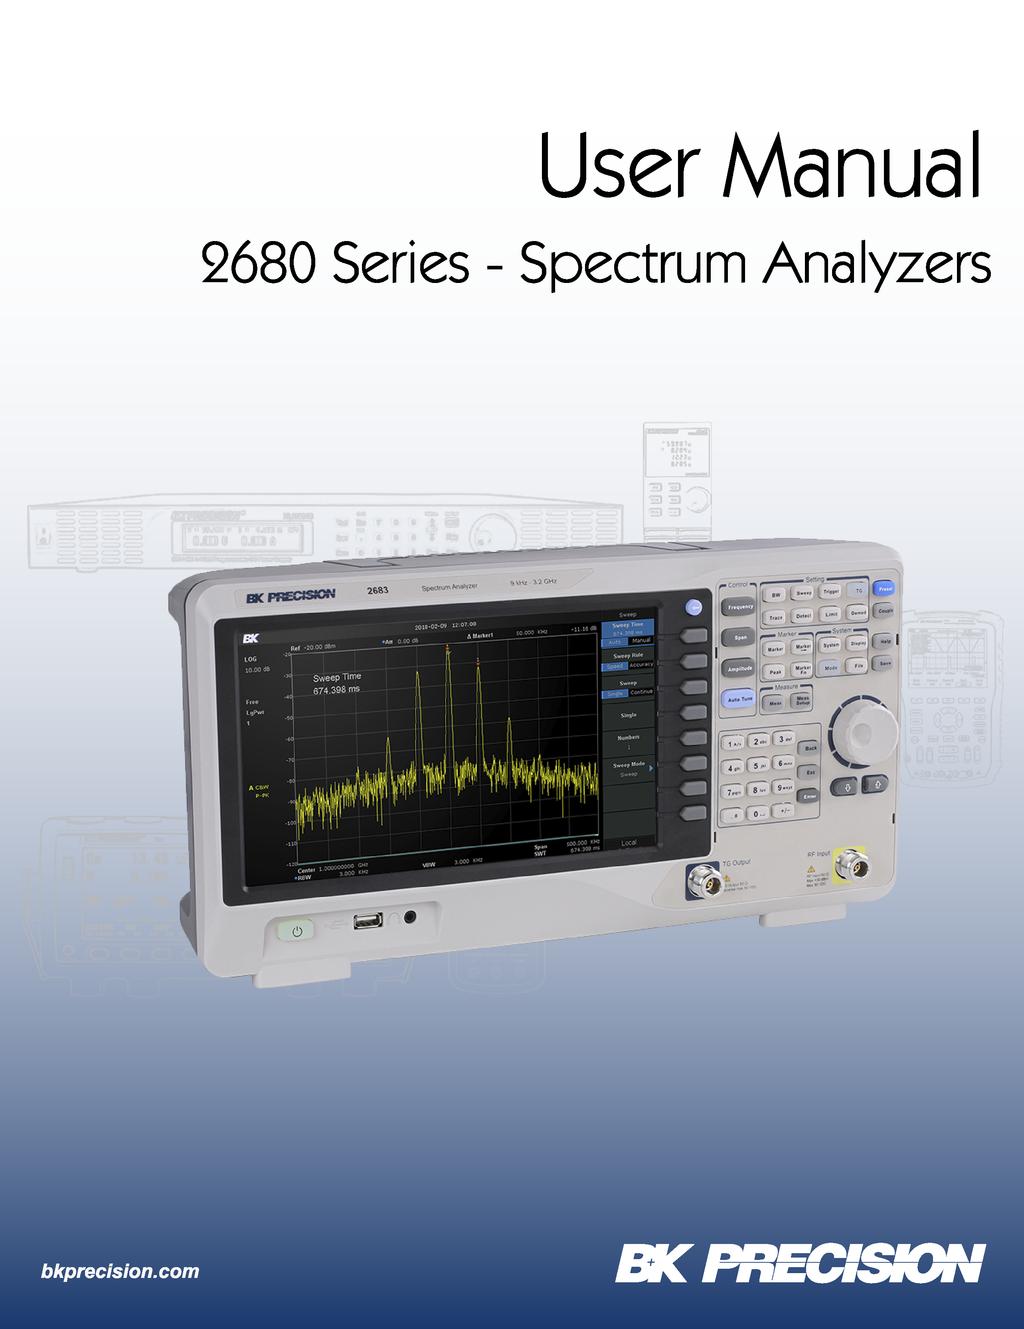
9 Product Overview The series spectrum analyzer has a frequency range from 9 khz up to 2.1 GHz (Model 2682) /3.2 GHz (Model 2683), numerous measurement functions are included. All-Digital IF Technology Frequency Range from 9 khz up to 3.2 GHz 10 Hz Minimum Resolution Bandwidth(RBW) Preamplifier Up to 3.2 GHz Tracking Generator Reflection Measurement Kit (Opt.) Advanced Measurements 10.1 inch display 1.1 Package Contents 1 x Model 2680 Spectrum Analyzer Power cord 1.2 Dimensions Figure 1.1 Front View 1.3 Input Power Requirements The instrument has a selectable AC input that accepts line voltage and frequency input within: 8

10 Figure 1.2 Top View Figure 1.3 Side View 1.4 Fuse An AC input fuse is necessary when powering the instrument. The fuse is located at the back of the instrument. If the fuse needs to be replaced, ensure the AC input power cord is disconnected from the instrument prior to replacement. Refer to Table 1.2 for fuse requirements. Before replacing fuse, disconnect the AC power cord first to prevent electric shock. Only use same rating of the fuse. Using a different fuse may damage the instrument Fuse Replacement Check and/or Change Fuse Locate the fuse box above the AC input in the rear panel. Remove the small insert. This piece holds the fuse. Check and replace fuse for the desired line voltage. 9
11 Frequency Voltage 47 to 60 Hz 100 to 220 V (±10%) 400 Hz 110 V (±10%) Table 1.1 Input Power Requirements Line Voltage Fuse 110 V T 2 AL, 250 V 220 V T 1 AL, 250 V Table 1.2 Fuses 1.5 Power-up 1. Verify AC Input Voltage Verify and check to make sure proper AC voltages are available to power the instrument. The AC voltage range must meet the acceptable specification as explained in Section Connect Power and turn on analyzer Connect AC power cord to the AC receptacle in the rear panel. The power button on the front panel should fade in and out. Press the power button to turn ON the instrument. The button should illuminate continuously and show the startup splash screen. 1.6 Front Panel Front Panel Items 1 User Graphical Interface 3 Function Keys 4 Knob 2 Menu Control Keys 5 Arrow Keys 6 RF Input 7 Numeric Keyboard 8 TG Output 9 Earphone interface 10 USB Host 11 Power Switch Figure 1.4 Front View 10
) 3. Ethernet 4. Reference in 10 MHz 5. Reference out 10 MHz 6. Trigger input 7.")
12 1.7 Rear Panel Item Description 1 Handle 2 USB Interface supporting:usb Interface supporting: USBTMC, USBCDC (virtual COM) 3 LAN Interface 4 REF IN 10 MHz 5 REF OUT 10 MHz 6 Trigger in 7 Kensington Lock 8 AC Power Input Figure 1.5 Rear Panel 1. Handle 2. USB Interface (supports USBTMC, and USBCDC (virtual COM)) 3. Ethernet 4. Reference in 10 MHz 5. Reference out 10 MHz 6. Trigger input 7. Security lock 8. AC power connector 1.8 Built-in Help The built-in help system provides information about every function key at the front panel and every menu soft key. How to acquire built-in help 11
13 Press the Help key and a prompt about how to obtain help information will appear. Then press another key and relevant help information will be shown if available. Close the current help information When the help information show at the center of the screen. Press the the help information again to close it. 12

14 Front Panel Figure 2.1 Function Keys 13
15 Function keys Description Frequency Frequency menu (start, stop, center) Span Frequency Span menu Amplitude Signal amplitude menu (ref level, attenuator, pre-amp, scale, corrections) Auto Tune Automatically setup the instrument BW Bandwidth menu (resolution, video BW, averaging, filter) Trace Trace setup menu and math menu Sweep Sweep menu (time, number of sweeps, mode) Detect Detector menu (peak, sample, average) Trigger Trigger menu (Video Trigger/ External Trigger) Limit Pass, Fail Limit setup menu TG Tracking Generator menu Demod Demodulation menu (AM, FM) Marker Marker setup menu Marker-> Apply marker to other analyzer functions (e.g. set center frequency to marker point) Peak Set the marker to the highest peak Marker Fn Marker function menu (enable, type, counter) Meas Measurement menu (power, BW, spectrum monitor, etc...) Meas Setup Configuration menu for an active measurements System System setup menu Mode Mode selection - spectrum or reflection Display Display setup (grid brightness, text, line presence) File File browser Preset Return to the default instrument state Couple Control RBW, VBW, Attenuator, Freq Step, and Sweep time Help Help menu Save Screenshot save key Table 2.1 Function Keys 14

16 Display Figure 3.1 LCD Display 15

17 General Spectrum Analysis Central to the use of the spetrum analyzer is the ability see a large swath of frequencies and zoom into areas of interest within the range of the analyzer. By using the frequency, span, and amplitude menus provides the fundamental means of moving around the sprectrum, and tuning to desired frequencies. In each menu, consistent with other menus, the values of each setting are adjusted by selecting them via the soft keys, and using the knob and keypad to make changes. Frequency Menu Span Amplitude Change the center, start, and stop frequencies. Define the frequency range of interest. Adjust the gain/attenuation of the system front end. The Pre-amplifier is configured in this menu. Many settings have a multiplier that needs to be applied to set the correct value. For example, setting the center frequency to 100 MHz can be done with the keypad by selecting Center Freq from the Frequency menu, entering 100 via the keypad and selecting the MHz soft-key on screen. 4.1 Frequency Set the frequency parameters and functions of the analyzer. Each setting change restarts the frequency sweep. The displayed frequency range depends on the Start Frequency, Center Frequency and Stop Frequency. Changing any of them causes the others to change accordingly. The value of each setting is modified 3 different ways: Rotary knob Numeric Keys Up/Down Keys Rotate to change the setting Enter the frequency value directly and select the multiplier (Hz, MHz, GHz) Keys below the knob increase or decrease the frequency setting in increments of the ``Freq Step setting. Figure 4.1 Frequency Menu Center Frequency In the Frequency menu, select the button beside the Center Frequency menu item to configure the center frequency. If the span setting does not hit the limits of the analyzer, the start and stop frequencies move along with the center frequency. That is, the span is not changed by changing the center frequency generally. 16
18 4.1.2 Start/Stop Frequency Set the start or stop frequency of the current channel. Changing the start or stop frequencies does not change the other, but does change the span and center frequencies Freq Step The frequency step setting defines the frequency jump applied when moving the center, start, and stop frequencies by the Up/Down keys below the knob. Use this setting to quickly move up and down the spectrum or to jump useful amounts Peak to CF Execute a peak search and make the peak s frequency the center frequency CF to Step Set the current center frequency to be the Freq Step value. This may be useful in stepping through the harmonics of a signal. 4.2 Span Set the span of the analyzer. The change of this parameter will affect the frequency parameters and restart the sweep. Figure 4.2 Span Menu Span The span setting defines the range of frequencies shown. It is another representation of the Stop Frequency subtracted from the Start Frequency. Changing the span value primarily changes the start and stop frequencies, but can also change the center frequency if required to make the settings consistent. As a reminder, the center frequency and other settings are shown at the bottom of the display. Note the following additional consequences of using the span setting: 17
19 In manual span mode. The span can be set down to 100Hz and up to the full span Modifying the span in non-zero span mode may cause an automatic change in both CF step and RBW if they are in Auto mode. Besides, the change of RBW may influence VBW (in Auto VBW mode). Variation in the span, RBW or VBW would cause a change in the sweep time. The remaining settings: Full Span Zero Span Zoom In Zoom Out Last Span X-Scale Set the span of the analyzer to the maximum. Analyze one frequency. Set the span of the analyzer to 0Hz. In this mode, the horizontal axis represents time. See Section?? for more information. Set the span to half of its current value. Set the span to twice the current value. Set the span to the previous span setting. Set the horizontal axis to be linear or logarythmic. 4.3 Amplitude Set the signal amplitude setting of the analyzer with this menu. See Figure 4.3. Figure 4.3 Amplitude Setting Menu Ref Level This setting is the upper signal limit of the display. The value is displayed at the upper left corner of the screen. The maximum reference level available is affected by the maximum mixing level, input attenuation is adjusted under a constant maximum mixing level in order to fulfill the following condition: LRef <= arf-apa-30dbm Attenuator This setting defines the input attenuator level. This can be set manually or automatically determined by the analyzer. 18
20 4.3.3 RF Preamp For small signals, the analyzer also includes an amplifier. For example, to clearly see radio stations far from the transmitters, it is necessary to enable the pre-amplifer. Used in concert with the reference level and attenuator, clearer signals can be found and measured Units Set the Y-axis scale units to dbm, dbmv, dbuv, dbua, Volts and Watts. The default setting is dbm Scale Set the logarithmic units per vertical grid division on the display. This function is only available when the scale type is set to ``log Scale Type Set the scale type of Y-axis to linear or logarhythmic. The default setting is the logarhythmic scale. In Lin mode, Scale value cannot be changed Ref Offset Assign an offset to the reference level to compensate for gains or losses generated between the device under measurement and the analyzer. Changing this value changes both the reference level readout and the amplitude readout of the marker, but does not impact the position of the curve on the screen Corrections Amplitude corrections are available in this sub-menu in order to compensate for the gain or loss from external devices such as Antennae and Cables. When amplitude correction is enabled, both the trace and related measurement results are corrected. Corrections for RF Input impedance and at specific points are configured here. Correction settings and points are also loaded and saved from this menu by pressing the Save/Load menu and working with the file browser. 4 correction tables may be loaded as well as a correction for signal impedance (50/75 Ohms). See Figures 4.4, 4.5, and 4.6 for the menus shown. If multiple correction factors are enabled, all related data will be used for amplitude correction. Figure 4.4 Corrections Setting Menu 19

21 Figure 4.5 Correction Point Menu Figure 4.6 Correction Add Point Menu 4.4 Auto Tune Search for signals automatically throughout the full frequency range, and adjust the frequency and amplitude for optimum display of one-key signal found in the search. While actively searching, Auto Tune is shown in the status bar on screen until the searching is finished. 20


22 Figure 4.7 Before Auto Tune Figure 4.8 After Auto Tune 21
23 Settings 5.1 Bandwidth Menu Settings for the Resolution Bandwidth, Video Bandwidth, and their ratio is set from this menu. Settings for the type of average and filter to use are also contained here. Access this menu by pressing the BW button on the instrument within the Setting area. See Figure 5.1. Figure 5.1 Bandwidth Menu Resolution Bandwidth Set the desired resolution bandwidth in order to distinguish between signals which are close in frequency. Reducing RBW will increase the frequency resolution, but will increase the sweep time Video Bandwidth Set the desired video bandwidth in order to filter out the noise outside the video band. Reducing the VBW will smooth the spectrum line to highlight small signals from noise, but will increase the sweep time Video to Resolution Bandwidth Ratio Set the ratio of Video and resolution bandwidth. Improved measurements can be had depending on the signal being measured: Sine signal Pulse signal Noise signal Use 1 to 3 (for faster sweeps) Use 10 (to reduce the influence on the amplitude of transient signals) Generally use 0.1 (to obtain the noise average) Average Type 3 types of averaging are available: log power (video), power (RMS), or voltage. When trace averaging is enabled, the average type is shown on the left side of the display. 22
 of the signal, instead of its log or envelope voltage.")
24 Log Power Power Average Voltage Average Logarithmic (decibel) scale for all filtering and averaging processes. This scale is helps find CW signals near noise. In this average type, all filtering and averaging processes work on the power (the square of the magnitude) of the signal, instead of its log or envelope voltage. This scale is best for measuring the true time power of complex signals. In this Average type, all filtering and averaging processes apply to the voltage of the envelope of the signal. This scale is good for observing rise and fall behavior of AM or pulse-modulated signals such as radar and cellular transmitters. 5.2 Trace Up to 4 different traces can be shown on screen at a time. Markers may be configured to make measurements relative to the traces as well. Figure 5.2 the Trace menu is shown as well as 3 on screen traces. The trace in lavender is an averaged max-hold, yellow is the average signal, and blue is the averaged minimum-hold trace. Labels for each trace are shown in the trace s color on the lower left side of the display. Figure 5.2 Trace Menu Spectrum Analyzer allows for up to four traces to be displayed at the same time. Each trace has its own color. All traces can be independently configured. By default, spectrum analyzer will choose Trace A and set the type to Clear Write. Clear Write Max Hold Min Hold View Blank Erases any data previously stored in the selected trace, and display the data sampled in real-time of each point on the trace. Retains the maximum level for each trace point of the selected trace. Updates the data if a new maximum level is detected in successive sweeps. Display the minimum from multiple sweeps for each point of the trace and update the data if a new minimum is generated in successive sweeps. Holds and displays the amplitude data of the selected trace. The trace data is not updated as the analyzer sweeps. Disable the trace display and all related measurements. 23


25 Figure 5.3 Trace Type Trace Averaging Trace signal averaging is set by the Avg Times setting in the Trace menu. Set the number of averages of the selected trace. A larger number of averages can reduce the noise and the influence of other random signals; thus highlighting the stable signal characteristics Math Additionally, a set of math functions can be applied to the measured signals. This can be useful for finding small signals near the noise floor. For example, using the difference between Max and Min hold traces and adding an offset to move the trace into the screen. To do so, open the Trace menu and select the Math function. The math configuration menu will be shown as in Figure 5.4. Figure 5.4 Trace Math Menu Variable X, Y Select A, B, or C as the math source data 24
 yield approximately -21.2 dbm. The sum of 2 signals.")
26 Output Z Power: X-Y+Offset Power: X+Y+Offset Log: X+Offset Log: X-Y+Ref The trace to use as the math output The difference in between the 2 selected signals. This compares the absolute power difference. For example, 2 signals of -20 and -26 dbm (A and B respectively) yield approximately dbm. The sum of 2 signals. This combines the absolute power levels. Take a signal and offset it a value in db. The ref is the offset of the signal from 0 db. Take the relative difference between 2 signals. Ex. A is -20 db and B is -26 db, the value of this will be 6dB. Use the ref value to move the signal. 5.3 Detect The analyzer displays the sweep signal on the screen in the form of trace. For each trace point, the analyzer always captures all the data within a specific time interval and processes (Peak, Average, etc.). The captured data uses the detector currently selected and then displays the processed data on the screen. Selecting an appropriate detector type according to the actual application ensures the best measurement accuracy. The available detector types are: Positive Peak Negative Peak Sample Normal Average Displays the maximum value of data sampled within the corresponding time interval. Displays the minimum value of data sampled within the corresponding time interval. Displays the transient level corresponding to the central time point of the corresponding time interval. This detector type is applicable to noise or noise-like signals. (also called a Rosenfell or Min/Max detector) Displays the maximum value and the minimum value of the sample data segment in turn. For an odd-numbered data point, the maximum value is displayed, and for an even-numbered point, the minimum value. This helps to show the amplitude variation range of the signal. Displays the average value of data sampled within the corresponding time interval. 5.4 Sweep As signals are discriminated across the spectrum, the analyzers performs a frequency sweep. As signals are measured, they are displayed on screen. For a fast sweep time, this happens quickly. For a long sweep, a progress indicator is shown at the bottom of the screen. The corresponding waveform is updated accordingly. See Figure 5.5. Figure 5.5 Sweep Menu 25
27 5.4.1 Sweep Time Set the time needed for the spectrum analyzer to finish a sweep. The sweep time can be set automatically or manually. In zero span mode, the sweep time corresponds to the time shown on screen. Also note that while decreasing the sweep time speeds up measurement, it also can cause error if the specified sweep time is less than the minimum sweep time in Auto coupling. Aat this point, UNCAL is shown in the status bar of the screen Sweep Rule The analyzer provides two sweep goals that help determine automatic sweep time: Speed Accuracy Activates the default fast sweep time rule. Activates the normal sweep time rule to ensure the measurement accuracy. Speed sweep time rule provides a fast measurement function that decreases the sweep time. Using Fast Sweep will decrease the measurement accuracy Single/Continuous sweeping By default, the analyzer is set to continuously start a new sweep after the current one is complete. For some cases it may be helpful to stop the instrument after a single or set of sweeps. For continuous sweeping, set the Sweep setting to Continuous. To run a prescribed number of sweeps, set the Sweep setting to single and set the number of sweeps to run in the Numbers field. In Single mode, press the Single soft-key to start sweeping. All sweeping is started when enabled and the conditions defined by the Trigger settings are met Sweep mode includes auto, sweep and FFT. Auto Mode - When the sweep mode is auto-coupled, the analyzer selects the sweep mode automatically between Sweep and FFT Mode. Sweep Mode - Work in point-by-point scanning, slow and time-consuming, fits when RBW is more than 10k Hz. FFT Mode - Work in Parallel scans, fast and short time. This FFT mode is only available when RBW is set to 1 khz, 3 khz, or 10 khz. 5.5 Trigger The trigger type can be Free Run, Video or External Free Run The trigger conditions are satisfied at any time and the analyzer generates trigger signals continuously Video A trigger signal will be generated when the system detects a video signal of which the voltage exceeds the specified video trigger level. Note: This function is invalid in Avg detection in zero span mode. Trigger level - Set the trigger level in video trigger. At this point, the trigger level line (TL) and value are displayed on the screen. You can use the numeric keys, knob or direction keys to modify this parameter. Please refer to Parameter Setting for more details. 26
28 5.5.3 External In this mode, an external signal (TTL signal) is input from the TRIGGER IN connector at the rear panel and trigger signals are generated when this signal fulfills the specified trigger edge condition. Set the trigger edge in external trigger to the rising (Pos) or falling (Neg) edge of the pulse. Note: When Free Run is selected, Trig Setup is grayed out and disabled. 5.6 Limit Spectrum Analyzer supports the Pass/Fail test function. In this function, the measured curve is compared with the pre-edited curve. If the related rules are met, the result is Pass ; or else is Fail Limit Switch Select the desired limit line (upper or lower) for editing. Each limit line has its own switch. You can test according to both together, either one or neither Edit Edit the properties of the limit lines. Table 2-18 Pass/Fail Menu. Explanation Upper/Lower Select the desired limit line (upper or lower) for editing Mode Add point X-axis Amplitude Del Point Del All Save/Recall Select the line or point for editing. Set the number of the point to be edited if you selected the point type. The range is from 1 to 100 Add a new point for editing. Edit the X-axis value (frequency or time) of the current point. If the X-axis unit is frequency and the Ref Freq is enabled, edit the frequency difference between the frequency of the current point and the center frequency. Edit the amplitude of the current point or line. If the Ref AMPT is enabled, edit the amplitude difference between the amplitude of the current point and the reference level. Delete the point you are editing. Delete all point. Save or load the limit file. Table 5.1 Pass/Fail Menu Test Enable or disable the limit test function Setup Fail to stop Select whether the instrument will continue or stop operation when a failure occurs. Buzzer Turn on or off the buzzer. When the buzzer is on, it beeps when a failure occurs. X Axis Set the X-axis unit to frequency or time unit. Note that all the points of the current limit line will be deleted when the X-axis unit changes. 27
29 5.7 TG Set the parameter related to the tracking generator (TG) TG TG is used to enable or disable the TG. When the TG is enabled, a signal with the same frequency of the current sweep signal will be output from the [GEN OUTPUT 50 Ω] connector at the front panel. The power of the signal could be set through the menu TG Level Set the output power of the signal of the tracking generator. You can use the numeric keys, knob or direction keys to modify this parameter. For more details, please refer to Parameter Setting TG Level Offset Assign a certain offset to the output power of the TG when gains or losses occur between the TG output and external device in order to display the actual power value. Key Points: This parameter only changes the readout of the TG output power, rather than the actual value of it. The offset could be either a positive (gain in the external output) or a negative (loss in the external output). You can use the numeric keys, knob or direction keys to modify this parameter. For more details, please refer to Parameter Setting Normalize Normalization can eliminate the error of TG Level. Before using this function, connect the [GEN OUTPUT 50 Ω] output terminal of the TG with the [RF INPUT 50 Ω] input terminal of the analyzer. Normalize - Enable or disable the normalization. When enabled, the reference trace will be stored automatically after the current sweep finishes if no reference trace is stored before. During the reference trace storage, the corresponding prompt message is displayed. When normalization is enabled, the corresponding value of the reference trace will be subtracted from the trace data after every sweep. Norm Ref Lvl - Adjust the vertical position of the trace on the screen by adjusting the reference level when normalization is enabled. Being different from the Ref Level function in the AMPT menu, this parameter has no influence on the reference level of the analyzer. You can use the numeric keys, knob or direction keys to modify this parameter. For more details, please refer to Parameter Setting. Norm Ref Pos - Adjust the vertical position of the normalization reference level on the screen by adjusting the reference position when normalization is enabled. The function of this menu is similar to that of Norm Ref Lvl. When it is set to 0%, the normalization reference level is displayed at the bottom of the screen grid and at the top when it is set to 100%. You can use the numeric keys, knob or direction keys to modify this parameter. For more details, please refer to Parameter Setting. Ref Trace - Set whether to display the reference trace or not. If View is selected, the reference trace saved (Trace D) will be shown in FreezeView type. 28
30 Note: When normalization is enabled, the unit of Y-axis is db and will not be influenced by the definition in AMPT->Units. At this point, (db) is displayed under the Y-axis scale in the user interface. 5.8 Demod Press Demod at the front panel to enter the demodulation setting menu. Both AM and FM demodulations are available in this device Demod (AM/FM) Set the demodulation type to AM or FM; or disable the demodulation function. The default is off. Key Points: The system will enable a marker automatically, place it at the center frequency and perform AM (or FM) demodulation on this frequency point after you enable AM (or FM) demodulation. Analyzer provides earphone jack and the demodulated signal can be output in audio frequency (AF) mode through the earphone. The frequency and intensity of AF denotes the frequency and amplitude of the signal respectively Earphone Set the status of the earphone. When it is on, the demodulated signal can be heard through the earphone during the demodulation. By default, it is off Volume Set the volume of the earphones Demod Time Set the time for the analyzer to complete a signal demodulation after each sweep. If Earphone is set to On, you will hear the demodulated signal through the earphone during the demodulation. You can use the numeric keys, knob or direction keys to modify this parameter. For more details, please refer to Parameter Setting. 29
31 Measurement Setup Provide measurement function, the screen will be divided into two parts, the above part is measure screen, displaying trace, the other part is used to display result of a measurement. 6.1 Channel Power Measure the power and power density within the specified channel bandwidth. When this function is enabled, the span and resolution bandwidth are automatically adjusted to smaller values. Select Channel Power and press Meas Setup to set the corresponding parameters. 6.2 ACPR Measure the powers of the main channel and adjacent channels as well as the power difference between the main channel and each of the adjacent channels. When this function is enabled, the span and resolution bandwidth of the analyzer are adjusted to smaller values automatically. Select ACPR and press Meas Setup to set the corresponding parameters. 6.3 Occupied BW Integrate the power within the whole span and calculate the bandwidth occupied by this power according to the specified power ratio. The OBW function also indicates the difference (namely Transmit Freq Error ) between the center frequency of the channel under measurement and the center frequency of the analyzer. Select Occupied BW and press Meas Setup to set the corresponding parameters. 6.4 T-Power The system enters zero span mode and calculates the power within the time domain. The types of powers available include Peak, Average and RMS. Select T-Power and press Meas Setup to set the corresponding parameters. 6.5 Meas Off Turn off all the Meas function. 1. meas-setup 2. Channel Power Measurement Results: channel power and power spectral density. Channel Power: power within the integration bandwidth. Power Spectral Density: power (in dbm/hz) normalized to 1 Hz within the integration bandwidth. Measurement Parameters: Center Freq, integration bandwidth, Span, Span power 1 Center Freq Sets the center frequency of display this CF which is the same with the CF of the analyzer. Modifying this parameter will change the CF of the analyzer. Integration bandwidth 30
32 Set the frequency width of the channel to be tested and the power of the channel is the power integral within this bandwidth. You can use the numeric keys, knob or direction keys to modify this parameter. Span Set the frequency range of the channel. This span which is the same with the span of the analyzer is the frequency range of the sweep. Modifying this parameter will change the span of the analyzer. The channel power span is related to the integration bandwidth and the range available is from integration bandwidth to integration bandwidth 20. You can use the numeric keys, knob or direction keys to modify this parameter. 4Span Power Set the integrated bandwidth to the sweep span of display. The channel power and power spectral density display on the screen simultaneously. 6.6 ACPR Adjacent Channel Power Measurement: Main CH Power, Left channel power and Right channel power. Main CH Power: display the power within the bandwidth of the main power Left channel power : display the power of left channel and the power difference between the left channel and the main channel (in dbc) Right channel power: display the power of the right channel and the power difference between the right channel and the main channelin dbc Measurement parameter: center frequency, main channel bandwidth, adjacent channel bandwidth and channel spacing 1 Center Frequency Sets the center frequency of display this CF which is the same with the CF of the analyzer. Modifying this parameter will change the CF of the analyzer. Main channel bandwidth Set the bandwidth of the main channel and the power of the main channel is the power integral within this bandwidth. You can use the numeric keys, knob and direction keys to modify this parameter. Adjacent channel bandwidth Set the frequency width of the adjacent channels. The adjacent channel bandwidth is related to the main channel bandwidth and the range available is from main channel bandwidth/20 to main channel bandwidth 20. You can use the numeric keys, knob or direction keys to modify this parameter. Adjacent Channel space Set the difference between the center frequency of the main channel and the center frequency of the adjacent channels. Adjusting this parameter will also adjust the distance between the upper/lower channel and the main channel. You can use the numeric keys, knob or direction keys to modify this parameter OBW OBW measurement: occupied bandwidth and transmit frequency error. Occupied Bandwidth: integrate the power within the whole span and then calculate the bandwidth occupied by the power according to the specified power ratio. 31
33 Transmit Frequency Error: difference between the center frequency of the channel and the center frequency of the analyzer. 1. T-Power T-Power: namely the power of the signal from the start line to the stop line. Measurement Parameter: center frequency, start line, stop line Center Frequency Sets the center frequency of display, this CF which is the same with the CF of the analyzer. Modifying this parameter will change the CF of the analyzer. Start line Set the left margin (in time unit) of T-Power measurement. The data calculated under this measurement is between the start line and stop line. You can use the numeric keys, knob or direction keys to modify this parameter. Stop line Set the right margin (in time unit) of T-Power measurement. The data calculated under this measurement is between the start line and stop line. You can use the numeric keys, knob or direction keys to modify this parameter. 32
34 Markers Four main markers are available for making measurements of signal level, signal period, bandwidth, peaks, relative values, noise level, and others. Marker measurements apply to all traces captured on screen. For example, set Trace B to Max- Hold and make relative measurements to a trace set to Clear Write (live data). To configure these setting use the 4 buttons within the blue square labeled Marker. Each marker is shown in orange, often with the marker number above it. See Figure 7.1. The type and availabilty of markers depends on what spectrum analyzer mode is used, and the menus change accordingly. Figure 7.1 Markers 7.1 Spec Analyzer Mode Figure 7.2 Marker Menu When markers are active, the data is displayed at the top of the screen. Also, by activating the Marker Table, data for each marker is shown on screen. See Figure
35 Figure 7.3 Marker Table Normal Marker Mark an X position representing frequency or time, and the corresponding signal amplitude at that point In the Marker Table, the value shows the marker values Delta Markers Mark and measure the difference between 2 points In the Marker Table, 2 points are shown. The [1-4]r entry is the reference point and the data shown is the measurement value at that point. ΔMarker[1-4] is the offset point and the values are the change from [1-4]r. The reference marker is placed at the center frequency on screen at the time of acivation. If another location is desired, activate a normal marker, set the desired point, then change the marker type to delta. When the Noise Marker function under the Marker Fn menu is activated, the result of the noise measurement is automatically corrected for and normalized to 1 Hz Delta Pair Markers This setting creates a pair of markers and measures relative values between them, one is denoted the reference [1-4]r and the other is realtive to the reference labeled [1-4]. Marker movement is defined in 4 different ways: Delta Ref Span Center The relative marker [1-4] moves The reference marker [1-4]r moves Both markers move toward and away from eachother equally Both markers move together and maintain their relative spacing horizontally Off This marker mode disables the selected marker. 34
 is shown for each marker.")
36 7.2 Reflection Measurement Markers available for reflection measurements are much like Normal markers in spectrum analyzer mode. Marker measurements are shown in a table like Table??. The return loss, reflection coefficient, and Voltage Standing Wave Ratio (VSWR) is shown for each marker. The frequency (shown in Hz or period (1/f)) of the marker or the time from the sweep start is also shown. This is the X-Axis value shown in the table. Figure 7.4 Reflection Measurement Marker Table 7.3 Marker Table Display all the markers enabled on the lower portion of the screen, including marker number, trace number, marker readout type, X-axis readout and amplitude. Through this table you can view the measurement values of multiple points. The table allows for up to eight markers to be displayed at one time. Figure 7.5 Marker Table 7.4 Marker To Markers may be used to center, and change the sweep frequencies. Effective use of this function can help to quickly focus in on desired signals. Access this menu by pressing the Marker. 35

37 If a Normal marker is selected, the center frequency will be set to the frequency of the current marker. If a Delta, or Delta Pair marker is selected, the setting is set to the frequency of the Delta Marker. Most of the functions do not apply to Zero Span mode. The functions available here are shown in Figure?? and described below: M CF M CF Step M Start Freq M Stop Freq M Ref Level ΔM Span ΔM CF Set the center frequency of the analyzer to the frequency of the current marker Set the center frequency step of the analyzer to the frequency of the current marker. Set the start frequency of the analyzer to the frequency of the current marker. Set the stop frequency of the analyzer to the frequency of the current marker. Set the reference level of the analyzer to the amplitude of the current marker. This action also works in Zero Span mode. Set the span of the analyzer to the frequency difference between the two markers in Delta, or Delta Pair. This function is not available for Normal markers. Set the center frequency of the analyzer to the frequency difference between two Delta, or Delta Pair markers 7.5 Marker Functions In addition to showing frequency and level, markers may be configured to display more information. This information can be the noise at a point, noise bandwidth, and a frequency counter representaton of the point. To access the Marker Function menu, press the Marker Fn button. Settings for each of the 4 available markers is opened on screen. See Figure 7.6. Special marker functions include Noise Marker, N db BW and Freq Counter. Setting the marker function to off disables the functions listed in this section and does not disable the marker itself. Figure 7.6 Marker Function Menu Noise Marker The Noise marker function displays the noise power spectral density measured in dbm/hz. Activating the Noise Marker will first set its to Normal type automatically. The noise measurement is the average noise level at the marked point 36

38 normalized to 1 Hz bandwidth. The measured value is effected by the detection and trace types used. More precise measurement is made if RMS Avg or Sample detection is used. This function can be used for measuring the C/N ratio N db BW N db BW represents the frequency difference between two points that are located on either side of the current marker that fall within the db fall (N<0) or rise (N>0) in amplitude as shown in Figure 7.7. When the measurement starts, the analyzer will search for the two points which are located at both sides of the current point with N db fall or rise in amplitude and display the frequency difference between the two points in the active function area. " -" would be displayed if the search fails. Figure 7.7 N db BW Frequency Counter The marker function can lastly be set to read the frequency at the marker s location. Use this when the marker is set to jump to a peak and read the peak frequency. The frequency counter function is only applicable to marker Read Out The marker x-axis position is represented in 3 ways: frequency, period, and ΔT. This setting changes the readout but does not change the actual measured value. The frequency and period represent the conventional idea, but ΔT shows the time difference between the marker and the start of the sweep. The Delta marker and Delta Pair marker show the sweep time difference between the delta marker and reference marker. 7.6 peak The remaining button in the Marker section is the peak detector. Peak detection points may be used to set the center frequency, and easily list the 16 highest peaks shown on screen. By setting the Search settings, positive or negative peaks with a prescribed level may be found automatically. Negative peaks may be especially useful when using the tracking generator. Figure 7.8 shows the Peak menu screen and a scan of radio stations in Los Angeles. Peak CF Next Peak Set the first Search for and mark the peak whose amplitude is closest to that of the current peak that meets the peak search conditions. 37

39 Figure 7.8 Peak detector menu Left Peak Right Peak Peak Peak Count Peak Peak Table Move to the next peak to the left of the current peak. Move to the next peak to the left of the current peak. Search for the higest/lowest peak and the minimum measured trace value and mark them with relative value markers. The signal level difference is shown in the upper right corner of the screen. Enable continuous peak searching. When enabled, the system will always execute a peak search automatically after each sweep. Show the table of up to 16 peaks that meet the search condition settings Search Config Define the conditions of peak search for various peak searches. A real peak should meet the requirements of both the Peak Excursion and Peak Threshold settings. See Figure 7.9, only the 4 peaks that meet the search conditions are marked and listed in the Peak Table below the spectrum plot. Figure 7.9 Peak search menu 38
SVA1000X Series Spectrum Analyzer
 SVA1000X Series Spectrum Analyzer User Manual UM0701X-E01A SVA1000X User Manual I Guaranty and Declaration Copyright SIGLENT TECHNOLOGIES CO., LTD All Rights Reserved. Trademark Information SIGLENT is
Spectrum Analyzers 2680 Series Features & benefits
 Data Sheet Features & benefits n Frequency range: 9 khz to 2.1 or 3.2 GHz n High Sensitivity -161 dbm/hz displayed average noise level (DANL) n Low phase noise of -98 dbc/hz @ 10 khz offset n Low level
DSA-815 Demo Guide. Solution: The DSA 800 series of spectrum analyzers are packed with features.
 FAQ Instrument Solution FAQ Solution Title DSA-815 Demo Guide Date:08.29.2012 Solution: The DSA 800 series of spectrum analyzers are packed with features. Spectrum analyzers are similar to oscilloscopes..
RIGOL. User s Guide. DSA1000 Series Spectrum Analyzer. Jan RIGOL Technologies, Inc.
 User s Guide DSA1000 Series Spectrum Analyzer Jan. 2010 RIGOL Technologies, Inc. Copyright 2010 RIGOL Technologies, Inc. All Rights Reserved. Trademark Information RIGOL is registered trademark of RIGOL
SSA3000X Spectrum Analyzer
 SSA3000X Spectrum Analyzer User Manual UM0703X-E03A Guaranty and Declaration Copyright SIGLENT TECHNOLOGIES CO., LTD All Rights Reserved. Trademark Information SIGLENT is the registered trademark of SIGLENT
Signal Generators for Anritsu RF and Microwave Handheld Instruments
 Measurement Guide Signal Generators for Anritsu RF and Microwave Handheld Instruments BTS Master Spectrum Master Tracking Generator Option 20 Vector signal Generator Option 23 Anritsu Company 490 Jarvis
RIGOL. User s Guide. DSA1000A Series Spectrum Analyzer. Jul RIGOL Technologies, Inc.
 User s Guide DSA1000A Series Spectrum Analyzer Jul. 2013 RIGOL Technologies, Inc. Guaranty and Declaration Copyright 2010 RIGOL Technologies, Inc. All Rights Reserved. Trademark Information RIGOL is a
SSA3000X Series Spectrum Analyzer. Quick Guide
 SSA3000X Series Spectrum Analyzer Quick Guide Copyright Information SIGLENT TECHNOLOGIES CO., LTD. All Rights Reserved. Information in this publication replaces all previously corresponding material. SIGLENT
RIGOL. User s Guide. DSA1000A Series Spectrum Analyzer. July RIGOL Technologies, Inc.
 User s Guide DSA1000A Series Spectrum Analyzer July 2011 RIGOL Technologies, Inc. Guaranty and Declaration Copyright 2010 RIGOL Technologies, Inc. All Rights Reserved. Trademark Information RIGOL is a
RIGOL. User s Guide. DSA1000 Series Spectrum Analyzer. May RIGOL Technologies, Inc.
 User s Guide DSA1000 Series Spectrum Analyzer May 2012 RIGOL Technologies, Inc. Guaranty and Declaration Copyright 2010 RIGOL Technologies, Inc. All Rights Reserved. Trademark Information RIGOL is a registered
Model: PR-55. High Voltage Oscilloscope Probe 10 kv, 40 MHz USER MANUAL
 Model: PR-55 High Voltage Oscilloscope Probe 10 kv, 40 MHz USER MANUAL 1 2017 All rights reserved. B&K Precision products are covered by US and foreign patents, issued and pending. Information is this
Model S1365 Spectrum Analyzer. User Manual
 Model S1365 Spectrum Analyzer User Manual November 2018 Edition, Version 1.1.0 Copyright Corporation. All rights reserved. The products are under the protection of the patent rights, including ones which
Power Meter. Measurement Guide. for Anritsu RF and Microwave Handheld Instruments BTS Master Site Master Spectrum Master Cell Master
 Measurement Guide Power Meter for Anritsu RF and Microwave Handheld Instruments BTS Master Site Master Spectrum Master Cell Master Power Meter Option 29 High Accuracy Power Meter Option 19 Inline Peak
XSA1000 Series Spectrum Analyzer User Manual
 XSA1000 Series Spectrum Analyzer User Manual XSA1015 XSA1015-TG XSA1036 XSA1036-TG Notice: -TG models are with tacking generator www.owon.com.cn June 2017 edition V1.0.0 Copyright LILLIPUT Company. All
RIGOL. User s Guide. DSA800 Series Spectrum Analyzer. Dec RIGOL Technologies, Inc.
 User s Guide DSA800 Series Spectrum Analyzer Dec. 2011 RIGOL Technologies, Inc. Guaranty and Declaration Copyright 2011 RIGOL Technologies, Inc. All Rights Reserved. Trademark Information RIGOL is a registered
MS8268 HANDHELD DIGITAL MULTIMETER OPERATOR S INSTRUCTION MANUAL
 MS8268 HANDHELD DIGITAL MULTIMETER OPERATOR S INSTRUCTION MANUAL Table of Contents TITLE PAGE 1. GENERAL INSTRUCTIONS 1 1.1 Precaution safety measures 1 1.1.1 Preliminary 1 1.1.2 During use 2 1.1.3 Symbols
Signal Analysis Measurement Guide
 Signal Analysis Measurement Guide Agilent Technologies EMC Series Analyzers This guide documents firmware revision A.08.xx This manual provides documentation for the following instruments: E7401A (9 khz-
CIRCUIT-TEST ELECTRONICS
 USER'S MANUAL Sweep Function Generator with Counter SWF-8030 CIRCUIT-TEST ELECTRONICS www.circuittest.com TABLE OF CONTENTS SAFETY INFORMATION...page 3 INTRODUCTION... 4 SPECIFICATIONS... 5 FRONT PANEL
Model 4007DDS. 7 MHz Sweep Function Generator
 Model 4007DDS 7 MHz Sweep Function Generator 1 Model 4007DDS - Instruction Manual Limited Two-Year Warranty B&K Precision warrants to the original purchaser that its products and the component parts thereof,
3GPP2 Signal Analyzer
 Measurement Guide 3GPP2 Signal Analyzer for Anritsu RF and Microwave Handheld Instruments BTS Master, Cell Master, Spectrum Master RF Demod OTA CDMA Option 42 Option 43 Option 33 EV-DO Option 62 Option
DSA700 Series Spectrum Analyzer
 DSA700 Series Spectrum Analyzer Product Features: All-Digital IF Technology Frequency Range from 100 khz up to 1 GHz Min. -155 dbm Displayed Average Noise Level (Typ.) Min.
COM-POWER OPERATION MANUAL ACS W
 COM-POWER OPERATION MANUAL For the ACS-250-100W 150 khz to 250 MHz 100W Power Amplifier Page 1 of 15 MANUAL_ACS-250-100W Rev. M02.15 Table of Contents Important Safety Precautions.....3 Introduction..5
Keysight Technologies N9320B RF Spectrum Analyzer
 Keysight Technologies N9320B RF Spectrum Analyzer 9 khz to 3.0 GHz Data Sheet Definitions and Conditions The spectrum analyzer will meet its specifications when: It is within its calibration cycle It has
Digital Clamp Meter Model: &
 Digital Clamp Meter Model: 72-7224 & 72-7226 1 SAFETY INFORMATION Please read these instructions carefully before use and retain for future reference. This meter is designed to meet IEC61010-1, 61010-2-032,
Agilent N9320B RF Spectrum Analyzer
 Agilent N9320B RF Spectrum Analyzer 9 khz to 3.0 GHz Data Sheet Definitions and Conditions The spectrum analyzer will meet its specifications when: It is within its calibration cycle It has been turned
P a g e 1 ST985. TDR Cable Analyzer Instruction Manual. Analog Arts Inc.
 P a g e 1 ST985 TDR Cable Analyzer Instruction Manual Analog Arts Inc. www.analogarts.com P a g e 2 Contents Software Installation... 4 Specifications... 4 Handling Precautions... 4 Operation Instruction...
Suitable firmware can be found on Anritsu's web site under the instrument library listings.
 General Caution Please use a USB Memory Stick for firmware updates. Suitable firmware can be found on Anritsu's web site under the instrument library listings. If your existing firmware is older than v1.19,
Model and
 Function Generator Model 72-14110 and 72-14111 0 Contents Function Generator... 0 Model 72-14110 and 72-14111... 0 Chapter 1 Safety Information... 3 1.1 Safety Terms and Symbols... 3 1.2 General Safety
Spectrum Analyzers. 2394A 1 khz to 13.2 GHz Spectrum Analyzer.
 Spectrum Analyzers 2394A 1 khz to 13.2 GHz Spectrum Analyzer A spectrum analyzer with outstanding performance and a user friendly visual interface simplifying many complex measurements 1 khz to 13.2 GHz
Copyright X02827C00 - Ed. 1-04/16
 1 GHz Spectrum Analyzer Userr s manuall CHAUVIN-ARNOUX Test and Measurement Division Parc des Glaisins 6, avenue du Pré de Challes F - 74940 ANNECY-LE-VIEUX Tel. +33 (0)4.50.64.22.22 - Fax +33 (0)4.50.64.22.00
TA MHz ±700 V Differential Probe User s Manual. This probe complies with IEC , IEC CAT III, Pollution Degree 2.
 TA041 25 MHz ±700 V Differential Probe User s Manual This probe complies with IEC-1010.1, IEC-1010.2-031 CAT III, Pollution Degree 2. 1. Safety terms and symbols Terms appearing in this manual: WARNING
Handheld Spectrum Analyzer HSA2030/HSA2016 Series V1.0.0
 USER S MANUAL Handheld Spectrum Analyzer HSA2030/HSA2016 Series V1.0.0 Notice Qingdao Hantek Electronic co., Ltd. All Rights Reserved. Qingdao Hantek Electronic co., Ltd. reserves the right to modify or
khz to 2.9 GHz Spectrum Analyzer
 Spectrum Analyzers 2399 9 khz to 2.9 GHz Spectrum Analyzer A spectrum analyzer with outstanding performance and a user friendly visual interface simplifying many complex measurements. 9 khz to 2.9 GHz
DSA800. No.1 RIGOL TECHNOLOGIES, INC.
 No.1 DSA800 9 khz to 1.5 GHz Frequency Range Typical -135 dbm Displayed Average Noise Level (DANL) -80 dbc/hz @10 khz offset Phase Noise Total Amplitude Uncertainty
2.9GHz SPECTRUM ANALYZER
 2.9GHz SPECTRUM ANALYZER Introducing a new 2.9GHz Spectrum Analyzer Manufacturing Research and Development Field Service Education Powerful capacity by advanced digital synthesizer Revolutionary features
Tablet Oscilloscope Safety Information
 Tablet Oscilloscope Safety Information Shenzhen Micsig Instruments Co., Ltd. General Safety Summary To use the instrument safely, please follow safety precautions carefully and obey the well-known safety
5MHz FUNCTION GENERATOR
 5MHz FUNCTION GENERATOR MODEL GF-8056 User s Manual Elenco TM Electronics, Inc. Copyright 2004 by Elenco TM Electronics, Inc. All rights reserved. 753117 No part of this book shall be reproduced by any
5MHz FUNCTION GENERATOR
 5MHz FUNCTION GENERATOR MODEL GF-8056 99 Washington Street Melrose, MA 02176 Phone 781-665-1400 Toll Free 1-800-517-8431 Visit us at www.testequipmentdepot.com User s Manual Elenco TM Electronics, Inc.
DDS Function Generator
 Model: 4007B, 4013B DDS Function Generator USER MANUAL Safety Summary The following safety precautions apply to both operating and maintenance personnel and must be observed during all phases of operation,
Demo / Application Guide for DSA815(-TG) / DSA1000 Series
 / DSA1000 Series") Demo / Application Guide for DSA815(-TG) / DSA1000 Series TX1000 Mobile Phone Frontend Mixer Bandpass Filter PA The schematic above shows a typical front end of a mobile phone. Our TX1000 RF Demo Kit shows
Demo / Application Guide for DSA815(-TG) / DSA1000 Series TX1000 Mobile Phone Frontend Mixer Bandpass Filter PA The schematic above shows a typical front end of a mobile phone. Our TX1000 RF Demo Kit shows
312, 316, 318. Clamp Meter. Users Manual
 312, 316, 318 Clamp Meter Users Manual PN 1989445 July 2002 Rev.2, 2/06 2002, 2006 Fluke Corporation. All rights reserved. Printed in China. All product names are trademarks of their respective companies.
Handheld 3.3GHz Spectrum Analyzer
 Handheld 3.3GHz Spectrum Analyzer Optimum for evaluation of W-CDMA CDMA GSM PDC PHS Wireless LAN Bluetooth 2650 1 FEATURES 2650 1 Compact and lightweight 3.75 lb (1.7 kg) The dimensions are as small as
Frequency and Time Domain Representation of Sinusoidal Signals
 Frequency and Time Domain Representation of Sinusoidal Signals By: Larry Dunleavy Wireless and Microwave Instruments University of South Florida Objectives 1. To review representations of sinusoidal signals
HZ530 Near-Field Probe Set
 HZ530 Near-Field Probe Set The HZ530 Probe Set consists of three active broadband probes for EMI diagnosis. The probes are designed for connection to a HAMEG spectrum analyzer with input impedance of 50
RIGOL. User s Guide. DSA800 Options and Accessories. Dec RIGOL TECHNOLOGIES, INC.
 User s Guide Dec. 2015 RIGOL TECHNOLOGIES, INC. Guaranty and Declaration Copyright 2014 RIGOL TECHNOLOGIES, INC. All Rights Reserved. Trademark Information RIGOL is a registered trademark of RIGOL TECHNOLOGIES,
Digital Spectrum Analyzer GA40XX Series
 GA4062/GA4032 9kHz~1.5GHz GA4033/GA4063 9kHz~3GHz GA4064 9kHz~7.5GHz Product Overview GA40XX series is a small size, light weight, cost-effective portable spectrum analyzer to meet your all the RF application
PeakTech 4130 / 4135 / Operation manual. Digital Spectrum Analyzer
 PeakTech 4130 / 4135 / 4140 Operation manual Digital Spectrum Analyzer Safety introduction Summary Before operating this instrument, read the following safety precautions to avoid injury and prevent damage
Model 745 Series. Berkeley Nucleonics Test, Measurement and Nuclear Instrumentation since Model 845-HP Datasheet BNC
 Model 845-HP Datasheet Model 745 Series Portable 20+ GHz Microwave Signal Generator High Power +23dBM Power Output 250 fs Digital Delay Generator BNC Berkeley Nucleonics Test, Measurement and Nuclear Instrumentation
RIGOL. User s Guide. DSA1000&DSA1000A Series Options&Accessories. Feb RIGOL Technologies, Inc.
 User s Guide DSA1000&DSA1000A Series Options&Accessories Feb. 2014 RIGOL Technologies, Inc. Guaranty and Declaration Copyright 2010 RIGOL Technologies, Inc. All Rights Reserved. Trademark Information
TA MHz x10/x100 Differential Probe User s Manual. This probe complies with IEC , IEC CAT III, Pollution Degree 2.
 TA043 100 MHz x10/x100 Differential Probe User s Manual This probe complies with IEC-1010.1, IEC-1010.2 031 CAT III, Pollution Degree 2. 1. Safety terms and symbols Terms appearing in this manual: WARNING
APPLICATION NOTE Getting Started with EasySpectrum Software
 APPLICATION NOTE Getting Started with EasySpectrum Software INTRODUCTION: EasySpectrum software provides a remote control interface for SIGLENT SSA3000 Series of spectrum analyzers that can be used to
RF Fundamentals Part 2 Spectral Analysis
 Spectral Analysis Dec 8, 2016 Kevin Nguyen Keysight Technologies Agenda Overview Theory of Operation Traditional Spectrum Analyzers Modern Signal Analyzers Specifications Features Wrap-up Page 2 Overview
FM Modulation. Accuracy. Total. Harmonics. Input Range. Frequency. Range. Deviation. Range. Modulation. Accuracy. Audio In Switchable Loads.
 Product Specification VIAVI 3550R Touch-Screen Radio Test System VIAVI Solutions General Specifications RF Signal Generator Output SSB Phase Noise 2 MHz - 1 GHz (usable from 500 khz) T/R Port: -50 to -125
Chapter 5 Specifications
 RIGOL Specifications are valid under the following conditions: the instrument is within the calibration period, is stored for at least two hours at 0 to 50 temperature and is warmed up for 40 minutes.
Spectrum Analyzer R&S FS300
 Spectrum Analyzer R&S FS300 9 khz to 3 GHz The new product family from Rohde & Schwarz Professional test equipment for laboratory, service and production The R&S FS300 is a highly accurate spectrum analyzer
DVM645BI BENCH MULTIMETER TAFELMULTIMETER MULTIMETRE DE TABLE BANCO MULTÍMETRO TISCHMULTIMETER. User Manual. Gebruikershandleiding
 BENCH MULTIMETER TAFELMULTIMETER MULTIMETRE DE TABLE BANCO MULTÍMETRO TISCHMULTIMETER User Manual Gebruikershandleiding Manuel d'utilisation Gebrauchsanleitung Introduction BENCH MULTIMETER This manual
ECE 2111 Signals and Systems Spring 2009, UMD Experiment 3: The Spectrum Analyzer
 ECE 2111 Signals and Systems Spring 2009, UMD Experiment 3: The Spectrum Analyzer Objective: Student will gain an understanding of the basic controls and measurement techniques of the Rohde & Schwarz Handheld
DEPARTMENT OF THE ARMY TECHNICAL BULLETIN
 *TB 9-6625-2333-24 DEPARTMENT OF THE ARMY TECHNICAL BULLETIN CALIBRATION PROCEDURE FOR SPECTRUM ANALYZER AGILENT MODELS 8562EC AND 8562EC-104 Headquarters, Department of the Army, Washington, DC 17 June
Specification RIGOL. 6 Specification
 Specification RIGOL 6 Specification This chapter lists the specifications and general specifications of the analyzer. All the specifications are guaranteed when the following conditions are met unless
Agilent CSA Spectrum Analyzer
 Agilent CSA Spectrum Analyzer N1996A Exceptional performance... anytime, anywhere Frequency coverage Frequency range: 100 khz to 3 or 6 GHz Signal source: 10 MHz to 3 or 6 GHz Preamplifier to 3 or 6 GHz
User s Manual Current Probe. IM E 1st Edition. Yokogawa Electric Corporation
 User s Manual 701932 Current Probe Yokogawa Electric Corporation 1st Edition Foreword Revisions Thank you for purchasing the 701932 Current Probe. This user's manual contains useful information about the
Dawson DDM190. Digital Multimeter User s Manual
 Dawson DDM190 Digital Multimeter User s Manual TABLE OF CONTENTS LIMITED WARRANTY AND LIMITATION OF LIABILITY... 3 Out of the Box... 3 Accessories.. Error! Bookmark not defined. Safety Information... 7
TT-SI 9001 / TT-SI MHz Active Differential Probes
 INSTRUCTION MANUAL TT-SI 9001 / TT-SI 9002 25MHz Active Differential Probes These probes are in compliance with IEC-61010-031 CAT III, Pollution Degree 2 1. Safety Terms and Symbols Terms appear in this
On-Line Cardio Theater Wireless Digital Transmitter Installation and Instruction Manual
 On-Line Cardio Theater Wireless Digital Transmitter Installation and Instruction Manual Full installation instructions accompany your Cardio Theater equipment order. This On-Line version of our Installation/Instruction
USER MANUAL 600A AC Clamp Meter + NCV Model MA610
 USER MANUAL 600A AC Clamp Meter + NCV Model MA610 Additional User Manual Translations available at www.extech.com Introduction Thank you for selecting the Extech MA610 Clamp Meter. This meter measures
CL900. True RMS 1000V 2000A 60MΩ ENGLISH. INSTRUCTION MANUAL 2000A Digital Clamp Meter. Measurement Technology
 ENGLISH INSTRUCTION MANUAL 2000A Digital Clamp Meter True RMS Measurement Technology NON-CONTACT VOLTAGE TESTING INRUSH CURRENT LOW IMPEDANCE DATA HOLD RANGE HOLD AUDIBLE CONTINUITY DIODE TEST CAPACITANCE
PORTABLE SPECTRUM ANALYZER WITH BUILT-IN SIGNAL GENERATOR. Arinst SSA-TG R2
 SCIENTIFIC AND PRODUCTION COMPANY PORTABLE SPECTRUM ANALYZER WITH BUILT-IN SIGNAL GENERATOR Arinst SSA-TG R2 USER MANUAL Article 1484 CONTENT 1. PURPOSE...... 3 2. SPECIFICATIONS... 3 3. COMPLETENESS.....
External Source Control
 External Source Control X-Series Signal Analyzers Option ESC DEMO GUIDE Introduction External source control for X-Series signal analyzers (Option ESC) allows the Keysight PXA, MXA, EXA, and CXA to control
AM/FM SYNTHESIZER TUNER DT-920. TOA Corporation OPERATING INSTRUCTIONS
 OPERATING INSTRUCTIONS AM/FM SYNTHESIZER TUNER DT-920 Please follow the instructions in this manual to obtain the optimum results from this unit. We also recommend that you keep this manual handy for future
GA GHz. Digital Spectrum Analyzer
 Digital Spectrum Analyzer GA4063 3GHz Professional Performance Robust Measurement features High frequency stability Easy- to-use User Interface Compact size, Light weight, Portable design www.attenelectronics.com
Willtek. Handheld Spectrum Analyzer
 Willtek 9101 Handheld Spectrum Analyzer Cover all frequencies with a range up to 4 GHz Ideal for mobile phone repair, basic testing in R&D labs, alignment testing for manufacturing, and measurement of
Site Master Cable and Antenna Analyzer with Spectrum Analyzer
 Maintenance Manual Site Master Cable and Antenna Analyzer with Spectrum Analyzer S331E, 2 MHz to 4 GHz S332E, 2 MHz to 4 GHz, Spectrum Analyzer, 100 khz to 4 GHz S361E, 2 MHz to 6 GHz S362E, 2 MHz to 6
CONTENTS MS2033A. 1.Introduction Safety Information...01
 MS2033A AC Digital Clamp Meter User s Manual CAT III 600 V CONTENTS 1.Introduction...01 2.Safety Information...01 2.1 Precautions...02 2.2 Safety Symbols...03 3. Description...04 3.1 Front Panel...04 3.2
DIGITAL DUAL DISPLAY AC/DC CLAMP METER MODEL-860A OPERATION MANUAL
 DIGITAL DUAL DISPLAY AC/DC CLAMP METER MODEL-860A OPERATION MANUAL DIGITAL DUAL DISPLAY AC/DC CLAMP METER MODEL-860A TABLE OF CONTENTS TITLE PAGE Safety Information Safety Symbols... 1 Meter Description...
Model 7000 Low Noise Differential Preamplifier
 Model 7000 Low Noise Differential Preamplifier Operating Manual Service and Warranty Krohn-Hite Instruments are designed and manufactured in accordance with sound engineering practices and should give
LAB I. INTRODUCTION TO LAB EQUIPMENT
 1. OBJECTIVE LAB I. INTRODUCTION TO LAB EQUIPMENT In this lab you will learn how to properly operate the oscilloscope Agilent MSO6032A, the Keithley Source Measure Unit (SMU) 2430, the function generator
AD U DAB/FM Tuner. Item ref: UK User Manual
 AD-100 1U DAB/FM Tuner Item ref: 952.979UK User Manual Caution: Please read this manual carefully before operating Damage caused by misuse is not covered by the warranty Introduction Thank you for choosing
DM-45 Digital Multimeter
 INSTRUCTION MANUAL DM-45 Digital Multimeter Read and understand all of the instructions and safety information in this manual before operating or servicing this tool. Description The Greenlee DM-45 Digital
DM-46 Instruction Manual
 Auto Meter Products Inc. Test Equipment DM-46 Instruction Manual Automotive Multimeter and Inductive Amp Probe The DM-46 is the auto industry s answer to pocket portability in a 20 2650-1552-00 3/8/11
Model MHz Arbitrary Waveform / Function Generator
 Verification and Adjustment Manual 3390-905-01 Rev. B / May 2016 www.tek.com/keithley Model 3390 50 MHz Arbitrary Waveform / Function Generator *P3390-905-01B* 3390-905-01 A Greater Measure of Confidence
DIGITAL MULTIMETER CONTENTS DIGITAL MULTIMETER CONTENTS
 CONTENTS CONTENTS CONTENTS 1. SAFETY INFORMATION...1 1.1 Preliminary...1 1.2 Dos and don ts...2 1.3 Symbols...3 1.4 Precautions...4 2. DESCRIPTION...5 2.1 Names of parts...6 2.2 Switches, buttons and input
79/26 Series III Multimeter
 79/26 Series III Multimeter Instruction Sheet W Read First: Safety Information Never use the meter if the meter or test leads look damaged. Be sure the test leads and switch are in the correct position
GA GHz. Digital Spectrum Analyzer
 Digital Spectrum Analyzer GA4063 3GHz Professional Performance Robust Measurement features High frequency stability Easy- to-use User Interface Compact size, Light weight, Portable design www.attenelectronics.com
AM/FM SYNTHESIZER TUNER
 OPERATING INSTRUCTIONS AM/FM SYNTHESIZER TUNER DT-930 UL TABLE OF CONTENTS 1. IMPORTANT SAFETY INSTRUCTIONS... 2 2. SAFETY PRECAUTIONS... 2 3. INFORMATION TO THE USER... 3 4. GENERAL DESCRIPTION... 3 5.
100 Hz to 22. HP 8566B Spectrum Analyzer. Discontinued Product Support Information Only. Outstanding Precision and Capability
 Discontinued Product Support Information Only This literature was published years prior to the establishment of Agilent Technologies as a company independent from Hewlett-Packard and describes products
Introduction to Lab Instruments
 ECE316, Experiment 00, 2017 Communications Lab, University of Toronto Introduction to Lab Instruments Bruno Korst - bkf@comm.utoronto.ca Abstract This experiment will review the use of three lab instruments
AC/DC Clamp Meter. Owner's Manual. Model No Safety Operation Maintenance Español
 Owner's Manual AC/DC Clamp Meter Model No. 82369 CAUTION: Read, understand and follow Safety Rules and Operating Instructions in this manual before using this product. Safety Operation Maintenance Español
Agilent PSA Series Spectrum Analyzers Self-Guided Demonstration for Phase Noise Measurements
 Agilent PSA Series Spectrum Analyzers Self-Guided Demonstration for Phase Noise Measurements Product Note This demonstration guide is a tool to help you gain familiarity with the basic functions and important
7. Transmitter Radiated Spurious Emissions and Conducted Spurious Emission
 7. Transmitter Radiated Spurious Emissions and Conducted Spurious Emission 7.1 Test Setup Refer to the APPENDIX I. 7.2 Limit According to 15.247(d), in any 100 khz bandwidth outside the frequency band
Agilent N9322C Basic Spectrum Analyzer
 Agilent N9322C Basic Spectrum Analyzer Data Sheet Easy on your budget. Tough to beat performance, efficiency and simplicity. Definitions and Conditions Learn more about the product Reference these frequentlyused
TT-SI MHz DIFFERENTIAL PROBE
 TT-SI 9110 100MHz DIFFERENTIAL PROBE USER S MANUAL This probe is in compliance with IEC-1010.1, IEC - 1010. 2-031 CATⅢ, Pollution Degree 2. 1. Safety Terms and Symbols Terms appear in this manual: WARNING.
TA MHz ±30 V Differential Probe User s Manual. This probe complies with IEC , IEC CAT I, Pollution Degree 2.
 TA046 800 MHz ±30 V Differential Probe User s Manual This probe complies with IEC-1010.1, IEC-1010.2-031 CAT I, Pollution Degree 2. 1. Safety terms and symbols Terms appearing in this manual: WARNING Warning
Cable and Antenna Analyzer for Anritsu s RF and Microwave Handheld Instruments
 Measurement Guide Cable and Antenna Analyzer for Anritsu s RF and Microwave Handheld Instruments Site Master Cell Master Anritsu Company 490 Jarvis Drive Morgan Hill, CA 95037-2809 USA Part Number: 10580-00241
Combinational logic: Breadboard adders
 ! ENEE 245: Digital Circuits & Systems Lab Lab 1 Combinational logic: Breadboard adders ENEE 245: Digital Circuits and Systems Laboratory Lab 1 Objectives The objectives of this laboratory are the following:
Spectrum Analyzers R3132/3132N/3162 R3132/3132N/3162. Low cost, high performance. General-Purpose Spectrum Analyzer Adaptable to Various Applications
 Frequency band R3132 9 khz to 3 GHz R3132N:9 khz to 3 GHz R3162: 9 khz to 8 GHz High signal purity: -105 dbc (20 khz offset) Total level accuracy: ±1.5 db High speed GPIB useful for high speed productions
Overview. Key Facts. SpecMini Handheld Spectrum Analyzer. TRANSCOM Cellular Network Measurement
 SpecMini Handheld Spectrum Analyzer Overview SpecMini is the first Android hand-held spectrum analyzer. It features high testing sensitivity, light weight, compact size and portable design. Android operating
Agilent ESA-L Series Spectrum Analyzers
 Agilent ESA-L Series Spectrum Analyzers Data Sheet Available frequency ranges E4403B E4408B 9 khz to 1.5 GHz 9 khz to 3.0 GHz 9 khz to 26.5 GHz As the lowest cost ESA option, these basic analyzers are
RIGOL. User s Guide. DSA800 Options and Accessories. May RIGOL Technologies, Inc.
 User s Guide May 2012 RIGOL Technologies, Inc. Guaranty and Declaration Copyright 2012 RIGOL Technologies, Inc. All Rights Reserved. Trademark Information RIGOL is a registered trademark of RIGOL Technologies,
AC/DC DIGITAL CLAMP METER OPERATION MANUAL
 AC/DC DIGITAL CLAMP METER OPERATION MANUAL HYS005661 A0 ACCESSORIES 6. ACCESSORIES 1) Test Leads: Electric Ratings 1000V 10A 1 pair (set) 2) Operating Manual 1 copy 3) 1.5V AAA Battery 3 piece - - 55 -
E-800 power amplifier. user manual
 E-800 power amplifier user manual Musikhaus Thomann Thomann GmbH Hans-Thomann-Straße 1 96138 Burgebrach Germany Telephone: +49 (0) 9546 9223-0 E-mail: info@thomann.de Internet: www.thomann.de 20.05.2016,