"Noise measurements techniques and hydrodynamic aspects related to cavitation noise
|
|
|
- Jasper Morgan
- 5 years ago
- Views:
Transcription

1 "Noise measurements techniques and hydrodynamic aspects related to cavitation noise Project acronym: Full name of project: Project no.: Contract no: TNE5-CT HydroTesting Alliance HTA An alliance to enhance the maritime testing infrastucture in the EU SIXTH FRAMEWORK PROGRAMME PRIORITY Sustainable Surface Transport WP Leader: Authors: M. Felli
2 REPORT INFORMATION Title: "Noise measurements techniques and hydrodynamic aspects related to cavitation noise Authors: Checked by: M. FELLI Approved by: REVISION RECORD Current revisions are identified on the relevant pages by a vertical line in the right-hand margin adjacent to where the revision was made. All previous revision identification should be removed. Revision Date of Revision Revision details
3 INDEX INDEX 3 1 INTRODUCTION 4 2 BACKGROUND 4 3 SUBTASK 1.1: REVIEW OF THE INSTRUMENTATION AND MEASUREMENT SET-UPS FOR NOISE MEASUREMENTS AT MODEL SCALE Instrumentation for noise measurements Hydrophone and pressure transducer models Geometrical characteristics Frequency response of the hydrophone models Directivity patterns and sensitivity Operating ranges Review of the experimental set ups HYKAT HSVA Noise measurement procedures Experiences and challenges Depressurized towing tank of MARIN Noise measurement procedures Emerson cavitation tunnel of UNEW Noise measurement procedures INSEAN Large Circulating Channel Noise measurement procedures Review of the setup and the signal processing techniques for noise measurements using noise cancellation techniques TASK 3: HYDRODYNAMIC ASPECTS INFLUENCING NOISE Introduction Hydrodynamic aspects influencing the non-cavitating noise Noise generated from the inflow perturbation Noise generated from the wake evolution mechanisms Noise generated from the propeller-rudder interaction Hydrodynamic aspects influencing the cavitating noise REFERENCES 56 APPENDIX A: data sheets of the instrumentation for noise measurements 57
4 1 INTRODUCTION In the framework of the European project Hydro Testing Alliance HTA, INSEAN is leader of the subtask 1.1. and Task 3 of the Joint Research Project JRP 10. Specifically, the topics of the tasks are as follows: - Task 1.1: Hydrophone set-up, data acquisition and processing. Under the task Noise measurement at model scale, this subtask concerns a review of typical test setup and specification of instrumentation, transducers, data acquisition hardware and procedures. These aspects are dealt with is two sections, organized as follows: a Review of transducers and measurement set-ups of participants, including limitations and experiences; b Review of either the setup for noise measurements using noise cancellation techniques and signal processing techniques for noise cancellation to reduce the facility background noise. In a some hydrophone and pressure transducer models, as typically used for noise measurement in the JRP10 organizations, are reviewed and compared. Section b is focused on techniques which aims at correcting the contribution of the unwanted noise sources e.g. background noise of the facility, possible reverberation of the test section, noise from the ship model mechanical transmission. - Task 3: Hydrodynamic aspects influencing cavitation noise. This task involves a review and analysis of the flow topologies involved in the acoustic emission in both cavitating and noncavitating conditions. Specifically, the task concentrates on two aspects mainly: a Hydrodynamic aspects influencing the non-cavitation noise; b Hydrodynamic aspects influencing the cavitation noise. 2 BACKGROUND Noise measurements at model scale are still the most reliable tool to estimate cavitation noise in the design stage and to avoid subsequent problems concerning hull vibrations and exceeding radiated underwater noise level limits at full scale. In this regard, the latest generation of large cavitation testing facilities allows the performance of those tests in the realistic three-dimensional wake field of complete ship models. Of course, either the kind and the characteristics of the facilities require that special features like e.g. high Reynolds numbers or free surface effects have to be addressed. Noise measurements at model scale are typically performed in facilities with strong background noise and reverberant test sections. Furthermore, background noise is introduced by the ship model mechanical transmission. The extraction of each spurious contribution from the overall noise levels is a difficult task, instead it is possible to correct for the contribution of the unwanted sources by adopting noise cancellation techniques.
5 3 SUBTASK 1.1: REVIEW OF THE INSTRUMENTATION AND MEASUREMENT SET-UPS FOR NOISE MEASUREMENTS AT MODEL SCALE The following section reports a review of either instrumentation and set ups that are typically used from the organizations involved in the JRP 10 of the European Hydro Testing Alliance. The review is organized in two sub-sections, as follows: Instrumentation for noise measurements. Different models of noise measurement pressure transducers and hydrophones currently used in the JRP10 organizations are here reviewed and compared Set ups for noise measurements. A description of facilities, set ups and test procedures currently adopted for acoustic measurements at model scale is here addressed. 3.1 Instrumentation for noise measurements Detailed technical information and comparison among different models of pressure transducers and hydrophones are the subject of this part. The reviewed instrumentation covers the pressure transducer and hydrophone models currently used by HSVA, CNR-INSEAN, MARIN and NEWCASTLE UNIVERSITY for model scale noise measurements. The reviewed instrumentation is listed in Table 1. Hydrophones Brüel & Kjær 8103 Brüel & Kjær 8104 Brüel & Kjær 8105 Brüel & Kjær 8106 Reson TC4014 Reson TC4032 Elac Nautic KE2 Pressure transducers PCB 103M49 PCB 106B51 Table 1. Reviewed hydrophone and pressure transducer models ICP pressure transducers i.e. PCB models were included in the review because commonly used from one of the JRP10 organizations i.e.cnr-insean to identify the location of the noise sources. In this regard the uni-directional directivity pattern of pressure sensors makes them suitable for this kind of application. For the sake of this review and comparison exercise, the main characteristics of the sensors i.e. hydrophones and pressure transducers are represented in tabulations and graphical representations Hydrophone and pressure transducer models An overview of the overall nominal characteristics of the hydrophone and pressure transducer models is described hereinafter. 1. Brüel & Kjær The B&K 8103 is a small-size, high-sensitivity transducer suitable for making absolute sound measurements over the frequency range 0.1Hz to 180 khz and with a receiving
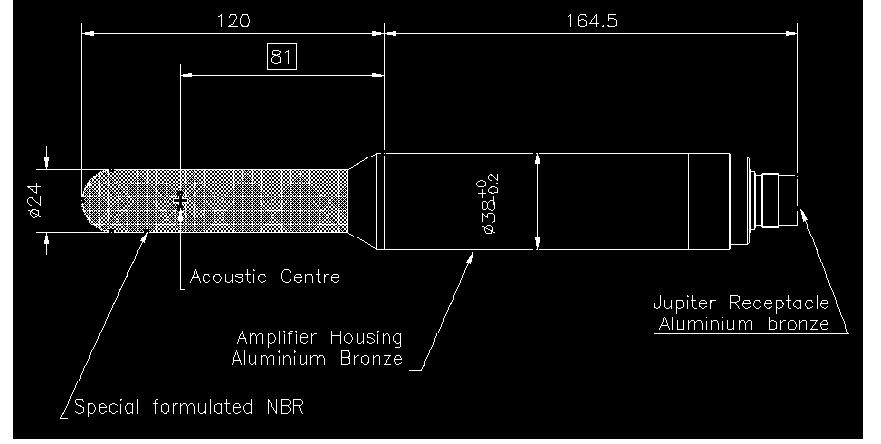
6 sensitivity of 211 db re 1V/μPa. It has a high sensitivity relative to its size and good all-round characteristics, which make it generally applicable either to laboratory and industrial. Type 8103 has high frequency response that makes it useful for cavitation measurements. 2. Brüel & Kjær The B&K 8104 is a wide-range standard measuring transducer for making absolute sound measurements over the frequency range 0.1Hz to 120 khz with a receiving sensitivity of 205 db re 1V/μPa. It can also be used as a sound transmitter projector which makes it ideal for calibration purposes by the reciprocity, calibrated-projector and comparison methods. 3. Brüel & Kjær The B&K 8105 is a small, spherical transducer for making absolute sound measurements over the frequency range 0.1Hz to 160 khz with a receiving sensitivity of 205 db re 1V/μPa. It is rugged, being capable of withstanding pressures of up to 10 7 Pa 100 atm; 1000 m ocean depth. This hydrophone has excellent directional characteristics: at 100 khz, it is omnidirectional over 360 in the x-y radial plane and 270 in the x-z axial plane. 4. Brüel & Kjær The B&K 8106 is a wide-range, general-purpose transducer for making absolute sound measurements over the frequency range 7Hz to 80 khz with a receiving sensitivity of 173dB re 1V/μPa. The hydrophone is capable of withstanding high static pressure, the operational upper limit being 10 7 Pa 100 atm.; 1000 m ocean depth. A built-in high-quality, thickfilm, low-noise, 10 db preamplifier provides signal conditioning for transmission over long underwater cables. The preamplifier features a 7Hz high-pass filter and an insert-voltage calibration facility, but does not allow the hydrophone to be used as a projector. An integrated watertight connector allows quick disconnection of the cable and makes replacement and storage very easy. 5. Reson TC4014. The Reson TC4014 is a wide range spherical transducer which offers a wide usable frequency range with excellent omnidirectional characteristics in all planes. The overall receiving characteristics makes the Reson TC4014 ideal for making absolute sound measurements up to 480 khz with a receiving sensitivity of 186dB re 1V/μPa. The wide frequency range of the transducer makes it suitable for calibration purposes, particularly in the high frequencies. In addition, the Reson TC4014 incorporates a low-noise 26 db preamplifier that provides signal conditioning for transmission through long underwater cables. The transducer is provided with differential output that is advantageous when long cables are used in an electrically noisy environment. The transducer can be also used in single-ended mode. 6. Reson TC4032. The Reson TC4032 is a general purpose hydrophone which offers a high sensitivity i.e. 170dB re 1V/μPa, low noise and a usable frequency range up to 120 khz. Similarly to the TC4014 model, the Reson TC4014 incorporates a low-noise 10 db preamplifier that is capable of driving long cables of more than 1000 m and is provided with differential output that is useful when long cables are used in an electrically noisy environment. Similarly to the TC4014 model, the transducer can be also used in single ended mode. 7. Elac Nautic KE2. The Elac Nautik KE2 is a ceramic transducer designed for use in passive sound locators. Its frequency range extends from 40Hz to 30KHz. The ceramic is mounted in a metal housing protected against contact with water by means of a rubber coating. The two-conductor cable is longitudinally watertight. 8. PCB 103 and 106 series. The PCB Series 106 and 103 are ICP Integrated Circuit Piezoelectric pressure transducers and, thus, are best suited for detecting and measuring dynamic pressure phenomena. With very rapid response times i.e. <25s the 103 series and <9s the 106 series, these sensors allow accurately measure fast transient pressures, such as surges, spikes, pulsations, and noise. Since piezoelectric pressure sensors, the PCB 103 and 106 transducers are AC coupled devices and, thus, they ignore any ambient, static pressure or very slow pressure change i.e. sensitivity of 250 mv/psi the 103 series 103M49 and 1000 mv/psi the 106 series 106B51. This


7 property provides these sensors with the unique ability to monitor low level dynamic pressures while being subjected to a high static background pressure level. For this reason, these sensors can be categorized as microphones. Series 103 has a smaller sensitive area than Series 103 i.e. = 3.18 mm for Series 103 and = mm for Series 106, and, thus, are suitable for measurements in which high spatial resolution is required. With no moving parts and solid state construction, the durability of these sensors is unsurpassed by any other type of pressure sensor Geometrical characteristics The overall geometrical characteristics of the transducers under review are documented in Tables 2 and 3. Hydrophones B&K 8103 B&K 8104 B&K 8105


8 B&K 8106 RESON TC RESON TC ELAC NAUTIK KE2 Table 2. Geometrical features of the reviewed hydrophone 3 Geometries are represented in millimiters
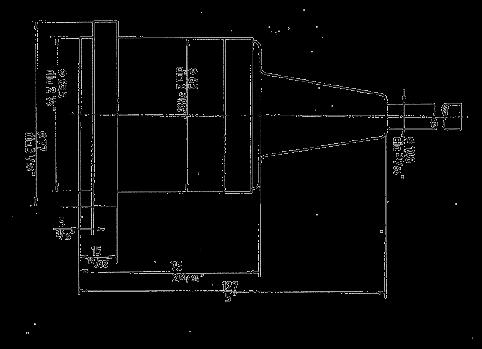
9 Pressure transducers PCB 103M49 4 PCB 106M51 5 Table 3. Geometrical features of the reviewed pressure transducers 4 Geometry is represented both in inches and millimiters among brackets.


10 B&K 8106 B&K 8105 B&K 8104 B&K Frequency response of the hydrophone models The typical frequency responses of the hydrophone and pressure sensor models under review are shown in Table 4. The abscissa and ordinate axes represent the frequency in khz and the corresponding receiving sensitivity in db re 1m. Figure 1 show a comparative analysis about the maximum operative frequency. Hydrophones

11 PCB 106M51 5 PCB 103M49 6 ELAC NAUTIK KE2 RESON TC RESON TC Pressure transducers Resonant frequency 13 KHz Resonant frequency 40 KHz Table 4. Frequency response of the reviewed hydrophones and pressure transducers 5 Geometries are represented in millimiters 6 Geometry is represented both in inches and millimiters among brackets.
12 Figure 1. Maximum operative frequency Directivity patterns and sensitivity Typical directivity patterns of the hydrophones in water are shown in Table 5. These polar directivity patterns are typically measured in free-field conditions achieved by means of gating techniques in a water tank. The method requires a standard hydrophone as a projector and the unknown hydrophone as the receiver whose polar directivity pattern is to be determined. The polar diagrams in Table 5 show the direction of the receiver respecting to the projector along the azimuth in degrees and the corresponding receiving sensitivity along the radius in db re 1m. Figure 2 shows the nominal sensitivity 7 of the hydrophones. 7 The sensitivity of a hydrophone is given by the minimum input signal Si required to produce a specified signal-to-noise S/N ratio at the output port of the receiver and is defined as the mean noise power at the input port of the receiver times the minimum required signal-to-noise ratio at the output of the receiver: where S i = sensitivity [W] k = Boltzmann's constant T a = equivalent noise temperature in [K] of the source e.g. antenna at the input of the receiver T rx = equivalent noise temperature in [K] of the receiver referred to the input of the receiver B = bandwidth [Hz] = Required SNR at output [-] Because receive sensitivity indicates how faint an input signal can be to be successfully received by the receiver, the lower power level, the better. Lower power for a given S/N ratio means better sensitivity since the receiver's contribution is smaller.

13 B&K 8105 B&K 8104 B&K 8103 Hydrophones

14 Elac Nautic KE2 RESON TC RESON TC B&K 8106 Directivity pattern -3db: spherical Table 5. Directivity pattern of the hydrophone models 8 Geometries are represented in millimiters


15 3.1.5 Operating ranges Figure 2. Nominal values of the sensitivity of the hydrophone models Values of both the operating temperature range and the maximum operating depth of the reviewed transducers are shown in Figg. 3 and 4 respectively. Figure 3. Temperature range of the reviewed transducers
16 Figure 4. Maximum operative static pressure of the reviewed transducers data from Elac Nautic KE2 are not available

17 3.2 Review of the experimental set ups The following section reports a review of the experimental set ups and the test procedures used in the organizations involved in the JRP 10 of the European Hydro Testing Alliance community HYKAT HSVA. HYKAT is a closed-jet cavitation tunnel with a horizontal top branch including the test section L x B x H = 11m x 2.8m x 1.6m as well as the acoustic chamber and a bottom branch submerged in a trench Figure 5. Numerous acoustic treatment features enable low background noise Friesh, An aeration and de-aeration system allows to operate the tunnel with defined gas content required for noise measurements. More details of HYKAT and test section can be found in the website of HSVA. In the test section of HYKAT the model propeller operates in the realistic three-dimensional wake, at high Reynolds number. The ship model penetrates the test section cover at the designed water line and is completely flooded during cavitation and noise tests Figure 6. HYKAT-HSVA Test section m 3 : 2.80 W x 1.60 D x L Test section maximum speed m/s: 12.6 m/s Max. & min. abs. pressures: 2.5 bar, 0.15 bar Noise measurement procedures For cavitation noise measurements a flush mounted hydrophone i.e. KE 2 is used in the model hull close to the propeller and one omnidirectional hydrophone i.e. RESON TC 4032 in the anechoic acoustic chamber Figure 5 below the test section, separated by large acoustically transparent windows Figure 7. The latter hydrophone is located just below the propeller at the distance of about 2.5m - varying slightly with the model draught - but considered to be in the acoustic far field for frequencies above 1kHz. Both hydrophone signals are recorded simultaneously and converted into spectra by a commercial dual channel signal analyzer, appropriately equipped for antialiasing, windowing and averaging procedures Figure 8. The model noise measurements are performed in third octave bandwidth and narrowband 800 lines in the frequency range 1-100kHz. Noise components acquired by the far field hydrophone can be traced back to the propeller through the analysis of the signal recorded by the flush mounted hydrophone.


18 The contribution of the background noise is measured in absence of the propeller, setting the same operating conditions in terms of thrust coefficient, cavitation number, rotational speed, flow speed, static pressure and gas content. The noise contributions correlated to the propeller and the tunnel drive system, the flow noise and the electronic noise of the measurement chain are checked separately. The signal to noise ratio of propeller cavitation noise to the background noise amounts typically from 10 db to 30 db. Figure 5. HYKAT-HSVA: view of the acoustic chamber Figure 6. HYKAT-HSVA: model installation Figure 7. HYKAT-HSVA: view of the test section

19 Figure 8. HYKAT-HSVA: chain for noise measurements Experiences and challenges A list of practical information related to noise tests in the HYKAT cavitation tunnel is reported as follows: - At lower frequencies i.e. f<1khz the signal to noise ratio decreases below 10dB and, therefore, this range is excluded from further analysis. - At low static tunnel pressure the relative gas content oxygen saturation index increases above 100% and causes a large amount of free air bubbles that affect the measured noise levels. - During cavitation inception tests, cavitation phenomena sometimes occur at model hull and/or appendages. This effect is easily detectable but difficult to be located, sometimes. - In contrast to full scale, there is no free surface at the waterline during the noise tests. - The main background noise contribution is given by the propeller drive system dynamometers. This contribution is difficult to be mitigated significantly. - In case of significant contributions of vortex cavitation and sheet cavitation, noise scaling has to be done in a different way for the two phenomena. - In 1989 HSVA installed an array of up to seven hydrophones of type B&K 8105 in the anechoic acoustic chamber for directed and scanning noise measurements. In spite of the specification for this type of hydrophone indicates the water tightness up to 1000m see Appendix A, all

20 hydrophones experienced a malfunction after about five years and the hydrophone cables were significantly swollen. B&K stated that they do not guarantee for the long term water tightness and that diffusion of water molecules through the rubber material could not be avoided at all. Unlike the B&K 8105, the hydrophones of type RESON TC4032 are used since about 15 years without any problem. Frequent calibrations do not indicate any change of the hydrophone performance Depressurized towing tank of MARIN. The Depressurized Towing Tank of MARIN DTT has the capability to carry out noise measurements for cavitating propellers. The facility has a towing carriage that allows to test up to the maximum speed of 8m/s both in atmospheric and low pressure conditions. For the sake to reduce the high background noise levels of the regular towing carriage, the facility was equipped with a silent towing carriage. This is a lightweight carriage composed of truss bars, driven by a geared belt suspended between two frames: one frame was attached to the tank wall whereas the other frame, which included the driving engine, was attached to the regular towing carriage which remained static. The weight of the towing carriage excluding the towing legs is 750 Kg. The velocity variation of the carriage with a large size model i.e kg is smaller than 1% up to a velocity of 3.5 m/s within an effective constant speed run length of 15m. Figure 9 gives an example of the measured noise levels in the tank. The noise of the silent towing carriage is more than 10 db below the measured flow noise levels for frequencies above 1kHz. The remaining noise levels of the silent towing carriage are caused by air borne transmission of the noise due to the driving engine and gearing wheels. The towing carriage was used only for noise measurements at atmospheric pressure. In 2012 the Depressurized Towing Tank will be renamed to 'Depressurized Wave Basin' due to the installation of wake makers. DTT of MARIN Tank dimensions: 240m L x 18m W x 8 m D. Towing carriage maximum speed: 8 m/s Minimum abs. pressure in the facility: mbar. Model size: 2 12 m in length, Max prop. Diam. 0.4 m Noise measurement procedures The location of hydrophones in the Depressurized Towing Tank for the radiated noise measurements of cavitating propellers was investigated by van der Kooij and de Bruijn The hydrophones are mounted on a pylon that is located on the bottom of the basin. The towing carriage with ship model and propellers is then passing over the hydrophones. The location is shown in figure 10.


21 One hydrophone is located just below the course line of the ship at the depth of 2 m while the other hydrophone is located abeam at the depth of about 1 m and at the horizontal distance of about 2.2 m from the center line of the basin. A photograph of the beam hydrophone is presented in Figure 11. Figure 9. The silent towing system of MARIN.. Figure 10. Underwater sound in DTT-MARIN at the towing speed of 3.5 m/s when the silent carriage is towing the scale model hull blue line. The green line gives the noise of the carriage without model at the same speed and the red line gives the background noise in the tank.


22 Figure 11. DTT-MARIN: location of hydrophones in the Depressurized Towing Tank. Figure 12: The beam hydrophone pole with the ZP84 hydrophone
23 The hydrophones were developed by the Physics Laboratory TNO and are denominated ZP-84 Figure 12. These hydrophones show to perform well in depressurized conditions in contrary to other hydrophones such as Bruel and Kjaer 8103, in which air was experienced to penetrate at low pressure. The ZP84 hydrophones have been recently replaced by hydrophones of type RESON TC4014. Issues related with the location of the hydrophones are: - Hydrophones should be in the acoustic far field of the cavitating propeller, hence, at a sufficient large distance. The minimum distance is estimated at 1.5 m. - The direct sound field should be predominant over the reverberant sound field. Measurements have shown that the difference between these two sound fields is in the order of 10 db for the center hydrophone in the frequency range above 100 Hz. For the hydrophone that is located abeam, the difference is in the order of 5 db for the frequency range between 100 Hz and 1 khz and in the order of 10 db for frequencies above 1 khz. The 10 db difference implies that the contribution of the reverberant sound field to the measured sound field is negligible. Results of the hydrophone located abeam are only analyzed for frequencies above 1 khz. - For very low frequencies the available measurement time as the model passes a hydrophone becomes too short. Typical measurement duration time is several seconds. - Hydrophones should be sufficiently close to cavitating propellers such that the radiated noise field is much stronger than the background noise field. The background noise field consists of the noise generated by the towing carriage mainly transferred through the basin walls and the noise generated by the propeller driving train. Alternative hydrophone locations have been used in the past as well: - For the acoustic determination of cavitation inception, the standard location of the hydrophones shown in figure 10 gave insufficient signal to noise ratio. Instead, for these type of measurements, the hydrophones are mounted in the ship hull directly above the propeller. Due to the close proximity to the cavitation, the signal to noise ratio is increased. Main issue with this location is that the measured noise levels cannot directly be scaled to equivalent noise levels at full scale in the far field. Furthermore, the hydrophones should be located inside a block of Perspex to avoid the measurement of flow noise i.e. pressure fluctuations of the turbulent boundary layer. - For the measurement of two phase flow noise, use has been made of an acoustic antenna designed and operated by TNO, see De Jong et al The antenna consists of 15 B&K 8103 hydrophones. The antenna could only be operated for atmospheric conditions and is therefore not suited for the measurement of cavitation noise. The antenna was attached to the wall of the basin. During this project the special designed silent towing carriage was used as well Emerson cavitation tunnel of UNEW The Emerson Cavitation Tunnel is a large closed circuit depressurized tunnel. The tunnel has a rectangular measuring section of 3.10 m x 1.22 m x 0.81 m and a contraction ratio of 4.271:1. The ECT contains 60 tonnes of water -including a 1% sodium nitrate as a rust inhibitor- that is circulated in the tunnel by using a 300 kw DC motor driving a four-bladed-impeller with a diameter of 1.4 m. The maximum attainable water speed in the measuring section is 6.5m/s but this can be increased up to 9 m/s with a specially designed and manufactured new insert with the insert the size of the test section reduces to 3.10 x 0.81 x 0.81m. More details of the ECT can be found in Atlar 2011.
24 ECT of UNEW Test section m 3 : 1.22 W x 0.81 D x 3.10 L without insert and 0.81 W x 0.81 D x 3.10 L with insert Test section maximum speed m/s: 6.5 m/s without insert and 9 m/s with insert Max. & min. abs. pressures: 106 mbar, 76 mbar Noise measurement procedures ECT have two B7K 8103 miniature hydrophones and one 8105 hydrophone. The 8103 hydrophones are usually housed in a water filled, thick walled steel cylinder which is usually placed on the 30mm thick Plexiglass window of the tunnel, directly above the propeller plane Figure 13. The steel cylinder in yellow in Fig 13 is open to the window and, hence, must be attached and sealed to the plexiglass by a marine grade type silicone sealant. The steel cylinder is filled with solution from the tunnel Sodium Nitrite using a large plastic syringe. It is important that the cylinder is completely full during the experiment and that the level of water be maintained constant. This is achieved by including the steel cylinder in the daily checks performed prior to starting experiments. The signals from the hydrophone are collected and analyzed by means of a further B&K hardware and software, in this case a PC based PULSE digital acquisition and analysis system up to a frequency of 25 khz. The components details of the PULSE system as well as the hydrophones are defined in Appendix A 9. Hydrophone calibration is carried out by placing the hydrophone with the aid of a coupler UA 0548 into the B&K calibrating device type 4223 instead of the steel mounting cylinder. When this device is switched on four oscillating pistons gives a pressure pulse of frequency 1 khz. The output from the hydrophone is 9 Prior to the purchasing of the PULSE system, the signals from the hydrophone are collected via a Type 2635 Pre-Amplifier, a Type 2610 Measuring Amplifier and a Type 1617 octave 1/3 Band Pass Filter, the latter comprising 50 1/3 octave bands with centre frequencies ranging from 2 Hz to 160 KHz, as sketched in Figure 14. However this hardware except the hydrophonewere now replaced by the PULSE input/output interface and Analyser in a single box. This is supported by Type 7700 PULSE base software for FFT purposes with Constant Percentage Bandwith CBP 1/n octave and Overall Level Analysis with simultaneous measurement of exponential, linear, impulse and peak levels. The entire new hardware is a portable single box as shown in Figure 15.


25 fed to PULSE to give a reading of sound pressure level of db re 1 Pa, thus the hydrophone is calibrated at one frequency only 10. Background noise levels are first measured by conducting tests at the correct tunnel water speed, shaft revolutions and static tunnel working pressure corresponding to the ship operating conditions but with a dummy boss fitted in place of the model propeller. Measurements of noise levels with the model propeller working at the same revolutions and water speed and the static pressure adjusted to give the ship operating cavitation number are then carried out. Following the ITTC recommendation, the sound pressure levels in each 1/3 Octave band are reduced to an equivalent 1 Hz band width by means of the correction 10 log f. As the gas content of the tunnel solution will attenuate the noise signal levels it is important that all noise measurements be obtained with the required gas content at the tunnel working pressure. Gas content in the water is measured using YSI55 oxygen meter. Future developments for ECT are the permanent fixture of a hydrophone inside the tunnel with the ability to move the hydrophone in and out of the flow. The hydrophone is fitted into some form of foil shaped unit to reduce turbulence. Figure 13: Example of hydrophone position and the dynamometer in larger test section of the ECT. 10 Before PULSE was introduced, the output was fed to the pre amplifier then to the 1/3 octave filter ad measuring amplifier. With the piston calibrating device switched on, the control knob of the measuring amplifier is adjusted to give a reading of sound pressure level of db re 1Pa as sketched in Figure 16


26 Figure 14: Emerson Cavitation Tunnel noise measurement set-up sketch at the top before PULSE system introduced Figure 15: Emerson Cavitation Tunnel current noise measurement system using PULSE system and a PC


27 Figure 16 Emerson Cavitation Tunnel hydrophone calibration set-up before PULSE system introduced Figure 17: Example of hydrophone position and the dynamometer in smaller test section of the ECT.


28 3.2.4 INSEAN Large Circulating Channel. The Large Circulating Water Channel of INSEAN is a vertical plane, free water surface, variable pressure recirculating channel, having a capacity of 4 million of liters. The test section of the facility has 10 m length, 3.6 m width and 2.25 m maximum water depth. A picture of te test section is shown in Figure 18. The maximum water speed in the test section is 5.2 m/s. The facility can be depressurized down to 30 mbar, arranging a movable cover to the test section. Large Circulating Channel of INSEAN Test section m 3 : 10m L x 3.2 W x 2.25 D Test section maximum speed m/s: 5.2 m/s Min. abs. pressures: 30 mbar Figure 18: INSEAN large circulating water tunnel: test section


29 Noise measurement procedures Noise measurements in the circulating water channel of INSEAN are performed through one or more infield sensors i.e. B&K 8103 hydrophone, PCB 103B and 106 pressure transducers that typically are mounted on a 20 cm to 40 cm stem and are fixed to a supporting strut Figure 19. The strut has streamlined designed cross-sections and a stiff framework to minimizes vibrations during the tests. In some applications the strut/hydrophone system is traversed along a transversal grid downstream of the propeller and the corresponding signals are phase locked with the propeller position and, then, interpolated. This technique proved to be suitable to identify any noise source induced by the propeller-hull interaction. A rake device with hydrophones, usually aligned on a fin and suitably spaced to each other Figure 20 is used to reduce the grid scanning time and to allow signal cross-correlations to be also performed. Figure 19. Detail of the strut supporting the in-flow sensor hydrophone and particular of the stem and the strut. Figure 20. Hydrophone mounting on the rake device: picture left and geometrical representation right Hydrophones are also used to measure the flow noise levels on the model surface. In this regard, the transducers are fitted inside a cylindrical cavity, which is flush mounted with the outer shell of the model body. The cavity is designed to communicate with the flow through a 2-mm diameter hole, and is therefore filled with water Figure 21.
30 Figure 21. Mounting system for the on-board transducers Hydrophone Out-of-field sensors are typically intended to record the background noise, which includes the flow noise generated by the model supporting strut, the free surface, the motor, the gearing system and any other sources not related to the model flow. The adopted technique to remove the background noise component from the spectra is described in 3.3. These sensors are typically hydrophones fixed at positions not affected, or very low affected at least, by the flow noise that is intended to be measured e.g. one hydrophone is usually mounted far upstream of the model after the cornue of the facility. In some cases also accelerometers mounted on the struts or on the motor box are used.

31 3.3 Review of the setup and the signal processing techniques for noise measurements using noise cancellation techniques. The method presented here to eliminate the contribution of any external noise source to the radiated noise is a general spectral conditioning technique Bendat and Piersol. Figure 22. Exemplifying set up A exemplifying sketch of the set up used for the purpose of removing the background noise is shown in Figure 22. The output of the signal acquired by a given in-field hydrophone pt can be decomposed in the contribution of the underlying deterministic signal ut i.e. the physical signal related to the ship/propeller radiated noise in ideal-noise free condition and any extraneous non-physical noise n t e.g. noise generated by the engine, background noise of the facility. The objective of the conditioning procedure is, then, to estimate and remove the noise due to the broadband inputs from the output acoustic spectrum. If a microphone/hydrophone is put far from the measurement locations i.e. out of field sensor in Figure 22, e.g. at the ceiling of test section, inside the model close to the motor, it will measure the background radiated noise signal nt. The background noise perceived by the out-of-field sensor is different from the noise measured by in-field sensor. The relation between the out-field-signal and the in-field signal is analytically represented by the transfer function Hf. A schematic of the general system is shown in Figure 23.
32 ut Pt total signal acquired by the in-field hydrophone Ut deterministic signal acquired by the in-field hydrophone nt Hf n't pt nt signal perceived by the reference hydrophone i.e. background noise n t noise component acquired by the in-field hydrophone Figure 23. Flowchart The output signal pt acquired by the in-flow sensor can be decomposed according to the following equation: 1 the corresponding auto-spectrum is: G pp f G uu f G n ' n' f The autospectral density function can be defined as the Fourier transform of autocorrelation function: The correlation function is: Expanding p: 1 T 1 T T 0 R pp G f pp R pp [ u t n t][ u t n t ] dt T 1 p t p t dt T T T T T 1 T u t u t dt n t n t dt u t n t dt First two terms are correlation functions, last two cross-correlations: R uu Rn' n' Run ' Rn' u Since noise is uncorrelated from input R un =0 and R n u=0: Ruu R n ' n' Fourier transform of this equation is: G f G f G ' f 0 1 T pp uu n n' 1 T n t u t dt 2 The cross-spectrum between the in-field and the out-of-field sensors can be written The cross-correlation function is: G f np R np
33 the cross-spectrum G np between the in-field and the out-of-field sensors can be written: f G f H G nn np 2 3 From 3 Hf can be expressed as: f G f G f H nn np 4 with similar demonstrations G n n will be: 2 ' ' f G f H f G nn n n 5 substituting 4: 2 ' ' f G f G f G nn np n n 6 The contribution of background noise to the overall spectrum of the inflow-sensor is given by the coherence function between the out-of-field and the in-field signals: 2 2 f G f G f G pp nn np np 7 Substituting 6 in 7 gives: ' ' 2 f G f G f pp n n np 8 Adding and subtracting f G uu : T np dt t p t n T R 0 1 expanding p: 1 ' 1 ' 0 0 nu nn T T np R R dt t u t n T dt t n t n T R Rnu=0 because of uncorrelation of noise, so ' nn np R R transforming with Fourier: np G nn' G another way to define the cross-spectrum is: ' 2 * ' f N f N E T G T T nn where E[] is an ensemble average, NT and N T are Fourier transforms of length T and the star indicates the complex conjugate. Being: ' f N f H f N and being Hf independent of T, one can find: * ' f G f H f N E T f H f N f N E T f H f G nn T T T nn so f G f H G nn np
34 Using expression 2 G f G f G ' f : pp uu n n' By this way, we obtain the final form: 2 G ' n' f Guu f Guu f f n np 9 G f pp G 2 pp f Guu f Guu f np f 1 10 G f G f G pp pp 2 f 1 f G f 11 uu np pp Thus, the autospectrum of the deterministic component acquired by the in-field sensor i.e. G uu can be determined once known the autospectrum function of the in-field sensor i.e. G pp and the coherence function between the out-of-field and the in-field signals i.e. γ np. As an example Figure 24 documents the removal of the contribution of the motor noise from the autospectrum of a pressure signal acquired in the wake of a submarine propeller. In this case the out-offield hydrophone was located far upstream of the model as shown in Figure 25. Figure 24. Motor noise removal from the autospectrum of a pressure signal acquired in the wake of a 2 1 f submarine propeller. Autospectrum of the in-field sensor left, function np center, autospectrum of the deterministic component acquired by the in-field sensor right

35 Figure 25. Set up for background noise cancellation: the accelerometer on the motor box is effective to filter out the noise from the motor, the hydrophone H2 is effective to remove the background noise of the facility Summarizing, the steps of the procedure that allows filtering out the components of the background noise from the autospectrum of the in-field signals are described hereinafter: 1 Put one or more sensors i.e. hydrophones, microphones, pressure transducers, accelerometer in the region of interest. 2 Put one or more reference out-of-field sensors in noisy positions of the facility e.g. inside the box containing the motor, far from the model. The fundamental requirement for positioning of the outfield-sensor is that therein the radiated noise has to be given only by the contribution of the background noise. Thus, in such a position, the contribution of the flow noise i.e. the noise component to be measured has to be negligible compared to that of the background noise. Since the filtering procedure is based on the cross-spectrum between two signals, the kind of the out of field sensor has to be not necessary the same of the in-field one. For example, if the contribution of the motor and the gear system is going to be filtered out from the spectrum of the pressure signals in the wake of a propeller, it may be better to use an accelerometer rather than a pressure sensor to measure the background noise. 3 Acquire the signals from the in-field i.e. pt and the out-of-field i.e. nt sensors simultaneously. 4 Calculate the autospectrum of the in-field sensor i.e. G pp f and the coherence function between the in-field and out-of-field sensors i.e. np f. 2 5 Apply equation 11: G f 1 f G f uu np pp
36 4 TASK 3: HYDRODYNAMIC ASPECTS INFLUENCING NOISE The following section reviews the hydrodynamic mechanisms involved in the acoustic emission from a propeller either in cavitating and non-cavitating conditions. Specifically, this part is organized as follows: - Introduction. - Hydrodynamic aspects influencing the non-cavitating noise - Hydrodynamic aspects influencing the cavitating noise 4.1 Introduction The noise radiated by a propeller is the most relevant noise source in a ship in terms of both intensity and spectral features. In fact, unlike the other noise sources, which present a broadband spectral distribution mostly, propeller noise has a marked tonal contribution as well as a higher intensity. These characteristics make the propeller noise much more critical from the perspective of the acoustic signature, especially in cavitating conditions. The mechanisms by which a propeller generates pressure fluctuations and, thus, noise can be classified in four groups: - The displacement of water by the passage of the propeller blades, namely thickness noise. - The pressure difference between the suction and the pressure sides of the propeller blades when they are rotating, namely loading noise. - The periodic fluctuations of the cavity volumes caused by operation of the blades in the variable wake field behind the vessel - The sudden collapse process associated with the life a cavitation bubble or vortex. The first two mechanisms are not associated with cavitation and contributed to the propeller radiated noise in either its cavitating and non-cavitating state. The latter two causes are cavitation-dependent phenomena and therefore occur only when propeller is experiencing cavitation. In non-cavitating fluid flows the noise is produced by variety of mechanisms, most notably fluctuating forces caused by variations in the magnitude and incidence of the inflow velocity on the propeller e.g. blade-vortex interaction, azimuthal variation of the hydrodynamic load on the blade. Other mechanisms such as incident turbulence, turbulent boundary layers, separated flows and vortex shedding and dynamics may be considered as important in non-cavitating flows. All these mechanisms can be described as dipoles and quadrupoles. In flows where cavitation occurs these mechanisms are of secondary importance if compared to the effects of the growth and collapse of cavitation cavities. In fact, cavitation behaves as a monopole mechanism whose relative acoustic efficiency, compared to dipoles and quadrupoles, is proportional to M 2 and M 4.Ross, In circumstances where the Mach number is small, such as for the flow past a marine propeller, the monopole and dipole acoustic efficiencies are such that cavitation is the predominant source of noise. Propeller noise comprises a series of periodic components, or tones, at blade rate and its multiples, together with a spectrum of high-frequency noise due to cavitation and blade boundary layer effects Hydrodynamic aspects influencing the non-cavitating noise. In non-cavitating flow conditions the noise spectrum from a propeller comprises a series of periodic components, or tones, at blade rate and its multiples, and a broad-band component at higher frequencies Figure 26.
37 For the sake of a better classification and description of the different phenomena influencing the hydrodynamic induced noise in non-cavitating conditions, the following aspects will be addressed hereinafter: i effect of the inflow on the radiated noise from a propeller, ii mechanisms of noise generation and modulation correlated to the propeller wake evolution and breakdown, iii propeller-rudder interaction. Figure 26 Idealized non-cavitating noise spectrum courtesy of Carlton, Noise generated from the inflow perturbation Propeller is normally operating behind a vessel or underwater vehicle, and, thus, works in a circumferentially varying wake field. Inflow non-uniformity and unsteadiness induce variable radial and angular fluid dynamic loads along the blade and, hence, a thrust and torque distribution which changes periodically during the revolution Figure 27. These variations concern either intensity of thrust fluctuations and displacements of the thrust centroid towards the region where the hydrodynamic load is larger. The periodic variation of the hydrodynamic load on the blades results in the increase of the propellerinduced vessel vibrations and noise generation. As an example of the nature of the perturbation that the inflow non-uniformity induces on the propeller wake figure 28 describes the distribution of the axial velocity and the turbulent kinetic energy for a twin screw fast ferry ship Felli and Di Felice, Figure 27. Azimuthal variation of the blade hydrodynamic load calculated on the basis of the tip vortex circulation and the blade load index see Felli and Di Felice, Note that the periodical variation of the


38 blade hydrodynamic load results in periodical fluctuations of the propeller vortex intensity that are associated with the wake induced noise and vibrations phenomena. Figure 28. Axial velocity field and turbulent kinetic energy for a propeller blade operating in behind condition. Figure 29. Illustrative sketch of the vortical structures that impact on a submarine propeller left. Distribution of the vorticity field just behind the propeller trailing edge: note the interference between the propeller trailing wake and tip vortices with the vortical structures of the inflow right.

39 The contour plots in Figure 28 documents the typical features of a propeller wake operating behind a surface vessel, and specifically: i the non-axisymmetric distribution of the velocity field e.g. in the example of Figure 28 the induced velocities have a maximum on the inner half-plane where the inflow, upward direct as the consequence of the stern geometry of the vessel, is counter-rotating as to the propeller; ii the perturbation of the shaft and the shaft-brackets e.g. in the example of Figure 28 the perturbation of the vertical bracket, particularly strong because of the not good keying, is such to shake the propeller tip vortices locally, resulting in a sensible increase of the induced noise and vibration levels. In some cases, typical of submarines Figure 29, the propeller inflow may be dominated by strong vortical structures shed from the sail horse-shoe sail vortices, the hull bilge vortices and the rudders that impact on the blades and induces vibrations and noise Kinns et al., The impact of the above vortical structures on the propeller blades gives a perturbation that recurs at each blade passage periodically, emphasizing the contribution at the blade frequency and its harmonics Figure 30. Rudder tip vortex induced pressure fluctuations Bilge vortex induced pressure fluctuations Figure 30. Distribution of the pressure fluctuations along a transversal plane downstream of the propeller contours refer to the blade harmonic: the maximum fluctuations are in correspondence of the points where the propeller blades impact the vortical structures from the hull and the rudders. The perturbation from the inflow has also an indirect impact on the radiated noise since it excites resonances of either the propeller blades and the hull, enhancing dramatically the radiation. The broadband noise comprises components derived from the inflow turbulence into the propeller.
40 Noise generated from the wake evolution mechanisms The mechanical energy that the propeller transfers to the vortical structures of the wake i.e. tip and hub vortices, trailing wake represents a potential that is converted into structural, hydroelastic and hydroacoustic perturbations and, thus, has a direct impact on the signature. The nature and the mechanisms by which the aforesaid perturbations occur are correlated to the processes of evolution, instability and breakdown of the vortical structures of the wake. For this reason, the analysis of the different contributions that influence the acoustic signature cannot be performed apart from a detailed knowledge of the mechanisms that guide the dynamics of the propeller wake structures. Following the classification proposed in literature Hoshino and Oshima, 1987, the evolution of the propeller wake develops along three main regions: the first, known as near wake, featured by the process of development and roll up of the wake and culminating with the slipstream contraction; the second, known as transition wake, where the propeller wake undergoes a process of gradual destabilization of the vortical structures; and a third zone, known as far wake or ultimate wake, where the propeller wake definitely breaks down. The width of each region depends on the propeller loading condition strictly: the larger the blade load, the faster the transition to the instability, the more contracted the wake evolution Di Felice et al., The analysis of the phase-correlations between velocity and pressure signals reveals a suitable approach to identify the noise sources in the propeller wake and to qualify the nature of their perturbation. In this regard, Felli et al measured the phase averaged velocity and pressure fields in the wake of a four bladed propeller. An example of the pressure signals and the velocity distribution at a given position of the propeller is reported in Figure 31. The contour plot represents the magnitude of the in-plane velocity components normalized with the freestream velocity. The main flow structures, like the viscous wake shed from the blade trailing edge as well as the tip and the hub vortices are clearly apparent. In the same figure the pressure signals at the hydrophone locations are also highlighted. The signals show a different behaviour and amplitude as the consequence of the different interaction with the flow structures of the propeller wake. It is shown that the pressure signal at r/r=0.3 is influenced by the blade wake passages and by the hub vortex evolution. In the same way, at r/r=0.7, the signal consists of large scale fluctuations, caused by the passage at the hydrophone location of the low pressure flow coming from the face of the propeller blade and small scale fluctuations due to the passage of the blade wake. The maximum values of the pressure coefficient are achieved at r/r=0.9 simultaneously to the passage of the tip vortex core. This result clarifies that the tip vortex is the most important pressure fluctuation source in the propeller wake. In fact, pressure fluctuation peaks are one order of magnitude larger at r/r=0.9 compared to the other locations. At r/r=1.2 pressure fluctuations are very low, the transducer being out of the slipstream tube. Close to the trailing edge of the propeller and for all the radial positions the spectrum of the pressure signals is dominated by the blade rate. The amplitude of the pressure fluctuations reduces when increasing the advance coefficient i.e. reducing the blade load because of the reduced intensity of the tip vortex. In the near field, the fundamental frequency is correlated to the blade passage. In the transition and the far field, the streamwise evolution of the power spectrum PSD 12 of the velocity signals demonstrates a mechanism of energy relocation that involves the fundamental frequency and the first and second shaft harmonics. Indeed, the process of energy relocation does not occur through a single step with a direct energy transfer from the blade to the shaft harmonics Felli et al. 2006, but involves other additional 12 PSD is computed by FFT


41 harmonics, fractions of the blade harmonic, in a multi-step mechanism Felli et al., The characteristics of such a mechanism differ depending on the blade number, as follows Figure 32: Figure 31. Correlation between velocity field, by PIV images, and pressure signal at =20. The longitudinal station corresponds to x/r=1.0. Marks in the contour plot evidences the pressure probe positions. Figure 32. Propeller wake evolution mechanism for the two- left, three- mid and four- right bladed propellers at J=0.45. Snapshots are spaced of t=0.1 T.


42 - Two-bladed propeller. Propeller wake instability and breakdown occur several diameters downstream of the propulsor i.e. more than 17R at J=0.8. This is the consequence of the larger distance between consecutive filaments that delays the beginning of the stable-unstable transition. The mechanism of energy transfer occurs with a direct passage from the blade to the shaft harmonic and is correlated both to the joining mechanism between consecutive vortex filaments Figure 33, that leads to a period-doubling in the PSD and a progressive reduction of their distance, as well as to the hub vortex inductance. The former prevails at the beginning of the transition wake, the latter becomes stronger and stronger far downstream, where the intensity of the tip vortices and, thus, their perturbation is very weak. Figure 33. Propeller wake evolution for a two bladed propeller left. Streamwise evolution of the power spectrum right. Figure 34. Propeller wake evolution for a three bladed propeller: first top and second bottom step of the grouping process left. Streamwise evolution of the power spectrum right.


43 - Three-bladed propeller. In the case of the three-bladed propeller, the grouping mechanism of the tip vortices is observed to occur through a two-step process left of Figure 34. In the first step, an alternative grouping with one single and one pair of vortex filaments occurs. More downstream, a complex three-partners-one-single-one-pair leapfrogging is observed to occur, in which the single filament tends to be rolled up by the inductance effect of the filaments pair, while progressing in a second grouping with three filaments. The effect of the above mechanism is clearly show in the distribution of the power spectrum right of Figure 34. After the near wake, the spectrum shows the appearance of the first and second shaft harmonics, in addition to the fundamental frequency. Therefore, in this case, the energy transfer involves the blade harmonic and the first and second shaft harmonics, in a two-step process. Firstly, the energy content at the blade harmonic moves to the first and second shaft harmonics. Thereafter, the energy at the blade harmonic and the second shaft harmonic flows into the shaft frequency, which is the only contribution of the spectrum in the far wake. - Four-bladed propeller. The process of energy transfer of the four-bladed propeller is characterized by a two-step cascade mechanism right of Figure 35. In the first step, the energy transfer involves the contributions at the blade- and half-the-blade harmonic. Further downstream, the blade harmonic completely disappears from the spectrum and the process of energy transfer involves the contributions of the shaft frequency and half-the-blade frequency 50 Hz. This second step of the cascade runs out around x =12R and the shaft harmonic remains the only contribution in the PSD. The exponent of the power-law decay is k = 0.9, analogous to case of the three-bladed propeller. The aforementioned cascade mechanism of energy transfer is the result of double period halving process that accomplishes the grouping of two vortex filaments and two-filament-pairs in a filament-pair and a group of four-filaments, respectively left of Figure 35. Figure 35. Propeller wake evolution for a four bladed propeller left. Streamwise evolution of the power spectrum right. The mechanism of energy transfer from the blade to the shaft harmonics that characterizes the dynamics of the tip vortices is gained by a further phenomenon that concerns the precession of the propeller streamtube around the hub vortex Felli et al., In this regard, Figure 36 shows that, at the end of the transition wake, the envelope of the tip vortices trajectories, describing a cylindrical surface in a reference frame fixed along the hub vortex, tends to gradually diverge to a conical geometry when seen from a fixed reference frame. This behaviour is the consequence of the strong deformation of the hub vortex.

44 Figure 36. Precession of the propeller streamtube Noise generated from the propeller-rudder interaction The propeller-rudder interaction is a significant noise source that affects the acoustic signature of surface ships significantly both in cavitating and non-cavitating flow conditions. The main phenomena at the origin of the noise generated by the propeller-rudder interaction are basically two: - The unsteady and rotating slipstream of the propeller makes the rudder working at incidence even if rudder is made of symmetrical profiles and operates in straight condition. The local incidence at the leading edge of the rudder changes spanwise periodically and, in the case of highly loaded propeller, can be such as to cause flow separation. The contribution to the radiated noise concerns both narrowband components at the blade frequency and its harmonics as well as a broadband contribution correlated to the trailing edge noise, analogously to a propeller. - The interaction of the propeller vortices with the rudder causes a complex stress at the blade frequency that causes noise, vibrations and fatigue stresses. Such an effect is amplified for highly loaded propellers due to the stronger vortical structures of the wake. From the perspective of the radiated noise, the impact of the propeller tip vortices against the rudder excites resonances of the rudder itself and enhances significantly the radiation. A part from the above effects, the larger dynamic pressure in the wake of a propeller is such to trigger cavitation on the rudder, resulting in a dramatic increase of the noise. Recently, Felli et al performed a detailed experimental analysis about the fluctuations of the pressure field on a rudder operating in the race of a marine propeller 13. The survey aimed at investigating 13 Pressure fluctuations were measured over a grid of 144 positions 72 positions per side, 0.1R and 0.15R spaced in the vertical and chordwise directions respectively and arranged to cover the region from the z=0 to z=1.1r. Pressure transducers were ENTRAN EPN D11 relative sensor models i.e. 25 psi full range, 15 khz resonant frequency, 14 mv/psi sensitivity Signals were acquired by a Prosig P8200 acquisition system, setting the sampling rate at 40 khz and the acquisition time at 100 sec. Simultaneously, an once-per-revolution TTL trigger signal was acquired to synchronize the pressure signals with the angular position of the propeller reference blade. Specifically, the synchronization was carried out during the data processing on the base of the pressure signal and the propeller TTL time histories. Then, pressure signals were phase averaged, using a slotting technique with 360 angular intervals in which pressure samples were arranged depending on the phase delay from the last trigger signal Felli et al., Using the Direct Fourier Transform the periodically unsteady signal was decomposed into its basic components, i.e. the fundamental frequency or first harmonic, and its multiples or higher order harmonics. This allowed sorting out the phase-locked coherent flow structures from the otherwise random unsteadiness in the flow field.

45 upon the topology and the intensity of the propeller wake perturbation for different values of the rudder deflection, in non-cavitating conditions. In this regard, Figure 37 gives a quantitative estimation of the phase locked distribution of the shaft and blade harmonics of the wall-pressure on the rudder. Results are referred to three different angular positions of the propeller and zero rudder deflection. Figure 37. Pressure measurements on the rudder. Evolution of the phase averaged pressure signal reconstructed using only the blade harmonic top and the shaft harmonic bottom. During a complete propeller rotation, the mean values of the shaft harmonic exhibit the larger fluctuations correspondently to the rotation lower side of the propeller and, specifically, in the region affected from the hub vortex perturbation. A different behavior is, instead, observed in the contour plots of the blade harmonic that fluctuates periodically attaining the maximum values of the peak-to-peak distance in correspondence of the tip vortex region. The intensities of such fluctuations are estimated to be around 1% and 10% of the original signal for the shaft and blade harmonics respectively. In the study, the fundamental frequency was associated to the blade passage, which corresponded to the rotation speed times the number of blades. The statistical analysis was calculated over the 2500 propeller revolutions performed during the 100s of measurement.

46 The distribution of the shaft and blade harmonics of the pressure fluctuations is differently influenced by the deflection angle of the rudder, as highlighted in the iso-contours of Figure 38. The traces of the tip vortices and the blade trailing wakes stand out from the iso-contours of the blade harmonic. The intensities Figure 38. Phase locked evolution of the blade and shaft harmonics of the pressure field against rudder deflection color scale is applied to all the graphs of these perturbations are maximum when the rudder deflection is set at zero even though they do not experience a significant reduction when the deflection angle is kept increasing, at least until α=-15.
47 On the contrary, either the topology and the intensity of the perturbation at the shaft harmonic show a strong correlation to the deflection angle of the rudder. For values of the rudder deflection ranging from -10 to 0, the largest fluctuations are observed in the low pressure side of the rudder, with peaks localized correspondently to the region under the influence of the hub vortex, as previously mentioned. For values of the deflection angle larger than 10, the afore described topology undergoes a dramatic change, and specifically: - for rudder deflections less than a critical value, both the faces of the rudder suffer the hub vortex associated perturbation, more or less likewise. - only just over such a critical value estimable between 10 and 15 in the test case analyzed in Felli et al. 2010, the rudder surface in the shadow of the propeller wake is definitively screened from the hub perturbation. In the contour plot at α=-20 of Figure 38, the sudden disappearance of any perturbation in phase with the propeller, from about mid-chord of the suction face of the rudder iso-contours of the starboard face of the rudder in Figure 38 is indicative of the stall condition. Figure 39. Effect of cavitation type of noise spectra Sunnersjö, 1986
48 4.1.2 Hydrodynamic aspects influencing the cavitating noise. As well known, cavitation provides a dramatic increase on pressure peak values and, in general, on the noise signature. Cavitation noise has a broadband component due to the collapse of individual cavitation bubbles and a narrowband component due to fluctuations in the overall cavitation volume attached to each blade as the blade encounters different flow velocities and hydrostatic pressures through a revolution. Narrowband cavitation is at the blade passage frequency and its harmonics, whereas broadband cavitation has a wide frequency spectrum, usually peaking at around 100 Hz. Pressure fluctuations, which originate from cavitation around propeller blades and propagate to the hull, are related to phenomena like growing and collapsing of the cavity. It is generally agreed that the growth and collapse of cavitation bubbles create a monopole acoustic source mechanism, which radiates sound in an omnidirectional pattern from the oscillating bubble. Hydrodynamic flows about propellers produce other types of cavitation besides bubble cavitation. Vortex cavitation occurs in the concentrated tip and hub vortices, and sheet cavitation can occur at the propeller blade leading edge. Each of these types of cavitation may have different acoustic source strengths and source spectra. For example, back, face, hub and tip vortex cavitation types all have different noise signatures. In this regard, the noise spectra showed in Figure 39 Sunnersjö, 1986 show a wide range of different cases derived from the same propeller for four particular load conditions. Salvatore and Ianniello 2003 presented a theoretical work in which the influence of cavitation on the noise waveforms was addressed by comparing non cavitating and cavitating propeller flow results. The analysis was performed considering virtual-signals from four selected positions, located as shown in Figure 40. Figure 40 Hydrophones locations and coordinates used for the noise prediction test. Specifically, hydrophones 1 and 2 were located in the propeller plane where the monopole component is expected to be predominant, whereas hydrophones 3 and 4 are positioned downstream and upstream of the propeller disk plane respectively, where a significant contribution from the loading term is expected. Figure 41 shows the noise predictions from positions 1 and 2. At each location the comparison between cavitating and non-cavitating conditions is reported for the thickness noise component left figure, the loading term center figure and the overall noise signature right figure. Looking at the non-cavitating results of position 1 very close to the blade tip the noise signatures are exactly the expected ones: at in
49 plane locations the thickness noise exhibits a symmetrical shape and the highest negative peak value of the acoustic pressure, while the loading term has a typical waveform with some slightly smaller peak values. The most relevant differences at cavitating conditions arise from the monopole term: the occurrence of sheet cavitation corresponds to a more impulsive character of the noise waveform and some higher frequency components appear. On the contrary, the dipole contribution seems to be not altered by vaporization, but a little increase in the pressure at the angular positions affected by the cavity. Figure 41. Acoustic pressure signatures at observer 1 top and 2 bottom by FWH equation model. Comparison between cavitating and non cavitating conditions for thickness left, loading center and overall right noise predictions. Figure 42. Acoustic pressure signatures at observer 3 top and 4 bottom by FWH equation model. Comparison between cavitating and non cavitating conditions for thickness left, loading center and overall right noise predictions.


50 Figure 43. Acoustic pressure spectra by the FWH equation model as a function of blade passing frequency BPF multiples. Comparison between cavitating and non cavitating conditions. In non-cavitating conditions the loading term is predominant with respect to the thickness noise contribution out of the propeller plane hydrophones 3 and 4. The noise waveform significantly changes when a sheet cavitation occurs on the blade red lines in Figure 42. From the graphs it is worth to outline that signals from microphones 3 and 4 are practically the same, at least for the monopole component. This behavior is observed also at cavitating condition, although the presence of the vapor sheet is limited to the upper surface of the blade: this result points out the actual monopole behavior of the cavitation bubble, which acts as a pulsating sphere with a 3D homogeneous influence around the body actually. Thus, noise predictions confirm the monopole character of sheet cavity generated sound. The negligible influence of cavitation on the loading noise component is reasonable, since the pressure time histories of each source point are not heavily affected by the occurrence of cavitation. On the contrary, source-body blade plus vapour sheet geometry and the corresponding normal velocity to the body surface rapidly change during the revolution period, thus explaining the higher frequency content and the impulsive character of the resulting noise signature. The above considerations are confirmed by considering non-cavitating and cavitating overall acoustic pressure spectra, as shown by Figure 43. An useful approach to insight into either the mechanisms of pressure signal generation and the cause of the peak generation in the pressure signals from a cavitating propeller is to synchronize the

51 evolution of the cavitation, acquired by a high-speed camera system, with the propeller induced pressure fluctuations. In this regard, Figure 44 documents the relation between cavitation and pressure fluctuations as measured in a cavitation tunnel for a 4 bladed propeller Jung et al., Specifically: - The pressure signal goes up from the inception point of the cavity on a blade and reaches the gentle peak value. After the peak point, the pressure signal goes down in the middle of growing process, and finally the pressure reaches the minimum value at fully developed stage of the cavity. - After this growing process, the pressure signal hits the sharp peak through the collapsing process. Thus, it can be concluded that the entire period of the cavitation behavior could be simply divided into the two stages, the growing and the collapsing process. Figure 44 Basic relation between pressure fluctuations and cavitation Jung et al., 2009 Figure 45 Relation between volume change of bubble and generated pressure Jung et al., 2009

52 A typical example of the relation between volume change of a bubble and generated pressure is described in Figure 45. According to this figure, in the growing stage of the bubble generation, pressure gradually goes up to the lower gentle peak and, then, comes down to the minimum level. In this process, the turning point is where the volume variation experiences the inflection point. Then, the level of pressure gets down and finally reaches the minimum at the moment when the cavity has been fully developed. After the growing stage up to the maximum volume, the bubble experiences the collapsing process and correspondently the pressure goes up to the highest peak point. The correlation between the bubble volume and the induced pressure is very similar to the correlation between the cavitation and the pressure variation induced by the propeller cavitation in Figure 44. It can be found out that the pressure signal induced by the cavity has mainly two peaks, i.e. the lower gentle peak which is generated at the growing process and the higher sharp peak which is generated at the collapsing process. The signal produced by one blade of the propeller gets weaker as the cavity on this blade disappears and then, the variation of the pressure signal induced by the cavity on the following blade is detected by the pressure sensor with the growing of the cavity on the following blade. In other words, the pressure signal variation detected by the pressure sensors is the final results of the successive repeat of the cavitation phenomenon from one blade and the following blade with the rotation of the propeller. Figure 46 Relation between cavitation and pressure fluctuation signal in full scale Hoshino et al presented a similar study in which the generation mechanism of pressure fluctuations was studied both in full scale and model tests. The relation between the propeller cavity and the corresponding pressure fluctuations during one blade passage is shown in Figure 46. The growing and collapsing process of the propeller cavity during one blade passage can be easily recognized with focusing on a following blade in the 3 rd image 3. The cavitation on

53 the propeller blade consisted of sheet cavity on suction side and tip vortex cavitation mainly. The extent of the sheet cavity not exceed the 0.8R line throughout the cavity growing and collapsing processes. Pressure becomes minimum when the volume of the sheet cavity on a key blade would be maximum as shown in the first image 1. Then, the sheet cavity shrinks toward propeller tip and finally collapses into the tip vortex cavitation as shown in the following images 2~3. Next, the tip vortex cavity rebounds and collapses again, as shown in the images 4~5, and generates the second bottom and the second pressure peak. By the way, the glowing process of the sheet cavity has already started on the following blade surface. This means that since this moment, the collapsing process of the tip vortex cavity on the key blade and the growing processes of the sheet cavity on the following blade co-exist. After that, the weak rebound and collapse of the tip vortex cavity are repeated as shown in the images 6~7, and generate the third bottom and the third pressure peak. Figure 47 Relation between cavitation and pressure fluctuation signal in model test A similar analysis is documented in Figure 47 in model scale, for the same propeller. In this figure, the lines on the blade surface indicate the specific radial position i.e., the lowest line is at r=0.5r and the interval between two lines corresponds to 0.1R except for the last line around tip that is at r=0.95r. The cavitation on the propeller blade consists of a sheet cavity on the suction side and tip vortex cavitation mainly, similarly to what observed in full scale. On the other hand, the extent of sheet cavity in model tests is wider than that in full scale i.e. it exceeds the line at r=0.8r. As mentioned above, the volume of the cavity would become maximum on the key blade in the first image 1 when the pressure drops to a minimum but it is not so clear in model test as in full scale. Similar to the cavitation in full scale, the sheet cavity shrinks toward propeller tip and finally collapses into the tip vortex cavitation as shown in the following images 2~3. At this instant, the maximum sharp pressure peak is generated by the collapse of the sheet cavity. Then, the tip vortex cavity rebounds and collapses again, and


54 generates the second bottom and the second pressure peak. Unfortunately, the rebounds of the tip vortex cavity are not clearly observed in the images 4~5, because the tip vortex cavitation of the key blade is hidden by the following blade. After that, the rebound and collapse of the tip vortex cavity would be repeated and generate the third bottom and the small pressure peak. According to the first image 1, when the volume of the cavity on the key blade becomes maximum, the glowing process of the sheet cavity has already started on the following blade surface. This process is faster than in full scale highlighting that the collapsing process of the cavity on the key blade and the growing processes of the sheet cavity on the following blade co-exist longer in model scale. Figure 48 Analysis of a single blade passage. Top-left: time frequency analysis using a Morlet wavelet with time trace. Bottom-left: FFT-spectrum. Right: images of the collapse of the cavitating vortex. Image a through d correspond to the annotations in the time trace of the graph on the top-left side of the figure. An investigation of model scale hull pressure fluctuations generated by a cavitating vortex on a two-bladed propeller operating in the wake field of a twin screw vessel was performed by Bosschers 2009 in the Depressurized towing tank of MARIN. Experiments concerned model scale measurements of the hull pressure fluctuations generated by a cavitating tip vortex of a marine propeller and time resolved visualizations. Experiments have allowed to draw the following conclusions: A stochastic analysis of the pressure signals outlined that both the amplitude and the frequency of the maximum crest-trough value of the pressure fluctuations vary significantly between blade passages. This leads to a reduction of the tonals at the higher harmonics of the blade passage frequencies in the amplitude spectrum and the formation of a broadband hump.
55 Wavelet analysis of the pressure signal of one blade passage showed a narrowband signal of which the frequency increased with time during the collapse and rebounds of the cavitating vortex, indicating the presence of a resonance frequency. The FFT spectrum of this signal showed a broadband hump in the frequency range. Four high speed video images showing the character of the cavitating vortex are presented in Figure 48. The cavity pattern is characterized by a strong cavitating leading edge vortex which sometimes develops as a small sheet with a re-entrant jet oriented parallel to the leading edge forming a cavitating vortex structure. During the first collapse, between image a and image b, multiple cavitating vortices are generated coming from the tip and the re-entrant jet of the leading edge vortex. These vortices interact causing rebounds as observed in image c and image d.
56 5 REFERENCES 1. Atlar, M., Recent upgrading of marine testing facilities at Newcastle University, AMT 11 Conference Proceedings, Newcastle University, April Bluer & Kjaer website: 3. Bosschers J., Modeling and analysis of a cavitating vortex in 2D unsteady viscous flow, CAV2009, Ann Arbor, Michigan, USA. 4. Carlton J., Marine Propellers and propulsion, Butterworth-Heinemann Elsevier, De Jong, C.A.F., Bosschers, J. and Hasenpflug, H., Model scale measurements of surface ship radiated flow noise. NAG/DAGA 2009 conference, Rotterdam, the Netherlands. 6. Di Felice F, Di Florio D, Felli M, Romano G.P. Experimental Investigation of the Propeller Wake at Different Loading Conditions by Particle Image Velocimetry. Journal of Ship Research.vol.48, N.2, , Emerson Cavitation Tunnel website: 8. Felli M., Camussi R., Di Felice F., Mechanisms of evolution of the propeller wake in the transition and far fields, In press on Journal of Fluid Mechanics, Felli M., Di Felice F., Propeller wake analysis in non-uniform inflow by LDV phase sampling techniques, Journal of Marine Science and Technology, Vol.10, N.4, pp , Felli M., Di Felice F., Guj G., Camussi R., Analysis of the propeller wake evolution by pressure and velocity phase measurements. Experiments in fluids, N.1, 1-11, Friesch J., Die Nutzung des Kavitationstunnels HYKAT im Bereich der Wehrtechnik SEE, STG- Sprechtag, 2 February Hoschino T. and Oshima A. Measurement of flow field around propeller by using a 3-component laser Doppler velocimeter ; Mitsubishi Technical Review, Vol. 24, No. 1, Hoshino T., Jung J., Kim J., Lee J., Han J. and Park H., Full Scale Cavitation Observations and Pressure Fluctuation Measurements by High-Speed Camera System and Correlation with Model Test, IPS 10, Okayama, Japan, April HSVA website: INSEAN website: Jung, J., Lee, S.J. and Han, J.M., Study on Correlation between Cavitation and Pressure Fluctuation Signal Using High-Speed Camera System, Proceedings of the 7th International Symposium on Cavitation, Ann Arbor, Michigan, Kinns R., Thompson I., Kessissoglou N., Tso Y., Hull Vibratory Forces Transmitted via the Fluid and the Shaft from a Submarine Propeller, 5th International Conference on High Performance Marine Vehicles, 8-10 November, 2006, Australia 18. M. Felli, M. Falchi, F. Pereira, and F. Di Felice, Dynamics of the propeller wake structures interacting with a rudder, Proceedings of the 28-th Symposium on Naval Hydrodynamics, September, Pasadena, USA. 19. MARIN website: PCB Piezotronics website: RESON website: Ross, D., Mechanics of Underwater Noise, Peninsula Publishing, Los Altos, Salvatore F., Ianniello S., Preliminary Results on Acoustic Modelling of Cavitating Propellers, Computational Mechanics, 32, 46, pp , Sunnersjö, S. Propeller noise prediction, SSPA Highlights, 2, Van der Kooij, J. and de Bruijn, A. 1984, Acoustic measurements in the NSMB Depressurized Towing Tank. International Shipbuilding Progress Vol. 31, No. 353, January 1984.
57 APPENDIX A: data sheets of the instrumentation for noise measurements A.1 Hydrophones A.1.1. Bluer & Kjiaer


58 A.1.2 RESON A Model TC4014 A Model TC4032
59 A Elac Nautik Model KE2 A PCB 103M49

60 A PCB 106B51


61 A.2 Other instrumentation A.2.1 B&K PULSE multi-analyser System Type 3560C A.2.2 B&K Type 3032A Input/output module
About Doppler-Fizeau effect on radiated noise from a rotating source in cavitation tunnel
 PROCEEDINGS of the 22 nd International Congress on Acoustics Signal Processing in Acoustics (others): Paper ICA2016-111 About Doppler-Fizeau effect on radiated noise from a rotating source in cavitation
Radiated Noise of Research Vessels
 Radiated Noise of Research Vessels Greening the Research Fleet Workshop 10 January 2012 Christopher Barber Applied Research Laboratory Penn State University Ship Radiated Noise What makes noise? Propulsion
UNDERWATER SHIP PASSPORT IGNACY GLOZA
 UNDERWATER SHIP PASSPORT IGNACY GLOZA Naval University of Gdynia 81-103 Gdynia, Śmidowicza 69, Poland igloza@amw.gdynia.pl For years in the Polish Navy extensive measurements have been made of the underwater-radiated
Attenuation of low frequency underwater noise using arrays of air-filled resonators
 Attenuation of low frequency underwater noise using arrays of air-filled resonators Mark S. WOCHNER 1 Kevin M. LEE 2 ; Andrew R. MCNEESE 2 ; Preston S. WILSON 3 1 AdBm Corp, 3925 W. Braker Ln, 3 rd Floor,
Experimental Investigation of Unsteady Pressure on an Axial Compressor Rotor Blade Surface
 Energy and Power Engineering, 2010, 2, 131-136 doi:10.4236/epe.2010.22019 Published Online May 2010 (http://www. SciRP.org/journal/epe) 131 Experimental Investigation of Unsteady Pressure on an Axial Compressor
THE USE OF VOLUME VELOCITY SOURCE IN TRANSFER MEASUREMENTS
 THE USE OF VOLUME VELOITY SOURE IN TRANSFER MEASUREMENTS N. Møller, S. Gade and J. Hald Brüel & Kjær Sound and Vibration Measurements A/S DK850 Nærum, Denmark nbmoller@bksv.com Abstract In the automotive
ANALYTICAL NOISE MODELLING OF A CENTRIFUGAL FAN VALIDATED BY EXPERIMENTAL DATA
 ANALYTICAL NOISE MODELLING OF A CENTRIFUGAL FAN VALIDATED BY EXPERIMENTAL DATA Beatrice Faverjon 1, Con Doolan 1, Danielle Moreau 1, Paul Croaker 1 and Nathan Kinkaid 1 1 School of Mechanical and Manufacturing
Da-Qing Li Jan Hallander and Roger Karlsson SSPA Sweden AB, Göteborg, Sweden
 Progress in Predicting Pressure Pulses and Underwater Radiated Noise Induced by Propeller with Pressure Side Cavitation Introduction Da-Qing Li (da-qing.li@sspa.se), Jan Hallander (jan.hallander@sspa.se)
Noise from Pulsating Supercavities Prepared by:
 Noise from Pulsating Supercavities Prepared by: Timothy A. Brungart Samuel E. Hansford Jules W. Lindau Michael J. Moeny Grant M. Skidmore Applied Research Laboratory The Pennsylvania State University Flow
Multi-channel Active Control of Axial Cooling Fan Noise
 The 2002 International Congress and Exposition on Noise Control Engineering Dearborn, MI, USA. August 19-21, 2002 Multi-channel Active Control of Axial Cooling Fan Noise Kent L. Gee and Scott D. Sommerfeldt
ACOUSTIC PROPERTIES OF THE VIRGINIA TECH STABILITY WIND TUNNEL
 ACOUSTIC PROPERTIES OF THE VIRGINIA TECH STABILITY WIND TUNNEL December 6th, 1999 Jon Vegard Larssen and William J. Devenport Department of Aerospace and Ocean Engineering Virginia Polytechnic Institute
Project Report Liquid Robotics, Inc. Integration and Use of a High-frequency Acoustic Recording Package (HARP) on a Wave Glider
 on a Wave Glider") Project Report Liquid Robotics, Inc. Integration and Use of a High-frequency Acoustic Recording Package (HARP) on a Wave Glider Sean M. Wiggins Marine Physical Laboratory Scripps Institution of Oceanography
Project Report Liquid Robotics, Inc. Integration and Use of a High-frequency Acoustic Recording Package (HARP) on a Wave Glider Sean M. Wiggins Marine Physical Laboratory Scripps Institution of Oceanography
ECMA-108. Measurement of Highfrequency. emitted by Information Technology and Telecommunications Equipment. 4 th Edition / December 2008
 ECMA-108 4 th Edition / December 2008 Measurement of Highfrequency Noise emitted by Information Technology and Telecommunications Equipment COPYRIGHT PROTECTED DOCUMENT Ecma International 2008 Standard
CHAPTER 3 THE DESIGN OF TRANSMISSION LOSS SUITE AND EXPERIMENTAL DETAILS
 35 CHAPTER 3 THE DESIGN OF TRANSMISSION LOSS SUITE AND EXPERIMENTAL DETAILS 3.1 INTRODUCTION This chapter deals with the details of the design and construction of transmission loss suite, measurement details
Form of Written Discussion at the 27th ITTC Conference
 Borusevich Valery Krylov State Research Centre of Technical Committee ITTC intend to provide the procedures as generic as possible for wide applications. But useful for practical purposes. Questionnaire
PeakVue Analysis for Antifriction Bearing Fault Detection
 Machinery Health PeakVue Analysis for Antifriction Bearing Fault Detection Peak values (PeakVue) are observed over sequential discrete time intervals, captured, and analyzed. The analyses are the (a) peak
Instrumentation (ch. 4 in Lecture notes)
") TMR7 Experimental methods in Marine Hydrodynamics week 35 Instrumentation (ch. 4 in Lecture notes) Measurement systems short introduction Measurement using strain gauges Calibration Data acquisition Different
TMR7 Experimental methods in Marine Hydrodynamics week 35 Instrumentation (ch. 4 in Lecture notes) Measurement systems short introduction Measurement using strain gauges Calibration Data acquisition Different
VIBROACOUSTIC MEASURMENT FOR BEARING FAULT DETECTION ON HIGH SPEED TRAINS
 VIBROACOUSTIC MEASURMENT FOR BEARING FAULT DETECTION ON HIGH SPEED TRAINS S. BELLAJ (1), A.POUZET (2), C.MELLET (3), R.VIONNET (4), D.CHAVANCE (5) (1) SNCF, Test Department, 21 Avenue du Président Salvador
PRODUCT DATA. Applications. Uses
 PRODUCT DATA Impedance Tube Kit (50 Hz 6.4 khz) Type 4206 Impedance Tube Kit (100 Hz 3.2 khz) Type 4206-A Transmission Loss Tube Kit (50 Hz 6.4 khz) Type 4206-T Brüel & Kjær offers a complete range of
Radiated Noise of Research Vessels
 Radiated Noise of Research Vessels A multidisciplinary Acoustics and Vibration problem CAV Workshop 15 May 2012 Christopher Barber Applied Research Laboratory Penn State University Ship Radiated Noise
Response spectrum Time history Power Spectral Density, PSD
 A description is given of one way to implement an earthquake test where the test severities are specified by time histories. The test is done by using a biaxial computer aided servohydraulic test rig.
CHARACTERIZATION AND FIRST APPLICATION OF A THIN-FILM ELECTRET UNSTEADY PRESSURE MEASUREMENT TECHNIQUE
 XIX Biannual Symposium on Measuring Techniques in Turbomachinery Transonic and Supersonic Flow in CHARACTERIZATION AND FIRST APPLICATION OF A THIN-FILM ELECTRET UNSTEADY PRESSURE MEASUREMENT TECHNIQUE
COOMET Pilot Comparison 473/RU-a/09: Comparison of hydrophone calibrations in the frequency range 250 Hz to 200 khz
 COOMET Pilot Comparison 473/RU-a/09: Comparison of hydrophone calibrations in the frequency range 250 Hz to 200 khz Chen Yi 1, A E Isaev 2, Wang Yuebing 1, A M Enyakov 2, Fei Teng 1 and A N Matveev 2 1
CHAPTER 6 EMI EMC MEASUREMENTS AND STANDARDS FOR TRACKED VEHICLES (MIL APPLICATION)
") 147 CHAPTER 6 EMI EMC MEASUREMENTS AND STANDARDS FOR TRACKED VEHICLES (MIL APPLICATION) 6.1 INTRODUCTION The electrical and electronic devices, circuits and systems are capable of emitting the electromagnetic
147 CHAPTER 6 EMI EMC MEASUREMENTS AND STANDARDS FOR TRACKED VEHICLES (MIL APPLICATION) 6.1 INTRODUCTION The electrical and electronic devices, circuits and systems are capable of emitting the electromagnetic
CHAPTER 7 FAULT DIAGNOSIS OF CENTRIFUGAL PUMP AND IMPLEMENTATION OF ACTIVELY TUNED DYNAMIC VIBRATION ABSORBER IN PIPING APPLICATION
 125 CHAPTER 7 FAULT DIAGNOSIS OF CENTRIFUGAL PUMP AND IMPLEMENTATION OF ACTIVELY TUNED DYNAMIC VIBRATION ABSORBER IN PIPING APPLICATION 7.1 INTRODUCTION Vibration due to defective parts in a pump can be
Product and Measurement Solutions for the Automotive Industry
 Product and Measurement Solutions for the Automotive Industry Car body and vehicle related measurement solutions P.4-5 Acceleration noise measurement Acceleration Noise Measurement System Measurement of
Characterization of High Q Spherical Resonators
 Characterization of High Q Spherical Resonators Kenneth Bader, Jason Raymond, Joel Mobley University of Mississippi Felipe Gaitan, Ross Tessien, Robert Hiller Impulse Devices, Inc. Grass Valley, CA Physics
Correlation Between Measured and Simulated Parameters of a Proposed Transfer Standard
 Correlation Between Measured and Simulated Parameters of a Proposed Transfer Standard Jim Nadolny AMP Incorporated ABSTRACT Total radiated power of a device can be measured using a mode stirred chamber
A minimum hydrophone bandwidth for undistorted cavitation noise measurement
 13. 15. května 2008 A minimum hydrophone bandwidth for undistorted cavitation noise measurement Karel Vokurka a, Silvano Buogo b a Physics Department, Technical University of Liberec, Studentská 2, 461
Module 3: Velocity Measurement Lecture 13: Two wire hotwire measurement. The Lecture Contains: Hotwire Anemometry. Electromagnetic Actuator
 The Lecture Contains: Hotwire Anemometry Hotwire Probes CTA Bridge and Accessories Data Acquisition System Electromagnetic Actuator Auxiliary Instruments Digital Micromanometer Digital Multimeter Spectrum
On the accuracy reciprocal and direct vibro-acoustic transfer-function measurements on vehicles for lower and medium frequencies
 On the accuracy reciprocal and direct vibro-acoustic transfer-function measurements on vehicles for lower and medium frequencies C. Coster, D. Nagahata, P.J.G. van der Linden LMS International nv, Engineering
inter.noise 2000 The 29th International Congress and Exhibition on Noise Control Engineering August 2000, Nice, FRANCE
 Copyright SFA - InterNoise 2000 1 inter.noise 2000 The 29th International Congress and Exhibition on Noise Control Engineering 27-30 August 2000, Nice, FRANCE I-INCE Classification: 7.2 MICROPHONE ARRAY
Modal Parameter Estimation Using Acoustic Modal Analysis
 Proceedings of the IMAC-XXVIII February 1 4, 2010, Jacksonville, Florida USA 2010 Society for Experimental Mechanics Inc. Modal Parameter Estimation Using Acoustic Modal Analysis W. Elwali, H. Satakopan,
Downloaded 09/04/18 to Redistribution subject to SEG license or copyright; see Terms of Use at
 Processing of data with continuous source and receiver side wavefields - Real data examples Tilman Klüver* (PGS), Stian Hegna (PGS), and Jostein Lima (PGS) Summary In this paper, we describe the processing
Module 1: Introduction to Experimental Techniques Lecture 2: Sources of error. The Lecture Contains: Sources of Error in Measurement
 The Lecture Contains: Sources of Error in Measurement Signal-To-Noise Ratio Analog-to-Digital Conversion of Measurement Data A/D Conversion Digitalization Errors due to A/D Conversion file:///g /optical_measurement/lecture2/2_1.htm[5/7/2012
Transfer Function (TRF)
") (TRF) Module of the KLIPPEL R&D SYSTEM S7 FEATURES Combines linear and nonlinear measurements Provides impulse response and energy-time curve (ETC) Measures linear transfer function and harmonic distortions
(TRF) Module of the KLIPPEL R&D SYSTEM S7 FEATURES Combines linear and nonlinear measurements Provides impulse response and energy-time curve (ETC) Measures linear transfer function and harmonic distortions
Vibration Fundamentals Training System
 Vibration Fundamentals Training System Hands-On Turnkey System for Teaching Vibration Fundamentals An Ideal Tool for Optimizing Your Vibration Class Curriculum The Vibration Fundamentals Training System
Application Note. Airbag Noise Measurements
 Airbag Noise Measurements Headquarters Skovlytoften 33 2840 Holte Denmark Tel: +45 45 66 40 46 E-mail: gras@gras.dk Web: gras.dk Airbag Noise Measurements* Per Rasmussen When an airbag inflates rapidly
EXPERIMENTAL INVESTIGATIONS OF DIFFERENT MICROPHONE INSTALLATIONS FOR ACTIVE NOISE CONTROL IN DUCTS
 EXPERIMENTAL INVESTIGATIONS OF DIFFERENT MICROPHONE INSTALLATIONS FOR ACTIVE NOISE CONTROL IN DUCTS M. Larsson, S. Johansson, L. Håkansson and I. Claesson Department of Signal Processing Blekinge Institute
P R O D U C T D A T A
 P R O D U C T D A T A PULSE Acoustic Material Testing in a Tube Type 7758 PULSE Acoustic Material Testing in a Tube Type 7758 is software for determining the acoustical properties of noise control materials
CHAPTER 7 HARDWARE IMPLEMENTATION
 168 CHAPTER 7 HARDWARE IMPLEMENTATION 7.1 OVERVIEW In the previous chapters discussed about the design and simulation of Discrete controller for ZVS Buck, Interleaved Boost, Buck-Boost, Double Frequency
Applicability of Ultrasonic Pulsed Doppler for Fast Flow-Metering
 Applicability of Ultrasonic Pulsed Doppler for Fast Flow-Metering Stéphane Fischer (1), Claude Rebattet (2) and Damien Dufour (1), (1) UBERTONE SAS, 4 rue Boussingault Strasbourg, France, www.ubertone.com
OBSERVATIONS OF THE DYNAMICS AND ACOUSTICS OF ATTACHED CAVITIES
 OBSERVATIONS OF THE DYNAMICS AND ACOUSTICS OF ATTACHED CAVITIES S. L. Ceccio and C. E. Brennen California Institute of Technology Pasadena, California Abstract In this study of attached cavities on an
NON CONTACT VIBRATION MEASUREMENTS ON PARABOLIC SURFACE ANTENNA. Dorin Simoiu 1, Liviu Bereteu 1
 Analele Universităţii de Vest din Timişoara Vol. LVII, 2013 Seria Fizică NON CONTACT VIBRATION MEASUREMENTS ON PARABOLIC SURFACE ANTENNA Dorin Simoiu 1, Liviu Bereteu 1 1 Mechanical and Vibration Department,
Monitoring The Machine Elements In Lathe Using Vibration Signals
 Monitoring The Machine Elements In Lathe Using Vibration Signals Jagadish. M. S. and H. V. Ravindra Dept. of Mech. Engg. P.E.S.C.E. Mandya 571 401. ABSTRACT: In any manufacturing industry, machine tools
HIGH FREQUENCY INTENSITY FLUCTUATIONS
 Proceedings of the Seventh European Conference on Underwater Acoustics, ECUA 004 Delft, The Netherlands 5-8 July, 004 HIGH FREQUENCY INTENSITY FLUCTUATIONS S.D. Lutz, D.L. Bradley, and R.L. Culver Steven
Phased Array Velocity Sensor Operational Advantages and Data Analysis
 Phased Array Velocity Sensor Operational Advantages and Data Analysis Matt Burdyny, Omer Poroy and Dr. Peter Spain Abstract - In recent years the underwater navigation industry has expanded into more diverse
An experimental investigation of cavity noise control using mistuned Helmholtz resonators
 An experimental investigation of cavity noise control using mistuned Helmholtz resonators ABSTRACT V Surya Narayana Reddi CHINTAPALLI; Chandramouli PADMANABHAN 1 Machine Design Section, Department of Mechanical
In situ assessment of the normal incidence sound absorption coefficient of asphalt mixtures with a new impedance tube
 Invited Paper In situ assessment of the normal incidence sound absorption coefficient of asphalt mixtures with a new impedance tube Freitas E. 1, Raimundo I. 1, Inácio O. 2, Pereira P. 1 1 Universidade
430. The Research System for Vibration Analysis in Domestic Installation Pipes
 430. The Research System for Vibration Analysis in Domestic Installation Pipes R. Ramanauskas, D. Gailius, V. Augutis Kaunas University of Technology, Studentu str. 50, LT-51424, Kaunas, Lithuania e-mail:
Industrial vibration sensor selection: Piezovelocity transducers
 Industrial vibration sensor selection: Piezovelocity transducers In many industrial monitoring applications, piezovelocity transducers have distinct advantages over piezoelectric accelerometers and traditional
Scaled Laboratory Experiments of Shallow Water Acoustic Propagation
 Scaled Laboratory Experiments of Shallow Water Acoustic Propagation Panagiotis Papadakis, Michael Taroudakis FORTH/IACM, P.O.Box 1527, 711 10 Heraklion, Crete, Greece e-mail: taroud@iacm.forth.gr Patrick
CHARACTERISTICS OF AERODYNAMIC NOISE FROM THE INTER-COACH SPACING OF A HIGH-SPEED TRAIN. Woulam-dong, Uiwang-city, Gyunggi-do, Korea,
 ICSV14 Cairns Australia 9-12 July, 2007 CHARACTERISTICS OF AERODYNAMIC NOISE FROM THE INTER-COACH SPACING OF A HIGH-SPEED TRAIN Sunghoon Choi 1, Hyoin Koh 1, Chan-Kyung Park 1, and Junhong Park 2 1 Korea
Comparison of IC Conducted Emission Measurement Methods
 IEEE TRANSACTIONS ON INSTRUMENTATION AND MEASUREMENT, VOL. 52, NO. 3, JUNE 2003 839 Comparison of IC Conducted Emission Measurement Methods Franco Fiori, Member, IEEE, and Francesco Musolino, Member, IEEE
Optical Encoder Applications for Vibration Analysis
 Optical Encoder Applications for Vibration Analysis Jack D. Peters Accelent Technology LLC 19 Olde Harbour Trail Rochester, New York, 14612 jack4accelent@aol.com Abstract: The application and use of an
Texas Components - Data Sheet. The TX53G1 is an extremely rugged, low distortion, wide dynamic range sensor. suspending Fluid.
 Texas Components - Data Sheet AN004 REV A 08/30/99 DESCRIPTION and CHARACTERISTICS of the TX53G1 HIGH PERFORMANCE GEOPHONE The TX53G1 is an extremely rugged, low distortion, wide dynamic range sensor.
Underwater Noise Generated by a Small Ship in the Shallow Sea
 ARCHIVES OF ACOUSTICS Vol.38,No.3, pp.351 356(2013) Copyright c 2013byPAN IPPT DOI: 10.2478/aoa-2013-0041 Underwater Noise Generated by a Small Ship in the Shallow Sea GrażynaGRELOWSKA (1),(2),EugeniuszKOZACZKA
APPLICATIONS OF PORTABLE NEAR-FIELD ANTENNA MEASUREMENT SYSTEMS
 APPLICATIONS OF PORTABLE NEAR-FIELD ANTENNA MEASUREMENT SYSTEMS Greg Hindman Nearfield Systems Inc. 1330 E. 223rd Street Bldg. 524 Carson, CA 90745 (213) 518-4277 ABSTRACT Portable near-field measurement
ECMA-108. Measurement of Highfrequency. emitted by Information Technology and Telecommunications Equipment. 5 th Edition / December 2010
 ECMA-108 5 th Edition / December 2010 Measurement of Highfrequency Noise emitted by Information Technology and Telecommunications Equipment Reference number ECMA-123:2009 Ecma International 2009 COPYRIGHT
A SYSTEM IMPLEMENTATION OF AN ACTIVE NOISE CONTROL SYSTEM COMBINED WITH PASSIVE SILENCERS FOR IMPROVED NOISE REDUCTION IN DUCTS SUMMARY INTRODUCTION
 A SYSTEM IMPLEMENTATION OF AN ACTIVE NOISE CONTROL SYSTEM COMBINED WITH PASSIVE SILENCERS FOR IMPROVED NOISE REDUCTION IN DUCTS Martin LARSSON, Sven JOHANSSON, Lars HÅKANSSON, Ingvar CLAESSON Blekinge
OPERATION AND MAINTENANCE MANUAL TRIAXIAL ACCELEROMETER MODEL PA-23 STOCK NO
 OPERATION AND MAINTENANCE MANUAL TRIAXIAL ACCELEROMETER MODEL PA-23 STOCK NO. 990-60700-9801 GEOTECH INSTRUMENTS, LLC 10755 SANDEN DRIVE DALLAS, TEXAS 75238-1336 TEL: (214) 221-0000 FAX: (214) 343-4400
PRIMARY LOOP ACOUSTIC EMISSION PROCEDURE: AN UPGRADED METHOD AND ITS CONSEQUENCES ON THE IN-SERVICE-INSPECTION
 PRIMARY LOOP ACOUSTIC EMISSION PROCEDURE: AN UPGRADED METHOD AND ITS CONSEQUENCES ON THE IN-SERVICE-INSPECTION Laurent Truchetti, Yann Forestier, Marc Beaumont EDF CEIDRE, EDF Nuclear Engineering Division;
1. Enumerate the most commonly used engineering materials and state some important properties and their engineering applications.
 Code No: R05310305 Set No. 1 III B.Tech I Semester Regular Examinations, November 2008 DESIGN OF MACHINE MEMBERS-I ( Common to Mechanical Engineering and Production Engineering) Time: 3 hours Max Marks:
Selection and Calibration of Acoustic Sensors
 Selection and Calibration of Acoustic Sensors Tamil Chandran. A Senior Research Engineer Fluid Control Research Institute Palakkad, India Surendran. P Chief Research Engineer Fluid Control Research Institute
AERODYNAMIC NOISE RADIATED BY THE INTERCOACH SPACING AND THE BOGIE OF A HIGH-SPEED TRAIN
 Journal of Sound and
THE high level of nuisance noise generated by the take-off and landing of aircraft has a significant impact on the communities
 Bluff Body Noise and Flow Control with Atmospheric Plasma Actuators Xun Huang Xin Zhang and Steve Gabriel University of Southampton, Southampton, SO7 BJ, United Kingdom Plasma actuators operating in atmospheric
Isolation Scanner. Advanced evaluation of wellbore integrity
 Isolation Scanner Advanced evaluation of wellbore integrity Isolation Scanner* cement evaluation service integrates the conventional pulse-echo technique with flexural wave propagation to fully characterize
An Alternative to Pyrotechnic Testing For Shock Identification
 An Alternative to Pyrotechnic Testing For Shock Identification J. J. Titulaer B. R. Allen J. R. Maly CSA Engineering, Inc. 2565 Leghorn Street Mountain View, CA 94043 ABSTRACT The ability to produce a
A Method for Gain over Temperature Measurements Using Two Hot Noise Sources
 A Method for Gain over Temperature Measurements Using Two Hot Noise Sources Vince Rodriguez and Charles Osborne MI Technologies: Suwanee, 30024 GA, USA vrodriguez@mitechnologies.com Abstract P Gain over
Industrial vibration sensor selection: piezovelocity transducers
 Industrial vibration sensor selection: piezovelocity transducers In many industrial monitoring applications, piezovelocity transducers have distinct advantages over piezoelectric accelerometers and traditional
Laboratory Experiment #2 Frequency Response Measurements
 J.B.Francis College of Engineering Mechanical Engineering Department 22-403 Laboratory Experiment #2 Frequency Response Measurements Introduction It is known from dynamic systems that a structure temporarily
Modeling and Control of Mold Oscillation
 ANNUAL REPORT UIUC, August 8, Modeling and Control of Mold Oscillation Vivek Natarajan (Ph.D. Student), Joseph Bentsman Department of Mechanical Science and Engineering University of Illinois at UrbanaChampaign
Geophysical Applications Seismic Reflection Surveying
 Seismic sources and receivers Basic requirements for a seismic source Typical sources on land and on water Basic impact assessment environmental and social concerns EPS435-Potential-08-01 Basic requirements
Validation of lateral fraction results in room acoustic measurements
 Validation of lateral fraction results in room acoustic measurements Daniel PROTHEROE 1 ; Christopher DAY 2 1, 2 Marshall Day Acoustics, New Zealand ABSTRACT The early lateral energy fraction (LF) is one
Underwater noise measurements in the North Sea in and near the Princess Amalia Wind Farm in operation
 Underwater noise measurements in the North Sea in and near the Princess Amalia Wind Farm in operation Erwin JANSEN 1 ; Christ DE JONG 2 1,2 TNO Technical Sciences, Netherlands ABSTRACT The Princess Amalia
Instruction manual for T3DS software. Tool for THz Time-Domain Spectroscopy. Release 4.0
 Instruction manual for T3DS software Release 4.0 Table of contents 0. Setup... 3 1. Start-up... 5 2. Input parameters and delay line control... 6 3. Slow scan measurement... 8 4. Fast scan measurement...
The Tracking and Trending Module collects the reduced data for trending in a single datafile (around 10,000 coils typical working maximum).
.") AVAS VIBRATION MONITORING SYSTEM TRACKING AND TRENDING MODULE 1. Overview of the AVAS Tracking and Trending Module The AVAS Tracking and Trending Module performs a data-acquisition and analysis activity,
AVAS VIBRATION MONITORING SYSTEM TRACKING AND TRENDING MODULE 1. Overview of the AVAS Tracking and Trending Module The AVAS Tracking and Trending Module performs a data-acquisition and analysis activity,
How to perform transfer path analysis
 Siemens PLM Software How to perform transfer path analysis How are transfer paths measured To create a TPA model the global system has to be divided into an active and a passive part, the former containing
A SIMPLE METHOD TO COMPARE THE SENSITIVITY OF DIFFERENT AE SENSORS FOR TANK FLOOR TESTING
 A SIMPLE METHOD TO COMPARE THE SENSITIVITY OF DIFFERENT AE SENSORS FOR TANK FLOOR TESTING HARTMUT VALLEN, JOCHEN VALLEN and JENS FORKER Vallen-Systeme GmbH, 82057 Icking, Germany Abstract AE testing of
Resonance Tube. 1 Purpose. 2 Theory. 2.1 Air As A Spring. 2.2 Traveling Sound Waves in Air
 Resonance Tube Equipment Capstone, complete resonance tube (tube, piston assembly, speaker stand, piston stand, mike with adapters, channel), voltage sensor, 1.5 m leads (2), (room) thermometer, flat rubber
MAKING TRANSIENT ANTENNA MEASUREMENTS
 MAKING TRANSIENT ANTENNA MEASUREMENTS Roger Dygert, Steven R. Nichols MI Technologies, 1125 Satellite Boulevard, Suite 100 Suwanee, GA 30024-4629 ABSTRACT In addition to steady state performance, antennas
inter.noise 2000 The 29th International Congress and Exhibition on Noise Control Engineering August 2000, Nice, FRANCE
 Copyright SFA - InterNoise 2000 1 inter.noise 2000 The 29th International Congress and Exhibition on Noise Control Engineering 27-30 August 2000, Nice, FRANCE I-INCE Classification: 7.2 MICROPHONE T-ARRAY
CIRCULAR PHASED ARRAY PROBES FOR INSPECTION OF SUPERPHOENIX STEAM GENERATOR TUBES
 CIRCULAR PHASED ARRAY PROBES FOR INSPECTION OF SUPERPHOENIX STEAM GENERATOR TUBES G. Fleury, J. Poguet Imasonic S.A. France O. Burat, G Moreau Framatome France Abstract An ultrasonic Phased Array system
Resonance Tube Lab 9
 HB 03-30-01 Resonance Tube Lab 9 1 Resonance Tube Lab 9 Equipment SWS, complete resonance tube (tube, piston assembly, speaker stand, piston stand, mike with adaptors, channel), voltage sensor, 1.5 m leads
PRODUCT DATA USES. BENEFITS Normal incidence parameters are determined Fast and accurate measurements. Type 4206A. Type Type 4206T 50 Hz 1.
 PRODUCT DATA Impedance Tube Kit (50 Hz 6.4 khz) Type 4206 Impedance Tube Kit (100 Hz 3.2 khz) Type 4206 A Transmission Loss Tube Kit (50 Hz 6.4 khz) Type 4206 T Brüel & Kjær offers a complete range of
A FEEDFORWARD ACTIVE NOISE CONTROL SYSTEM FOR DUCTS USING A PASSIVE SILENCER TO REDUCE ACOUSTIC FEEDBACK
 ICSV14 Cairns Australia 9-12 July, 27 A FEEDFORWARD ACTIVE NOISE CONTROL SYSTEM FOR DUCTS USING A PASSIVE SILENCER TO REDUCE ACOUSTIC FEEDBACK Abstract M. Larsson, S. Johansson, L. Håkansson, I. Claesson
Part 2: Second order systems: cantilever response
 - cantilever response slide 1 Part 2: Second order systems: cantilever response Goals: Understand the behavior and how to characterize second order measurement systems Learn how to operate: function generator,
Acoustic characteristics of annular jets
 Acoustic characteristics of annular jets Krishna Chaitanya BELLIDEGA 1 ; Abhijit DHAMANEKAR 2 ; K. SRINIVASAN 3 Indian Institute of Technology Madras, India ABSTRACT Annular jets are widely usen gas turbines
PERFORMANCE OF A NEW MEMS MEASUREMENT MICROPHONE AND ITS POTENTIAL APPLICATION
 PERFORMANCE OF A NEW MEMS MEASUREMENT MICROPHONE AND ITS POTENTIAL APPLICATION R Barham M Goldsmith National Physical Laboratory, Teddington, Middlesex, UK Teddington, Middlesex, UK 1 INTRODUCTION In deciding
Multi-spectral acoustical imaging
 Multi-spectral acoustical imaging Kentaro NAKAMURA 1 ; Xinhua GUO 2 1 Tokyo Institute of Technology, Japan 2 University of Technology, China ABSTRACT Visualization of object through acoustic waves is generally
A White Paper on Danley Sound Labs Tapped Horn and Synergy Horn Technologies
 Tapped Horn (patent pending) Horns have been used for decades in sound reinforcement to increase the loading on the loudspeaker driver. This is done to increase the power transfer from the driver to the
NON-SELLABLE PRODUCT DATA. Order Analysis Type 7702 for PULSE, the Multi-analyzer System. Uses and Features
 PRODUCT DATA Order Analysis Type 7702 for PULSE, the Multi-analyzer System Order Analysis Type 7702 provides PULSE with Tachometers, Autotrackers, Order Analyzers and related post-processing functions,
Standard Guide for Evaluating Characteristics of Ultrasonic Search Units 1
 Designation: E 1065 99 An American National Standard Standard Guide for Evaluating Characteristics of Ultrasonic Search Units 1 This standard is issued under the fixed designation E 1065; the number immediately
Method for the Generation of Broadband Acoustic Signals
 Proceedings of Acoustics - Fremantle -3 November, Fremantle, Australia Method for the Generation of Broadband Acoustic Signals Paul Swincer (), Binh Nguyen () and Shane Wood () () School of Electrical
MAGNETOSCOP Measurement of magnetic field strengths in the range 0.1 nanotesla to 1 millitesla
 MAGNETOSCOP Measurement of magnetic field strengths in the range 0.1 nanotesla to 1 millitesla Extremely high sensitivity of 0.1 nanotesla with field and gradient probe Measurement of material permeabilities
Archived 3/18/10 USER MANUAL EMCO MODEL 3141 BICONILOG TM LOG-PERIODIC / T BOW-TIE ANTENNA Rev A 01/97
 USER MANUAL EMCO MODEL 3141 BICONILOG TM LOG-PERIODIC / T BOW-TIE ANTENNA 399236 Rev A 01/97 GENERAL DESCRIPTION The EMCO Model 3141 is the latest evolution in the popular bow-tie/log periodic combination
Individually ventilated cages microclimate monitoring using photoacoustic spectroscopy
 Individually ventilated cages microclimate monitoring using photoacoustic spectroscopy Jean-Philippe Besson*, Marcel Gyger**, Stéphane Schilt *, Luc Thévenaz *, * Nanophotonics and Metrology Laboratory
AN5E Application Note
 Metra utilizes for factory calibration a modern PC based calibration system. The calibration procedure is based on a transfer standard which is regularly sent to Physikalisch-Technische Bundesanstalt (PTB)
Proceedings of Meetings on Acoustics
 Proceedings of Meetings on Acoustics Volume 19, 2013 http://acousticalsociety.org/ ICA 2013 Montreal Montreal, Canada 2-7 June 2013 Physical Acoustics Session 4aPA: Nonlinear Acoustics I 4aPA8. Radiation
EDDY CURRENT MEASUREMENT OF REMOTE TUBE POSITIONS IN CANDU REACTORS S.T. Craig, T.W. Krause, B.V. Luloff and J.J. Schankula Atomic Energy of Canada
 EDDY CURRENT MEASUREMENT OF REMOTE TUBE POSITIONS IN CANDU REACTORS S.T. Craig, T.W. Krause, B.V. Luloff and J.J. Schankula Atomic Energy of Canada Limited, Chalk River, Ontario, Canada Abstract: Regular