Universitat Politècnica de València
|
|
|
- Francine Harris
- 5 years ago
- Views:
Transcription


1 Universitat Politècnica de València Escuela Técnica Superior de Ingeniería de Edificación Camino de Vera Valencia Master of Science in Engineering Technology: Construction Study of the acoustic conditioning of the Beniganim Paco Salvador auditorium Analysis of the current situation and a proposal for improvement. Promotor: Prof. Dr. Arch. J. Llinares Millán Thesis submitted to obtain the degree of Master of Science in Engineering Technology Construction Lissa COIGNAU Academic year:
2 ii
3 iii Abstract The goal of this thesis is to analyse and propose improvements for the acoustic quality parameters of the Paco Salvador auditorium in Beniganim. Two methods are being used to analyse the current situation. The first method is the measurement of the parameter values in situ. In order to analyse these values they are run in a computer programme. The second method is the creation of a simulation in ODEON software. A 3D model is created in AutoCAD and loaded into the software. The different acoustic parameters are computed in the simulation After having analysed the current situation two proposals for improvements are made. The first proposal is to improve some of the acoustic parameters by adjusting the ceiling above the stage. The second proposal is to adapt the auditorium to the acoustic parameters require for a conference hall.
4 iv Index Abstract... iii Preface... 6 Introduction and Objectives Sound Quality Parameters of an Auditorium Ambient Noise Level Spaces Dedicated to Musical Performances Acoustical Intimacy Reverberation Time and Liveness Early Decay Time Warmth Direct Sound, Early Sound and Reverberant Sound Definition, Intelligibility and Clarity Brilliance Lateral Fraction Diffusion Balance Blend Immediacy and Response Dynamic Range Uniformity of Sound Summary Spaces Dedicated to Speech Echoes, Focalizations and Resonances Analysis of the Current Situation Description of the Auditorium Acoustic Conditioning of the Auditorium Surface Materials Geometry of the Auditorium Musical Intimacy In Situ Measuring Procedure of the In Situ Measurement Results of the Measurements Simulation of Acoustic Conditioning Procedure in ODEON... 32
5 v Results of the Simulation Common Problems Proposal for Improvements Improvement of the Geometry Adaptation to a Conference Hall Goal of the Adaptation Adaptation in ODEON Conclusion References Annex I. Results of the in situ measurements (current situation) Annex II. Results of the simulation in ODEON (current situation) Annex III. Results of the simulation in ODEON (after improvement) Annex IX Data Sheet Knauf Danoline... 88
6 Preface The reason for choosing this subject is my interest and curiosity about acoustics in buildings. Acoustics is an important aspect of the building process. Because I ve been studying construction, the writing of this thesis will contribute a lot to my earlier acquired knowledge. Before I wrote this thesis, I was completely unaware about the basics of building acoustics. Nevertheless, I learned a lot during the process of working on and writing this thesis. I want to thank all the people who have been very helpful, and in particular my promotor, Mr. Llinares Millán. He has made time to give classes and teaching me the basics of building acoustics. This was fundamental to comprehend the goals of this thesis and bring it to a successful end. Secondly I want to thank my friends who are here with me on Erasmus. My Belgian friends of KU Leuven who also wrote their thesis. We supported and helped each other wherever we could. Furthermore, I want to thank my flat mates for always being so supportive.
7 7 Introduction and Objectives The objective of the analysis of the acoustic conditioning of the auditorium in Beniganim is to obtain a reverberation time that is equal to the recommended reverberation time for a music hall, in other words to obtain a proper tonal curve for musical hearing. Furthermore, the acoustic conditioning more specifically the absorption of the surface materials must ensure a uniform distribution of the sound energy in the listening area. Before proceeding with the analysis of the acoustics of the auditorium in Beniganim, a short introduction describes most of the important acoustic parameters. After the introduction the current acoustic conditioning of the Paco Salvador auditorium is analysed. The auditorium s acoustic quality parameters are studied by using two different methods. The first method includes measuring of the data in situ and processing them to obtain the values of the quality parameters. Secondly, a simulation of the current situation is made to obtain the same quality parameters. After studying the current situation, some proposals for improvements can be made. The goal of these improvements is to obtain optimal values for the acoustic parameters. In this case the proposal consists of two improvements on a different level. Starting with a proposal for an improvement of the geometry of the auditorium continuing with a second improvement that adapts the auditorium to the requirements for hosting conferences.
8 8 1 Sound Quality Parameters of an Auditorium Before moving on to the specific acoustical study, it is necessary to describe the most important quality parameters. These parameters describe the acoustic quality of spaces used for speaking or musical performances. Everything that follows has been adapted to the centre frequencies of the octave bands (T1.1) to simplify the audio spectrum. The audio spectrum from 20 Hz to 20 KHz can be divided up into 11 octave bands. The 7 th octave band s centre frequency is defined to be f ctr 7 = 1000 Hz. All the lower frequencies can be calculated by f ctr n 1 = f n str while the higher centre frequencies are defined by f 2 n+1 ctr = 2f ctr n. (Physics Illionois, n.d.) Table T1.1 Octave band frequencies Band number Centre Frequency 1 15, , , , , , , , , , , Ambient Noise Level The level of the ambient or background noise in a space is originating from the activities that take place in adjacent spaces and rooms. It is a kind of noise pollution or interference. If there is a significant level of background noise present it should be measured. The noise could be originating from outside or from inside the studied room and could be produced by air conditioning systems, lighting, people talking, etc. The level of the background noise increases the noise threshold and could be masking other sounds that are important for the activities taking place in this room. To evaluate the degree of interference with the normal activities, the spectrum of the room has to be compared with the spectrum of another room where the same activities take place but where the influence of the source responsible for the background noise is absent. Noise criterion (NC) curves are used to display the spectrum. NC curves were established in the US for rating indoor noise such as noise from air-conditioning equipment. (Cirrus Research plc, 2011) The method consists of a set of criteria curves extending from 63 to 8000 Hz. These criteria curves define the limits of octave band spectra that must not be exceeded by the background noise.
 Criteria Octave Band Numbers 63 125 250 500 1000 2000 4000 8000 NC 20 51 41 33 26 22 19 17 16 NC 25 54 45 38 31 27 24 22 21")
9 9 Figure 1.1 Examples of recommended NC levels (Cirrus Research plc, 2011) Table T1.2 Noise Criterions in relation to octave band numbers (Beranek & Vér, 2005) Criteria Octave Band Numbers NC NC NC NC NC NC NC NC NC NC NC
10 10 When the values in the table above are translated into octave bands, the following curves are obtained. The background noise level must not exceed the curve that is predefined. The choice of the curve to be used depends on predefined rules and the intended purpose of the space. In most cases, the NC 25 curve is recommended. Figure 1.2 Noise Criteria curves (Beranek, Acoustics, 1986)
11 Spaces Dedicated to Musical Performances The interpretation of the perception of music can never be separated from the acoustic parameters of the space. In other words, the perception of music is correlated to these acoustic parameters. Starting with the emission that comes out of the instrument, a lot of different things are happening with the sound before it reaches the ears of the audience. It can be said that the entire room functions as a large tool that modulates the sound. The sound energy confines in space, the room s surfaces reflect the sound or absorb it, it gets absorbed by the air on its route, sounds are mixed together when they cross paths These are only a few of the many things that happen with the sound that travels through a space. In the following paragraphs the most important sound quality parameters for a space, dedicated to musical performances are explained. (Llinares Millan, 2013) Acoustical Intimacy Acoustical intimacy is very different from the visual intimacy that can be obtained in small rooms, for example. Acoustical intimacy refers to the feeling that listeners perceive when being physically close to the performing group or artist. It feels as if the sound originates from nearby surfaces. The listeners get an impression of the size of the room, in reality it is not the measured size of the room but the perception of its size. A room is said to have acoustical intimacy when the sound creates the subjective impression of a small room. The degree of acoustical intimacy in a space corresponds with the speed of the first significant sound reflection that reaches the listeners ears after having perceived the direct sound. Primarily, the listener hears the direct sound then followed by the reflected sound. If the time difference between the direct sound and the first reflection is short, the sound in the hall is intimate. This time difference is also called the initial time-delay gap (ITDG). A room is considered intimate when the ITDG is somewhere between 10 and 20 milliseconds. (Riethof) To achieve an ITDG, not exceeding the maximum value of 20 milliseconds, the reflection of the room can be increased with reflective panels hanging on the sidewalls. These panels guide the early reflections of the sound to the audience in the space. Naturally, a smaller hall has a smaller ITDG because the first sound reflections reach the audience faster than in a larger hall Reverberation Time and Liveness If a room consists of surfaces with high absorption power, the reflections in that room can be minimal or below the threshold of perception. The amount of reflections reaching the listeners is not sufficient to obtain a good perception of the music. These rooms with very little sound reflection are often being called dead rooms or dry rooms. Liveness has a direct connection with the reverberation time of the space. A space that is reverberant and thus has a long reverberation time is called a live space. When the reverberation time is too short it is called a dead space. Spaces with a long reverberation time are often being called acoustically superior to spaces with a short reverberation time.
12 12 The liveness is mostly related to the reverberation time of the frequencies above 350 Hz (Long, 2006), also called the medium and high frequencies. Liveness can best be obtained when the interior surfaces reflect the sound and when the space is large compared to the size of the audience. The loudness of the reverberant sound is related to the intensity of the sound that does not travel directly to the listener and the reverberation time of the hall. The reverberation time (RT) can be predicted trough calculation or it can be measured in situ. The expected reverberation time of a room can be calculated in numerous ways. Most of the equations are based upon the two classic formulas; the first one is developed by Sabine (1922) and the second one by Eyring (1930). These formulas are based upon the volume of the room and the absorption of the materials in the room. Imagine a sound emitted in a room at a constant rate. Until equilibrium between the emitted and the absorbed energy is reached, the sound energy density will build up. When the source is turned off, this energy density will diminish at a rate depending on the absorption of the materials in the room. The first equation is Sabine s. This is probably the most known and most widely used reverberation time equation: RT = 0,16V A (1.1) With V the volume of the room (m 3 ) and A is the total absorption of the interior surfaces (m 2 ). The second of the classical equations is Eyring s (1930), given by following formula: 0,16V RT = A air S T log a (1 α avg ) (1.2) With A air the air absorption (m 2 ), S T the total area of the surfaces (m 2 ) and α avg signifies the average absorption coefficient of all interior surfaces. These two formulas allow the calculation of the expected reverberation time. But if the reverberation time in a space has to be measured a different approach needs to be taken. To describe the measured reverberation time a quality parameter has to be defined. The reverberation time is perceived as the period of time that it takes for the sound to fade away after the sound source ceases. The period of time for the sound to fade away depends of course on the intensity of the sound. To characterise an auditorium, a parameter has to be defined, independent of the intensity of the test sound. Therefore it is necessary to define a standard reverberation time based on the drop of intensity starting from the original intensity. In other words, the parameter has to be defined in terms of relative intensity. Most frequently, 60 db is chosen to represent the relative intensity. Intensity is defined as the sound power per unit area. It is not related to the duration of the reverberation time that would be infinite. Furthermore it does not relate to the duration of audible reverberation which depends on the transmission power of the source and the level of the background noise.

13 13 This reverberation time T60 is defined as the time required for the reverberant sound to decay 60 db below the maximum. It is measured over a range of levels between 5 db and 35 db and afterwards multiplied by two. If it were measured over the full 60 db range, the reverberant tail would run into the measurement and disturb the measurement. This T60 parameter is commonly used in architectural acoustics which include the design of concert halls. Because the reverberation curve is not the same for high and low frequencies the tonal curve is used. The tonal curve is the graphical representation of the reverberation time depending on the frequency. To obtain the tonal curve of a space/room, the reverberation time is measured in the frequencies of the octave band spectrum (63, 125, 250, 500, 1000, 2000 and 4000 Hz). The reverberation time can also be expressed as a single number that refers to the average reverberation time. It is computed by the average of the reverberation times that correspond with the 500 Hz to 1000 Hz frequencies. The reverberation time was the first physical parameter that quantified the acoustic quality of a room. Therefore when the reverberation time is studied, acceptable acoustical conditions can be ensured for a specific use of the space. Depending on the use and the volume, all spaces dedicated to speech or musical performances must have an adequate reverberation time regardless of other acoustic parameters. The most common reverberation times depending on the different purposes of the hall are displayed in following graph; Figure 1.4 Common reverberation times in various spaces in seconds The optimal reverberation times can also be defined depending on the type of music played in a space. These values are illustrated in the table below. Table T1.3 Optimal reverberation times for different types of music Band Music 1.1 tr mid 1.4 Baroque Music tr mid 1.5 Classical Music 1.5 tr mid 1.7 Romantic Music 1.9 tr mid 2.2 Non Wagnerian Opera tr mid 1.5 Wagnerian Opera 1.6 tr mid 2.0 To give adequate warmth to the music, it is recommended to increase the reverberation time of low frequencies with 20% to 50%. Furthermore the reverberation of the room is related to its
14 14 volume according to Sabine s formula (1.1) which indicates that the reverberation time of a space is proportional to its volume. Therefore, the choice of the volume of a space is critical because of its possible reverberation conditions. The absorption of the interior surfaces is another important factor because it is closely related to the reverberation and the type of the room. Rooms where music is performed must have a large volume to ensure that the values of the reverberation time tend to be rather high. It is easier to adapt a space with a too high reverberation time than to adapt a space with too little reverberation time. The reverberation time can easily be increased by adding more absorbing surfaces. The absorption in a space originating from the audience has a fixed value. Problems can occur when there is no balance between the volume of the space and the absorption caused by the audience. This relates directly to problems with the reverberation time. Therefore values axist for the recommended volumes per viewer (T1.4) Table T1.4 Recommended volumes per viewer for given reverberation times 6-7 m 3 /viewer t r < m 3 /viewer 1.5 < t r < m 3 /viewer t r > Early Decay Time If a musician or ensemble plays rapidly, only the early part of the sound decay process remains audible between successive notes. Early decay time (EDT) designates that initial phase of sound decay. More specifically, it is the exact amount of time that it takes for a sound from a musical note to decay 10 db after the sound source is turned off. This value is multiplied by a factor of 6 because 10 decibels of decay occurs in a time period roughly equivalent to one-sixth of the time required for 60 decibels of decay. This decay of 60 db is defined as the reverberation time so it allows making a direct comparison between the EDT and RT. Some results conclude that EDT better indicates acoustical quality than RT (Beranek, 1979). The EDT corresponds more closely to subjective evaluation of the reverberation time than RT because, psycho-acoustically, the first arrivals are more important than the later reverberation range Warmth The warmth in music is defined as the presence of bass or is the bass-frequency sound that has the upper hand on the sounds of the mid-frequency. Warmth is indicated by the reverberation of the low frequencies between 75 Hz and 350 Hz. A reverberation time that rises with decreasing frequency below 500 Hz yields a beneficial sense of musical warmth. (Long, 2006) It is directly related to clear audibility of the bass sounds when the full orchestra is playing.
15 15 A full, rich bass gives a warm sound. If the reverberation time is shorter for low frequencies than for the mid-frequency, it is said that the sound is brittle. On the other hand, when the bass is too strong, the hall is described as dark. Sometimes in a small room or studio the interval between the acoustic resonances in the low frequencies is so big that different tones are unevenly perceived. If some low-frequency sounds are raised, this uneven perception gives the impression that the room rumbles. Unless the ceilings and walls are covered with absorbent materials who affect the high frequencies, this rumble effect occurs rarely in large concert and opera halls. The value of the warmth-parameter is expressed in terms of the bass-ratio (BR) (Beranek, 1979) and is recommended to be higher than 1 and less than Direct Sound, Early Sound and Reverberant Sound Direct sound is the first sound that a listener perceives coming from an instrument on the stage. It is the sound that travels directly from the instrument to the listener. The sound is very complex. Our impression about the loudness of a room is created by the sounds of the direct sound, the early sound and the reverberation. The sounds are examined separately. The loudness of direct sound waves to a listener is determined by the loudness of the direct source and the distance from the source to the perceiver or listener. In a small hall the direct sound of for example an orchestra will reach the backseats with adequate loudness. The loudness of the direct sound decreases with the square of the distance from the source so that the loudness decreases very rapidly the further away from the source. If the hall is large and the scenery does not have a sufficient slope, the effect of this inverse square law is felt; the loudness of the direct sound is too low for the time it takes to reach the listeners who are furthest away from the source. To optimize a hall, it has to have a limited volume and the walls and ceilings should be covered with materials that evenly project the sound to the seats. For example the direct sound of an orchestra in a hall with sloping seats has the best level of comfort approximately 18 meters from the stage director. The term early sound encompasses the direct sound and all the reflections that reach the listener in the first 80 milliseconds after the arrival of the direct sound, while the reverberant sound includes all the reflections that arrive after these 80 milliseconds Definition, Intelligibility and Clarity Definition and clarity are the degrees to which rapidly occurring individual sounds are distinguishable (Long, 2006). A hall is considered defined if the sound perceived is clear and crisp. If the sound is blurry it is said that the hall is not defined. The degree of the definition of a space depends on the quantity of reflective surfaces on the inside of the space. For that reason, definition is related to intimacy. Because the definition depends on the reverberation time it is also related to the liveness.
16 16 Furthermore the distance between the perceiver and the source plays a roll so it is related to the loudness of the direct sound. Finally, it is related to the loudness of the reverberant sound because the definition also depends on the volume of the room. From the physical acoustics point of view, the parameter is defined as the ratio between the energy reaching the perceiver during the first 50 milliseconds after the arrival of the direct sound (this includes both the direct sound and the early reflections) and the total energy perceived. This means that the higher the definition (D), the better the speech intelligibility and the sound in a specific point of the hall or space. The definition parameter is represented with D50 or D80 values. The most commonly used parameter is D50. It is recommended that the D50 values are above 0.5 and the closer the values are to 1, the higher the definition of speech. For the average frequencies of 500 Hz and 1000 Hz, the standard indicates typical values for D50 between 0.3 and 0.7 for auditoria 1. The definition parameter D50 is computed as D50 = energy to 50 miliseconds total impulse energy (db) Similarly clarity which is expressed by C80 or C50 is defined as the comparison between the ratio in the early sound and the reverberant sound. The early sound is what is heard in the first 80 milliseconds (C80) or in the first 50 milliseconds (C50). The C80 parameter is used the most and is computed as follows: C80 = 10 Log(energy to 80 miliseconds (db) remaining impulse energy The speech intelligibility is a measure for speech transmission quality. This parameter is represented by the speech transmission index (STI) an objective method for prediction and measurement of speech intelligibility. The STI method measures some physical characteristics of a transmission medium such as a hall, a telephone line, etc. and expresses the ability of this channel to carry across the characteristics of a speech signal. The STI values vary from 0(bad) to 1(excellent). A reference scale was developed, known as the Common Intelligibility Scale (CIS) (Barnett & Knight, 1995), where; CIS = 1 + Log(STI) Figure 1.5 Common Intelligibility Scale Before the STI was introduced, the rapid speech transmission index (RASTI) was used. This was a simplified and approximate measurement method for rating speech transmission in auditoria. The method was only applicable on pure room acoustics and could not be used with electro acoustics. Because nowadays most of the spaces work with electronic sound systems, this method is outdated and not used anymore. (Houtgast & Steeneken, 1971) 1 ISO :2009
17 17 Methods for the calculation of the speech intelligibility index can be found in ANSI Brilliance Brilliance is defined as a bright, clear, ringing sound, rich in harmonics, with slowly decaying high-frequency components. (Long, 2006). It refers to the reverberation time at low frequencies relative to that at higher frequencies. An increase of the reverberation time in the low frequencies (under 500 Hz) creates a warm sound. The brilliance is determined by the ratio of the reverberation times of high and mid-frequencies, the distance between the source and the perceivers and the presence of reflected sound in the space. When a hall or room has liveness at high frequencies, clarity and intimacy, a bright, brilliant sound is obtained. Thus brilliance is related to each one of these previously mentioned parameters. Represented by Br, this parameter is obtained by following formula; Br = Sum of the reverberation times at 2000Hz and 4000Hz Sum of the reverberation times at 50Hz and 1000Hz It is recommended that the obtained value of Br is higher than Lateral Fraction According to the definition of Marshall (Marshall, 1967), lateral energy fraction (LF) is the ratio between the energy laterally reaching the perceiver within the first 80 milliseconds after the arrival of the direct sound (early sound) and the energy received in every direction within this same time interval. According to this definition it can be stated that the higher the value of LF, the higher the degree of spatial sound. Consequently, this parameter is only relevant in case the space or hall is dedicated to music listening. To indicate the value, the average value of the different LF values is calculated corresponding to the octave frequency bands of 125 Hz, 250 Hz, 500 Hz and 1000 Hz. This parameter is called LF4 and it is recommended that its value is higher than Diffusion Diffusion is represented in terms of a surface diffusivity index (SDI) (Beranek, Concert Halls and Opera Houses: Music, Acoustics and Architecture, 1979). The diffusion is related to the spatial orientation of the reverberated sound. When the reverberated sound reaches the ears of the public from all directions and in approximately equal amounts, the diffusion is good. It is defined 2 ANSI American National Standard Methods for Calculation of the Speech Intelligibility Index, (1997)
18 18 as the efficacy by which the sound energy is spread evenly in a given environment, the scattering of sound energy. For example the orchestral sound is diffused into the room trough combination of a high reverberation time and the abundance of irregular interior surfaces, e.g. arches in the ceiling, wall niches, statues, balconies, etc. When the walls and the ceiling are smooth and lead the sound directly to the listening area without cross reflections or dispersions in the area, the room or hall has no diffusion. A perfectly diffusive sound space is one that has certain key acoustic properties which are the same throughout the space. On the other hand a non-diffusive sound space would have considerable different reverberation times as the listener moves around the room. The diffusiveness of sound can be measured by taking reverberation time measurements at a large number of points in a room. Then the standard deviations of these decay times are taken and alternately the special distribution of sound can be examined Balance Good balance entails both the balance between sections of the orchestra and balance between the orchestra and a vocal or instrumental soloist. Balance is the equal loudness among the various orchestral and vocal participants (Long, 2006). Some of the ingredients that contribute to the creation of a good balance are acoustical and others are musical. A performance can lose balance if the stage enclosure or some other surfaces near the instrument players overemphasizes certain sections of the orchestra or if it fails to support the soloists adequately. Beyond that, balance is in the hands of the musicians, their seating, and the conductor s control over the musicians. A good design of the concert hall and especially of the stage can provide a good balance of the sound Blend This property is defined as the mixture of the various instrumental timbres of the orchestra which creates a harmonious sound for the listener. More generally, it is a harmonious mixture of the orchestral sounds. Blend depends partly on the placement of the orchestra, which should be spread neither too wide nor too deep. Blend also depends heavily on the design of the soundreflecting surfaces close to the stage, such as the stage enclosure Immediacy and Response Spatial responsiveness (SR) is identified as a desirable property of concert halls. (Marshall, 1967) The sense that a hall responds quickly to a note is called immediacy. Hereby, the early reflections returned to the musicians are important. This can depend largely on the hall s spatial responsiveness: the manner in which the first reflections from surfaces in the hall arrive back at the musician s ears. If the reflections occur too long after the note is played, the sound will be heard as an echo. Conversely, if the musicians hear reflections only from the nearby surrounding
19 19 stage walls, they will have no sense of the hall s acoustics Dynamic Range Dynamic range is the range of sound levels over which music can be heard in a hall. It is dependent on the difference between the loudest level and the lowest background level in a space. This range extends from the low level of background noise produced by the audience and the air-handling system up to the loudest levels produced in the performance. All extraneous sources of noise including traffic and aircraft noise must be avoided in order to obtain a wide dynamic range Uniformity of Sound The same music, tonal quality, etc., should reach every listener in the space. Uniformity of sound signifies the evenness of sound distribution (Long, 2006). The quality of a listener s experience will suffer if he or she is seated under a deep overhanging balcony or at the sides of the front rows in a hall. In certain locations, reflections may overemphasize one section of the orchestra or produce echoes, muddiness, or lack of clarity. Musicians sometimes speak of dead spots when the music is not as clear or does not have the same liveness as in other parts of the hall. Acousticians reserve this term only for locations where the music is especially weak Summary With all these described parameters above, a synthesis can be made, allowing to relate these definitions with estimated acoustic parameters. These acoustic parameters can be measured in order to verify the degree of compliance after finishing the study. Because intimacy and uniformity of sound correspond to physical quantities, they are easily measurable and the uniformity has a distribution of levels which is easy to verify in the subsequent verification. Liveness, warmth, brilliance, tonal quality and balance are all parameters related to the phenomenom called reverberation, which is described earlier. Its importance lies in the fact that acoustic messages, for some time after having been issued, are interspersed with other later produced sounds. The blending of sound is sometimes beneficial. It can strengthen and prolong, causing the fullness of musical sounds. But sometimes the blending can be harmfull because it could mask some other sounds, thereby losing the clarity of spoken sounds. Reverberation favors the spread or perception of sound with equal intensity in all directions.
20 Fig. 1.6 Musical terms and the Related Acoustical Factors (Long, 2006) 20
21 Spaces Dedicated to Speech The perception of words is much more objective and therefore easier to measure and control than music. It is mainly ruled by physical and linguistic factors and less by psychological factors. Linguistic factors are not affected by the acoustics of the hall. The goal of any oral message is to be heard and understood; therefore the basic criterion of measuring the quality of verbal hearing in a hall is the intelligibility of speech reaching its various locations. Understanding the spoken words means that the sound reaches enough intensity to emerge from the background noise. Each phoneme has to be perceptible which means that a compromise must be made between the loss of clarity due to excessive reverberation and the loss of intensity due to excessive absorption. The absorption of the high frequencies caused by most materials in the hall and even by the air leads to a great loss of intelligibility because the distinctiveness of many consonants gets lost. Therefore it is essential that the spectra of the various sounds, especially in the high frequency region, are preserved. With everything stated above it can be concluded that in a hall dedicated to speech, the opposite happens from a hall dedicated to musical hearing: the volume must be at a minimum to reach good comfort conditions. When the volume increases excessively, an overload of absorbent material should be used in the hall avoid the undesirably rise of the reverberation time. The indicator of speech intelligibility is a parameter that measures the clarity of the spoken messages. It is defined by the percentage of sounds that are heard in relation to the total emission of sounds in an oral communication (see paragraph 1.2.6). The perception of words requires more clarity than the perception of music. This clarity is achieved by a strong component of the direct sound immediately followed by strong reflections (10-30 milliseconds). In this way little energy is left to cause reverberation. Therefore the reverberation must be lower than in spaces designed for musical performances. As the volume of the space increases, a balance must be achieved between the clarity and the reverberation. In large spaces the direct energy is not enough and needs to be supported by some reverberation or sometimes electro-acoustical reinforcement. The speech transmission index (STI) is used in an objective way to measure the intelligibility. This parameter is explained in paragraph Echoes, Focalizations and Resonances Echoes, focalizations and resonances are acoustic problems of first order that need to be avoided in any auditorium. To eliminate the risk of echoes the surfaces that can give reflections with excessive delays in a particular zone of the auditorium are treated with absorbent material. When the sound has a sufficient level an echo can be produced if a delay of 50 milliseconds between the direct sound and the first reflection occurs or when this delay occurs between two consecutive reflections.
22 22 Focalizations are concentrations of acoustic energy in an area of the hall. They can be produced by reflections on concave surfaces. Thus the use of these surfaces can cause problems. Uniformity in the conservation of frequencies can be achieved when isolated resonance frequencies in the room are prevented. This is done by favouring multiple ways of resonance in the hall, thereby avoiding the use of parallel planes especially near the sound source.

23 23 2 Analysis of the Current Situation The following analysis is a description of the auditorium. More specifically, it is a description of the geometry of the auditorium and the surface materials. These factors have an important influence on the acoustic parameters of the space. To actually obtain and analyse the acoustic time and energy parameters of the auditorium, two methods were used. The first one is the in situ measuring of the acoustical parameters in the auditorium and the computer processing of the obtained values. The second method is the use of ODEON simulation software, where a model of the auditorium is created and the software calculates the different parameters. 2.1 Description of the Auditorium The Paco Salvador auditorium is a rectangular space with a stage consisting of a fixed acoustic shell (Fig. 2.1.a-b). The area for the audience is distributed on one slope plane that descends stepwise from the stage. It has a capacity for 604 spectators. The stage has a total surface of m 2 of which 90 m 2 falls within the projection of the acoustic shell mentioned above. However, the whole ceiling of the auditorium functions as an extension of this acoustic shell as if it is hereto integrated. The auditorium is designed for performances of band music and for hosting conferences. However it is mostly used for musical performances. This means that the maximum sound level that originates on stage will not exceed 105 dba. The hall itself is designed as a perception area of the activities taking place on the stage. It is designed in such a way that the maximum sound level that reaches the audience is 100 dba. The audience area is distanced from the stage due to the absorption of the materials and their coatings and the reduction caused by the air absorption. Figure 2.1(a) Plan view of the auditorium

24 24 Figure 2.1(b) Section view of the auditorium As mentioned earlier the main use of the auditorium is the performance of band music. Therefore the values of the parameters described in chapter 1 are in accordance with the recommended values for this specific use. The general objectives in terms of audio quality are given in table T2.1. Table T2.1 General objectives for audio quality in the auditorium Use of the Volume Background Intimacy TRmid Warmth Brilliance Intelligibility auditorium [m 3 ] noise level t r [s] [s] [STI] Band music 6000 NC ms 1,1/1,4 1,1/1,4 >0,85 >0,50 Like in most public spaces, the use of the NC-25 curve is recommended. When this is translated into equivalent sound levels, this means that the noise caused by installations in the auditorium must not exceed the 35 dba threshold. 2.2 Acoustic Conditioning of the Auditorium Surface Materials As mentioned above, surface materials are very important in the acoustic conditioning of a space. Each material has its own specific absorption-coefficient. This absorption affects the reverberation time of the emitted sound. Therefore it is important to compose the materials in a space so that the absorbent and reflecting surfaces work together. In this way an optimal reverberation time is obtained in the whole public area.
25 25 A list of materials used in the Paco Salvador auditorium is presented below followed by the values of their specific absorption-coefficients in every part of the octave-band: Table T2.2 Description of the materials used in the auditorium ELEMENT DESCRIPTION NUM. Sides and bottom of Light pleated cotton curtains, within a 20 to 30cm distance 1 the stage from the wall Stage Solid wood with 3 cm thickness on joists (10-15 cm) 2 Back of the Vertical wooden lathing with 50% gaps and 4 cm Rockwool in 3 auditorium its backfill Reflective sides of the Plywood panelling 7-9mm thick 4 room (sockets) Armchairs Medium upholstery. Legs and back of the back support in 5 wood without upholstery Floor Linoleum on concrete slab 6 Windows of the Window glass in metalwork 7 control cabin Absorbent sides of Veiled Rockwool panels 4 cm thick 8 the auditorium Ceiling and acoustic Large plywood panels (12-15mm thick) with variable air 9 shell chamber in its backfill (between 40 and 220 cm) Covers of the climate control The climate control ducts are on the top side of the room. Underneath them they are covered with permeable felt and wool in its backfill 10 Table T2.3 Absorption values for the different materials in the different frequencies ,17 0,17 0,25 0,45 0,65 0,60 0,60 0,60 2 0,15 0,18 0,11 0,06 0,05 0,04 0,04 0,04 3 0,35 0,35 0,55 0,85 0,90 0,75 0,75 0,75 4 0,20 0,20 0,12 0,06 0,05 0,05 0,05 0,05 5 0,11 0,18 0,40 0,59 0,62 0,68 0,70 0,70 6 0,04 0,04 0,04 0,04 0,04 0,02 0,02 0,02 7 0,14 0,14 0,08 0,05 0,05 0,05 0,04 0,04 8 0,30 0,35 0,60 0,85 0,92 0,92 0,90 0,85 9 0,13 0,09 0,06 0,06 0,04 0,03 0,03 0, ,23 0,35 0,59 0,80 0,85 0,76 0,74 0, Geometry of the Auditorium The acoustic performance of the hall is influenced by various aspects. The geometry of the auditorium is one of these aspects that can ensure the good acoustic performance of the space. Here, the geometry of the hall is based upon two different aspects that contribute to an optimal distribution of the sound. This automatically results in better acoustic performance. The first aspect is the ceiling of the hall. The false ceiling is constructed with plasterboard on metal profiles and covered with large plywood panels that are directly attached to the plasterboard. The plywood panels have a very low absorption coefficient so they reflect the sound waves. These panels are constructed between the roof trusses.


26 26 In the following figure, the distribution of sound rays from the stage is visualized in a cross section of the auditorium. These rays are emitted by a source in the centre of the stage at a height of 1.5m. Figure 2.2 Sound wave distribution caused by the ceiling panels The energy distribution of the emitted sound is obviously improved by the geometry of the ceiling and thus creates a good uniformity of sound in the entire listening area. The second aspect is the geometry of the side walls of the hall. These surfaces are constructed with the same surface material as the ceiling and are very reflective. The geometry of the sides contributes to a better distribution of the sound energy as represented in the figure below. Figure 2.3 Sound wave distribution caused by the side panels

27 Musical Intimacy As described in the quality parameters, the musical intimacy is represented by the difference of paths travelled by the direct sound and the first reflection. The path of the reflection of the sound is calculated and drawn as follows: Source d Receiver d Virtual source Figure 2.4 visualisation of the reflected sound path Starting from the real source a virtual source is constructed. This virtual source is constructed perpendicularly on the surface and at the same distance from the surface as the real source. This virtual source is connected with the receiver by drawing a line between the two. The reflection of the sound hits the surface where this line crosses the surface. By means of this figure the distance that the reflected sound travels can be measured by simply measuring the lines. When the distance between the length of the reflected sound path and the direct sound path is less than 7m, the speed of sound is within the 20millisecond range. Following are three figures that represent the reflections at the first rows of the audience (Fig. 2.5), the centre of the auditorium (Fig. 2.6) and the back of the audience (Fig. 2.7). In the first case, the difference between the reflected and direct sound is 5,95m, which is less than the maximum value of 7m. The calculated value of this difference in the second figure is 2,33m and the value of the last figure is 2.25m. Figure 2.5 Reflection of sound to the first rows


28 28 Figure 2.6 Reflection of sound to the centre of the auditorium Figure 2.7 Reflection of sound in the back of the auditorium It can be concluded that the difference in distance between the direct and reflected sound increases when the sound goes further to the back of the auditorium. In other words the intimacy gets better at a further distance from the stage. 2.3 In Situ Measuring The goal of the in situ measurement is to obtain the values of different acoustic quality parameters by measuring them within the room. The results of the quality parameters can be studied and compared with the recommended values for these parameters. In this way a conclusion of the acoustic performance in the auditorium can be made Procedure of the In Situ Measurement The in situ measuring of the airborne noise transmission in the auditorium is done by simply using a source and a receiver. In this case the OmniPower Sound Source is used to process the emission of the sound in every direction. This source is positioned on the side of the stage. If the source would be positioned in the middle of the stage, the obtained results would be symettric and possible problems may not be revealed. To get over the background noise the source is set to work with a high pressure level.


29 29 Figure 2.8 Brüel & Kjær OmniPower Sound Source type 4292L The different measuring points have to be spread evenly in the auditorium. Furthermore, they have to be situated in significant places in the area of the audience. In this case, the measuring points were chosen as represented in following figures: Figure 2.9 Distribution of the source (green) and receivers (red), cross-section Figure 2.10 Distribution of the source (green) and receivers (red), top view
30 RT[s] 30 A microphone functions as a receiver for the emitted sound waves. While the sound wave is emitted from the source, the microphone is hold steady in one of the points indicated in the figures above. The microphone is part of a sonometer who sends the measured data to the computer. In the computer, the data is processed with DIRAC software. This software translates the soundwave coming from the source into the different quality parameters. The acoustic quality parameters that can be obtained by the measurement are: Clarity expressed by C50 and C80 Definition expressed by D50 and D80 The Early Decay Time (EDT) Speech intelligibility for female and male (STI) The reverberation time RT, T10, T15, T20 and T30 For every point that is indicated in the figure above, this process has to be repeated. In that way values of definition, clarity, intelligibility and reverberation are obtained for each different receiving point in every frequency of the octave-band Results of the Measurements The values that are obtained by the method described in the previous paragraph can be processed in Excel. After loading the values into an Excel-file, graphs can be made for every measured quality parameter. The most important parameter in the study of the acoustic performance of the auditorium is the reverberation time. The average of the measured RT values is displayed in following graph: 2,5 Auditorium Beniganim Average Reverberation Tme 2 1,5 Average RT 1 0, Frequencies [Hz] Figure 2.11 Average RT values measured in situ
31 STI 31 These values are compared with the recommended value for the reverberation time in the auditorium. It can be concluded that the average reverberation time measured in situ lies between the recommended minimum of 1.1 and 1.4. The values in the lowest frequency (63Hz) and in the highest frequency (8000Hz) are ignored. In the following graph the measured values of the speech intelligibility can be studied. 0,65 0,6 0,55 Auditorium Beniganim Intelligibility 0,5 0,45 STI female STI male 0, Measuring Points Figure 2.12 STI values in every measuring point The measured values of the speech intelligibility index do not fall below the recommended minimum value of It can be concluded that the quality of speech transmission in this auditorium is sufficient. The two previous graphs and the graphs for all the other measured parameters are included in Annex I. 2.4 Simulation of Acoustic Conditioning In this case, ODEON software is used to simulate the acoustic conditioning of the Paco Salvador auditorium. ODEON is software developed for simulating the interior acoustics of buildings. Given the geometry and surface conditions, the acoustics can be predicted, illustrated and interpreted. The simulation allows treating the first reflections of the sound energy coming from an omnidirectional point source. It calculates the impacts on the different points of the surfaces with their respective absorption coefficients. Starting from a number of points, the simulation uses a statistical method to compute the parameter values. Besides the tonal curve and T30 values, the software allows to obtain following quality parameters: the homogeneity of the sound levels in the listening area represented by SPL and SPL(A)
32 32 the clarity C80 definition D50 spatial impression measured by lateral efficiency LF4 the speech intelligibility index STI Procedure in ODEON A 3D model of the auditorium has to be designed in order to work with the software. Here, the model is designed in AutoCAD and converted into a 3ds file that is easily loaded into the ODEON software. After loading the 3D-model into the ODEON software, the source and the receivers can be positioned. The different points can be positioned inside the model by assigning x, y and z coordinates to every single point according to Figures 2.9 and 2.10 mentioned in previous section. When the source has to be entered, the overall gain must have the value of 120 db to correspond with the source used for the in situ measurements. The second step is to assign the materials to every surface in the model. A lot of materials are already included in the software but in this case new materials are added with values for the absorption coefficients that can be found in table T2.3. When the source and the receivers are specified and every surface has been assigned a material, the model can be checked for holes. If there would be holes, some of the sound waves would slip outside the model not causing any reflections on the surfaces, resulting in false parameter values. The model should be adjusted until there are no holes left. If there are no significant holes left, the survey method can be used to obtain a first impression of the parameter results. This method takes less time than the precision method but is also less accurate or precise. It is important to set the impulse response length to a value that exceeds the reverberation time of the auditorium. This value can be adjusted in the room setup. Here the impulse response time is set to 2200 milliseconds. The survey method is used to compare the simulated values to the ones measured in situ. The comparison is limited to comparing the T30 values of the in situ measurement with the obtained values in ODEON. This is because the reverberation time indicated by the T30 values is the most important indicator in evaluating the acoustic quality and performance of the auditorium. The simulated values of T30 can be accepted if they differ less than 10% from the in situ measured values. If the difference exceeds this 10% margin, the absorption coefficients of the materials must be adjusted. More about this is explained in paragraph that handles common problems of working with simulation software. When the original values where entered the T30 values of the high frequencies where too low to match with the results from in situ measurement. Also, the T30 values of the low frequencies exceeded the values measured in situ. It is known that by lowering the absorption the values of the reverberation time increase and vice versa. This means that the absorptions in the high frequencies must be lowered and the absorptions in the low frequencies must increase to correspond to the T30 values measured in situ.

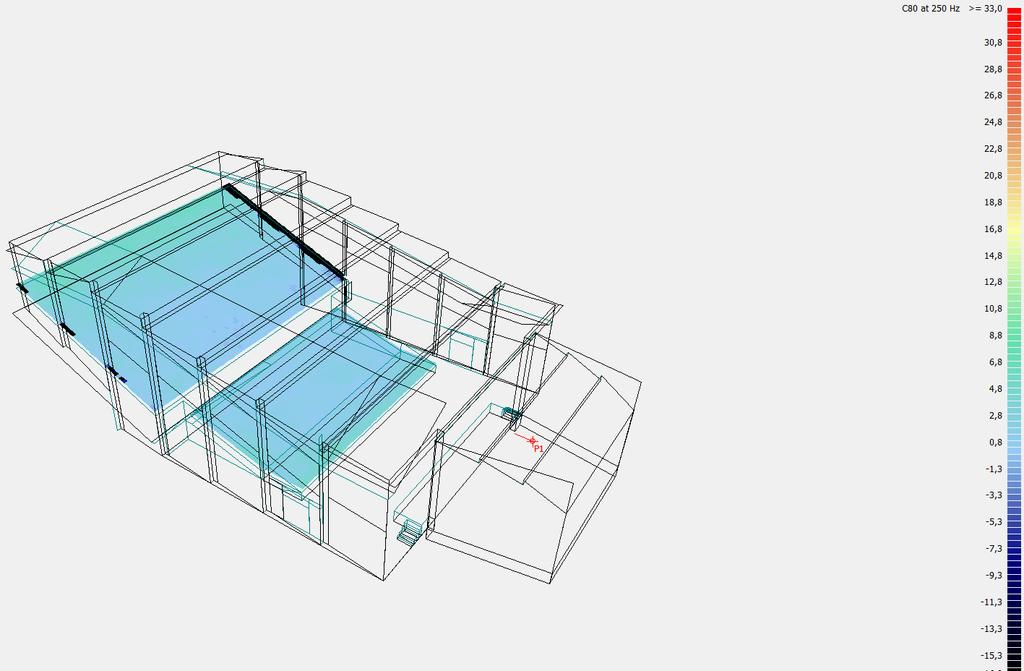
33 33 The absorptions caused by the armchairs and the surface materials of the acoustic shell have the most important influence on the reverberation time and thus on the T30 value. Therefore the adjustment of absorption coefficients is limited to these three materials. The original values and the adjustments are illustrated in following tables: Table T2.4 Adjustment of the reflective ceiling and wall panels Frequency[Hz] Original α Adjusted α Table T2.5 Adjustment of the armchairs Frequency [Hz] Original α Adjusted α Table T2.6 Adjustment of the absorbent wall panels Frequency [Hz] Original α Adjusted α When the simulated values are within the 10% range of the measured values a grid can be computed. The grid is defined by every surface that represents a space where the audience is usually situated. It is called the listening plane. The plane corresponds with the heads of the audience (Fig. 2.13) By decreasing the distance between receivers in the grid, the precision of the calculations will increase but the calculation time also increases. To obtain the values included in Annex II, the distance between the receivers is set to be 0.25 m. Figure 2.13 The coloured area corresponds to the receiver surfaces
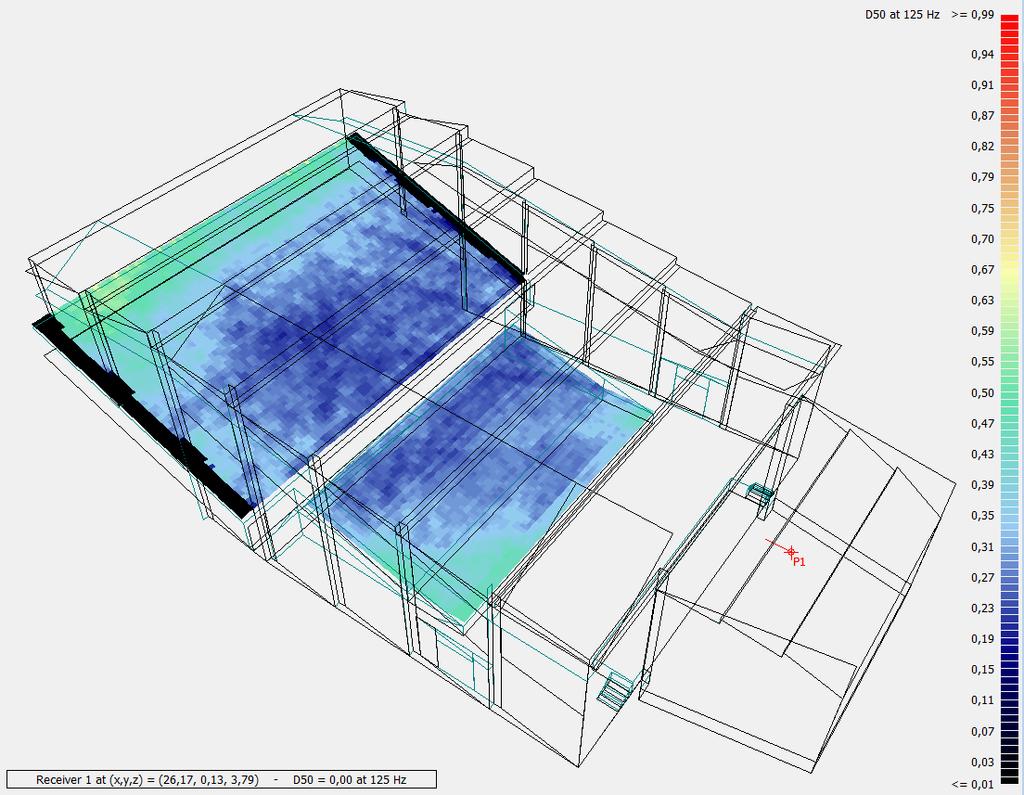
34 Results of the Simulation The parameter values are computed with the simulation. For some of them the distribution of the values covers the entire surface where the audience is seated. The values are given for every octave band. The results of the simulation show a sufficient degree of similarity with the values that are measured in situ. Some of the results are given in following figures. These and the rest of the results obtained by the simulation are included in Annex II. In following figures (Fig ), the T30 values in the 500 Hz and the 1000 Hz octave band are illustrated. The values seem to be the same everywhere. On the left side some red dots can be observed. This is because the plane is drawn too wide in the 3D-model and is not enclosed in the auditorium s volume. This does not affect other values and thus can be ignored. Figure 2.14 Simulated T30 values in the 500 Hz octave band
35 35 Figure 2.15 Simulated T30 values in the 1000 Hz octave band The SPL (A) represents the sound pressure levels. These values are distributed over the entire audience plane (Fig. 2.16). By studying these values, the homogeneity of the sound levels can be derived. The entire audience plane has the same colour everywhere. Therefore it can be said that the distribution of sound levels is homogeneous in the Paco Salvador auditorium. Figure 2.16 SPL (A) values spread over the listening plane
36 Common Problems As mentioned in previous paragraph, the absorption coefficients of the materials sometimes must be adjusted. This is to let the simulated parameter values match with the measured ones. The first reason for this difference in absorption coefficients is the method of determining the coefficients. The reverberation room method is the most commonly used method for determining the absorption coefficient of a material (ISO STANDARD 354:2006) The minimum and maximum size of the material samples to be tested is 10 m 2-12 m 2 (ISO354:2006). The samples are hung at the back of the room following the method outlined in ISO354:2006 Annex B. In the same way as described in paragraph the reverberation time is measured in the room containing the material sample and once without the sample. The difference in reverberation time between both measurements is used to calculate the absorption coefficient of the material. It can be concluded that the absorption coefficient measured in a perfect room in ideal circumstances can defer from the absorption coefficient measured in the auditorium. Therefore it is sometimes necessary to adjust the absorption coefficients of some materials. The second reason that can cause differences is the armchairs. The geometry, material and composition in the room can all be factors that influence the reverberation time. Thus adjusting the armchairs absorption coefficients can already make a great difference.


37 37 3 Proposal for Improvements 3.1 Improvement of the Geometry The ceiling above the stage consists of a horizontal reflective panel. In this way the sound that is produced by the musicians is only reflected on the stage itself. The division of the ceiling above the stage into three reflective screens is being proposed. The screens are part of the acoustic shell and can be put in different positions changing their inclination. To avoid excessive focalisations of the energy on the stage, it is important that the inclinations are according to predefined requirements. Situated above the musicians, the intention of the shell is to reflect the sound energy to the musicians themselves and project it to the public area. Following figures represent different sound ray paths with changing inclinations of the reflective screens. Figure 3.1 First reflections of percussion and bass In Figure 3.1 the sound source is placed where the percussion and bass instruments are normally situated. The reflective panel above the sound source reflects the sound on the entire area of the stage. The two front panels reflect the sound energy towards the first section of the audience. Figure 3.2 Sound reflections with the source placed in the middle of the stage When the sound source is placed more to the middle of the stage (Figure 3.2), it corresponds approximately with the medium frequency zone. In this case, the panel reflects the sound on the entire stage and to the first rows of the audience.
, the results of the sound reflections are similar to the ones in the other cases. This confirms the proper functioning of the acoustic shell.")
38 38. Figure 3.3 Sound source in the front of the stage When the source is positioned in the front of the stage (Figure 3.3), the results of the sound reflections are similar to the ones in the other cases. This confirms the proper functioning of the acoustic shell. Too much reflection must be prevented because it can cause excessive sound levels on the stage. To prevent too much reflection gaps of 20 to 30 cm are left between two adjacent panels. These gaps are filled with an absorbent material. By introducing these panels, more first and early reflections that reach the audience and the musicians are created. In combination with the already existing geometry of the side walls of the auditorium as described in paragraph this adjustment will contribute to better results for musical intimacy and immediacy. 3.2 Adaptation to a Conference Hall Goal of the Adaptation Intentionally, the auditorium was designed to serve as a concert hall and a conference hall. The auditorium is now only used as a concert hall. Therefore the acoustic quality parameters are only adapted to this use. The goal of adapting the auditorium is to adjust the parameters so that the auditorium can serve as both a space to perform music and as a space for conferences. In other words a balance between the recommended quality parameters for speech and the quality parameters for musical performance must be achieved.
39 39 The reverberation time of the hall must be adjusted to obtain this balance. The tonal curve or reverberation curve for music must be high in the lower (bass) frequencies and low in the higher frequencies. For the spoken word the high frequencies must have a higher reverberation time than the lower frequencies. These optimal reverberation curves for musical performance and for the spoken word are illustrated in the graphs below. Figure 3.4 Optimal reverberation time in function of the rooms volume (Beranek, 1979) for voice broadcasting studios (a), conference rooms (b), music broadcasting studios (c), concert halls (d) and churches (e) Optimal tonal curves RT Speaking Music performance Figure 3.5 Optimal reverberation curves for speaking and music When the auditorium s reverberation curve is studied (Figures ), it can be concluded that this space is perfect to serve for musical performances; the curve is very similar to the optimal reverberation curve for concert halls. The high values are situated in the low frequencies and the low values in the high frequencies However, the reverberation times in the different frequencies of the octave-band are too high to serve as a conference hall. Especially in the low frequencies the reverberation time has to be lower to ensure a good environment for speaking purposes.
![T30 [s] 40 Auditorium Beniganim Average T30 2,5 2 1,5 1 0,5 0 63 125 250 500 1000 2000 4000 8000 Frequencies [Hz] Average T30 Figure 3.](/docs-images/90/102424213/images/40-0.jpg "6 Average reverberation time values T30 (s) for octave band frequencies (in situ measurement) Figure 3.")
40 T30 [s] 40 Auditorium Beniganim Average T30 2,5 2 1,5 1 0, Frequencies [Hz] Average T30 Figure 3.6 Average reverberation time values T30 (s) for octave band frequencies (in situ measurement) Figure 3.7 Average T30 values for octave band frequencies (simulation) When more absorption is added to the lower frequencies and the absorption of the high frequencies is increased, the curve will correspond more to the optimal curve for speaking in the lower frequencies. In this way the auditorium will be perfectly adapted to serve as a conference hall. Nevertheless, the auditorium must be adapted so that it can serve for both speaking and musical performance purposes. The best way to make the auditorium fitting for speech and music is to adjust the materials so that the T30 curve is mostly lowered in the lower bass frequencies. In that way the lower frequencies are more fitting for speech.
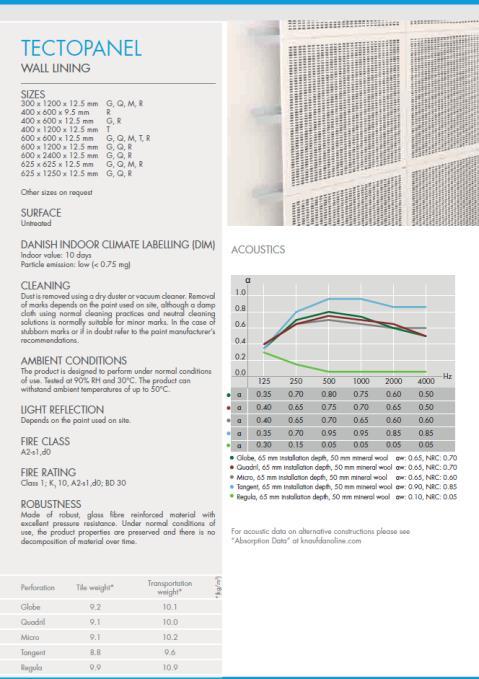
41 T30 [s] Adaptation in ODEON The best way to quickly get results when adapting the auditorium is to use the simulation software. With ODEON it is easy to adjust the surface materials and quickly get a result of what the change in surface materials does with the T30 curve. First, the material of the reflective panels on the side of the walls is adapted into a more absorbent material so that the T30 curve is lowered. The material that is used is TECTOPANEL (Knauf Danoline) an acoustic wall panel. The values of the absorption coefficients are represented in the table below (T3.1). The data sheet of this material is included in Annex IX. Table T3.1 Absorption coefficients for gypsum plate with acoustic felt Frequencies [Hz] Absorption coefficient α 0,30 0,30 0,15 0,05 0,05 0,05 0,05 0,05 In Figure 3.8 (a) can be seen that the graph is lowered in the lower bass frequencies. Changing the materials of the panels on the side walls in the auditorium is thus successful to adapt the function of the auditorium. 2,5 2 1,5 Beniganim Average T30 Beginsituation (a)after adapting wall panels (b)after adapting wall panels + sides ceiling 1 0, Frequencies [Hz] Figure 3.8 Effects of adjusting surface materials on the average T30 values To create more uniformity in the auditorium, the reflective sloping panels that are situated at the sides of the ceiling are also replaced by the same acoustic wall panel. The influence of replacing the surface materials of the side walls and the ceiling can be viewed in Figure 3.8 (b). The T30 values are a bit lower than in Figure 3.8 (a).
42 42 Conclusion The acoustic quality of the auditorium can be obtained by using various methods. When these methods have to be compared with each other, it suffices to compare the T30 values of the different methods. This is because the reverberation time is one of the most important parameters to evaluate the acoustic quality of a space. When the current situation is analysed, it can be concluded that the auditorium in Beniganim meets the predefined optimal values for the acoustic quality parameters. After replacing the horizontal ceiling above the stage with inclining planes, more first and early reflections reaching the audience and the musicians, are obtained. This improvement results in a better intimacy and a better immediacy towards the musicians. By changing some of the surface materials to more absorbent materials, a lower reverberation T30 curve is obtained. Especially in the lower bass frequencies, the values are increased. The higher absorption in the lower frequencies creates a better value for the warmth parameter. The increase of the lower frequencies is necessary for speech and therefore ensures that the auditorium in Beniganim can function as a conference hall. Figure 1 T30 curve, simulation of current situation Figure 2 T30 curve, simulation after improvement
43 43 References Barnett, P., & Knight, R. (1995). The Common Intelligibility Scale. Beranek, L. L. (1979). Concert Halls and Opera Houses: Music, Acoustics and Architecture. Springer. Beranek, L. L. (1979). Concert Halls and Opera Houses: Music, Acoustics and Architecture. Springer. Beranek, L. L. (1986). Acoustics. Inc. Beranek, L. L., & Vér, I. L. (2005). Noise and Vibration Control Engineering: Principles and Applications. Wiley. Cirrus Research plc. (2011). Calculation of NR and NC curves in the optimus sound level meter and the NoiseTools software. North Yorkshire, United Kingdom: Cirrus Research plc. Houtgast, T., & Steeneken, H. (1971). Evaluation of Speech Transmission Channels by Usiing Artificial Signals. Llinares Millan, J. (2013). Estudio Acustico Sede Cultural Fundacion Cerezales. Long, M. (2006). Architectural Acoustics. Elsevier Academic Press. Marshall, A. (1967). A Note on the Importance of Room Cross-Section in Concert Halls. Physics Illionois. (n.d.). Labs: Octave Bands. Retrieved March 10, 2015, from courses.physics.illinois.edu/phys193/labs/octave_bands.pdf Riethof, C. (n.d.). The Time Gap. Retrieved Maart 11, 2015, from Full Compass:
44 Annex I. Results of the in situ measurements (current situation) 44
45 C50 [db] C50 [db] 45 Auditorium Beniganim C Frequencies [Hz} Pos 1 Pos 2 Pos 3 Pos 4 Pos 5 Pos 6 Pos 7 Pos 8 Pos 9 Pos 10 Pos 11 Pos 12 Pos 13 Pos 14 Pos 15 Pos 16 Pos 17 Pos 18 Auditorium Beniganim Average C Average C Frequencies [Hz]
46 C80 [db] C80 [db] 46 Auditorium Beniganim C Frequencies [Hz} Pos 1 Pos 2 Pos 3 Pos 4 Pos 5 Pos 6 Pos 7 Pos 8 Pos 9 Pos 10 Pos 11 Pos 12 Pos 13 Pos 14 Pos 15 Pos 16 Pos 17 Pos 18 8 Auditorium Beniganim Average C Average C Frequencies [Hz]
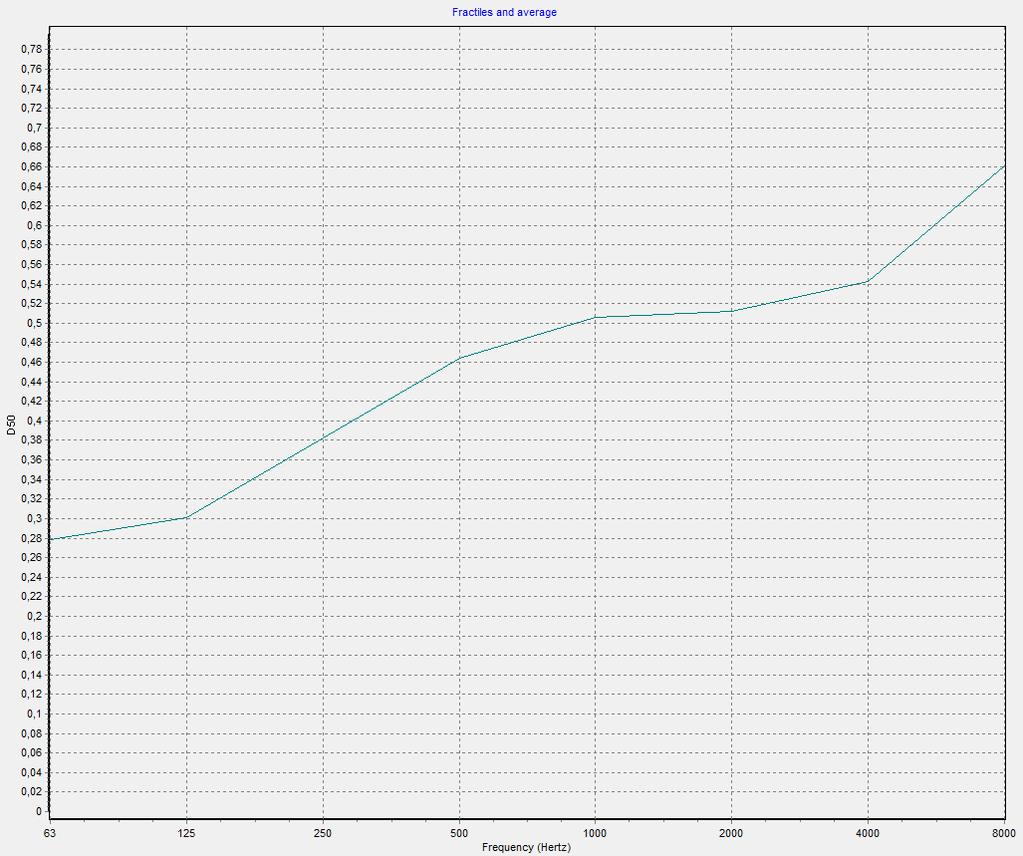
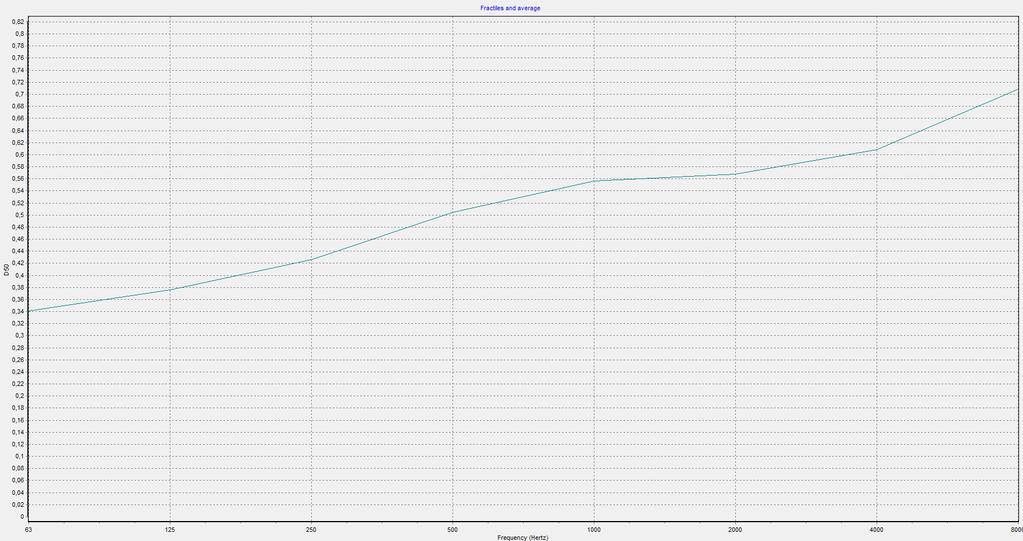
47 D50 D ,8 0,7 0,6 0,5 0,4 0,3 0,2 0,1 0 Auditorium Beniganim D Frequencies [Hz] Pos 1 Pos 2 Pos 3 Pos 4 Pos 5 Pos 6 Pos 7 Pos 8 Pos 9 Pos 10 Pos 11 Pos 12 Pos 13 Pos 14 Pos 15 Pos 16 Pos 17 Pos 18 Auditorium Beniganim Average D50 0,8 0,7 0,6 0,5 0,4 0,3 Average D50 0,2 0, Frequencies [Hz]
48 D80 D ,9 0,8 0,7 0,6 0,5 0,4 0,3 0,2 0,1 0 Auditorium Beniganim D Frequencies [Hz] Pos 1 Pos 2 Pos 3 Pos 4 Pos 5 Pos 6 Pos 7 Pos 8 Pos 9 Pos 10 Pos 11 Pos 12 Pos 13 Pos 14 Pos 15 Pos 16 Pos 17 Pos 18 0,9 0,8 0,7 0,6 0,5 0,4 0,3 0,2 0,1 0 Auditorium Beniganim Average D Frequencies [Hz] Average D80
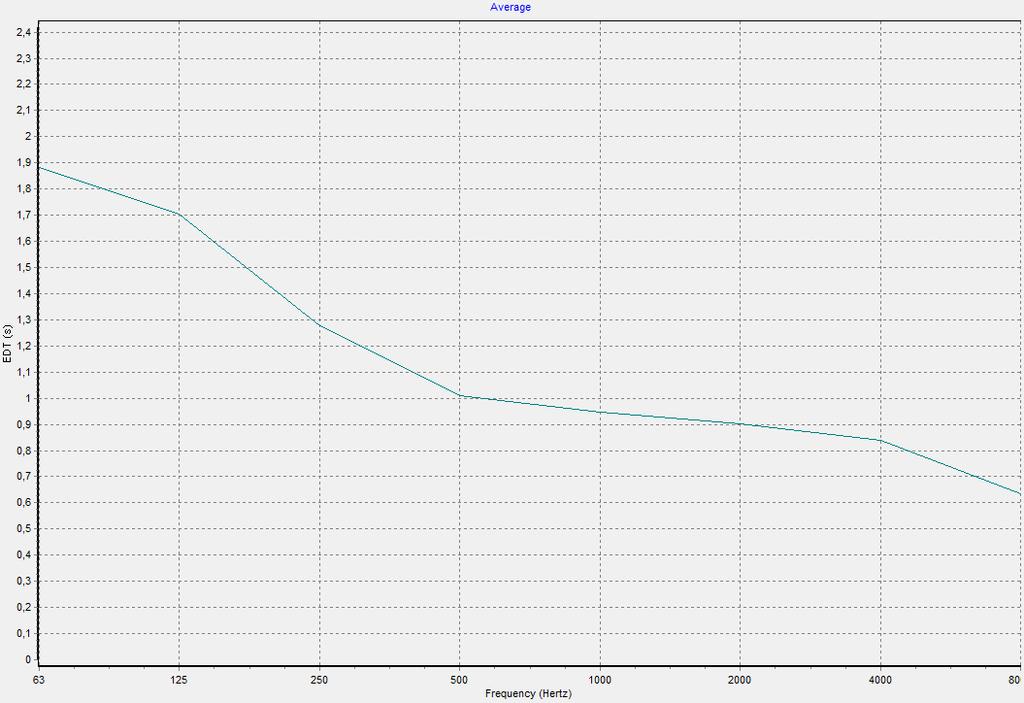
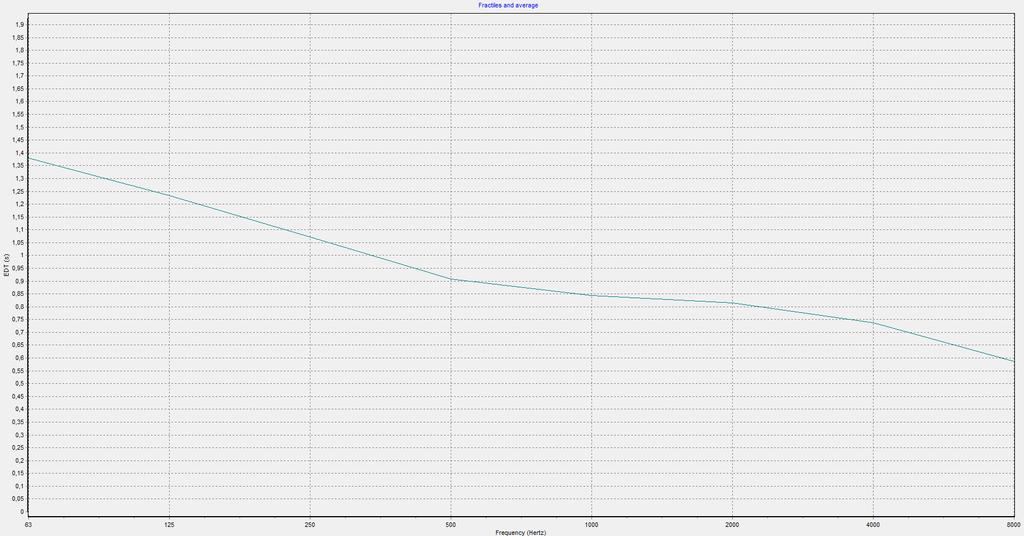
49 Tr [s] Tr [s] 49 2,25 2 1,75 1,5 1,25 1 0,75 0,5 0,25 0 Auditorium Beniganim EDT Frequencies [Hz] Pos 1 Pos 2 Pos 3 Pos 4 Pos 5 Pos 6 Pos 7 Pos 8 Pos 9 Pos 10 Pos 11 Pos 12 Pos 13 Pos 14 Pos 15 Pos 16 Pos 17 Pos ,8 1,6 1,4 1,2 1 0,8 0,6 0,4 Auditorium Beniganim Average EDT Frequencies [Hz] Average EDT
50 RT[s] RT [s] 50 2,3 2,1 1,9 1,7 1,5 1,3 1,1 0,9 0,7 0,5 Auditorium Benigamin Reverberation Time Frequencies [Hz] Pos 1 Pos 2 Pos 3 Pos 4 Pos 5 Pos 6 Pos 7 Pos 8 Pos 9 Pos 10 Pos 11 Pos 12 Pos 13 Pos 14 Pos 15 Pos 16 Pos 17 Pos 18 2,5 Auditorium Beniganim Average Reverberation Tme 2 1,5 1 Average RT 0, Frequencies [Hz]
51 Tr [s] Tr [s] 51 2,5 2 1,5 1 0,5 0 Auditorium Beniganim T Frequencies [Hz] Pos 1 Pos 2 Pos 3 Pos 4 Pos 5 Pos 6 Pos 7 Pos 8 Pos 9 Pos 10 Pos 11 Pos 12 Pos 13 Pos 14 Pos 15 Pos 16 Pos 17 Pos 18 2,5 Auditorium Beniganim Average T30 2 1,5 Average T30 1 0, Frequencies [Hz]
52 52 STI female STI male P1 0,55 0,54 P2 0,52 0,52 P3 0,55 0,54 P4 0,55 0,54 P5 0,54 0,53 P6 0,54 0,53 P7 0,57 0,56 P8 0,63 0,62 P9 0,59 0,58 P10 0,59 0,59 P11 0,60 0,60 P12 0,57 0,56 P13 0,58 0,58 P14 0,56 0,55 P15 0,53 0,53 P16 0,57 0,56 P17 0,55 0,55 P18 0,58 0,58
53 Annex II. Results of the simulation in ODEON (current situation) 53
54 54 C80
55 55
56 56
57 57 D50
58 58
59 59
60 60
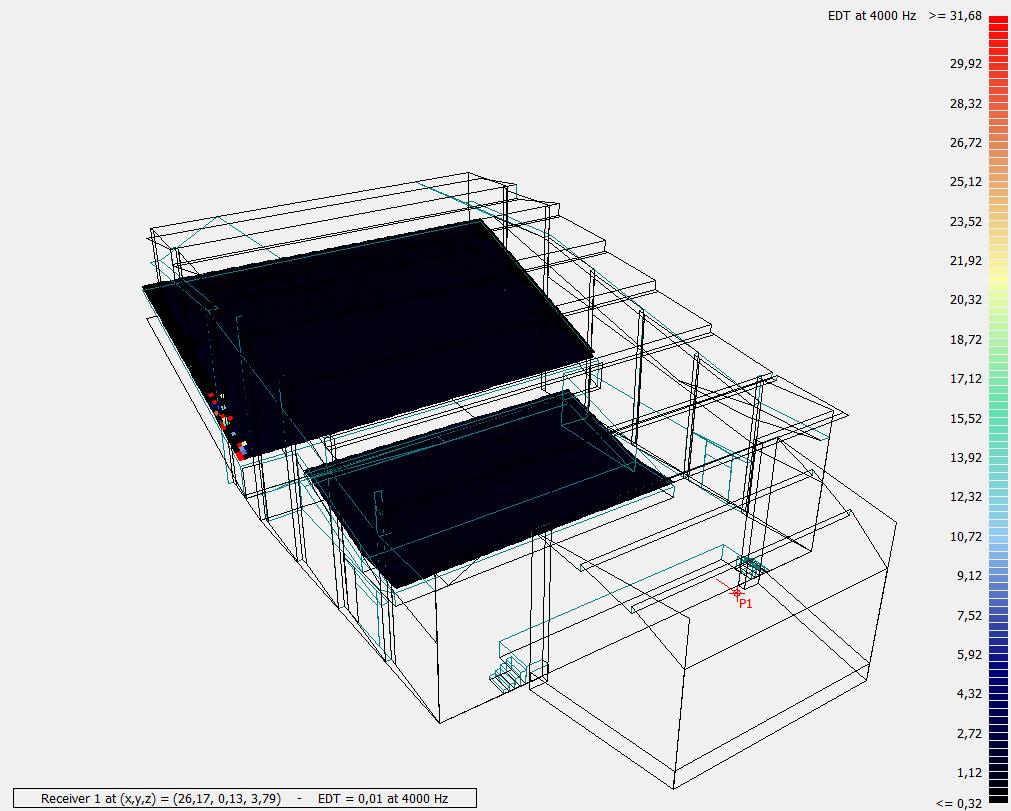
61 61 EDT
62 62
63 63
64 64
65 65
66 66 T30
67 67
68 68
69 69
70 70 SPL (A) STI
71 Annex III. Results of the simulation in ODEON (after improvement) 71
72 72 C80
73 73
74 74
75 75 D50
76 76
77 77
78 78
79 79 EDT
80 80
81 81
82 82
83 83 T30
84 84
85 85
86 86
87 87 SPL (A) STI
88 Annex IX. Data Sheet TECTOPANEL 88
89 89
Universitat Politècnica de València
 Universitat Politècnica de València Escuela Técnica Superior de Ingeniería de Edificación Camino de Vera Valencia Master of Science in Engineering Technology: Construction Study of the acoustic conditioning
Room Acoustics. March 27th 2015
 Room Acoustics March 27th 2015 Question How many reflections do you think a sound typically undergoes before it becomes inaudible? As an example take a 100dB sound. How long before this reaches 40dB?
THE ACOUSTICS OF A MULTIPURPOSE CULTURAL HALL
 International Journal of Civil Engineering and Technology (IJCIET) Volume 8, Issue 8, August 2017, pp. 1159 1164, Article ID: IJCIET_08_08_124 Available online at http://http://www.iaeme.com/ijciet/issues.asp?jtype=ijciet&vtype=8&itype=8
ROOM ACOUSTICS MEASUREMENT AND ASSESSMENT METHODS. 1. Signal to Noise OBJECTIVE METHODS ASSESSMENT OF ROOM ACOUSTICS CAN BE DIVIDED INTO:
 ROOM ACOUSTICS MEASUREMENT AND ASSESSMENT METHODS ASSESSMENT OF ROOM ACOUSTICS CAN BE DIVIDED INTO: OBJECTIVE MEASUREMENT METHODS SUBJECTIVE ASSESSMENTS OBJECTIVE METHODS 1. Signal to Noise Ratio 2. Loudness
Measuring procedures for the environmental parameters: Acoustic comfort
 Measuring procedures for the environmental parameters: Acoustic comfort Abstract Measuring procedures for selected environmental parameters related to acoustic comfort are shown here. All protocols are
The Effect of Television Decors on the Change of Reverberation Time of the Studio
 Open Journal of Acoustics, 2013, 3, 31-35 http://dx.doi.org/10.4236/oja.2013.32005 Published Online June 2013 (http://www.scirp.org/journal/oja) The Effect of Television Decors on the Change of Reverberation
Please refer to the figure on the following page which shows the relationship between sound fields.
 Defining Sound s Near The near field is the region close to a sound source usually defined as ¼ of the longest wave-length of the source. Near field noise levels are characterized by drastic fluctuations
Design Project. Kresge Auditorium Lighting Studies and Acoustics. By Christopher Fematt Yuliya Bentcheva
 Design Project Kresge Auditorium Lighting Studies and Acoustics By Christopher Fematt Yuliya Bentcheva Due to the function of Kresge Auditorium, the main stage space does not receive any natural light.
ODEON APPLICATION NOTE Calculation of Speech Transmission Index in rooms
 ODEON APPLICATION NOTE Calculation of Speech Transmission Index in rooms JHR, February 2014 Scope Sufficient acoustic quality of speech communication is very important in many different situations and
Improving room acoustics at low frequencies with multiple loudspeakers and time based room correction
 Improving room acoustics at low frequencies with multiple loudspeakers and time based room correction S.B. Nielsen a and A. Celestinos b a Aalborg University, Fredrik Bajers Vej 7 B, 9220 Aalborg Ø, Denmark
DESIGN OF VOICE ALARM SYSTEMS FOR TRAFFIC TUNNELS: OPTIMISATION OF SPEECH INTELLIGIBILITY
 DESIGN OF VOICE ALARM SYSTEMS FOR TRAFFIC TUNNELS: OPTIMISATION OF SPEECH INTELLIGIBILITY Dr.ir. Evert Start Duran Audio BV, Zaltbommel, The Netherlands The design and optimisation of voice alarm (VA)
Digitally controlled Active Noise Reduction with integrated Speech Communication
 Digitally controlled Active Noise Reduction with integrated Speech Communication Herman J.M. Steeneken and Jan Verhave TNO Human Factors, Soesterberg, The Netherlands herman@steeneken.com ABSTRACT Active
SIA Software Company, Inc.
 SIA Software Company, Inc. One Main Street Whitinsville, MA 01588 USA SIA-Smaart Pro Real Time and Analysis Module Case Study #2: Critical Listening Room Home Theater by Sam Berkow, SIA Acoustics / SIA
19 th INTERNATIONAL CONGRESS ON ACOUSTICS MADRID, 2-7 SEPTEMBER 2007 TRANSPARENT CONCERT HALL ACOUSTICS
 th INTERNATIONAL CONGRESS ON ACOUSTICS MADRID, - SEPTEMBER 00 TRANSPARENT CONCERT HALL ACOUSTICS PACS:..Fw Van Luxemburg, Renz,, ; Hak, C.C.J.M ; Kok, B.H.M ; Van den Braak,E. LeVeL Acoustics BV; De Rondom
ACOUSTICAL COMPUTER SIMULATIONS OF THE ANCIENT ROMAN THEATRES
 ACOUSTICAL COMPUTER SIMULATIONS OF THE ANCIENT ROMAN THEATRES M.Lisa, J.H. Rindel, A.C. Gade, C.L. Christensen Technical University of Denmark, Ørsted DTU Acoustical Technology Department, Lyngby, Denmark
ODEON APPLICATION NOTE ISO Open plan offices Part 2 Measurements
 ODEON APPLICATION NOTE ISO 3382-3 Open plan offices Part 2 Measurements JHR, May 2014 Scope This is a guide how to measure the room acoustical parameters specially developed for open plan offices according
Mei Wu Acoustics. By Mei Wu and James Black
 Experts in acoustics, noise and vibration Effects of Physical Environment on Speech Intelligibility in Teleconferencing (This article was published at Sound and Video Contractors website www.svconline.com
Chapter 12. Preview. Objectives The Production of Sound Waves Frequency of Sound Waves The Doppler Effect. Section 1 Sound Waves
 Section 1 Sound Waves Preview Objectives The Production of Sound Waves Frequency of Sound Waves The Doppler Effect Section 1 Sound Waves Objectives Explain how sound waves are produced. Relate frequency
Psychoacoustic Cues in Room Size Perception
 Audio Engineering Society Convention Paper Presented at the 116th Convention 2004 May 8 11 Berlin, Germany 6084 This convention paper has been reproduced from the author s advance manuscript, without editing,
What applications is a cardioid subwoofer configuration appropriate for?
 SETTING UP A CARDIOID SUBWOOFER SYSTEM Joan La Roda DAS Audio, Engineering Department. Introduction In general, we say that a speaker, or a group of speakers, radiates with a cardioid pattern when it radiates
Validation of lateral fraction results in room acoustic measurements
 Validation of lateral fraction results in room acoustic measurements Daniel PROTHEROE 1 ; Christopher DAY 2 1, 2 Marshall Day Acoustics, New Zealand ABSTRACT The early lateral energy fraction (LF) is one
CONTENTS. Preface...vii. Acknowledgments...ix. Chapter 1: Behavior of Sound...1. Chapter 2: The Ear and Hearing...11
 CONTENTS Preface...vii Acknowledgments...ix Chapter 1: Behavior of Sound...1 The Sound Wave...1 Frequency...2 Amplitude...3 Velocity...4 Wavelength...4 Acoustical Phase...4 Sound Envelope...7 Direct, Early,
Multichannel Audio Technologies. More on Surround Sound Microphone Techniques:
 Multichannel Audio Technologies More on Surround Sound Microphone Techniques: In the last lecture we focused on recording for accurate stereophonic imaging using the LCR channels. Today, we look at the
An Introduction to Digital Steering
 An Introduction to Digital Steering The line array s introduction to the professional audio market in the 90s signaled a revolution for both live concert applications and installations. With a high directivity
A3D Contiguous time-frequency energized sound-field: reflection-free listening space supports integration in audiology
 A3D Contiguous time-frequency energized sound-field: reflection-free listening space supports integration in audiology Joe Hayes Chief Technology Officer Acoustic3D Holdings Ltd joe.hayes@acoustic3d.com
ACOUSTICS IN THE MULTIPURPOSE HALLS OF THE NEW MAIN LIBRARY AND THE NEW MUNCH MUSEUM IN OSLO
 ACOUSTICS IN THE MULTIPURPOSE HALLS OF THE NEW MAIN LIBRARY AND THE NEW MUNCH MUSEUM IN OSLO J Olshausen J H Rindel Multiconsult as, Oslo, Norway Multiconsult as, Oslo, Norway 1 INTRODUCTION This paper
STUDIO ACUSTICUM A CONCERT HALL WITH VARIABLE VOLUME
 STUDIO ACUSTICUM A CONCERT HALL WITH VARIABLE VOLUME Rikard Ökvist Anders Ågren Björn Tunemalm Luleå University of Technology, Div. of Sound & Vibrations, Luleå, Sweden Luleå University of Technology,
Case study for voice amplification in a highly absorptive conference room using negative absorption tuning by the YAMAHA Active Field Control system
 Case study for voice amplification in a highly absorptive conference room using negative absorption tuning by the YAMAHA Active Field Control system Takayuki Watanabe Yamaha Commercial Audio Systems, Inc.
What you Need: Exel Acoustic Set with XL2 Analyzer M4260 Measurement Microphone Minirator MR-PRO
 How To... Handheld Solution for Installed Sound This document provides a practical guide on how to use NTi Audio instruments for commissioning and servicing Installed Sound environments and Evacuation
installation in performance halls
 Emplacement réservé pour une photo Isabelle Schmich The Carmen system and its installation in performance halls ACOUSTIC AND LIGHTING DEPARTMENT CARMEN SSA - 31 octobre 2008 PAGE 1 Reverberation Enhancement
New ON/OFF Absorption Technology That Includes Low Frequencies
 Toronto, Canada International Symposium on Room Acoustics 2013 June 9-11 ISRA 2013 New ON/OFF Absorption Technology That Includes Low Frequencies Niels W. Adelman-Larsen (nwl@flexac.com) Flex Acoustics
How To... Commission an Installed Sound Environment
 How To... Commission an Installed Sound Environment This document provides a practical guide on how to use NTi Audio instruments for commissioning and servicing Installed Sound environments and Evacuation
RECENT EXPERIENCES WITH ELECTRONIC ACOUSTIC ENHANCEMENT IN CONCERT HALLS AND OPERA HOUSES
 RECENT EXPERIENCES WITH ELECTRONIC ACOUSTIC ENHANCEMENT IN CONCERT HALLS AND OPERA HOUSES David Griesinger Lexicon 3 Oak Park Bedford, MA 01730 dg@lexicon.com www.lares-lexicon.com Contents: Major Message:
CHAPTER 3 THE DESIGN OF TRANSMISSION LOSS SUITE AND EXPERIMENTAL DETAILS
 35 CHAPTER 3 THE DESIGN OF TRANSMISSION LOSS SUITE AND EXPERIMENTAL DETAILS 3.1 INTRODUCTION This chapter deals with the details of the design and construction of transmission loss suite, measurement details
Perception of pitch. Definitions. Why is pitch important? BSc Audiology/MSc SHS Psychoacoustics wk 4: 7 Feb A. Faulkner.
 Perception of pitch BSc Audiology/MSc SHS Psychoacoustics wk 4: 7 Feb 2008. A. Faulkner. See Moore, BCJ Introduction to the Psychology of Hearing, Chapter 5. Or Plack CJ The Sense of Hearing Lawrence Erlbaum,
Perception of pitch. Importance of pitch: 2. mother hemp horse. scold. Definitions. Why is pitch important? AUDL4007: 11 Feb A. Faulkner.
 Perception of pitch AUDL4007: 11 Feb 2010. A. Faulkner. See Moore, BCJ Introduction to the Psychology of Hearing, Chapter 5. Or Plack CJ The Sense of Hearing Lawrence Erlbaum, 2005 Chapter 7 1 Definitions
An Investigation on Factors That Cause Error in Reverberation Time Measurement (ISO 3382) in UTHM Lecturer Room
 in UTHM Lecturer Room") An Investigation on Factors That Cause Error in Reverberation Time Measurement (ISO 3382) in UTHM Lecturer 1 Azalan. A 1, a, Ghazali. M. I 1, Jafferi. N 1 Universiti Tun Hussein Onn Malaysia (UTHM) 86400
An Investigation on Factors That Cause Error in Reverberation Time Measurement (ISO 3382) in UTHM Lecturer 1 Azalan. A 1, a, Ghazali. M. I 1, Jafferi. N 1 Universiti Tun Hussein Onn Malaysia (UTHM) 86400
Sound, acoustics Slides based on: Rossing, The science of sound, 1990.
 Sound, acoustics Slides based on: Rossing, The science of sound, 1990. Acoustics 1 1 Introduction Acoustics 2! The word acoustics refers to the science of sound and is a subcategory of physics! Room acoustics
Envelopment and Small Room Acoustics
 Envelopment and Small Room Acoustics David Griesinger Lexicon 3 Oak Park Bedford, MA 01730 Copyright 9/21/00 by David Griesinger Preview of results Loudness isn t everything! At least two additional perceptions:
Reducing comb filtering on different musical instruments using time delay estimation
 Reducing comb filtering on different musical instruments using time delay estimation Alice Clifford and Josh Reiss Queen Mary, University of London alice.clifford@eecs.qmul.ac.uk Abstract Comb filtering
Creating an urban street reverberation map
 Creating an urban street reverberation map P. Thomas, E. De Boeck, L. Dragonetti, T. Van Renterghem and D. Botteldooren Pieter.Thomas@intec.ugent.be Department of Information Technology (INTEC), Ghent
Perception of pitch. Definitions. Why is pitch important? BSc Audiology/MSc SHS Psychoacoustics wk 5: 12 Feb A. Faulkner.
 Perception of pitch BSc Audiology/MSc SHS Psychoacoustics wk 5: 12 Feb 2009. A. Faulkner. See Moore, BCJ Introduction to the Psychology of Hearing, Chapter 5. Or Plack CJ The Sense of Hearing Lawrence
Proceedings of Meetings on Acoustics
 Proceedings of Meetings on Acoustics Volume 19, 2013 http://acousticalsociety.org/ ICA 2013 Montreal Montreal, Canada 2-7 June 2013 Noise Session 4aNSa: Effects of Noise on Human Performance and Comfort
Acoustic solid angle criteria in practice: transforming the Chapelle Corneille in Rouen into a concert hall
 Proceedings of the Acoustics 2012 Nantes Conference 23-27 April 2012, Nantes, France Acoustic solid angle criteria in practice: transforming the Chapelle Corneille in Rouen into a concert hall Y. Jurkiewicz,
ISSUED BY KENDRIYA VIDYALAYA - DOWNLOADED FROM CHAPTER 12 Sound
 1. Production of Sound CHAPTER 12 Sound KEY CONCEPTS [ *rating as per the significance of concept] 1 Production of Sound **** 2 Propagation of Sound ***** 3 Reflection of Sound ***** 4 Echo **** 5 Uses
29th TONMEISTERTAGUNG VDT INTERNATIONAL CONVENTION, November 2016
 Measurement and Visualization of Room Impulse Responses with Spherical Microphone Arrays (Messung und Visualisierung von Raumimpulsantworten mit kugelförmigen Mikrofonarrays) Michael Kerscher 1, Benjamin
WITHIN GENERATOR APPLICATIONS
 POWER SYSTEMS TOPICS 9 Measuring and Understanding Sound WITHIN GENERATOR APPLICATIONS INTRODUCTION When selecting a generator, there are many factors to consider so as not to negatively impact the existing
Magne Skålevik Brekke & Strand, Oslo, Norway. Small room acoustics THE HARD CASE
 Magne Skålevik Brekke & Strand, Oslo, Norway www.akutek.info Small room acoustics THE HARD CASE The Hard Case Cuboid room, dimensions given, take it or leave it Hard walls Hard floor Soft material elements
Speech Intelligibility
 Speech Intelligibility Measurement with XL2 Analyzer The XL2 Analyzer measures the speech intelligibility according to the latest revision of standard IEC 60268-16:2011 (edition 4) and older editions.
Volume (cu. Ft.) Total Abosrption 3340 Room Volume Reverbation Time 1.53
 Total Abosrption 3340 Room Volume Reverbation Time 1.53") Lionell Hampton School of Music Auditorium Haddock Performance Hall Space Evaluated on April 29th, 2012 by: Janice Kammler Alto and Tenor Saxophones Performance by: Patrick McCulley and on April 20th,
Lionell Hampton School of Music Auditorium Haddock Performance Hall Space Evaluated on April 29th, 2012 by: Janice Kammler Alto and Tenor Saxophones Performance by: Patrick McCulley and on April 20th,
PHYSICS 107 LAB #6: SINGING IN THE SHOWER, SINGING
 Section: Monday / Tuesday (circle one) Name: Partners: /29 pts Could add in a simple Articulation test (p. 186 of The Taylor Manual of experiments or at http://arch37 3.wikispaces. com/sound+ Off) for
ALTERNATING CURRENT (AC)
") ALL ABOUT NOISE ALTERNATING CURRENT (AC) Any type of electrical transmission where the current repeatedly changes direction, and the voltage varies between maxima and minima. Therefore, any electrical
ALL ABOUT NOISE ALTERNATING CURRENT (AC) Any type of electrical transmission where the current repeatedly changes direction, and the voltage varies between maxima and minima. Therefore, any electrical
Suppose you re going to mike a singer, a sax, or a guitar. Which mic should you choose? Where should you place it?
 MICROPHONE TECHNIQUE BASICS FOR MUSICAL INSTRUMENTS by Bruce Bartlett Copyright 2010 Suppose you re going to mike a singer, a sax, or a guitar. Which mic should you choose? Where should you place it? Your
An Introduction to Electronic Beam Steering
 An Introduction to Electronic Beam Steering The line array s introduction to the professional audio market in the 90s signaled a revolution for both live concert applications and installations. With a
Monitor Setup Guide The right monitors. The correct setup. Proper sound.
 Monitor Setup Guide 2017 The right monitors. The correct setup. Proper sound. Table of contents Genelec Key Technologies 3 What is a monitor? 4 What is a reference monitor? 4 Selecting the correct monitors
Acoustical Testing 1
 Material Study By: IRINEO JAIMES TEAM ANDREW MILLER SAM SHROYER NATHAN NEGRU ERICH PFISTER Acoustical Testing 1 Dr. Lauren Ronsse, Dr. Dominique Chéenne 11/05/2014 Table of Contents Abstract. 3 Introduction....3
Acoustics II: Kurt Heutschi recording technique. stereo recording. microphone positioning. surround sound recordings.
 demo Acoustics II: recording Kurt Heutschi 2013-01-18 demo Stereo recording: Patent Blumlein, 1931 demo in a real listening experience in a room, different contributions are perceived with directional
Structure of Speech. Physical acoustics Time-domain representation Frequency domain representation Sound shaping
 Structure of Speech Physical acoustics Time-domain representation Frequency domain representation Sound shaping Speech acoustics Source-Filter Theory Speech Source characteristics Speech Filter characteristics
EQ s & Frequency Processing
 LESSON 9 EQ s & Frequency Processing Assignment: Read in your MRT textbook pages 403-441 This reading will cover the next few lessons Complete the Quiz at the end of this chapter Equalization We will now
FIR/Convolution. Visulalizing the convolution sum. Convolution
 FIR/Convolution CMPT 368: Lecture Delay Effects Tamara Smyth, tamaras@cs.sfu.ca School of Computing Science, Simon Fraser University April 2, 27 Since the feedforward coefficient s of the FIR filter are
SIMULATION OF CERTAIN ACOUSTIC PROPERTIES OF THE "KNEŽEV DVOR" IN DUBROVNIK
 SIMULATION OF CERTAIN ACOUSTIC PROPERTIES OF THE "KNEŽEV DVOR" IN DUBROVNIK Bojan Ivančević 1, Marjan Sikora 2, Kristian Jambrošić 1 1 FER, Unska 3, Zagreb, Croatia, bojan.ivancevic@fer.hr, kristian.jambrosic@fer.hr
Audience noise in concert halls during musical performances
 Audience noise in concert halls during musical performances Pierre Marie a) Cheol-Ho Jeong b) Jonas Brunskog c) Acoustic Technology, Department of Electrical Engineering, Technical University of Denmark
DESIGN OF ROOMS FOR MULTICHANNEL AUDIO MONITORING
 DESIGN OF ROOMS FOR MULTICHANNEL AUDIO MONITORING A.VARLA, A. MÄKIVIRTA, I. MARTIKAINEN, M. PILCHNER 1, R. SCHOUSTAL 1, C. ANET Genelec OY, Finland genelec@genelec.com 1 Pilchner Schoustal Inc, Canada
ONLINE TUTORIALS. Log on using your username & password. (same as your ) Choose a category from menu. (ie: audio)
 Choose a category from menu. (ie: audio)") ONLINE TUTORIALS Go to http://uacbt.arizona.edu Log on using your username & password. (same as your email) Choose a category from menu. (ie: audio) Choose what application. Choose which tutorial movie.
ONLINE TUTORIALS Go to http://uacbt.arizona.edu Log on using your username & password. (same as your email) Choose a category from menu. (ie: audio) Choose what application. Choose which tutorial movie.
EFFECT OF STIMULUS SPEED ERROR ON MEASURED ROOM ACOUSTIC PARAMETERS
 19 th INTERNATIONAL CONGRESS ON ACOUSTICS MADRID, 2-7 SEPTEMBER 2007 EFFECT OF STIMULUS SPEED ERROR ON MEASURED ROOM ACOUSTIC PARAMETERS PACS: 43.20.Ye Hak, Constant 1 ; Hak, Jan 2 1 Technische Universiteit
Microphone a transducer that converts one type of energy (sound waves) into another corresponding form of energy (electric signal).
 into another corresponding form of energy (electric signal).") 1 Professor Calle ecalle@mdc.edu www.drcalle.com MUM 2600 Microphone Notes Microphone a transducer that converts one type of energy (sound waves) into another corresponding form of energy (electric signal).
1 Professor Calle ecalle@mdc.edu www.drcalle.com MUM 2600 Microphone Notes Microphone a transducer that converts one type of energy (sound waves) into another corresponding form of energy (electric signal).
A BEM study of the influence of musicians on onstage sound field measures in auditoria
 A BEM study of the influence of musicians on onstage sound field measures in auditoria Lily PANTON ; Damien HOLLOWAY ; School of Engineering and ICT, University of Tasmania, Hobart Australia ABSTRACT Many
AN547 - Why you need high performance, ultra-high SNR MEMS microphones
 AN547 AN547 - Why you need high performance, ultra-high SNR MEMS Table of contents 1 Abstract................................................................................1 2 Signal to Noise Ratio (SNR)..............................................................2
IS SII BETTER THAN STI AT RECOGNISING THE EFFECTS OF POOR TONAL BALANCE ON INTELLIGIBILITY?
 IS SII BETTER THAN STI AT RECOGNISING THE EFFECTS OF POOR TONAL BALANCE ON INTELLIGIBILITY? G. Leembruggen Acoustic Directions, Sydney Australia 1 INTRODUCTION 1.1 Motivation for the Work With over fifteen
LOW FREQUENCY SOUND IN ROOMS
 Room boundaries reflect sound waves. LOW FREQUENCY SOUND IN ROOMS For low frequencies (typically where the room dimensions are comparable with half wavelengths of the reproduced frequency) waves reflected
Lift-over crossings as a solution to tram-generated ground-borne vibration and re-radiated noise
 Lift-over crossings as a solution to tram-generated James P Talbot Principal Vibration Engineer Design & Engineering Atkins Abstract The operation of tramways close to sensitive buildings can lead to concerns
I present the latest floorstanding loudspeakers from acuhorn manufacture, acuhorn nero125 improved audio. This construction introduces a complete
 acuhorn nero125 I present the latest floorstanding loudspeakers from acuhorn manufacture, acuhorn nero125 improved audio. This construction introduces a complete reengineering of the model recognized with
Active Field Control (AFC) Reverberation Enhancement System Using Acoustical Feedback Control
 Reverberation Enhancement System Using Acoustical Feedback Control") Active Field Control (AFC) Reverberation Enhancement System Using Acoustical Feedback Control What is AFC? Active Field Control Electro-acoustical sound field enhancement system *Enhancement of RT and
Active Field Control (AFC) Reverberation Enhancement System Using Acoustical Feedback Control What is AFC? Active Field Control Electro-acoustical sound field enhancement system *Enhancement of RT and
Analysis on Acoustic Attenuation by Periodic Array Structure EH KWEE DOE 1, WIN PA PA MYO 2
 www.semargroup.org, www.ijsetr.com ISSN 2319-8885 Vol.03,Issue.24 September-2014, Pages:4885-4889 Analysis on Acoustic Attenuation by Periodic Array Structure EH KWEE DOE 1, WIN PA PA MYO 2 1 Dept of Mechanical
Don t forget the quench pipe when installing an MRI
 Don t forget the quench pipe when installing an MRI C. Ostendorf Cauberg-Huygen R.I. BV, Postbus 4, 6 AL Maastricht, Netherlands c.ostendorf@chri.nl 5357 An MRI is a useful medical device but it makes
THE ERATO PROJECT AND ITS CONTRIBUTION TO OUR UNDERSTANDING OF THE ACOUSTICS OF ANCIENT THEATRES
 THE ERATO PROJECT AND ITS CONTRIBUTION TO OUR UNDERSTANDING OF THE ACOUSTICS OF ANCIENT THEATRES Jens Holger Rindel Odeon A/S, Scion-DTU, DK 2800 Kgs. Lyngby, Denmark e-mail: jhr@odeon.dk Abstract The
Preview. Sound Section 1. Section 1 Sound Waves. Section 2 Sound Intensity and Resonance. Section 3 Harmonics
 Sound Section 1 Preview Section 1 Sound Waves Section 2 Sound Intensity and Resonance Section 3 Harmonics Sound Section 1 TEKS The student is expected to: 7A examine and describe oscillatory motion and
Surround: The Current Technological Situation. David Griesinger Lexicon 3 Oak Park Bedford, MA
 Surround: The Current Technological Situation David Griesinger Lexicon 3 Oak Park Bedford, MA 01730 www.world.std.com/~griesngr There are many open questions 1. What is surround sound 2. Who will listen
Lesson 3 Measurement of sound
 Lesson 3 Measurement of sound 1.1 CONTENTS 1.1 Contents 1 1.2 Measuring noise 1 1.3 The sound level scale 2 1.4 Instruments used to measure sound 6 1.5 Recording sound data 14 1.6 The sound chamber 15
Public Address Systems
 ISBN 978 0 11792 743 8 Specification No. 15 United Kingdom Civil Aviation Authority Issue: 2 Date: 13 September 2012 This Specification is only directly applicable to those aircraft where Issue 1 of the
ROOM SHAPE AND SIZE ESTIMATION USING DIRECTIONAL IMPULSE RESPONSE MEASUREMENTS
 ROOM SHAPE AND SIZE ESTIMATION USING DIRECTIONAL IMPULSE RESPONSE MEASUREMENTS PACS: 4.55 Br Gunel, Banu Sonic Arts Research Centre (SARC) School of Computer Science Queen s University Belfast Belfast,
On the function of the violin - vibration excitation and sound radiation.
 TMH-QPSR 4/1996 On the function of the violin - vibration excitation and sound radiation. Erik V Jansson Abstract The bow-string interaction results in slip-stick motions of the bowed string. The slip
What is Sound? Part II
 What is Sound? Part II Timbre & Noise 1 Prayouandi (2010) - OneOhtrix Point Never PSYCHOACOUSTICS ACOUSTICS LOUDNESS AMPLITUDE PITCH FREQUENCY QUALITY TIMBRE 2 Timbre / Quality everything that is not frequency
Sound Processing Technologies for Realistic Sensations in Teleworking
 Sound Processing Technologies for Realistic Sensations in Teleworking Takashi Yazu Makoto Morito In an office environment we usually acquire a large amount of information without any particular effort
Environmental Noise Propagation
 Environmental Noise Propagation How loud is a 1-ton truck? That depends very much on how far away you are, and whether you are in front of a barrier or behind it. Many other factors affect the noise level,
Low frequency sound reproduction in irregular rooms using CABS (Control Acoustic Bass System) Celestinos, Adrian; Nielsen, Sofus Birkedal
 Celestinos, Adrian; Nielsen, Sofus Birkedal") Aalborg Universitet Low frequency sound reproduction in irregular rooms using CABS (Control Acoustic Bass System) Celestinos, Adrian; Nielsen, Sofus Birkedal Published in: Acustica United with Acta Acustica
Aalborg Universitet Low frequency sound reproduction in irregular rooms using CABS (Control Acoustic Bass System) Celestinos, Adrian; Nielsen, Sofus Birkedal Published in: Acustica United with Acta Acustica
Aalborg Universitet. Published in: Acustica United with Acta Acustica. Publication date: Document Version Early version, also known as pre-print
 Downloaded from vbn.aau.dk on: april 08, 2018 Aalborg Universitet Low frequency sound field control in rectangular listening rooms using CABS (Controlled Acoustic Bass System) will also reduce sound transmission
REVERBERATION CHAMBER FOR EMI TESTING
 1 REVERBERATION CHAMBER FOR EMI TESTING INTRODUCTION EMI Testing 1. Whether a product is intended for military, industrial, commercial or residential use, while it must perform its intended function in
The following is the summary of Keane Acoustics community mechanical noise study for the City of St. Petersburg.
 August 11, 2017 David Goodwin Director Planning & Economic Development Department City of St. Petersburg Re: City of St. Petersburg Dear Mr. Goodwin, The following is the summary of Keane Acoustics community
Three-dimensional sound field simulation using the immersive auditory display system Sound Cask for stage acoustics
 Stage acoustics: Paper ISMRA2016-34 Three-dimensional sound field simulation using the immersive auditory display system Sound Cask for stage acoustics Kanako Ueno (a), Maori Kobayashi (b), Haruhito Aso
Understanding Sound System Design and Feedback Using (Ugh!) Math by Rick Frank
 Math by Rick Frank") Understanding Sound System Design and Feedback Using (Ugh!) Math by Rick Frank Shure Incorporated 222 Hartrey Avenue Evanston, Illinois 60202-3696 (847) 866-2200 Understanding Sound System Design and
Understanding Sound System Design and Feedback Using (Ugh!) Math by Rick Frank Shure Incorporated 222 Hartrey Avenue Evanston, Illinois 60202-3696 (847) 866-2200 Understanding Sound System Design and
Ultrasonic Level Detection Technology. ultra-wave
 Ultrasonic Level Detection Technology ultra-wave 1 Definitions Sound - The propagation of pressure waves through air or other media Medium - A material through which sound can travel Vacuum - The absence
How to Record & Mix Acoustic Guitars
 How to Record & Mix Acoustic Guitars Reproducing the sound of an acoustic guitar presents a different set of challenges to that of an electric guitar. When we look at recording electric guitars, the focus
STUDIES OF EPIDAURUS WITH A HYBRID ROOM ACOUSTICS MODELLING METHOD
 STUDIES OF EPIDAURUS WITH A HYBRID ROOM ACOUSTICS MODELLING METHOD Tapio Lokki (1), Alex Southern (1), Samuel Siltanen (1), Lauri Savioja (1), 1) Aalto University School of Science, Dept. of Media Technology,
Answer:- School bell starts vibrating when heated which creates compression and rarefaction in air and sound is produced.
 Sound How does the sound produced by a vibrating object in a medium reach your ear? - Vibrations in an object create disturbance in the medium and consequently compressions and rarefactions. Because of
Introduction to Equalization
 Introduction to Equalization Tools Needed: Real Time Analyzer, Pink noise audio source The first thing we need to understand is that everything we hear whether it is musical instruments, a person s voice
Psychology of Language
 PSYCH 150 / LIN 155 UCI COGNITIVE SCIENCES syn lab Psychology of Language Prof. Jon Sprouse 01.10.13: The Mental Representation of Speech Sounds 1 A logical organization For clarity s sake, we ll organize
AMERICAN UNIVERSITY EAST CAMPUS DEVELOPMENT WASHINGTON, D.C. Environmental Noise Study. Project Number
 AMERICAN UNIVERSITY EAST CAMPUS DEVELOPMENT WASHINGTON, D.C. Environmental Noise Study Project Number 11-107 Douglas P. Koehn, M.S. Senior Consultant 12040 SOUTH LAKES DRIVE, SUITE 104, RESTON, VIRGINIA
ECMA-108. Measurement of Highfrequency. emitted by Information Technology and Telecommunications Equipment. 4 th Edition / December 2008
 ECMA-108 4 th Edition / December 2008 Measurement of Highfrequency Noise emitted by Information Technology and Telecommunications Equipment COPYRIGHT PROTECTED DOCUMENT Ecma International 2008 Standard
ARCHITECTURAL ACOUSTICS. Sound. bandshell; Honolulu, HI a passive, architectural system. Ball State Architecture ENVIRONMENTAL SYSTEMS 1 Grondzik 1
 ARCHITECTURAL ACOUSTICS SOUND & HEARING Sound bandshell; Honolulu, HI a passive, architectural system Ball State Architecture ENVIRONMENTAL SYSTEMS 1 Grondzik 1 Sound Can architecture be heard? Most people