INNOVATION AND ENTREPRENEURSHIP MEASUREMENT SYSTEM
|
|
|
- Posy Wheeler
- 5 years ago
- Views:
Transcription
1 INNOVATION AND ENTREPRENEURSHIP MEASUREMENT SYSTEM June 30, 2016
2 ii
3 Table of Contents Introduction... 1 Talent Pipeline... 3 FIRST Participation... 3 STEM Degrees... 4 Knowledge Worker Migration... 6 Workforce Education Level... 7 Science and Engineering Employment... 9 Academic Entrepreneurship Experience... 9 Research and Development State R&D Intensity Federal R&D Spending Corporate R&D Intensity SBIR & STTR Awards Academic Science and Engineering R&D Expenditures Patents Awarded Access to Capital Private Investment Public Sector Investment R&D Tax Credits Commercialization University Licensing University Startups University Environment Business Dynamics Startups Establishment Churn IPOs Fast Growing Firms Broadband Access Outputs High-Tech Employment Share High-Tech Payroll Share High-Tech Export Share Market Trends Data Sources and Definitions Appendix A. Data Tables iii
4 iv
5 Introduction The Commonwealth Innovation and Entrepreneurship Measurement System (IEMS), uses key metrics and outcomes to track the performance of Virginia s innovation economy. Innovation is widely recognized as the premier path to economic expansion both domestically and globally and it is clear that the drivers of innovation in our domestic economy are entrepreneurs of emerging, high-growth technology companies. According to the Kauffman Foundation, a leader in advancing innovation and entrepreneurship: Entrepreneurs who launch new businesses are the driving force behind a vibrant society when they create new jobs, renew the economy and expand human welfare. 1 The IEMS was established by the Virginia General Assembly to further the work of the Commonwealth Research and Technology Strategic Roadmap, which links funding for research commercialization projects to Virginia s strategic technology priorities. It creates a dashboard and strategic path to new opportunities in the innovation economy using key indicators that can assist lawmakers, industry leaders and other stakeholders with determining public-private investment priorities and policies. This year s IEMS report shows the most recent year reported for each indicator based on data availability as of June 27, Some indicators rely on reports that are issued only every two years and have a longer reporting cycle, while others are available each year and have a shorter reporting cycle. The older data are included here because they are key indicators; can be used in conjunction with information provided by other indicators to support a narrative regarding overall trends; and show Virginia s performance relative to other states. Interstate comparisons are made with reference to a group of six technology benchmark states (benchmark states), which were chosen based on economic similarities to Virginia and success in stimulating innovation and entrepreneurship. They include: California, Maryland, Massachusetts, North Carolina, Pennsylvania, and Texas. When a non-benchmark state leads on the particular indicator, that state is also identified. Lastly, a United States average is provided. Virginia intra-regional comparisons are made using eight Virginia regions. These regions are defined using the regional model of the Council on Virginia s Future and are: the Central, Eastern, Hampton Roads, Northern, Southside, Southwest, Valley, and West Central regions. More information about which counties and cities are included within each region can be found on the Council s Virginia Performs website:
6 2
7 TALENT PIPELINE Goal: Expand and enhance Virginia s high-quality and highly skilled workforce. Talent pipeline indicators measure the state s success at attracting, retaining, and producing human capital and the state s current availability of highly skilled workers. A skilled workforce is associated with higher productivity and is one of the most important inputs for fostering innovation and entrepreneurship. Talent pipeline indicators show trends for various educational levels, beginning with programs for primary school students and continuing through graduate school. They also examine degrees awarded in science, technology, engineering, and mathematics (STEM) fields and entrepreneurship training outputs. Enrollment in Virginia s FIRST (For Inspiration and Recognition of Science and Technology) program, which is designed to stimulate primary and secondary school interest in science and technology, decreased slightly from the year before. The number of degrees awarded in STEM fields at the postsecondary level has also steadily increased, although Associate s degree awards decreased slightly in 2013 and Interstate migration provided a net inflow of college-educated adults from 2009 to 2011 and 2013 but a net outflow in 2012 and Virginia continues to perform at or near the top among U.S. states in terms of college attainment rates and the percentage of its workforce in science and engineering occupations. Post-secondary entrepreneurial experience opportunities are also expanding. Most Virginia universities now offer either formal degree programs or concentrations in entrepreneurship as well as entrepreneurship centers and experiential learning programs. Why is the talent pipeline important? An educated workforce is more productive, thereby improving economic growth and wages. It is also more adaptive, open to new ideas, and entrepreneurial. In order to further improve the skills of its workforce, the state must train, retain, and attract skilled workers. Demand for skilled workers is high and expected to increase rapidly in the future, especially for workers in STEM occupations. Virginia s K-12 and public higher education institutions will play a key role in satisfying this demand. Higher education institutions are also providing more and varied entrepreneurship education and experience opportunities, which will help ensure that the Commonwealth has an expanding pool of potential entrepreneurs with the skills and experience needed to create startups and introduce new products and services. The state s impressively high percentage of STEM-prepared workers provides a key competitive advantage for future economic growth in high-tech industries. How has Virginia performed over the last five years? FIRST Participation FIRST is a non-profit organization that offers programs to stimulate primary and secondary school student interest in STEM education and career opportunities. Four FIRST programs are offered in Virginia: grades K-3 (Junior FIRST Lego League or Jr. FLL), grades 4-8 (FIRST Lego League or FLL), grades 7-12 (FIRST Tech Challenge or FTC), and grades 9-12 (FIRST Robotics Competition or FRC). Total FIRST participation in Virginia has increased from 2011 to 2014 but decreased slightly in In 2011, an estimated 7,597 students participated in FIRST programs. This steadily increased to 9,656 students in 2014 before decreasing to 9,496 in Participation rate increases over the period were highest in FTC, which increased from 459 in 2011 to 1,530 in 2015, a 229% rate of increase. FRC increased 11%, from 1,700 in 2011 to 1,875 in Participation in FLL increased from 4,376 in 2011 to 4,981 in 2015, a rate of increase of 17%. Although Jr. FLL increased over this time period as well, from 1,062 in 2011 to 1,110 in 2015 for a 6% increase, its highest participation year was attained in 2012 with 1,230 students. 3


8 4 STEM Degrees High-technology and innovative enterprises have a large and growing demand for workers with STEM degrees. The number of STEM degrees produced by state institutions of higher learning provides a measure of how well they are helping to meet this demand. The number of STEM degrees awarded by Virginia public, private non-profit, and private for-profit colleges and universities has generally increased over the last five years. Associate s degrees awarded increased from 3,661 in 2010 to 4,489 in 2012, but eased to 4,149 in Bachelor s, graduate, and professional degrees increased from 12,160 in 2010 to 15,747 in 2014.
9 On a population-adjusted basis Virginia awarded 50 Associate s degrees in STEM fields per 100,000 residents in This rate compares to 36 per 100,000 residents nationwide. Virginia s rate was sixth highest in the nation and was higher than all benchmark states except for California. The nation s highest percentage was in Arizona with 114 degrees per 100,000 residents. Virginia awarded 189 STEM field Bachelor s and higher degrees per 100,000 residents, ranking it 19th highest among states in the nation. This rate compared to a national average of 171 degrees per 100,000 population in Massachusetts was the leading state with 317 degrees per 100,000 residents. Among benchmark states, Virginia was lower than Massachusetts, Maryland (239), and Pennsylvania (238). 5

10 Knowledge Worker Migration Virginia has benefitted from a net influx of college-educated adults from across the nation for three of the last five years. There were 65,216 in-migrants and 64,818 out-migrants in 2010 and 76,922 in-migrants and 66,294 out-migrants in This positive trend was interrupted in 2012 when the number of in-migrants dropped to 74,165 and out-migrants climbed to 76,042. In 2013, net migration produced a surplus once again, with 80,428 college-educated adults moving to Virginia while 74,449 moved from Virginia to elsewhere in the U.S. However, a net outflow occurred again in 2014 with 80,108 out-migrants compared to 76,261 in-migrants. State migration rates for college-educated adults can vary in response to regional economic conditions and the relative size of the higher education sector. Virginia s net migration rate of college-educated adults was -1.9 per 1,000 population in 2014, which ranked 31st highest among U.S. states. This rate was higher than benchmark state Pennsylvania (-4.3), but lower than Texas (8.6), North Carolina (6.3), California (1.3), Mas- 6
11 sachusetts (-0.6), and Maryland (-1.2). The leading state for 2014 was Arizona at 14.1 per 1,000 population. The domestic net migration rate for the United States is, by definition, zero. Workforce Education Level The percentage of Virginia s workforce (defined here as anyone between the ages of 25 and 65) with at least a Bachelor s degree has steadily improved over the last five years. In 2010, 36.5% of the workforce had a Bachelor s degree or higher and 14.8% had a graduate or professional degree. By 2014, these percentages had improved to 38.8% and 16.2% respectively. Virginia ranked sixth among U.S. states in the percentage 7
12 8 of the workforce with Bachelor s degrees and fourth for graduate or professional degrees. Among benchmark states, only Massachusetts (44.3% for Bachelor s degree or higher and 18.7% for graduate/professional degrees) and Maryland (39.9% Bachelor s degree or higher and 17.8% for graduate/professional degrees) were higher.
13 Workforce educational achievement percentages vary widely within Virginia. Ranking highest in 2014 was the Northern region, where 54.3% of the workforce had a Bachelor s degree or higher and 24.5% had a graduate or professional degree. Science and Engineering Employment Virginia has an impressively high percentage of skilled workers, reflecting the state s knowledge-intensive industries. Virginia ranked first in the nation in the percentage of its workforce (7.5%) in science and engineering (S&E) occupations for 2014, up from 7.3% in Maryland (7.4%) and Massachusetts (6.9%) were the closest benchmark states. The national average was 4.7%. Academic Entrepreneurship Experience Virginia s public institutions of higher education stimulate interest and develop skills in entrepreneurship through training, experiential learning, formal degree programs and concentrations, entrepreneurial centers, student clubs and organizations, and entrepreneurial student living arrangements. Many colleges and universities have started or scaled up resources and programs in these areas in recent years. George Mason University and Virginia Tech provide formal degree programs in entrepreneurship, while the College of William and Mary, James Madison University, the University of Virginia, and Virginia Commonwealth University offer concentrations at the Master s or Baccalaureate levels. Centers for Entrepreneurship have been established at most institutions, including: the Alan B. Miller Entrepreneurship Center at the College of William & Mary; the Mason Enterprise Center (MEC) at George Mason University; James Madison University s Center for Entrepreneurship; the Strome Entrepreneurial Center and Center for Enterprise Innovation at Old Dominion University; the Galant Center for Entrepreneurship at the University of Virginia; the da Vinci Center at Virginia Commonwealth University; and the Apex Systems Center for Innovation and Entrepreneurship at Virginia Tech. Seven graduate-level public universities offer clubs and experiential learning programs and entrepreneurship training programs for students and members of the public. Total headcount in student and public entre- 9
14 preneurial training in FY2015 was estimated at 8,469. In addition, the College of William and Mary, Old Dominion University, Virginia Commonwealth University, and Virginia Tech offer student entrepreneurship living arrangements, which provide a living-learning community for learning, networking, and mentoring. What are the implications? The talent pipeline shows how well the state continues to build the human capital needed for innovative industries. FIRST participation, an indicator of K-12 interest in STEM learning that may lead to future increases in STEM college degree program enrollment, remains at high levels, though it decreased slightly in Virginia higher education institutions continue to increase overall STEM degree production, suggesting that the state is responding to the increasing demand for scientific and technical workers. Virginia universities are also ramping up efforts to cultivate student entrepreneurship. The state has been successful in adding to the skilled labor supply by attracting highly educated workers from elsewhere in the U.S. in three out of the last five years through domestic migration. Virginia has an impressively high concentration of workers in science and engineering occupations, and workforce educational attainment levels continue to improve. However, some regions have significantly lower concentrations of higher educational attainment. Overall, Virginia has been successful in stimulating student interest in STEM from an early age and training and attracting skilled workers needed for innovation- and entrepreneurship-driven growth. 10
15 RESEARCH AND DEVELOPMENT Goal: Increase support for the research and development activities that provide a foundation for high-tech growth. Research and development (R&D) is the wellspring of innovation and consists of basic research, applied research, and development. Measures of R&D activity include both inputs, such as money spent on research and development, and outputs, such as patent activity. Most R&D expenditures originate from industry and private investment, primarily for the purpose of applied research and development with more immediate product commercialization possibilities. Federal and state governments also invest substantial amounts in R&D, often in basic research, which results in significant discoveries that are so diffuse that they are difficult for any one business to capture, yet importantly feed into applied research. Virginia s universities, hospitals, and laboratories are important players in the discovery and dissemination of new ideas. The Research & Development category is central to the IEMS, representing the idea-generation phase that results from combining intellectual with financial capital to develop technologies that have potential for commercialization. The value of overall R&D performed in Virginia declined in 2012 from the prior year, the most recent year of data available for this measure. Corporate R&D, a component of that, declined as well in 2012, and again in Federal R&D obligations form an important part of Virginia s overall R&D expenditures. A drop in federal funding since the 2009 federal fiscal stimulus program expired is a contributing factor to total R&D decline, but federal obligations began to increase once again in Combined SBIR/STTR awards, both in dollar amounts and number of awards have dropped in recent years. Colleges and universities also perform a significant amount of R&D. These expenditures decreased in 2014 in large part because of continued attrition in federal funds. Patents awarded to residents of Virginia decreased in 2015 after four years of increases, and Virginia continues to lag behind the national average and benchmark states on a population-adjusted basis. Why is Research & Development important? R&D investment is a key input in the innovative process. It is necessary but not sufficient for innovationdriven growth. Not all R&D investments will result in an innovation output such as a commercially successful product or service; however, R&D expenditures provide an indication of the state s overall investment climate and capacity to create and disseminate knowledge. Likewise, although not all patents awarded to residents of Virginia will be licensed or utilized in products or services, they are intellectual property that businesses and individuals believe have commercial value. How has Virginia performed over the last five years? State R&D Intensity Research and development is a key input to the innovation process. State R&D intensity measures spending attributable to federal and state government, businesses, higher education institutions, non-profit organizations, and other entities as a percentage of state gross domestic product (GDP). Although this data is available only through 2012, it can be used in combination with more recent federal and corporate research expenditures to ascertain likely trends in overall research and development activity and to determine the Commonwealth s relative position with respect to other states. 11
16 Virginia ranked 21st on R&D expenditures as a percentage of state GDP in 2012, at 2.3% of state GDP, below the U.S. average of 2.7%. This percentage is lower than 2008 s 2.9%. New Mexico led the nation with 6.7% in 2012, largely because of the Los Alamos and Sandia national laboratories located there. Among benchmark states, Maryland (5.6%), Massachusetts (5.6%), and California (4.6%) R&D spending was higher. Federal R&D Spending The federal government invested $136 billion in R&D in 2011, approximately 32% of all national R&D spending. However, these obligations have decreased in recent years as a result of the expiration of fiscal stimulus programs and budget sequestration. Federal investment plays a large role in Virginia. Federal research obligations were $7.7 billion in 2014, which is 1.7% of state GDP. This percentage is well above the national average of 0.6% and ranked the Commonwealth fourth among U.S. states. This amount was up from $6.5 billion in 2013 after four years of decline. Maryland ranked first with federal R&D obligations of 4.9% as a percentage of GDP in All other benchmark states were lower. 12
17 Corporate R&D Intensity Corporate R&D measures research and development activities conducted by private businesses. Private businesses accounted for 69% of total R&D activity performed at the national level in Virginia corporate R&D expenses declined from $6.16 billion in 2009 to $4.66 billion in Outlays rebounded in 2011 to $5.56 billion but decreased again to $4.76 billion in 2012 and $4.45 billion in
18 Corporate R&D intensity as measured by expenditures as a percentage of private industry output is somewhat lower in Virginia than the nation. Expenditures represented 1.2% of private industry output in 2013, ranking Virginia 27th in the nation and below the 2.2% national average. All benchmark states, with the exception of Texas (1.1%), were higher. The state of California led the nation with 4.6%. SBIR & STTR Awards The Small Business Innovation Research (SBIR) program offers competitive research grants to small businesses to conduct R&D that has a high potential for commercialization. A related program, the Small Business Technology Transfer program, offers similar incentives for small businesses that partner with non-profit U.S. research institutions. SBIR/STTR offer grants for two phases: Phase I offers seed funds to determine the scientific, technical and commercial merit and feasibility, while Phase II follow-on funding is awarded to support prototyping and demonstration of the most promising Phase I projects. Virginia businesses were awarded a total of $106.3 million in SBIR/STTR funds in This amount is lower than the 2014 total of $ million. Both SBIR and STTR funding declined from previous year levels. Virginia firms received the third highest amount of SBIR/STTR funds among U.S. states. Only benchmark states California ($372.3 million) and Massachusetts ($227.8 million) were higher. Adjusting for state size, Virginia firms received $12.7 in SBIR/STTR awards per capita in Although down from $13.2 in 2014, Virginia was substantially above the U.S. average of $5.8 in 2015 and its ranking improved from sixth to fifth highest among all states. The leading state was benchmark state Massachusetts at $33.5 per capita. Only one other benchmark state, Maryland, ranked higher with $15.3 per capita in SBIR/STTR awards. 14
19 15

20 16 Academic Science and Engineering R&D Expenditures University R&D activities are an important source of basic and applied research discoveries and also provide technologies for commercialization. Virginia higher education science and engineering R&D expenditures increased from $1.13 billion in 2010 to a high of $1.32 billion in 2013 but decreased to $1.28 billion in In recent decades, academia in Virginia has relied on the federal government for more than half of its R&D funding. However, over the 2010 to 2014 period, an increasing percentage of funding has originated from other sources, including the higher education institutions themselves. During this period federal funding decreased by 1.2% and state and local government financed R&D decreased by 38.4% while Institutional funding increased by 93.1%, and business financed R&D by 31.1%. Other funding sources (including nonprofit organizations) declined by 25.3%.
21 Virginia s academic science and engineering R&D expenditures increased slightly as a percentage of state GDP from 2010 to 2014, rising from.27% to.28% of GDP. However, the 2014 percentage is lower than the U.S. average of.48% and ranked 38th among U.S. states. It also ranked lower than all six benchmark states. Maryland was the nation s leader at 1.01%. Patents Awarded Virginia s rate of patent formation steadily improved from 2011 until 2014 before experiencing a dip in The number of patents awarded in Virginia increased from 1,600 in 2011 to 1,691 in 2012, 1,886 in 2013, 2,078 in 2014, and declined slightly to 2,057 in Adjusting for population, Virginia received 24.5 patents per 100,000 residents in 2015, which was significantly lower than the U.S. average of 43.8 per 100,000 residents and ranked 29th among U.S. states. It was also lower than all benchmark states. California led the 17
; IP created through trade secrets and copyrights is also an important economic driver for Virginias. Patent rates vary widely within Virginia.")
22 nation with patents per 100,000 residents. Patents are one element of intellectual property (IP); IP created through trade secrets and copyrights is also an important economic driver for Virginias. Patent rates vary widely within Virginia. The Northern region had the highest patent rate at 43.4 patents per 100,000 residents in The West Central region also was higher than the state average with 30.8 patents per 100,000 residents. 18
23 What are the implications? Research and development inputs and outputs are some of the most tangible innovation measures. Virginia firms and institutions do well in attracting federal government R&D investment, but with the expiration of the fiscal stimulus and onset of budget sequestration, this funding became more tenuous. Overall R&D performed in Virginia declined in 2012, indicating that other sources of R&D investment such as private firms have not filled this void. Academic science and engineering R&D expenditures have been similarly affected, but institutions have begun to self-fund more of these activities. Virginia performance remains mixed on the limited output measures available. The number of patents awarded decreased in 2015, and it continues to lag behind benchmark states and the national average. Overall, Virginia s performance on these measures has deteriorated in recent years, although it can be difficult to ascertain the most current situation because some metrics are reported with substantial time gaps. Also, relative to the benchmark states and the U.S., Virginia lagged in areas of R&D intensity and outputs, with the exception of federal government support represented by R&D obligations and SBIR/STTR awards.. 19
24 20
25 ACCESS TO CAPITAL Goal: Improve access to capital for new and expanding high-tech enterprises. The success of companies depends on adequate access to different types of capital during various stages of growth. Entrepreneurs rely on debt and equity financing to start and grow their businesses. These resources are used by entrepreneurial ventures to support fundamental business functions such as marketing, manufacturing, and sales as well as innovation-boosting research and development and commercialization activities. Access to capital here encompasses risk capital used to fund innovation in early-stage companies, including private investment funds, public sector investment programs, and state R&D tax credits. Virginia s private angel investment and venture capital investment decreased in Public sector investment, which included CIT s Growth Acceleration Program (GAP) Funds, the Commonwealth Research Commercialization Fund (CRCF), and the Virginia Tobacco Region Revitalization Commission (Tobacco Commission), also increased in aggregate, although appropriations for the former two programs decreased. Private sector leverage is also an important consideration. When funds leveraged from other sources are included, the total investment impact of GAP reached $93.0 million in FY2015. R&D tax credits, which include the R&D expenses tax credit and the qualified equity and subordinated debt investments tax credit, demonstrated an uptick from taxable year (TY) 2013 to TY2014. Why is access to capital important? Access to a variety of sources of capital is important for business startup, expansion and investments in research and development, and commercialization of research. Many promising entrepreneurial ventures fail because of the difficulty of securing funding to cover negative cash flow during an early stage. Private investment provides the largest source of funding for innovative companies. The public sector plays a facilitating role by offering tax credits and providing funding to innovative companies to support applied research and commercialization activities in high-risk areas and leverage additional private investment. How has Virginia performed over the last five years? Private Investment Angel investment typically provides seed capital for the earliest stage of business startup activity. Angel investment in increased from an estimated $14-20 million in 2011 to a peak of $18-35 million in In 2015, angel investment dropped to $10-20 million. The number of deals financed follows a similar path. There were an estimated 50 to 100 angel investments in 2011, increasing to in 2013 and The number of deals decreased to in Nationally, angel investment has been relatively flat over the last three years. Although angel investment increased slightly from $24.1 billion in 2014 to $24.6 billion in 2015, the number of angel investment deals decreased from 73,400 to 71,110. Virginia attracts a relatively small amount of national angel investment, with approximately 0.06% of national angel investment and 0.15% of angel investment deals in Venture capital investment is an important source of capital for more established early- and later-stage startups that need funding to accelerate growth. Venture capital has exhibited a pattern of intermittent growth and decline over the last five years. Virginia venture capital investment decreased from $513.9 million in 2011 to $272.4 million in It increased to a high of $637.6 million in 2013 but decreased once again to $476 million in 2014 and eased further to $422.6 million in Seed- and early-stage investment has been a big 21

26 22 contributor to this volatility, with oscillation between a low of $39 million in 2011 and high of $205 million in The number of venture capital deals has also fluctuated, but within a much narrower band, with a low of 67 venture deals in 2013 and high of 80 in Seed- and early-stage venture deals increased over the period from 35 to 42, while expansion- and later-stage deals decreased slightly from 43 to 32.
, Massachusetts (1.20%), Maryland (0.23%), and North Carolina (0.14) but higher than Texas (0.07%).")
27 Virginia ranked 21st among U.S. states in venture capital spending as a percentage of state GDP (0.09%) in 2015, but this rate was lower than the national average of 0.33%. Virginia s rate was lower than four benchmark states: California (1.37%), Massachusetts (1.20%), Maryland (0.23%), and North Carolina (0.14) but higher than Texas (0.07%). California was the national leader. 23
28 As a result of the growth of the Internet and social networking in recent years, several new financial technology tools have arisen that offer additional funding options for entrepreneurs. Crowdfunding provides startup funds through monetary contributions provided by numerous investors over the Internet in return for initial batches of the startup product or firm equity. Peer-to-peer electronic platform business lenders take advantage of big data processing capabilities to rapidly assess firm credit risks and serve as a broker for small loans. These new financial technologies will likely provide new avenues for entrepreneurial funding in the future as government restrictions are eased. Public Sector Investment The goal of public sector investment is to stimulate private investment. Diversifying the sources and expanding the pool of private seed and venture capital for entrepreneurs in the Commonwealth generates more innovative startups and creates jobs. The Commonwealth of Virginia promotes innovation and entrepreneurship through various incentive programs. The CIT GAP Funds, the CRCF, and the Tobacco Commission s R&D Grants are among the most important programs. CIT GAP Funds provide seed- and early-stage near-equity and equity investments in Virginia-based technology, life science, and clean technology firms that exhibit a high potential for achieving rapid growth, generating significant economic returns, and leveraging private investment. Over the past five years the program has seen a significant increase in new deals, investment amounts, and leveraged dollars. In FY2011, $490,000 was invested in six GAP projects, which attracted additional private funding of $11.71 million. In FY2015, CIT invested in $3.6 million in 46 projects, which leveraged $93 million in additional funding. The CRCF promotes science- and technology-based research, development, commercialization, and company formation and growth. The Fund, which was initiated in 2011, makes awards to projects that align with sectors 24

29 in the Commonwealth Research and Technology Strategic Roadmap and works in tandem with other federal and state programs to leverage matching funds. A significant portion of the funded activity occurs in partnership with Virginia universities. Between FY2012 and FY2016, 232 awards have been announced. In FY2012, $5.8 million was awarded for 47 projects, in FY2013, $3 million was awarded for 42 projects, in FY2014, $4.2 million was awarded for 52 projects, in FY2015, 38 projects received $2.8 million in funding, and in FY2016, 48 projects received $3.4 million in funding. In FY2016, a $3.8 million appropriation was provided for CRCF. This amount came about because the $2.8 million initial appropriation was augmented by a special appropriation of $1 million added in the 2015 General Assembly session. The Virginia Tobacco Commission established the $100 million R&D fund in 2009 to provide grant funding to public and non-profit organizations and educational institutions in support of conducting research and development and commercializing technology. The funded projects are selected to maximize the economic development impact on the 41-locality tobacco-dependent regions in Southern and Southwest Virginia. FY2011 saw the largest project outlays with $24.6 million for 14 projects. Awarded projects funding dropped in 2012 and 2013 to seven projects for $14 million and five projects for $4.7 million respectively. Project awards and funding increased to nine projects and $13.2 million in FY2014, and to ten projects and $17.0 million in FY2015. R&D Tax Credits The Commonwealth of Virginia offers three R&D tax credit/exemption programs to eligible firms and private investors. The Research and Development Expenses Tax Credit, established in 2011, provides a refundable individual and corporate income tax credit for qualified R&D expenses. The amount available for this program was recently boosted from $5 million to $6 million in TY2014. The Qualified Equity and Subordinated Debt Investments Tax Credit offers angel investors a 50% tax credit for pre-qualified small business ventures involved in technology fields. The cap has been adjusted from year to year within a range of $3-5 million. 25
30 The state also offers individual and corporate income tax subtractions for long-term capital gains attributable to qualified investments in early stage technology, biotechnology, and energy startups. The Virginia Research and Development Expenses Tax Credit has seen a steady increase in approved applications and tax credit amounts. In TY2011, 64 applications were approved for a total amount of $2.1 million. This increased to 135 approved applications and $4.5 million in TY2012, 193 approved applications that reached the cap of $5.0 million available in TY2013, and 230 approved applications that climbed to the new cap of $6.0 million in TY Qualified Equity and Subordinated Debt Investment Tax Credit use has fluctuated from year to year, in part because of changing program caps. In TY2010, 110 applications were approved for $3.7 million in credits. In TY2011, 200 applications were approved for an amount that totaled that year s cap of $3 million. In TY2012, 65 applications were approved for a total of $2.5 million. In TY2013, 140 applications were approved for $4.5 million, the program cap for that year. TY2014 saw 127 applications that reached the program cap of $5.0 million for the year. In TY2011, 13 corporate investors claimed $10.0 million in deductions based on the capital gains tax exemption for technology businesses, with a general fund impact of $8,732. In TY2012, 30 corporate investors claimed $172.3 million in deductions for a general fund impact of $27,379. Individuals could also claim this deduction but those data are not yet available. In addition, because the deduction is for any long-term capital gains resulting from a qualified investment and may be claimed in the future, the total general fund impact is unknown and may be higher than the reported tax year General Fund impacts. What are the implications? Capital investment is a key input in building innovative companies. Early-stage companies use seed investment to transform applied research into commercial products and services, while later-stage companies use expansion capital to boost growth. Private investment is a critical catalyst for innovative companies and entrepreneurs and accounts for most of the funds invested in new ventures. Public sector investment is smaller but is made in innovative companies that stimulate additional private investment and add value to the state economy. In recent years, the Commonwealth has created additional R&D investment tax credits and deductions to expand capital access. In the future, business startups may be able to more fully utilize additional private investment channels though new financial technology tools such as crowdfunding and peer-to-peer business lending. 26
31 COMMERCIALIZATION Goal: Accelerate the introduction and growth of new technologies and products derived from research in Virginia. Commercialization is the process of taking intellectual property resulting from research and development to market and generating financial value through licensing and sales. Products and services based on new technology are introduced to the market to determine if they meet a market demand or otherwise add value to the company. Commercialization here refers specifically to licensing, startup, industry collaboration, and consulting connected to university research and development. The number of licenses issued by Virginia s universities edged upwards in 2014 and the number of active licenses and licensing income also increased. The number of startup businesses based on university intellectual property remained steady, while the cumulative number of startups surpassed last year s high. These numbers do not include other university startup activity, including faculty and student business startups that are not based on the institution s intellectual property. Virginia universities support commercialization through other avenues as well, including research sponsored by business, financial support for seed and proofof-concept funds, and incentives for faculty to engage in entrepreneurship and commercialization activities. Why is commercialization important? Colleges and universities are increasingly being called upon to commercialize their discoveries in order to boost economic development. One method is through nurturing university startups, which account for a relatively small but growing number of high-growth, entrepreneurial ventures. Technology transfer from universities also boosts the growth of firms in the state through new commercial products and innovative business production processes based on licensed technologies. Commercialization provides revenue that helps support university research and development activities and incentivizes faculty production of translational research. Universities also forge closer links with business and industry that establish mechanisms for sharing knowledge, foster future research collaboration, and create internship and career opportunities for students and graduates. How has Virginia performed over the last five years? University Licensing The number of licenses has increased each year since 2011 when 97 university licenses were issued. In 2013, 112 licenses were issued. The cumulative number of active licenses issued by Virginia s universities jumped to 747 in 2013 from 545 the year before, in part as a result of Virginia Tech reporting this number for the first time. In 2014, total active licenses increased further to a level of 787. Licensing revenue often results from licenses executed several years earlier. Total licensing revenue reported by Virginia s research universities declined from a peak of $11 million in 2010 to $6.2 million in 2013 before rebounding to $8.2 million in On a per capita basis, Virginia raised an average of $1.0 of licensing revenue per capita in 2014, compared to a national average of $7 per capita, ranking it 35th among U.S. states. This per capita revenue was lower than all benchmark states. The nation s leader was Illinois at $31 per capita. 27
32 28 University Startups The number of university startups that begin operations based on licensed technology each year increased from 11 startups in 2010, to 17 startups in In 2014, 17 university startups resulted once again. Of this total, 14 startups established operations within the Commonwealth of Virginia. The cumulative total number of active startups from current and previously issued licenses increased from 74 in 2011 to 104 in 2014.
33 Virginia universities produced 2.04 startups per one million residents in This is lower than the national average of 2.72 per million; Virginia ranked 27th among states. It was also lower than all benchmark states. The nation s leader was Utah at 6.80 startups per million residents. 29
34 University Environment Many university commercialization and technology transfer activities are unrelated to licensed technology. Virginia institutions reported that there were at least 19 such companies established in FY2015 and an additional 89 startups by students; only some of the latter were based on university-licensed technology. Virginia s colleges and universities further their interactions with industry through sponsored research and clinical trials; industry partners are based in and outside of Virginia. Virginia institutions had sponsored research relationships with an estimated 1,395 companies in FY2014. Additionally, faculty have consulting agreements with businesses located in and outside of the Commonwealth, and some universities offer makerspace, a workspace that facilitates creativity and collaboration and in some cases includes 3D printers. Virginia s higher education institutions have increased institutional support for innovation and commercialization. Most public research universities have tenure policies that recognize faculty accomplishments in entrepreneurship and commercialization. In addition, five institutions (Eastern Virginia Medical School, George Mason University, Old Dominion University, the University of Virginia, and Virginia Tech) reported establishing seed and/or proof-of-concept funds. For example, the University of Virginia reported offering more than $3 million for translational research projects in FY2014 resulting in 124 funded projects to date and 16 startup companies. What are the implications? Virginia s universities are an important resource for sustaining an innovation-based economy. The number of business startups increased from 2011 to 2013 but the startup rate lagged behind most benchmark states and the nation. While the lagging indicator of licensing revenue declined and was lower than the nation and benchmark states, the number of university licenses increased in Virginia s universities increasingly demonstrate support for increased commercialization through seed and proof-of-concept funds, numerous sponsored research relationships, and additional entrepreneurial activities of faculty, staff, and students. 30
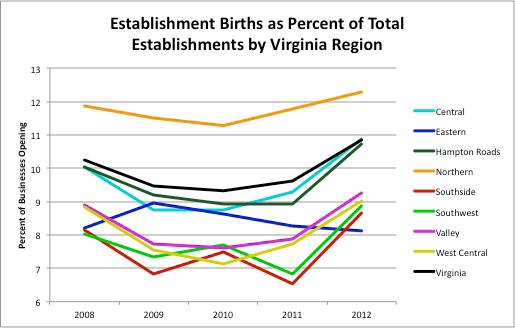
35 BUSINESS DYNAMICS Goal: Enhance Virginia s business climate for entrepreneurs and high-growth technology enterprises. Business dynamics examines business rejuvenation, growth, and connectivity, taking into account multiple stages of the business life cycle. Indicators measure business startup activity, the rate of business creation and destruction, the number of firms graduating from privately held venture capital incubation to initial public offerings (IPOs), and the number of fast growing firms. Broadband access indicates the state s capacity to facilitate connections through businesses and residents accessing and sharing knowledge online. In 2012, Virginia business startups as a percentage of existing establishments rose for the second year in a row. The startup rate varied regionally, but most regions continued to improve through Establishment churn, which measures the rate of businesses creation and destruction, mirrored the business startup pattern. There was one venture-backed IPO in Virginia during 2014, as had been the case in each of the last two years, with the post-offer value improving significantly over the period. The number of fast growing firms defined as a firm listed on the Inc list of fast growing firms decreased by eight in 2015, but the state continued to lead the nation for this indicator on a per capita basis. Why are business dynamics important? Business dynamics indicators provide a gauge of the entrepreneurship and innovation climate. An increase in business startup activity provides evidence that residents are willing to take on more risk. Establishment churn shows that less innovative or efficient firms are going out of business and being replaced by more innovative and efficient firms. Fast growing firms are among the most successful entrepreneurial endeavors and have a large impact on job creation. Venture-backed IPOs allow early-stage investors to recoup their investments and recycle the funds into other investments. Finally, broadband access enables residents and businesses to better trade, communicate, collaborate, and share knowledge, raising productivity and improving the quality of life. How has Virginia performed over the last five years? Startups Following a precipitous fall in the number of business startups during the recession, Virginia has seen gradual gains with the economic recovery. However, startup rates have not yet recovered to pre-recession levels. The number of establishment births as a percentage of existing establishments in Virginia was 10.3% in 2008, dropping to 9.3% in The startup rate recovered to 10.8% by This bow-shaped pattern was evident elsewhere in the U.S. as well. Virginia s startup rate in 2012 was lower than the U.S. average at 11.3% and ranked 22nd among U.S. states. The leading state in business startup activity was Nevada at 14.4%. Virginia s rate was lower than three benchmark states: California (12.5%), Texas (12.5%), and North Carolina (11.2%). There is wide variation in business startup activity within Virginia, and most regions have begun to recover from the effects of the recent recession. The Northern region had the highest business startup rate among Virginia regions at 12.3%. 31
36 32
37 Establishment Churn Establishment churn represents the degree of resource fluidity that allows labor and capital to be allocated from older industries and firms that use outdated technologies to newer innovative and modern firms and industries. This process is also known as creative destruction, a term coined by 19th century economist Joseph Schumpeter to describe how growing, dynamic economies develop. Establishment churn measures the rate of firm entry and firm exit relative to the total number of businesses in the state (i.e., establishment birth rate plus establishment death rate). A higher churn rate indicates more competitive conditions and signals a more dynamic environment for innovation and entrepreneurship that fosters economic growth. Virginia establishment churn dropped from 21.2% in 2008 to 19.7% in 2010, as both establishment births increased and death rates increased as a result of the recession. Churn increased in 2011 to 20.0% and again to 20.6% in 2012 as the recovery took hold. Nationally, Virginia s 2012 churn rate ranked 21st highest among U.S. states and was near the national rate of 21.2%. Within Virginia, the Northern region had the highest churn rate at 22.8% in 2012, followed by the Hampton Roads at 20.9% and the Central region at 20.3%. 33

38 IPOs An Initial Public Offering (IPO) occurs when the stock of a private company is sold for the first time to the public. This sale allows venture capitalists and firm entrepreneurs to recoup their investments and make the funds available for other investment opportunities. IPO exit activity is related to the overall condition of the economy and the buoyancy of the financial markets. Nationally, venture-backed IPOs declined significantly during the recession and have been gradually recovering since that time. Virginia had no venturebacked IPOs in 2010 and In , there was one venture-backed IPO each year with the values growing from $368.4 million in 2012 to $829.7 million in 2013 to $919.1 million in Over the period 2011 to 2014, Virginia IPOs post-offer value as a percentage of state GDP was 0.16%, ranking it 11th among the states. This percentage was below the national average of 0.39% and lagged three benchmark states including California (2.12%), Massachusetts (0.97%), and Maryland (0.36%). 34

39 Fast Growing Firms The presence and growth of dynamic firms is a key measure of business dynamism. Inc. Magazine s 2015 list of 5000 privately-held fast growing companies included 276 Virginia firms, down from a peak of 302 in 2011, and down from 284 in Among U.S. states, Virginia had the highest number of fast growing firms on a population-adjusted basis for Virginia had 32.9 firms per one million residents compared to less than half that amount (15.4) for the U.S. Among benchmark states, Massachusetts was the closest, with 23.7 fast growing firms per million residents. 35

40 Broadband Access Broadband availability measures the speed and transmission capabilities of the state s telecommunications infrastructure. As more data, knowledge, and market activity migrate online, it is vitally important for businesses and residents to have access to the best available capabilities and tools for accessing and sharing information for education, commerce, healthcare, and an array of other sectors. As of May 2016, 90.8% of Virginia residents had broadband coverage defined as a 25 megabits per second (Mbps) or higher download speed. This compared to 82.7% of Virginia residents with a similar speed in 2015 and 64.6% in In January 2015, the Federal Communications Commission (FCC) updated its broadband benchmark to 25 Mbps for downloads and 3 Mbps for uploads, as the prior standard was considered dated. Choice of providers has also improved over time for the 25 Mbps download standard. In 2016, 9.2% of residents had the choice of three or more providers, 47.0% had a choice of two, and 34.6% had just one. These compare to 5.2%, 38.8%, and 38.6% respectively the year before, and 0.7%, 30.1%, and 30.8% respectively in Significant disparities persist between Virginia s urban and rural areas in broadband access: 99% of Virginia s 5.4 million urban residents had broadband coverage in 2016, compared to 87% of Virginia s 2.6 million rural residents. 36
INNOVATION AND ENTREPRENEURSHIP MEASUREMENT SYSTEM
 INNOVATION AND ENTREPRENEURSHIP MEASUREMENT SYSTEM February 14, 2017 ii Table of Contents Introduction... 1 Talent Pipeline... 3 FIRST Participation... 3 STEM Degrees... 4 Knowledge Worker Migration...
INNOVATION AND ENTREPRENEURSHIP MEASUREMENT SYSTEM
 INNOVATION AND ENTREPRENEURSHIP MEASUREMENT SYSTEM June 22, 2018 ii Table of Contents Introduction... 1 Talent Pipeline... 3 FIRST Participation... 3 STEM Degrees... 4 Knowledge Worker Migration... 6 Workforce
INNOVATION AND ENTREPRENEURSHIP MEASUREMENT SYSTEM
 INNOVATION AND ENTREPRENEURSHIP MEASUREMENT SYSTEM January 16, 2018 ii Table of Contents Introduction... 1 Talent Pipeline... 3 FIRST Participation... 3 STEM Degrees... 4 Knowledge Worker Migration...
The State of Innovation. Orlando Saez
 The State of Innovation Orlando Saez Separating fact from myth Myth Illinois is hostile to businesses. Fact Illinois is a good place to do business, and it s getting better everyday. Illinois Economy Highlights
2018 Indiana VENTURE REPORT
 218 Indiana VENTURE REPORT Content Overview................................ 2 Indiana s Growing Economy................. 3 Indiana s Value for Business................. 3 National Venture Capital Trends..............
executives are often viewed to better understand the merits of scientific over commercial solutions.
 Key Findings The number of new technology transfer licensing agreements earned for every $1 billion of research expenditure has fallen from 115 to 109 between 2004 and. However, the rate of return for
An Introduction to China s Science and Technology Policy
 An Introduction to China s Science and Technology Policy SHANG Yong, Ph.D. Vice Minister Ministry of Science and Technology, China and Senior Fellow Belfer Center for Science and International Affairs
Technology transfer industry shows gains
 Technology transfer industry shows gains in patents filed and granted, university-created startups and commercial products; slippage in federal research funding cited Highlights of AUTM s Canadian Licensing
BASED ECONOMIES. Nicholas S. Vonortas
 KNOWLEDGE- BASED ECONOMIES Nicholas S. Vonortas Center for International Science and Technology Policy & Department of Economics The George Washington University CLAI June 9, 2008 Setting the Stage The
Dynamic Cities and Creative Clusters
 Dynamic Cities and Creative Clusters Weiping Wu Associate Professor Urban Studies, Geography and Planning Virginia Commonwealth University, USA wwu@vcu.edu Presented at the Fourth International Meeting
COLUMBUS 2020 A REGIONAL GROWTH STRATEGY FOR CENTRAL OHIO
 COLUMBUS 2020 A REGIONAL GROWTH STRATEGY FOR CENTRAL OHIO Vision To achieve the strongest decade of growth in the Columbus Region s history Mission To strengthen the economic base of the 11-county Columbus
Technology Leadership Course Descriptions
 ENG BE 700 A1 Advanced Biomedical Design and Development (two semesters, eight credits) Significant advances in medical technology require a profound understanding of clinical needs, the engineering skills
Getting Started. This Lecture
 Getting Started Entrepreneurship (MGT-271) Lecture 9-11 This Lecture Intellectual Property Rights Forms of intellectual property Patent, its types and steps to obtaining patent Potential financing sources
Service Science: A Key Driver of 21st Century Prosperity
 Service Science: A Key Driver of 21st Century Prosperity Dr. Bill Hefley Carnegie Mellon University The Information Technology and Innovation Foundation Washington, DC April 9, 2008 Topics Why a focus
Innovation. Key to Strengthening U.S. Competitiveness. Dr. G. Wayne Clough President, Georgia Institute of Technology
 Innovation Key to Strengthening U.S. Competitiveness Dr. G. Wayne Clough President, Georgia Institute of Technology PDMA Annual Meeting October 23, 2005 Innovation Key to strengthening U.S. competitiveness
Investing in Regional Sustainability Norris Lozano, PDC
 Investing in Regional Sustainability Norris Lozano, PDC Regional Leaders Seminar Series Institute of Metropolitan Studies Portland, OR May 10, 2004 1 The Portland Development Commission Housing Infrastructure
Higher Education for Science, Technology and Innovation. Accelerating Africa s Aspirations. Communique. Kigali, Rwanda.
 Higher Education for Science, Technology and Innovation Accelerating Africa s Aspirations Communique Kigali, Rwanda March 13, 2014 We, the Governments here represented Ethiopia, Mozambique, Rwanda, Senegal,
U.S. Small Business Administration Office of Investment and Innovation. SBIC Overview
 U.S. Administration Office of Investment and Innovation SBIC Overview 1 Office of Investment and Innovation @30,000 Feet SBA s Office of Investment and Innovation (OII) leads programs that provide the
Industrial Technologies. Amsterdam, June 2016 Nitan Pathak European Investment Fund
 Industrial Technologies Amsterdam, June 2016 Nitan Pathak European Investment Fund 1 What is the EIF? We provide risk financing to stimulate entrepreneurship and innovation in Europe Making finance more
Regional Innovation Ecosystems:
 Regional Innovation Ecosystems: The Role of the University in Fostering Economic Growth Ross DeVol Chief Research Officer Milken Institute Caltech Giant High Level Forum, Leading Innovation Ecosystems
The United Arab Emirates is ranked 38th in the GII 2018, dropping 3 positions from last year.
 United Arab Emirates 38 th The United Arab Emirates is ranked 38th in the GII 2018, dropping 3 positions from last year. The United Arab Emirates (the U.A.E.) ranks 38th this year. Despite dropping three
MSMEs' Competitiveness and Innovation in the Digital Age
 2016/ISOM/SYM/014 Session IV MSMEs' Competitiveness and Innovation in the Digital Age Submitted by: NCAPEC Symposium on Priorities for APEC 2017 Ha Noi, Viet Nam 8 December 2016 MSMEs Competitiveness and
OECD-INADEM Workshop on
 OECD-INADEM Workshop on BUILDING BUSINESS LINKAGES THAT BOOST SME PRODUCTIVITY OUTLINE AGENDA 20-21 February 2018 Mexico City 2 About the OECD The Organisation for Economic Co-operation and Development
Research-Asset Assessment Study for Commonwealth of Virginia:
 Research-Asset Assessment Study for Commonwealth of Virginia: Phase II Second-Order Gap Analysis on the Advancement and Translation of Virginia s Research and Development Assets To: Virginia Research Investment
ECONOMIC SNAPSHOT. A Summary of the San Diego Regional Economy UNEMPLOYMENT
 A Summary of the San Diego Regional Economy UNEMPLOYMENT San Diego Regional EDC analyzes key economic metrics that are important to understanding the regional economy and San Diego's standing relative
Brief to the. Senate Standing Committee on Social Affairs, Science and Technology. Dr. Eliot A. Phillipson President and CEO
 Brief to the Senate Standing Committee on Social Affairs, Science and Technology Dr. Eliot A. Phillipson President and CEO June 14, 2010 Table of Contents Role of the Canada Foundation for Innovation (CFI)...1
Science, technology and engineering for innovation and capacity-building in education and research UNCTAD Wednesday, 28 November 2007
 Science, technology and engineering for innovation and capacity-building in education and research UNCTAD Wednesday, 28 November 2007 I am honored to have this opportunity to present to you the first issues
Converting Research into Innovation & Growth: SBIR, the University, and the Park
 Converting Research into Innovation & Growth: SBIR, the University, and the Park Investing in Innovation: Promoting New Opportunities in the United Nations Economic Council for Europe Region Geneva, Switzerland
Business angels Published on Innovation Policy Platform (https://www.innovationpolicyplatform.org)
") This section explores the role of business angels in financing prototype development and market demonstrations. It provides a full characterization of business angels (types, motivations, activities they
This section explores the role of business angels in financing prototype development and market demonstrations. It provides a full characterization of business angels (types, motivations, activities they
Winter 2004/05. Shaping Oklahoma s Future Economy. Success Stories: SemGroup, SolArc Technology Yearbook
 Winter 2004/05 Shaping Oklahoma s Future Economy Success Stories: SemGroup, SolArc Technology Yearbook By William H. Payne Angel Investor and Entrepreneur-in-Residence at Kauffman Foundation, Kansas City
Japan s business system has changed significantly since 2000, shifting toward
 1 Continuity and Change in Japan s Ecosystem for Venture-Capital backed Start-up Companies: Encouraging the Creation of Firms to Stimulate Economic Growth and Jobs Japan s business system has changed significantly
ASEAN: A Growth Centre in the Global Economy
 Bank Negara Malaysia Governor Dr. Zeti Akhtar Aziz Speech at the ASEAN SME Conference 2015 It is my pleasure to be here this afternoon to speak at this inaugural ASEAN SME Conference. This conference takes
SEMICONDUCTOR INDUSTRY ASSOCIATION FACTBOOK
 Factbook 2014 SEMICONDUCTOR INDUSTRY ASSOCIATION FACTBOOK INTRODUCTION The data included in the 2014 SIA Factbook helps demonstrate the strength and promise of the U.S. semiconductor industry and why it
Inclusively Creative
 In Bandung, Indonesia, December 5 th to 7 th 2017, over 100 representatives from the government, civil society, the private sector, think-tanks and academia, international organization as well as a number
Addressing the Innovation Imperative
 Addressing the Innovation Imperative The Role of Public Private Partnerships Pragmatic Approaches to Technology Transfer and Commercialization Belo Horizonte, Brazil November 18, 2009 Charles W. Wessner,
Guidelines to Promote National Integrated Circuit Industry Development : Unofficial Translation
 Guidelines to Promote National Integrated Circuit Industry Development : Unofficial Translation Ministry of Industry and Information Technology National Development and Reform Commission Ministry of Finance
Hong Kong as a Knowledge-based Economy
 Feature Article Hong Kong as a Knowledge-based Economy Many advanced economies have undergone significant changes in recent years. One of the key characteristics of the changes is the growing importance
Small Business, Entrepreneurship, and Economic Recovery
 U.S. Department of Commerce Minority Business Development Agency Small Business, Entrepreneurship, and Economic Recovery Ivonne Cunarro Co- Hosted by the Kauffman Foundation, Federal Reserve Bank of Atlanta,
TTOs in Turkey. Orhan AYDIN Professor Karadeniz Technical University Member of TUBITAK s TTO Monitoring Committee
 TTOs in Turkey Orhan AYDIN Professor Karadeniz Technical University Member of TUBITAK s TTO Monitoring Committee 1st Panel: International, Regional & National Strategies of Public Institutions on The Role
Rural Venture Capital: 1 st RFP
 Our Footprint Our Structure Both holding company (First Southwest Bancorp) and First Southwest Bank are CDFIs. First Southwest Community Fund, a 501c3 affiliate of First Southwest Bank, will apply to become
A STRATEGY TO IMPROVE CANADA S MINERAL EXPLORATION INVESTMENT CLIMATE
 A STRATEGY TO IMPROVE CANADA S MINERAL EXPLORATION INVESTMENT CLIMATE Submission by the Prospectors and Developers Association of Canada (PDAC) to the House Standing Committee on Finance Pre-Budget Consultations
KANSAS BIOSCIENCE INDEX 2008
 Innovation Capacity Education Capacity Workforce Capacity KANSAS BIOSCIENCE INDEX 2008 Industrial Output Prepared by: Research & Development Capacity ACKNOWLEDGEMENTS The Bioscience Authority contracted
Promoting Foreign Direct Investment in The United States. Christopher Clement International Investment Specialist Invest in America
 Promoting Foreign Direct Investment in The United States Christopher Clement International Investment Specialist Invest in America FDI in the U.S. Economy 5.2 million $40 billion $55 billion $190 billion
EU Support for SME Innovation: The SME Instrument
 Audit preview Information on an upcoming audit EU Support for SME Innovation: The SME Instrument April 2019 2 Traditionally, start-ups and small and medium-sized enterprises (SMEs) in the EU have faced
Financing Baltimore s Growth: Venture Capital Support for Small Companies
 Financing Baltimore s Growth: Venture Capital Support for Small Companies by Mary Miller, Ben Seigel, Mac McComas, and Lee Scrivener October 2018 Executive Summary In 2017, the Johns Hopkins 21st Century
Plan I. Fostering innovation for long-term growth. 5 February Stian Westlake, Exec Dir of Policy &
 Plan I Fostering innovation for long-term growth 5 February 2013 Stian Westlake, Exec Dir of Policy & Research @stianwestlake 1 Two plans dominate the debate Plan A : Austerity Plan B : Stimulus Cut government
Insight: Measuring Manhattan s Creative Workforce. Spring 2017
 Insight: Measuring Manhattan s Creative Workforce Spring 2017 Richard Florida Clinical Research Professor NYU School of Professional Studies Steven Pedigo Director NYUSPS Urban Lab Clinical Assistant Professor
The Danish-American Entrepreneurship Summit
 The Danish-American Entrepreneurship Summit Insights Into the US Venture Capital Markets How to Create A Winning Strategy? Clare Fairfield Do Innovation Development Systems Matter? In 2003, venture backed
FINC915 Venture Lab Participating Firms: FALL 2009
 FINC915 Venture Lab Participating Firms: FALL 2009 and allowing the fund members to capitalize on high-growth opportunities. LOCAL FIRMS: MK Capital Task description: various Location: Northbrook, IL Fund
FINLAND. The use of different types of policy instruments; and/or Attention or support given to particular S&T policy areas.
 FINLAND 1. General policy framework Countries are requested to provide material that broadly describes policies related to science, technology and innovation. This includes key policy documents, such as
Climate Change Innovation and Technology Framework 2017
 Climate Change Innovation and Technology Framework 2017 Advancing Alberta s environmental performance and diversification through investments in innovation and technology Table of Contents 2 Message from
Overview of Venture Equity
 Overview of Venture Equity SVB Analytics Report 2017 Written by SVB Analytics: Steve Liu Managing Director sliu@svb.com Sean Lawson Senior Manager slawson2@svb.com Steven Pipp Senior Associate spipp@svb.com
Domestic Reform and Global Integration: The Evolution of China s Innovation System and Innovation Policies
 Domestic Reform and Global Integration: The Evolution of China s Innovation System and Innovation Policies Dr. Lan Xue, Professor and Dean School of Public Policy and Management Tsinghua University Emerging
III. THE REGIONAL FRAMEWORK
 THE SAN DIEGO REGIONAL ECONOMY III. THE REGIONAL FRAMEWORK The San Diego region, comprised solely of San Diego County, is one of California s most dynamic regions. The efforts of the University within
Florida Venture Capital Highlights
 InternetCoast Florida Innovation Highlights Series Florida Venture Capital Highlights 2013 2017 2017 Florida Investment Activity Best Since 2000 InternetCoast January 2018 Dale Gregory President, InternetCoast
Commission on science and Technology for Development. Ninth Session Geneva, May2006
 Commission on science and Technology for Development Ninth Session Geneva, 15-19 May2006 Policies and Strategies of the Slovak Republic in Science, Technology and Innovation by Mr. Stefan Moravek Head
TRANSFORMATION INTO A KNOWLEDGE-BASED ECONOMY: THE MALAYSIAN EXPERIENCE
 TRANSFORMATION INTO A KNOWLEDGE-BASED ECONOMY: THE MALAYSIAN EXPERIENCE by Honourable Dato Sri Dr. Jamaludin Mohd Jarjis Minister of Science, Technology and Innovation of Malaysia Going Global: The Challenges
National Innovation System of Mongolia
 National Innovation System of Mongolia Academician Enkhtuvshin B. Mongolians are people with rich tradition of knowledge. When the Great Mongolian Empire was established in the heart of Asia, Chinggis
DIRECTION OF SCIENCE, TECHNOLOGY AND INNOVATION POLICY IN THAILAND
 DIRECTION OF SCIENCE, TECHNOLOGY AND INNOVATION POLICY IN THAILAND By Mr. Pichet Durongkaveroj Secretary General, National Science Technology and Innovation Policy Office, Thailand 99 I SCIENCE, TECHNOLOGY
Understanding Venture Capital
 Understanding Venture capitalists believe innovation is the foundation of Michigan s growing economy. As a result, over the last 15 years, the venture capital industry has become a significant driver in
OECD s Innovation Strategy: Key Findings and Policy Messages
 OECD s Innovation Strategy: Key Findings and Policy Messages 2010 MIT Europe Conference, Brussels, 12 October Dirk Pilat, OECD dirk.pilat@oecd.org Outline 1. Why innovation matters today 2. Why policies
VENTURE CAPITAL MONITOR
 Q4 213 VENTURE CAPITAL MONITOR A QUARTERLY UPDATE ON THE CANADIAN VENTURE CAPITAL INDUSTRY www.ic.gc.ca/vcmonitor This publication by the Small Business Branch provides current information about the venture
Silicon Valley Venture Capital Survey Second Quarter 2018
 fenwick & west Silicon Valley Venture Capital Survey Second Quarter 2018 Full Analysis Silicon Valley Venture Capital Survey Second Quarter 2018 fenwick & west Full Analysis Cynthia Clarfield Hess, Mark
State Content Standards for New Mexico
 Episode 101 What Is a Biz Kid? Episode 102 What Is Money? Episode 103 How Do You Get Money? Episode 104 What Can You Do with Money? Episode 105 Money Moves Episode 106 Taking Charge of Your Financial Future
VENTURE IMPACT ILLINOIS THE ECONOMIC IMPACT OF VENTURE CAPITAL ON ILLINOIS
 VENTURE IMPACT ILLINOIS THE ECONOMIC IMPACT OF VENTURE CAPITAL ON ILLINOIS Executive Summary What Is Venture Capital? Venture Capital Plays an Important Role in the Illinois Economy Venture Capital Investments
Concept Note Africa Innovation Summit Satellite Event: South Africa 6 8 June 2018 The Venue, Pretoria
 Concept Note Africa Innovation Summit Satellite Event: South Africa 6 8 June 2018 The Venue, Pretoria 1. Background In recent years, Africa s economic development narrative has emphasized the need for
Fall State of the Industry Report UF SID MARTIN FLORIDA BIODATABASE
 Fall 2015 State of the Industry Report UF SID MARTIN FLORIDA BIODATABASE Industry Overview The expansion of Florida s biotech industry remains resilient with an overall growth rate of 92% in the number
Learning Lessons Abroad on Funding Research and Innovation. 29 April 2016
 Learning Lessons Abroad on Funding Research and Innovation 29 April 2016 In South Africa universities contribute 2.1% of gross domestic product more than textiles and forestry and they employ 300,000 people
Discovery: From Concept to the Patient - The Business of Medical Discovery. Todd Sherer, Ph.D.
 Discovery: From Concept to the Patient - The Business of Medical Discovery Todd Sherer, Ph.D. Associate Vice President for Research and Director of OTT President Elect, Association of University Technology
VTT TECHNOLOGY STUDIES. KNOWLEDGE SOCIETY BAROMETER Mika Naumanen Technology Studies VTT Technical Research Centre of Finland
 KNOWLEDGE SOCIETY BAROMETER Mika Naumanen Technology Studies VTT Technical Research Centre of Finland Knowledge society barometer Economic survey -type of tool to assess a nation s inclination towards
ESban Financing Innovation in SMEs: the role of Business Angels 11 th December 2009, Madrid
 ESban Financing Innovation in SMEs: the role of Business Angels 11 th December 2009, Madrid Business Angel Networks as a Catalyst of Private Investment in Europe Brigitte Baumann CEO of Go Beyond & President
Small Business Landscape 2016: Cause for Cautious Optimism
 Small Business Landscape 2016: Cause for Cautious Optimism Executive Summary With 90% of U.S. companies characterized as small-business enterprises and 30% of all working Americans employed at companies
2013 venture capital trends summary
 213 venture capital trends summary Prepared by: Hitesh Kothari, Director, McGladrey LLP hitesh.kothari@mcgladrey.com August 213 Fundraising by venture capital funds In the first half of 213, 88 venture
Encouraging Economic Growth in the Digital Age A POLICY CHECKLIST FOR THE GLOBAL DIGITAL ECONOMY
 Encouraging Economic Growth in the Digital Age A POLICY CHECKLIST FOR THE GLOBAL DIGITAL ECONOMY The Internet is changing the way that individuals launch businesses, established companies function, and
University IP and Technology Management. University IP and Technology Management
 University IP and Technology Management Yumiko Hamano WIPO University Initiative Program Innovation Division WIPO WIPO Overview IP and Innovation University IP and Technology Management Institutional IP
Seoul Initiative on the 4 th Industrial Revolution
 ASEM EMM Seoul, Korea, 21-22 Sep. 2017 Seoul Initiative on the 4 th Industrial Revolution Presented by Korea 1. Background The global economy faces unprecedented changes with the advent of disruptive technologies
PROGRAM ANNOUNCEMENT. New Jersey Institute of Technology. MSPhM Systems Engineering. Newark. Fall 2008
 PROGRAM ANNOUNCEMENT November 2007 Institution: New Program Title: Degree Designation: Degree Abbreviation: CIP Code and Nomenclature (if possible): Campus(es) where the program will be offered: Date when
T T T T T T T T T T T T T T T T T T T T T T T T T T T T T T T T T AND PRIVATE EQUITY ENERGIZE GROWTH
 12 INVESMEN FUNDS VENURE CAPIAL AND PRIVAE EQUIY ENERGIZE GROWH Kalinka Iaquinto, Rio de Janeiro It all began in 2003, when Gustavo Caetano, a student of marketing, realized that the market for mobile
High School Robotics/Technology Competition Team. Sponsorship Proposal Sept 2012
 High School Robotics/Technology Competition Team Sponsorship Proposal Sept 2012 Tech Fire Tech Fire is a FIRST Robotics competition team based in the York, PA area that encourages students to pursue STEM
Under the Patronage of His Highness Sayyid Faisal bin Ali Al Said Minister for National Heritage and Culture
 ORIGINAL: English DATE: February 1999 E SULTANATE OF OMAN WORLD INTELLECTUAL PROPERTY ORGANIZATION Under the Patronage of His Highness Sayyid Faisal bin Ali Al Said Minister for National Heritage and Culture
A S TATE OF ACHIE V EMENT. West Virginia s welcoming business climate
 A S TATE OF ACHIE V EMENT West Virginia s welcoming business climate The Development Office was terrific. There was complete transparency, which builds a lot of confidence that you re working with an organization
Summary report: Innovation, Sciences and Economic Development Canada s roundtable on advanced robotics and intelligent automation
 Summary report: Innovation, Sciences and Economic Development Canada s roundtable on advanced robotics and intelligent automation Growing the Canadian Advanced Robotics and Intelligent Automation Sector
Opportunities and Challenges for Open Innovation
 WIPO REGIONAL SEMINAR ON TECHNOLOGY TRANSFER BY UNIVERSITY AND PUBLIC RESEARCH INSTITUTIONS THOROUGH THE STRATEGIC USE OF THE PATENT SYSTEM December 9-11, 29 Opportunities and Challenges for Open Innovation
KKR & Co. Inc. Goldman Sachs U.S. Financial Services Conference December 4, 2018
 KKR & Co. Inc. Goldman Sachs U.S. Financial Services Conference December 4, 2018 KKR Today Private Markets Public Markets Capital Markets Principal Activities $104bn AUM $91bn AUM Global Franchise $19bn
Technology Transfer. Research Universities as Engines for Economic Development
 Technology Transfer Research Universities as Engines for Economic Development Topics & Speakers 1. Technology Transfer Fundamentals Chip Hood (MUSC-FRD) 2. Technology Transfer in S.C. Chad Hardaway (USC
Prof. Steven S. Saliterman. Department of Biomedical Engineering, University of Minnesota
 Department of Biomedical Engineering, University of Minnesota http://saliterman.umn.edu/ Process by which new innovations flow from the basic research bench to commercial entities and then to public use.
Israel Venture Capital Investments Report Q3 2017
 Israel Venture Capital Investments Report Q3 2017 NOVEMBER 2017 Summary of Israeli Venture Capital Raising Q3/2017 +14% from Q2/2017 Israeli high-tech capital raising summed up to $1.44B @ ALL RIGHTS RESERVED.
ACCESS TO FINANCING FOR SMEs Problems and Challenges. Prof. dr Dejan Erić Belgrade Banking Academy Member of the ERENET Network 2005.
 ACCESS TO FINANCING FOR SMEs Problems and Challenges Prof. dr Dejan Erić Belgrade Banking Academy Member of the ERENET Network 2005. WHY SMEs? SMEs very heterogeneous group, which include a wide variation
MILAN DECLARATION Joining Forces for Investment in the Future of Europe
 MILAN DECLARATION Joining Forces for Investment in the Future of Europe We, the political leaders and representatives of the Vanguard Initiative for New Growth through Smart Specialisation, call upon the
2O2O WOMEN ON BOARDS GENDER DIVERSITY INDEX
 2O2O WOMEN ON BOARDS GENDER DIVERSITY INDEX 2018 Progress of Women Corporate Directors by Company Size, State and Industry Sector BOARDROOM DIVERSITY: A STRATEGIC IMPERATIVE WHAT IS THE GENDER DIVERSITY
Canada s Intellectual Property (IP) Strategy submission from Polytechnics Canada
 Strategy submission from Polytechnics Canada") Canada s Intellectual Property (IP) Strategy submission from Polytechnics Canada 170715 Polytechnics Canada is a national association of Canada s leading polytechnics, colleges and institutes of technology,
Canada s Intellectual Property (IP) Strategy submission from Polytechnics Canada 170715 Polytechnics Canada is a national association of Canada s leading polytechnics, colleges and institutes of technology,
ADVANCING KNOWLEDGE. FOR CANADA S FUTURE Enabling excellence, building partnerships, connecting research to canadians SSHRC S STRATEGIC PLAN TO 2020
 ADVANCING KNOWLEDGE FOR CANADA S FUTURE Enabling excellence, building partnerships, connecting research to canadians SSHRC S STRATEGIC PLAN TO 2020 Social sciences and humanities research addresses critical
High Tech Industry in Georgia
 High Tech Industry in Georgia presentation to the General Assembly Budgetary Responsibility Oversight Committee Georgia Tech President G. Wayne Clough January 24, 2003 High-Tech Drives the Economy Compound
Triton Technology Fund
 Triton Technology Fund Presentation to Dean s Engineering Council March 22, 2013 Generate Returns for LPs/GPs Motivation for Fund Catalyze translation of UCSD discoveries for the benefit of society Enable
WIPO REGIONAL SEMINAR ON SUPPORT SERVICES FOR INVENTORS, VALUATION AND COMMERCIALIZATION OF INVENTIONS AND RESEARCH RESULTS
 ORIGINAL: English DATE: November 1998 E TECHNOLOGY APPLICATION AND PROMOTION INSTITUTE WORLD INTELLECTUAL PROPERTY ORGANIZATION WIPO REGIONAL SEMINAR ON SUPPORT SERVICES FOR INVENTORS, VALUATION AND COMMERCIALIZATION
Adopted March 17, 2009 (Ordinance 09-15)
") ECONOMIC ELEMENT of the PINELLAS COUNTY COMPREHENSIVE PLAN Prepared By: The Pinellas County Planning Department as staff to the LOCAL PLANNING AGENCY for THE BOARD OF COUNTY COMMISSIONERS OF PINELLAS COUNTY,
ECONOMIC ELEMENT of the PINELLAS COUNTY COMPREHENSIVE PLAN Prepared By: The Pinellas County Planning Department as staff to the LOCAL PLANNING AGENCY for THE BOARD OF COUNTY COMMISSIONERS OF PINELLAS COUNTY,
II Simpósio Internacional PwC Inovação em Gestão Pública Abril 2011
 www.pwc.com/br II Simpósio Internacional PwC Inovação em Gestão Pública Abril 2011 Agenda Importance of New York City s financial services sector Responses to the recession Investment trends in New York
Innovation-Based Economic Development Strategy for Holyoke and the Pioneer Valley
 Massachusetts Technology Collaborative John Adams Innovation Institute Innovation-Based Economic Development Strategy for Holyoke and the Pioneer Valley Innovation District Task Force Meeting October 27,
TALENT AS CANADA S COMPARATIVE ADVANTAGE Digital Talent Strategy: Road to 2020 and Beyond Ottawa March 9 th Namir Anani President & CEO
 TALENT AS CANADA S COMPARATIVE ADVANTAGE Digital Talent Strategy: Road to 2020 and Beyond Ottawa March 9 th 2016 Namir Anani President & CEO CONSULTATIONS & ACKNOWLEDGEMENT Canada wide targeted consultations
The Florida Turnaround Story
 The Florida Turnaround Story In 2010, Florida was in a free fall. Florida lost more than 800,000 jobs, the real estate market had collapsed and tourism was on the decline. State debt had grown by about