FOREST WILDLIFE POPULATIONS. Forest Wildlife Populations & Research Group 1201 E. Hwy 2 Grand Rapids, MN (218)
|
|
|
- Rhoda Williamson
- 5 years ago
- Views:
Transcription
1 FOREST WILDLIFE POPULATIONS Forest Wildlife Populations & Research Group 1201 E. Hwy 2 Grand Rapids, MN (218)
2 62
3 Ruffed grouse and sharp-tailed grouse surveys in Minnesota during spring 2005 ABSTRACT Mike Larson, Ph.D., Forest Wildlife Populations & Research Group Drum count surveys for ruffed grouse and count surveys of sharp-tailed grouse at dancing grounds were conducted during April and May Mean counts of ruffed grouse drums throughout the forested regions of Minnesota were 0.8 (95% confidence interval = ) drums/stop (dps), which was the same as during Drum counts by survey zone were 1.2 ( ) dps in the Northwest, 0.8 ( ) dps in the North Central, 0.5 ( ) dps in the Northeast, 0.6 ( ) dps in the Central Hardwoods, and 0.7 ( ) dps in the Southeast. Mean drum counts were also calculated for 7 sections of the Ecological Classification System (ECS). Index values by zone and by ECS section were all essentially the same as they were during During the spring 2005 survey 1,824 sharp-tailed grouse were observed at 193 dancing grounds. The mean number of sharp-tailed grouse per dancing ground was 7.6 ( ) in the East Central range, 11.4 ( ) in the Northwest range, and 9.5 ( ) statewide. Means were also calculated for redefined ranges based on aggregations of ECS sections. The mean number of birds per dancing ground during 2005 was not different than during 2004 for dancing grounds where birds were counted during both years. The difference statewide was -0.6 ( ) birds per dancing ground, or -6 (-13 3)%. INTRODUCTION Index Surveys The purpose of surveys of grouse populations in Minnesota is to monitor changes in the densities of grouse over time. Estimates of density, however, are difficult and expensive to obtain. Simple counts of animals, on the other hand, are convenient and, assuming that changes in density are the major source of variation in counts among years, they can provide a reasonable index to long-term trends in populations. Other factors, such as weather and habitat conditions, observer ability, and grouse behavior, vary over time and also affect simple counts of animals. These other factors make it difficult to make inferences about potential changes in wildlife populations over short periods of time (e.g., a few annual surveys) or from small changes in index values. Over longer periods of time or when changes in index values are large, assumptions upon which grouse surveys in Minnesota depend are more likely to be valid, thereby making inferences about grouse populations more valid. For example, index values from the ruffed grouse drumming count survey have documented what is believed to be true periodic fluctuations in ruffed grouse densities (i.e., the 10-year cycle). Ruffed Grouse The ruffed grouse (Bonasa umbellus) is Minnesota's most popular game bird. It occurs throughout the forested regions of the state. Annual harvest varies from approximately 150,000 to 1.4 million birds and averages >500,000 birds. Information derived from spring drumming counts and hunter harvest statistics indicates that ruffed grouse populations fluctuate cyclically at intervals of approximately 10 years. During spring there is a peak in the drumming behavior of male ruffed grouse. Ruffed grouse drum to communicate to other grouse the location of their territory. The purpose is to attract females for 63
4 breeding and deter encroachment by competing males. Drumming makes male ruffed grouse much easier to detect, so counts of drumming males is a convenient basis for surveys to monitor changes in the densities of ruffed grouse. Ruffed grouse were first surveyed in Minnesota during the mid-1930s. Spring drumming counts have been conducted annually since the establishment of the first survey routes in Sharp-tailed Grouse Sharp-tailed grouse (Tympanuchus phasianellus) in Minnesota occur in brushlands, which often form transition zones between forests and grasslands. Sharp-tailed grouse are considered a valuable indicator of the availability and quality of brushlands for wildlife. Although sharp-tailed grouse habitat was more widely distributed in Minnesota during the early- and mid-1900s, the range of sharp-tailed grouse is now limited to areas in the Northwest (NW) and East Central (EC) portions of the state. The NW range consists primarily of Roseau, Marshall, Beltrami, Lake of the Woods, and Koochiching counties. The EC range consists primarily of Pine, Aitkin, Carlton, and St. Louis counties. Since 1990 annual harvest of sharp-tailed grouse by hunters has varied from 8,000 to 30,000 birds, and the number of hunters has varied from 6,000 to 13,000. During spring male sharp-tailed grouse gather at dancing grounds, or leks, in grassy areas where they defend small territories and make displays to attract females for breeding. Surveys of sharp-tailed grouse populations are based on counts of males at dancing grounds. The first surveys of sharp-tailed grouse in Minnesota were conducted between the early 1940s and The current sharp-tailed grouse survey was initiated in METHODS Ruffed Grouse Roadside routes consisting of 10 semipermanent stops approximately 1.6 km (1 mile) apart have been established. Routes were originally located along roads with little automobile traffic that were also near apparent ruffed grouse habitat. Therefore, route locations were not selected according to a statistically valid spatial sampling design, which means that data collected along routes is not necessarily representative of the larger areas (e.g., counties, regions) in which routes occur. Approximately 50 routes were established by the mid-1950s, and approximately 70 more were established during the late-1970s and early-1980s. Observers from the Department of Natural Resources (DNR) Area Wildlife Offices and a variety of other organizations drove along each survey route once just after sunrise during April or May. Observers were not trained but often were experienced with the survey. At each designated stop along the route the observer listened for 4 minutes and recorded the number of ruffed grouse drums (not necessarily the number of individual grouse) he or she heard. Attempts were made to conduct surveys on days near the peak of drumming activity that had little wind and no precipitation. The survey index value was the number of drums heard during each stop along a route. The mean number of drums/stop (dps) was calculated for each of the 5 ruffed grouse survey zones, each of 7 sections of the Ecological Classification System (ECS) in Minnesota, and for the entire state (Figure 1). As an intermediate step, the mean number of dps was calculated for each route. Mean index values for survey zones and ECS sections were calculated as the mean of route-level means for all routes occurring within the zone or section. Some routes crossed boundaries of ECS sections, so data from those routes were included in the means for both sections. The number of routes within zones and sections was not proportional to any meaningful characteristic of zones or sections. Therefore, the statewide mean index value was calculated as the weighted mean of index values for the ECS sections. The weight for each 64
5 section mean was the geographic area of the section (i.e., AAP = 11,761 km 2, MOP = 21,468 km 2, NSU = 24,160 km 2, DLP = 33,955 km 2, WSU = 14,158 km 2, MIM = 20,886 km 2, and PP = 5,212 km 2 ; see Figure 1 caption for full section names). Only approximately half of the Minnesota and Northeast Iowa Morainal section and Paleozoic Plateau section were within the ruffed grouse range, so the area used to weight drum index means for those sections was reduced accordingly. NW NC NE AAP MOP DLP NSU CH WSU MIM SE PP Figure 1. Ruffed grouse survey zones overlaid on county boundaries (left panel) and forested Sections of the Ecological Classification System (right panel) in Minnesota. Zones: NW = Northwest, NC = North Central, NE = Northeast, CH = Central Hardwoods, and SE = Southeast. ECS Sections: AAP = Lake Agassiz & Aspen Parklands, MOP = Northern Minnesota & Ontario Peatlands, NSU = Northern Superior Uplands, DLP = Northern Minnesota Drift & Lake Plains, WSU = Western Superior Uplands (including a small portion of the Southern Superior Uplands in eastern Carlton County), MIM = Minnesota and Northeast Iowa Morainal (only the northern half of which is surveyed for ruffed grouse), and PP = Paleozoic Plateau. Stops along survey routes are a small sample of all possible stops within the range of ruffed grouse in Minnesota. Survey index values based on the sample of stops are not the same as they would be if drum counts were conducted at a different sample of stops or at all possible stops. To account for the uncertainty in index values because they are based on a sample, I calculated 95% confidence intervals (CI) for each mean. A 95% confidence interval is a numerical range in which 95% of similarly estimated intervals (i.e., from different hypothetical samples) would contain the true, unknown mean. I used 10,000 bootstrap samples of route-level means to estimate percentile confidence intervals for mean index values for survey zones, ECS sections, and the whole state. I calculated mean index values and CIs for Data from earlier years were not analyzed because they have not been entered into an electronic database. Annual index values for are available in the DNR s 2004 Grouse and Hares report. 65
6 Sharp-tailed Grouse Over time, DNR Wildlife Managers have recorded the locations of sharp-tailed grouse dancing grounds in their work areas. As new dancing grounds were located, they were added to the survey list. Known and accessible dancing grounds were surveyed by Wildlife Managers and their volunteers between sunrise and 2.5 hours after sunrise during April to count sharp-tailed grouse. When possible, surveys were conducted when the sky was clear and the wind was <16 km/hr (10 mph). Attempts were made to conduct surveys on >1 day to account for variation in the attendance of male grouse at the dancing ground. Survey data consist of the maximum of daily counts of sharp-tailed grouse at each dancing ground. The dancing grounds included in the survey were not selected according to a statistically valid spatial sampling design. Therefore, data collected during the survey was not necessarily representative of the larger areas (e.g., counties, regions) in which the dancing grounds occur. It was believed, however, that most dancing grounds within each work area were included in the sample, thereby minimizing the limitations caused by the sampling design. The index value of interest was the mean number of sharp-tailed grouse per dancing ground, averaged across dancing grounds within the NW and EC ranges and statewide. I calculated range and statewide means for all dancing grounds surveyed during 2004 and all dancing grounds surveyed during It was not valid to compare the full survey data and results from different years because survey effort and success in detecting and observing sharp-tailed grouse was different between years and the survey samples were not necessarily representative of other dancing grounds. To estimate differences in sharp-tailed grouse index values between years, therefore, I analyzed separately a set of data that included counts of birds only from dancing grounds that were successfully surveyed during both years. Although the dancing grounds in the separate data set were considered comparable, the counts of birds at the dancing grounds still were not. Many factors can affect the number of birds counted, so inferences based upon comparisons of survey data between years are tenuous. I used the separate data set to calculate the difference in the mean number of birds counted per dancing ground between 2004 and 2005 and the percent difference in the total number of birds counted on the comparable dancing grounds. To account for the uncertainty in index values because they are based on a sample of dancing grounds rather than all dancing grounds, I calculated 95% confidence intervals (CI) for each mean. I used 10,000 bootstrap samples of dancing ground counts to estimate percentile confidence intervals for mean index values for the NW and EC ranges and the whole state. I used 2 different definitions, or classifications, of range boundaries to summarize the sharp-tailed grouse survey results (Figure 2). I referred to the NW and EC ranges, as they were defined in the past for previous DNR Grouse and Hare reports, as the former classification. I defined new ranges by reclassifying the DNR s International Falls wildlife work area and the northwestern portion of the Tower wildlife work area to be in the NW range (formerly, they were included in the EC range). The Eveleth (i.e., southern) portion of the Tower area remained in the EC range under the new classification. The new range delineation was based on ECS section boundaries (Figure 1), with the NW range consisting of the Lake Agassiz & Aspen Parklands and Northern Minnesota & Ontario Peatlands sections and the EC range consisting of portions of the Northern Minnesota Drift & Lake Plains, Western Superior Uplands, and Southern Superior Uplands sections. 66
7 NW EC Figure 2. Northwest (NW) and East Central (EC) ranges of sharp-tailed grouse in Minnesota. The heavy lines, based largely on DNR Wildlife Work Area boundaries (light lines), represent the former range boundaries. The dark and light gray shading represent the new range boundaries, based on ECS section boundaries (see Figure 1 for ECS labels). RESULTS Ruffed Grouse Observers from 22 cooperating organizations surveyed 124 routes between 14 April and 23 May Most routes (82%) were run between 20 April and 10 May. The cooperators included the DNR Division of Fisheries & Wildlife; Chippewa and Superior National Forests (USDA Forest Service); 1854 Authority; Fond du Lac, Grand Portage, Leech Lake, Red Lake, and White Earth Reservations; Agassiz and Tamarac National Wildlife Refuges (U.S. Fish & Wildlife Service); Central Lakes College and Vermilion Community College; Beltrami and Cass County Land Departments; UPM Blandin Paper Mill; and Gull Lake Recreation Area (U.S. Army Corps of Engineers). Observers reported survey conditions as Excellent, Good, and Fair on 48%, 39%, and 12% of routes, respectively. Survey conditions were similar during Median index values for bootstrap samples were within 0.03 drums/stop (dps) of the 120 survey means by zone and 0.06 dps of the 168 survey means by ECS section for all annual estimates since Furthermore, bootstrap medians were within 0.02 dps of 89% of the survey means by ECS section. Therefore, no bias-correction was necessary, and CI limits were defined as the 2.5 th and 97.5 th percentiles of the bootstrap frequency distribution. Mean counts of ruffed grouse drums throughout the forested regions of Minnesota were 0.8 (95% CI = ) drums/stop (dps) during The statewide drum index has remained unchanged since 2002 at a level similar to the last time the ruffed grouse population was at a low point in its cycle (i.e., ; Figure 3). Drum counts during 2005 in the 5 survey zones (Table 1, Figures 1 & 4 8) and the 7 ECS sections (Table 2, Figures 1 & 8 14) were all essentially the same as they were during 2004 (i.e., the CIs overlap considerably). 67
8 Drums / stop Figure 3. Statewide ruffed grouse drum count index values in Minnesota. Vertical error bars represent 95% confidence intervals based on bootstrap samples. Year Drums / stop Figure 4. Ruffed grouse drum count index values in the Northwest survey zone of Minnesota. Vertical error bars represent 95% confidence intervals based on bootstrap samples. Year Drums / stop Year Figure 5. Ruffed grouse drum count index values in the North Central survey zone of Minnesota. Vertical error bars represent 95% confidence intervals based on bootstrap samples. 68
9 Table 1. Ruffed grouse survey index values (drums/stop) by survey zone in Minnesota during the springs of 2004 and NW a NC NE CH SE Year Mean 95% CI b Mean 95% CI Mean 95% CI Mean 95% CI Mean 95% CI a b NW = North West, NC = North Central, NE = North East, CH = Central Hardwoods, SE = South East, as defined by county boundaries. 95% CI = 95% confidence interval for the mean. It is an estimate of the uncertainty in the value of the mean. Table 2. Ruffed grouse survey index values (drums/stop) by ECS Section a in Minnesota during the springs of 2004 and AAP b MOP NSU DLP WSU MIM Year Mean 95% CI c Mean 95% CI Mean 95% CI Mean 95% CI Mean 95% CI Mean 95% CI a b c ECS = Ecological Classification System. AAP = Lake Agassiz & Aspen Parklands, MOP = Northern Minnesota & Ontario Peatlands, NSU = Northern Superior Uplands, DLP = Northern Minnesota Drift & Lake Plains, WSU = Western Superior Uplands, and MIM = Minnesota and Northeast Iowa Morainal. The Paleozoic Plateau is the same area as the Southeast Zone (see Table ). 95% CI = 95% confidence interval for the mean. It is an estimate of the uncertainty in the value of the mean. 69
10 Drums / stop Year Figure 6. Ruffed grouse drum count index values in the Northeast survey zone of Minnesota. Vertical error bars represent 95% confidence intervals based on bootstrap samples. Drums / stop Year Figure 7. Ruffed grouse drum count index values in the Central Hardwoods survey zone of Minnesota. Vertical error bars represent 95% confidence intervals based on bootstrap samples. Drums / stop Year Figure 8. Ruffed grouse drum count index values in the Southeast survey zone of Minnesota. This represents the same area as the Paleozoic Plateau ECS section. Vertical error bars represent 95% confidence intervals based on bootstrap samples. The y-axis truncated 1 error bar so the scale would be identical for Figures
11 Drums / stop Year Figure 9. Ruffed grouse drum count index values in the Lake Agassiz and Aspen Parklands ECS section of Minnesota. Vertical error bars represent 95% confidence intervals based on bootstrap samples. Drums / stop Figure 10. Ruffed grouse drum count index values in the Northern Minnesota & Ontario Peatlands ECS section of Minnesota. Vertical error bars represent 95% confidence intervals based on bootstrap samples. The y-axis truncated 3 error bars so the scale would be identical for Figures Year Drums / stop Year Figure 11. Ruffed grouse drum count index values in the Northern Superior Uplands ECS section of Minnesota. Vertical error bars represent 95% confidence intervals based on bootstrap samples. 71
12 Drums / stop Year Figure 12. Ruffed grouse drum count index values in the Northern Minnesota Drift & Lake Plains ECS section of Minnesota. Vertical error bars represent 95% confidence intervals based on bootstrap samples. Drums / stop Year Figure 13. Ruffed grouse drum count index values in the Western Superior Uplands ECS section of Minnesota. Vertical error bars represent 95% confidence intervals based on bootstrap samples. The y-axis truncated 3 error bars so the scale would be identical for Figures Drums / stop Figure 14. Ruffed grouse drum count index values in the Minnesota and Northeast Iowa Morainal ECS section of Minnesota. Vertical error bars represent 95% confidence intervals based on bootstrap samples. Year 72
13 Sharp-tailed Grouse A total of 1,824 sharp-tailed grouse was observed at 193 dancing grounds during spring 2005 (Table 3). The number of sharp-tailed grouse counted per dancing ground in the EC range was lower than in the NW range, and the statewide mean was 9.5 (95% CI = ) grouse counted per dancing ground (Table 4). The mean number of birds counted per dancing ground during 2005 was not different than during 2004 for the 182 dancing grounds where birds were counted during both years (i.e., all CIs contained 0; Tables 3 and 5). Table 3. Number of sharp-tailed grouse dancing grounds observed during 2005 surveys and during both 2004 and 2005 surveys. Former a New Statewide EC b NW EC NW 2005 only & a b See Methods for definitions of former and new range boundaries. EC = East Central, NW = Northwest. DISCUSSION Ruffed Grouse Based upon the drum count index ruffed grouse densities during spring 2005 were likely very similar to spring densities during Index values during low periods of the population cycle are often <0.9 drums/stop (dps), so drum counts during recent years are not unusual. Although 2005 was the 4 th or 5 th year of an apparent low period in the population cycle, similar 4- to 5-year periods of relatively low drum counts have occurred as recently as the early-1980s. The number of ruffed grouse encountered by hunters and other outdoors people this fall likely will depend nearly as much upon recruitment of juveniles as on densities of males during spring. Sharp-tailed Grouse Counts of sharp-tailed grouse at dancing grounds in Minnesota during 2005 were very similar to counts during The slight decline in counts between years in the NW range, given the moderate degree of uncertainty in the estimates, was not sufficient evidence to infer a meaningful change in the abundance of sharp-tailed grouse in northwestern Minnesota. Furthermore, sources of temporal variation that are not related to the abundance of sharp-tailed grouse, such as the timing and duration of surveys, could cause minor changes in bird counts and index values. Although index values from different years are not necessarily comparable, the mean number of sharp-tailed grouse counted per dancing ground has fluctuated in a pattern consistent with an apparent long-term population cycle similar to that of ruffed grouse. During the last 20 years values of the sharptailed grouse index have been between approximately 7 and 11 birds counted per dancing ground. This year s statewide mean of 9.5 ( ) birds counted per dancing ground was in the middle of that range. 73
14 Table 4. Number of sharp-tailed grouse counted per dancing ground in Minnesota during spring. Former a New Statewide EC b NW EC NW Year Mean 95% CI c Mean 95% CI Mean 95% CI Mean 95% CI Mean 95% CI a b c See Methods for definitions of former and new range boundaries. EC = East Central, NW = Northwest. 95% CI = 95% confidence interval for the mean. It is an estimate of the uncertainty in the value of the mean. Table 5. Differences in counts of sharp-tailed grouse at comparable dancing grounds during 2004 and 2005 in Minnesota. Former a New Statewide EC b NW EC NW Value 95% CI c Value 95% CI Value 95% CI Value 95% CI Value 95% CI Birds/ground % difference in total birds a b c See Methods for definitions of former and new range boundaries. EC = East Central, NW = Northwest. 95% CI = 95% confidence interval for the value. It is an estimate of the uncertainty in the magnitude of the value. 74
15 ACKNOWLEDGEMENTS I sincerely appreciate the help of all the DNR staff and volunteer cooperators who conducted the grouse surveys. I also appreciate the efforts of Bill Berg, who coordinated the collection of grouse survey data for many years, and John Erb and others who translated most of the grouse survey data into a digital format. 75
16 Spring 2005 Prairie-Chicken Survey in Minnesota Mike Larson, Ph.D., Forest Wildlife Populations & Research Group INTRODUCTION Greater prairie-chickens (Tympanuchus cupido pinnatus) are a medium-sized grouse species ( g; lbs). During spring they gather on communal breeding areas, or leks, where males display and compete for opportunities to mate. Prairie-chicken leks are also called booming grounds because males make a low-frequency, booming vocalization during their displays. Orange air sacs on the sides of a male s neck inflate and amplify the booming sound. Pinnae, the long feathers on the sides of the neck, stand erect above the male prairie-chicken s head during display (Schroeder and Robb 1993). Prairie-chickens are also called pinnated grouse. During the early 1800s prairie-chickens were present along the southern edge of Minnesota. Following the planting of crops and clearing of forests by immigrants of European descent, the range of prairie-chickens expanded to cover most of the state by approximately As agriculture intensified, more prairies were tilled, and grassland openings in northeastern Minnesota succeeded back to forest, the range of prairie-chickens receded (Svedarsky et al. 1997). Currently, most prairie-chickens in Minnesota occur along the beach ridges of glacial Lake Agassiz in the west. The population of prairie-chickens there was expanded southward to the upper Minnesota River valley by a series of relocations during A remnant population of prairie-chickens still exists in central Minnesota also (primarily Wadena and Cass counties). From 1974 to 2003 the Minnesota Prairie Chicken Society (MPCS) coordinated annual counts of prairie-chickens at booming grounds. The MPCS surveys provided evidence to support the initiation in 2003 of a prairie-chicken hunting season, which had not occurred in Minnesota since The hunt has been limited to 100 participants, and fewer than 130 birds/year have been harvested. During 2003 and 2004 the Minnesota Department of Natural Resources (DNR) began coordinating the annual prairiechicken surveys, and a standardized survey design was adopted (Giudice 2004). The objectives of the current survey are to monitor trends in the abundance of prairie-chickens in selected but widely distributed areas and to provide conservative information for making decisions about regulations for the fall hunting season. METHODS During the few hours near sunrise from late-march until mid-may cooperating biologists from the DNR, U.S. Fish & Wildlife Service (FWS), and The Nature Conservancy (TNC) and numerous volunteers counted prairie-chickens at leks in western Minnesota. They attempted to locate and observe multiple times all prairie-chicken leks within 17 designated survey blocks (Figure 1). Each block was approximately 4 miles 4 miles square (4,144 ha) and was selected nonrandomly based upon the spatial distribution of leks and the presence of relatively abundant grassland habitat. Ten survey blocks were located in what was considered the core of the prairie-chicken range in Minnesota. The other 7 blocks were located in the periphery of the range. The permit areas for the fall hunting season roughly coincide with the core of the range (Figure 1). Observations of leks outside the survey blocks were also recorded. They contribute to the known minimum abundance of prairie-chickens and may be of historical significance. These observations, however, were only incidental to the formal survey. Bird counts from areas outside the survey blocks 76
17 cannot be used to make inferences about the relative abundance of prairie-chickens among different geographic areas (e.g., counties, permit areas) or points in time (e.g., years) because the amount of effort expended to obtain the observations was not standardized or recorded. Observers counted prairie-chickens at leks from a distance using binoculars. If vegetation or topography obscured the view of a lek, the observer attempted to flush the birds to obtain an accurate count. Observed prairie-chickens were classified by sex as either male, female, or unknown. Male prairie-chickens were usually obvious due to their display behavior. Birds were classified as unknown sex when none of the birds at a lek were observed displaying or when the birds had to be flushed to be counted. Most birds classified as unknown likely were males because most birds at leks are males. Although most male prairie-chickens attend leks most mornings, female attendance at leks is much more limited and sporadic (Svedarsky 1983). Females are also more difficult to detect because they do not vocalize or display like males. Counts of males rather than females, therefore, were used to make comparisons between core and peripheral ranges and between years. Figure 1. Survey blocks (labeled squares) and hunting permit area boundaries (solid lines) for prairiechickens in western Minnesota. Survey blocks were designated as being in either the core (black) or periphery (gray) of the range. Blocks were named after the counties (dashed lines) in which they were primarily located. Permit areas are ordered from north to south: 405A, 407A, 407B, 407C, 420A, 420B,and 421A. 77
18 RESULTS AND DISCUSSION During spring 2005 there were a minimum of 2,958 male prairie-chickens in western Minnesota (Table 1). Within hunting permit areas there were a minimum of 0.13 leks/mi 2 (0.05 leks/km 2 ) and 1.7 males/mi 2 (0.7 males/km 2 ). Minimum counts in Table 1 and the densities calculated from them are not comparable among permit areas or years because they included surveys conducted outside of the survey blocks. It was likely that probabilities of detecting leks and individual males were substantially different among permit areas during 2005 and among years within most permit areas. Minimum counts of males summarized by permit area provide conservative information for setting quotas for the fall hunting season. Table 1. Minimum abundance of prairie-chickens within and outside of hunting permit areas in western Minnesota during spring Counts of leks and birds are not comparable among permit areas or years. Permit Area Area (sq. mi.) Leks Males Unk. a 405A A B C A B A PA subtotal b 1, , Outside PAs c NA d Grand total NA 243 2, a b c d Unk. = prairie-chickens of unknown sex. It is likely that most were males. Sum among the 7 permit areas. Counts from outside the permit areas. NA = not applicable. The size of the area outside permit areas was not defined. Within survey blocks observers counted 1,319 male prairie-chickens on 98 booming grounds (Table 2). Each booming ground was observed on a median of 2 (mean = 1.9) different days, but 45% of leks were observed only once. Attendance of males at prairie-chicken leks varies among days and by time of day (Svedarsky 1983). Single counts of males at a booming ground, therefore, may be an unreliable indication of true abundance. Similar counts on multiple days, on the other hand, demonstrate that the counts may be a good indicator of true abundance. Even multiple counts, however, cannot overcome the problems associated with the failure to estimate the probability of detecting leks and individual birds at leks. Without estimates of detection probability, the prairie-chicken survey is an index to, not an estimate of, prairie-chicken abundance within the survey blocks. The credibility of the index for monitoring changes in abundance among years is dependent upon the assumption that a linear relationship exists between counts of male prairie-chickens and true abundance. In other words, we assume that (the expected value of) the probability of detection does not change among years (Yoccoz et al. 2001). 78
19 Table 2. Counts of prairie-chickens within survey blocks in Minnesota. Area 2005 Change from 2004 c Range a Survey Block (sq. mi.) Leks Males Unk. b Leks Males Core Polk Norman Norman Clay Clay Clay Clay Wilkin Wilkin Otter Tail Core subtotal Periphery Polk Norman Mahnomen Becker Becker Wilkin Otter Tail Periphery subtotal Grand total , a Survey blocks were classified as either mostly within the hunting permit areas (core) or mostly outside the permit areas (periphery). b Unk. = prairie-chickens of unknown sex. It is likely that most were males. c The 2004 count was subtracted from the 2005 count, so a negative value indicates a decline. In survey blocks in the core of the range we observed 0.39 leks/mi 2 (0.15 leks/km 2 ) and 15.2 males/lek, whereas in peripheral blocks we observed 0.31 leks/mi 2 (0.12 leks/km 2 ) and 10.3 males/lek (Table 2). Counts of males in survey blocks during 2005 were 16% less than during 2004, with declines of 18% and 11% in the core and periphery, respectively. Eight of 10 core blocks and 5 of 7 peripheral blocks experienced declines in counts. The number of leks observed in survey blocks during 2005 was 3% greater than during 2004, with an increase of 13% and a decrease of 10% in the core and periphery, respectively. It is premature to infer a population trend from 2 annual surveys. The apparent decline in the abundance of male prairie-chickens in survey blocks between the springs of 2004 and 2005, however, has 2 possible explanations. First, if the decline in abundance was real, it was likely part of normal fluctuations experienced by wildlife populations. Such fluctuations may be caused by weather patterns, random variations in the rates of survival and reproductive success, or fluctuations in habitat quality or predator populations. The hunting season alone could not have caused a decline in the prairie-chicken population. Only approximately 55 birds were killed during the fall 2004 hunting season (Larson 2005), and the harvest allowed under the prairie-chicken hunting regulations (i.e., a maximum of 200 birds) is 79
20 conservative and unlikely to affect the abundance of prairie-chickens the following spring. The second possible explanation for the decline in counts is that the probability of detecting leks or individual males during the 2005 survey may have been less than the probabilities of detection during The ratio of detection probabilities during the 2 surveys is unknown, so inferences about changes in true abundance should be made cautiously. Overall, the abundance of prairie-chickens in western Minnesota appears to have been increasing steadily from 1997 to 2004 (Giudice 2004). ACKNOWLEDGEMENTS Mark Chase (FWS), Doug Hedtke, Ross Hier, Earl Johnson, Tom Kucera, Doug Wells (FWS), Brian Winter (TNC), and Terry Wolfe coordinated and supervised individual surveys. John Giudice prepared last year s survey report, upon which I depended heavily. He, Mark Lenarz, and Jack Wingate reviewed and helped me improve an earlier draft of this report. I sincerely appreciate all their contributions and the efforts of the volunteer cooperators and DNR staff who conducted the prairiechicken surveys. BIBLIOGRAPHY Giudice, J. H Minnesota prairie chicken survey: 2004 annual report. Minnesota Department of Natural Resources, St. Paul, MN. Larson, M. A Minnesota prairie-chicken hunting season and hunter survey. Minnesota Department of Natural Resources, St. Paul, MN. Schroeder, M. A., and L. A. Robb Greater prairie-chicken. The birds of North America, number 36. The American Ornithologists Union, Washington, DC, and The Academy of Natural Sciences, Philadelphia, PA. Svedarsky, W. D Reproductive chronology of greater prairie-chickens in Minnesota and recommendations for censusing and nest searching. Prairie Naturalist 15: Svedarsky, W. D., T. J. Wolfe, and J. E. Toepfer The greater prairie-chicken in Minnesota. Minnesota Wildlife Report 11. Minnesota Department of Natural Resources, St. Paul, MN. Yoccoz, N. G., J. D. Nichols, and T. Boulinier Monitoring of biological diversity in space and time. Trends in Ecology and Evolution 16:
.")
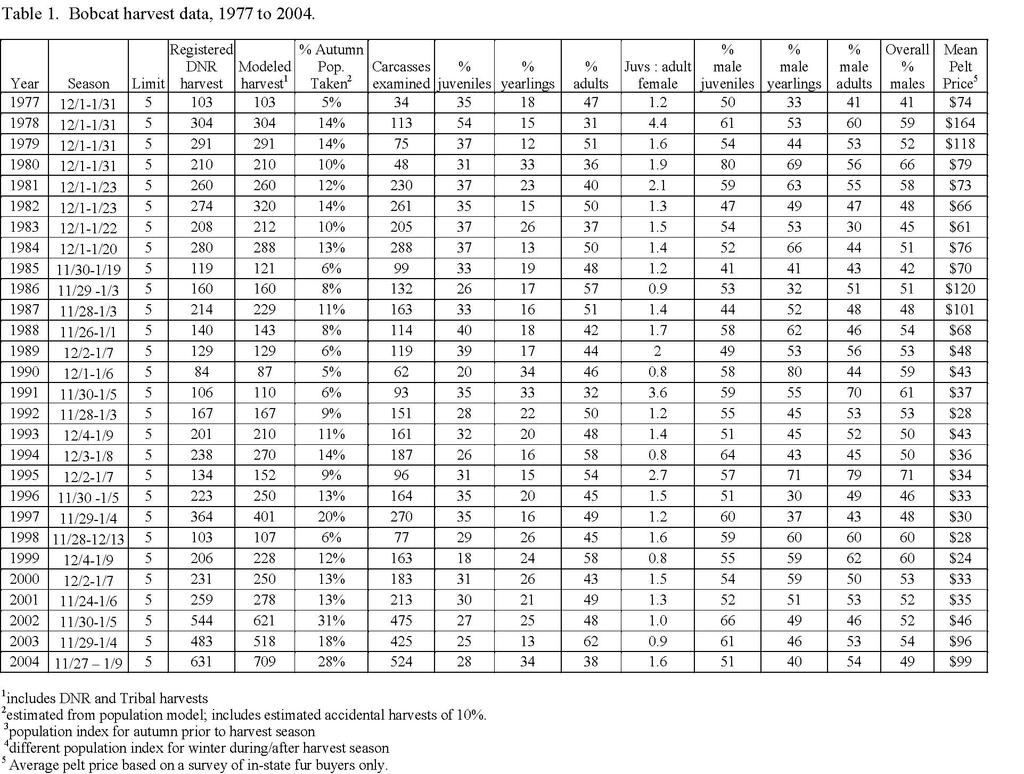
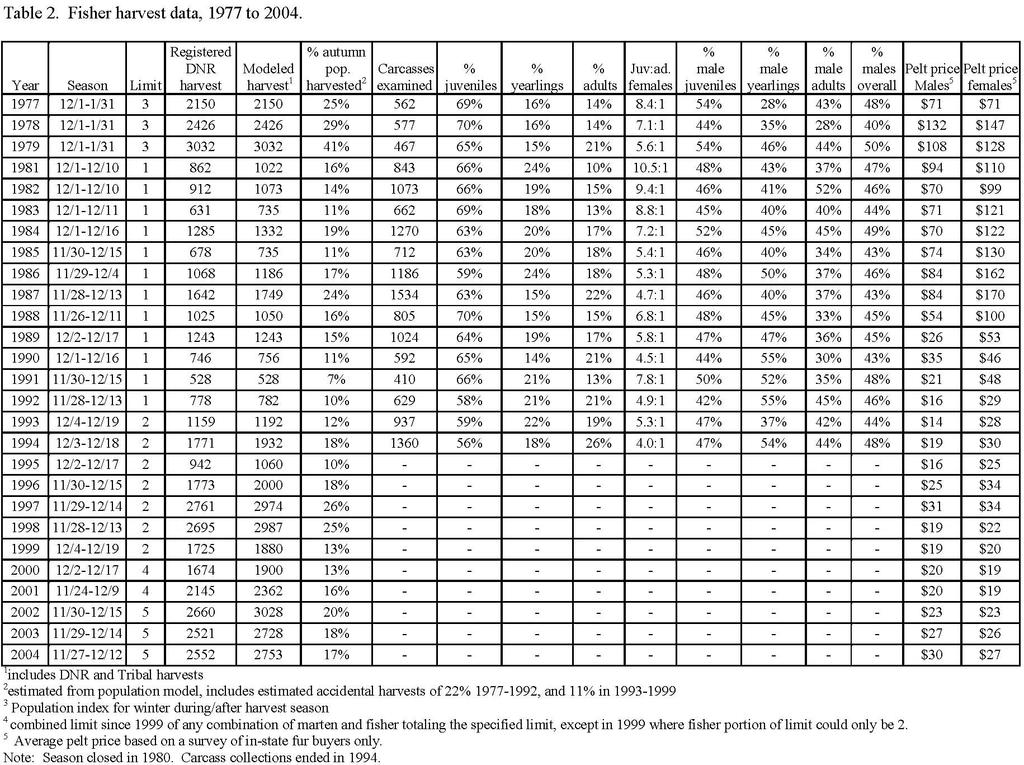
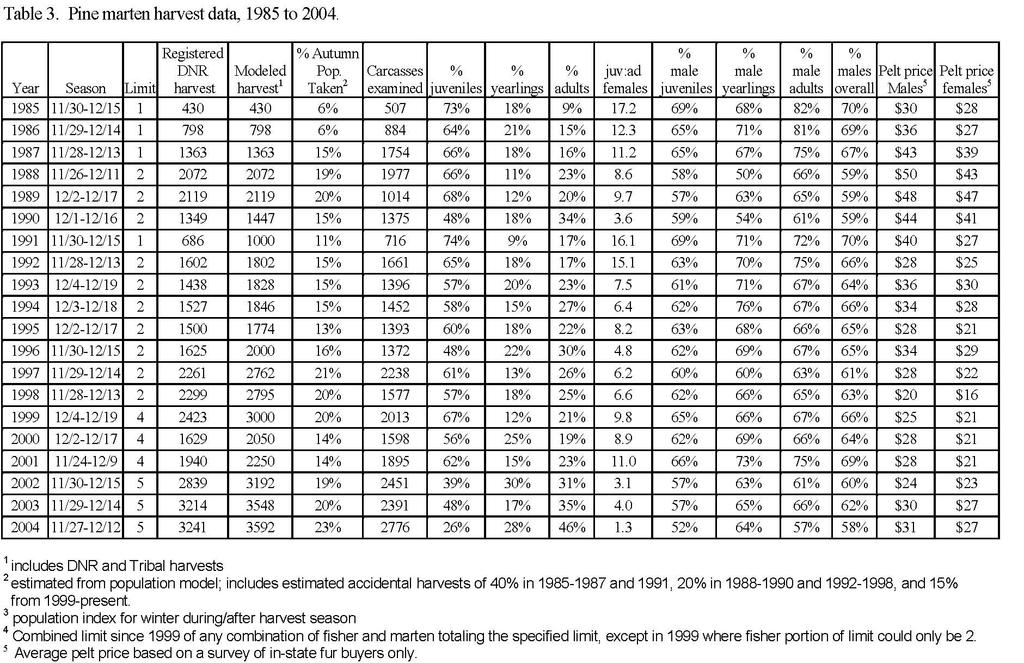
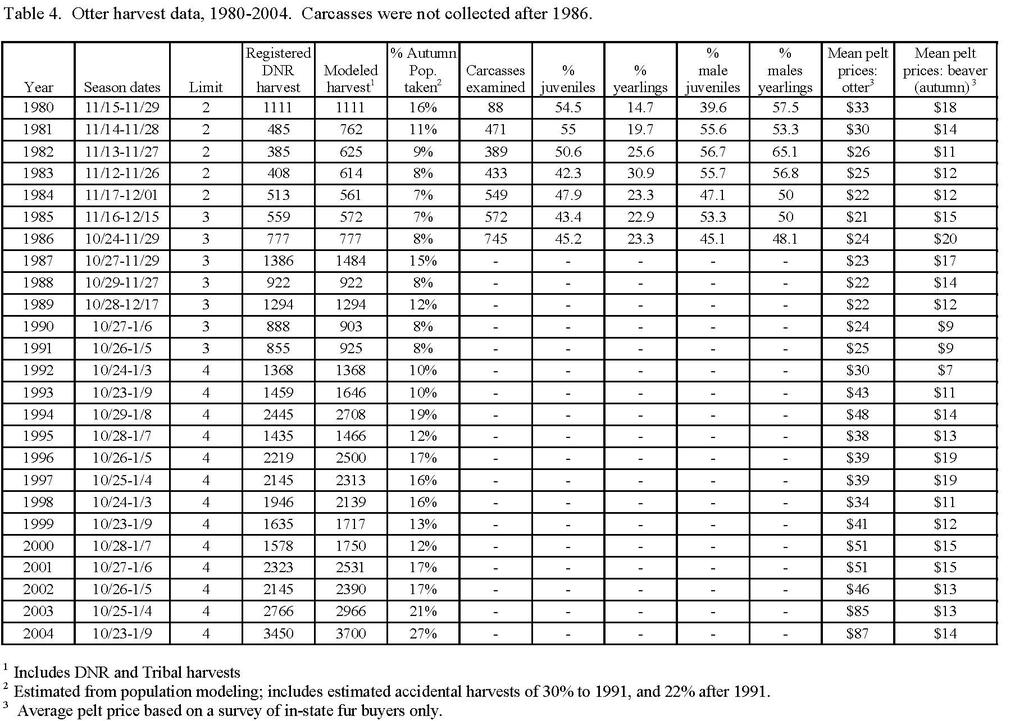
21 REGISTERED FURBEARER POPULATION MODELING 2005 Report John Erb, Forest Wildlife Populations & Research Group INTRODUCTION For populations of secretive carnivores, obtaining field-based estimates of population size remains a challenging task (Hochachka et al. 2000; Wilson and Delehay 2001; Conn et al. 2004). This is particularly true when one is interested in annual estimates, multiple species, and/or large areas. Nevertheless, population estimates are desirable to assist in making management/harvest decisions. Population modeling is a valuable tool for synthesizing our knowledge of population demography, predicting outcomes of management decisions, and approximating population size. In the late 1970s, Minnesota developed population models for 4 species of carnivores (fisher, marten, bobcat, and otter) to help estimate population size and track population changes. All are deterministic accounting models that do not currently incorporate density-dependence. Modeling projections are interpreted in conjunction with harvest data and results from annual field-based track surveys, with the exception of otter for which no harvest-independent survey data is currently available for comparison. METHODS Primary model inputs include the estimated 1977 starting population size, estimates of agespecific survival and reproduction, and sex- and age-specific harvest data. Reproductive inputs are based largely on carcass data collected in the early 1980 s, and for bobcats, additional data collected in 1992 and from 2003-present. Initial survival inputs were based on a review of published estimates in the literature. Obtaining updated Minnesota-specific survival estimates remains a goal for future research. Harvest data is obtained through mandatory furbearer registration. A detailed summary of 2004 harvest information is available in a separate report. Bobcat and pine marten year-class data is obtained via a combination of x-ray examination of pulp cavity width and microscopic counts of cementum annuli from teeth of harvested animals. While the population models only utilize data for the 3 age-classes (juvenile, yearling, adult), marten and bobcat cementum annuli counts have been collected for all nonjuveniles in recent years to facilitate interpretation of reproductive data (bobcats) and to obtain current information on year-class distribution for both species. Current harvest age proportions for fisher and otter are approximated using averages computed from carcass collections obtained during (otter) and (fisher). For comparison to model projections, field-based track survey indices are presented in this report as running 3-year (t-1, t, t+1) averages of the observed track index, with the most recent year s average computed as (2/3*current index + 1/3*previous index). More detailed descriptions of scent post and winter track survey methods and results are available in separate reports. RESULTS AND DISCUSSION Bobcat. The 2004 registered DNR trapping and hunting harvest set a new record (631; Table 1). Modeled harvest, which includes tribal take, was 709. Based on population modeling estimates, 28% of the fall population was harvested. The percentage of yearlings in the harvest was slightly higher and the percentage of adults slightly lower than normal, a reversal of the deviation noted last year. Nevertheless, overall age/sex statistics and average take per trapper/hunter were within the bounds previously observed (Table 1). Based on examination of reproductive tracts, pregnancy rate of yearlings was estimated at 48%, compared to only 16% last year. Average litter size for pregnant yearlings was 2.3 (2.0 last year). Pregnancy rate for 2+ year olds averaged 82%, with a mean litter size of While sample sizes are 81
22 small for the oldest age-classes, data from the past 2 years suggests pregnancy rates and litter sizes are highest for 4-6 year old females. After another record harvest, modeling predicts a decline in this spring s bobcat population (Figure 1) to pre-2001 levels. Winter track counts, however, remain well above pre-2001 levels. The estimated 2005 spring population is ~ 1,700. Fisher: Harvest under the DNR framework was 2,552 (Table 2). Modeled take was 2,753, a 1% increase from An estimated 17% of the fisher population was harvested, within the bounds of previous seasons. Carcass collections ended in 1994, so no current age or reproductive data are available. Population modeling suggests a steadily increasing fisher population for the past 6 years. However, harvests have remained relatively stable during this time, and winter track counts have declined the last 2 years (Figure 3). Modeling estimates a current spring population of ~12,600. Marten: For the third year in a row, marten harvest set a record (DNR framework 3,241; modeled take 3,592) (Table 3). Although juveniles clearly predominate in the marten harvest, older marten are evident in the harvest as well (Figure 5). The maximum age observed this year was 12, similar to last year s result (13) as well as information from Ontario (13; Fryxell et al. 2001). Based on modeling, a record 23% of the fall population was harvested. The percent juveniles (26%) and the juvenile:adult female ratio (1.3) in the harvest dropped to their lowest levels since data collection began. Following 3 years of increased harvest, modeling suggests the population is declining, with an estimated spring population of ~11,800 (Figure 4). Since 1997, averaged winter track indices have been stable to slightly declining. Otter: The DNR framework harvest increased 25% to a record 3,450, and the modeled harvest total was 3,700 (Table 4). An estimated 27% of the fall population was harvested, the highest such estimate since modeling began. Carcass collections ended in 1986, so no age or reproductive data are available. Modeling indicates the population has slightly declined in each of the past 4 years (Figure 6). No independent otter survey data are currently available for comparison. The current estimated spring population is ~ 10,600. LITERATURE CITED Conn, P. B., L. L. Bailey, and J. R. Sauer Indexes as surrogates to abundance for low-abundance species. Pages in W. L. Thompson, editor. Sampling rare or elusive species: Concepts, designs, and techniques for estimating population parameters. Island Press, Washington, D.C., USA. Fryxell, J., J. B. Falls, E. A. Falls, R. J. Brooks, L. Dix, and M. Strickland Harvest dynamics of mustelid carnivores in Ontario, Canada. Wildlife Biology 7: Hochachka, W. M., K. Martin, F. Doyle, and C. J. Krebs Monitoring vertebrate populations using observational data. Canadian Journal of Zoology 78: Olson, C small mammal survey report. Technical Report Authority, Duluth, MN. Wilson, G. J., and R. J. Delahay A review of methods to estimate the abundance of terrestrial carnivores using field signs and observation. Wildlife Research 28:
23 Figure 1. Bobcat populations, harvests, and survey indices, Harvests include estimated accidental take. 83
24 84
25 Figure 2. Age structure of male and female bobcat in the harvest. 85
26 Figure 3. Fisher populations, harvests, and survey indices, Harvests include estimated accidental take. 86
27 87
28 Figure 4. Pine marten populations, harvests, and survey indices, Harvests include estimated accidental take. 88
29 89
30 Figure 5. Age structure of male and female pine marten in the harvest. 90
31 Figure 6. Otter populations and harvests, Harvests include estimated accidental take. 91
32 92
33 Population Trends of White-tailed Deer in the Forest Zone 2005 INTRODUCTION Mark S. Lenarz, Forest Wildlife Populations & Research Group Deer hunters are required by regulation to register each deer they harvest within 24 hours of the close of the deer-hunting season. Data collected as part of this registration process provide important information on the sex and age of deer killed, population trends, and the effectiveness of current management regulations. The following report presents a brief analysis of the 2004 harvest registration data in the forest zone (Figure 1). This is followed by a discussion of deer population trends and projections in the forest zone based on simulation modeling Figure 1. Either-sex permit areas in the forested zone, Permit areas 283 and 110 were combined into single permit area (110). Permit area numbers 211, 214 and 284 changed to 111, 114, and 184, respectively. Permit areas 114, 152, and 287, were not modeled. HARVEST In 2004, hunters registered 260,604 deer, the second highest harvest ever recorded in Minnesota. Of that number, 51% or 132,442 deer were harvested in the forested zone (Figure 1, Table 1). The 2004 forest zone harvest declined 11% from the 2003 harvest. The following discussion applies to the subset of deer harvested in the forest zone. The buck harvest increased or remained stable in 20 of the 37 permit areas (Table 2). The total forest zone buck harvest declined 3%, however. The change in buck harvest by permit area was correlated with the change in simulated density (r = 0.52, p<0.01). This implies that the buck harvest did 93
34 not decline in response to the high number of either-sex opportunities and still represents a good trend indicator for deer populations in the forest. Buck hunter success (buck harvest/licenses) in 2004 remained at historically high levels in both Zones 1 and 2 (Figure 2). 30% Buck Hunter Success 25% 20% 15% 10% 5% Zone 1 Zone 2 0% Figure 2. Success of licensed hunters at killing a buck, The antlerless harvest declined in 31 of the 37 permit areas (Table 3) and the total antlerless harvest declined 17%. The greatest decline occurred in Permit Area 180 (60%), which shifted from managed status in 2003 to lottery in Similarly, the greatest increases in antlerless harvest took place in permit areas (PA126, 131%; PA168, 37%; and PA297, 232%), which shifted from lottery in 2003 to managed in The decline in the antlerless harvest was likely caused by a combination of several factors. Model simulations indicated that there were 8% fewer deer in the forest zone in 2004 (Table 4). In addition, anecdotal reports suggested that many hunters still had venison left over from the 2003 season and were less interested in killing more than one deer. This conjecture is corroborated by the fact that statewide sales of bonus permits decreased 6% from The harvest by archers and muzzleloader hunters accounted for almost 7% of the total harvest. The archery harvest increased 6% over the previous year while the muzzleloader harvest increased by 7%. Increased sales of All Season Licenses and the availability of bonus permits likely account for these increases. Population Trends and Model Projections Based on the winter severity index (WSI), the winter of was relatively mild in the southwestern portion of the forest zone (Figure 3). Stations in the remainder of the forest zone had WSI values more representative of a moderate to moderately severe winter. Warm temperatures in late March and early April rapidly melted off the snow and likely reduced levels of winter mortality, especially along the Canadian border and in the Arrowhead. 94
35 # 82 # 135 # 134 # 155 # 88 # 87 # 44 # # # # # 126 # # # 130 # 177 # 128 # 26 Figure 3. Winter Severity Index (WSI) readings from winter WSI readings between 100 and 180 are considered moderate. Simulation modeling was used in 36 permit areas (Figure 1, Table 4) to approximate deer density, identify trends, and project the effect of the 2005-hunting season. To better summarize the results for this report, permit areas were lumped in to one of 5 areas (Figs. 4 and 5). Deer density varied according to area with the lowest densities occurring in the Northeast (NE) and Northwest (NW). Highest densities occurred in the West Central (WC). The same basic trend occurred in all 5 areas; deer density was at the lowest level in 1997 following the severe winters of the mid-1990 s and then steadily increased in response to low (or no) antlerless permits and mild winters. In the South (S), deer density peaked in 2000, stabilized, and then declined in response to an increased opportunity to kill multiple antlerless deer. The remaining areas peaked in Since 2003, the declines in the NW, WC and Central (C) were a response to the high antlerless harvest. There was less opportunity to kill antlerless deer in the NE and the decline there, was likely associated with winters that were more severe than elsewhere in the forest. 95
36 25 Deer/sq.mi NW NE WC C S Figure 4. Population trends of deer in forest zone. Trend lines represent the groups of permit areas as illustrated in Figure 5. Density represents pre-fawn density. NW WC C NE S Figure 5. Groups of permit areas discussed in text and in figure 4. 96
Each spring, the Minnesota DNR coordinates statewide ruffed grouse (Bonasa
 2014 MINNESOTA SPRING GROUSE SURVEYS Charlotte Roy Forest Wildlife Populations and Research Group Minnesota Department of Natural Resources Grand Rapids, Minnesota 19 June 2014 SUMMARY OF FINDINGS Each
2015 MINNESOTA SPRING GROUSE SURVEYS
 SUMMARY OF FINDINGS 2015 MINNESOTA SPRING GROUSE SURVEYS Charlotte Roy Forest Wildlife Populations and Research Group Minnesota Department of Natural Resources Grand Rapids, Minnesota 17 June 2015 Each
Each spring, the Minnesota DNR coordinates statewide ruffed grouse (Bonasa
 2016 MINNESOTA SPRING GROUSE SURVEYS Charlotte Roy Forest Wildlife Populations and Research Group Minnesota Department of Natural Resources Grand Rapids, Minnesota 10 June 2016 SUMMARY OF FINDINGS Each
2018 Minnesota Spring Grouse surveys
 2018 Minnesota Spring Grouse surveys Charlotte Roy Forest Wildlife Populations and Research Group Minnesota Department of Natural Resources Grand Rapids, Minnesota 5 June 2018 SUMMARY OF FINDINGS The Minnesota
Greater prairie-chickens (Tympanuchus cupido pinnatus) were surveyed in 16 of 17
 were surveyed in 16 of 17") 2014 MINNESOTA PRAIRIE-CHICKEN SURVEY Charlotte Roy Forest Wildlife Populations and Research Group Minnesota Department of Natural Resources Grand Rapids, Minnesota 8 August 2014 SUMMARY OF FINDINGS Greater
2014 MINNESOTA PRAIRIE-CHICKEN SURVEY Charlotte Roy Forest Wildlife Populations and Research Group Minnesota Department of Natural Resources Grand Rapids, Minnesota 8 August 2014 SUMMARY OF FINDINGS Greater
FOREST WILDLIFE POPULATIONS. Forest Wildlife Populations and Research Group 1201 East Highway 2 Grand Rapids, MN (218)
") FOREST WILDLIFE POPULATIONS Forest Wildlife Populations and Research Group 1201 East Highway 2 Grand Rapids, MN 55744 (218) 327-4432 47 48 SUMMARY OF FINDINGS 2015 MINNESOTA SPRING GROUSE SURVEYS Charlotte
FOREST WILDLIFE POPULATIONS Forest Wildlife Populations and Research Group 1201 East Highway 2 Grand Rapids, MN 55744 (218) 327-4432 47 48 SUMMARY OF FINDINGS 2015 MINNESOTA SPRING GROUSE SURVEYS Charlotte
THE COMMON LOON. Population Status and Fall Migration in Minnesota MINNESOTA ORNITHOLOGISTS UNION OCCASIONAL PAPERS: NUMBER 3
 THE COMMON LOON Population Status and Fall Migration in Minnesota MINNESOTA ORNITHOLOGISTS UNION OCCASIONAL PAPERS: NUMBER 3 Edited by Peder H. Svingen and Anthony X. Hertzel THE COMMON LOON Population
2014 SHARP-TAILED GROUSE (Tympanuchus phasianellus) SURVEY FOR THE SPIRIT LAKE RESERVATION
 SURVEY FOR THE SPIRIT LAKE RESERVATION") 2014 SHARP-TAILED GROUSE (Tympanuchus phasianellus) SURVEY FOR THE SPIRIT LAKE RESERVATION Carrie Duafala, Biologist Spirit Lake Nation Fish and Wildlife Department ABSTRACT The 2014 Sharp-tailed Grouse
2014 SHARP-TAILED GROUSE (Tympanuchus phasianellus) SURVEY FOR THE SPIRIT LAKE RESERVATION Carrie Duafala, Biologist Spirit Lake Nation Fish and Wildlife Department ABSTRACT The 2014 Sharp-tailed Grouse
David P. Rave, Michael C. Zicus, John R. Fieberg, John H. Giudice, and Robert G. Wright
 469 MINNESOTA S RING-NECKED DUCK BREEDING PAIR SURVEY David P. Rave, Michael C. Zicus, John R. Fieberg, John H. Giudice, and Robert G. Wright SUMMARY OF FINDINGS A pilot study was conducted in 2004-2006
Black Tern Sightings in Minnesota:
 Nongame Wildlife Program Division of Ecological Services Minnesota Department of Natural Resources Black Tern Sightings in Minnesota: 1990-1995 Submitted to the U.S. Fish and Wildlife Service, Region 3
Sharp-tailed Grouse Lek Surveys Landowner Inquiry Results By: Cameron Broatch Senior Wildlife Technician
 Sharp-tailed Grouse Lek Surveys By: Cameron Broatch Senior Wildlife Technician Alberta Conservation Association Northwest Region 2002 Executive Summary Spring lek surveys in the Northwest region of Alberta
Mt. Mansfield Amphibian Monitoring. Update. For the Vermont Monitoring Cooperative
 Mt. Mansfield Amphibian Monitoring Update 2010 (Covering 1993-2010) For the Vermont Monitoring Cooperative Erin Talmage and James S. Andrews Amphibian Monitoring on Mt. Mansfield, Vermont 1993-2010 Background
Marbled Murrelet Effectiveness Monitoring, Northwest Forest Plan
 Marbled Murrelet Effectiveness Monitoring, Northwest Forest Plan 2017 Summary Report Northwest Forest Plan Interagency Regional Monitoring Program Photo credits: S.F. Pearson (top) May 2018 1 Marbled Murrelet
American Bittern Minnesota Conservation Summary
 Credit Jim Williams American Bittern Minnesota Conservation Summary Audubon Minnesota Spring 2014 The Blueprint for Minnesota Bird Conservation is a project of Audubon Minnesota written by Lee A. Pfannmuller
Farr wind farm: A review of displacement disturbance on dunlin arising from operational turbines
 Farr wind farm: A review of displacement disturbance on dunlin arising from operational turbines 2002-2015. Alan H Fielding and Paul F Haworth September 2015 Haworth Conservation Haworth Conservation Ltd
Sharp-tailed Grouse Minnesota Conservation Summary
 Credit Jim Williams Sharp-tailed Grouse Minnesota Conservation Summary Audubon Minnesota Spring 2014 The Blueprint for Minnesota Bird Conservation is a project of Audubon Minnesota written by Lee A. Pfannmuller
2017 Annual Volunteer Report
 2017 Annual Volunteer Report Volunteer Statistics Summary 23,164 DNR 280,419 Hours Donated 135 FTE s (Full Time Equivalents based on a 40-hour work week or 2,080 hours/year.) Volunteer hours are equivalent
THE COMMON LOON. Population Status and Fall Migration in Minnesota MINNESOTA ORNITHOLOGISTS UNION OCCASIONAL PAPERS: NUMBER 3
 THE COMMON LOON Population Status and Fall Migration in Minnesota MINNESOTA ORNITHOLOGISTS UNION OCCASIONAL PAPERS: NUMBER 3 Edited by Peder H. Svingen and Anthony X. Hertzel THE COMMON LOON Population
Climate Change Impacts on Wildlife
 Climate Change Impacts on Wildlife Benjamin Zuckerberg, Karine Princé, and Lars Pomara Department of Forest and Wildlife Ecology University of Wisconsin-Madison Acknowledgements Brad Potter Upper Midwest
The Missouri Greater Prairie-Chicken: Present-Day. Survival and Movement
 The Missouri Greater Prairie-Chicken: Present-Day Survival and Movement 2010 Graduate Research Scholarship Summary Report Presented to the Audubon Society of Missouri by Kaylan Kemink Dr. Dylan Kesler,
American Kestrel. Appendix A: Birds. Falco sparverius. New Hampshire Wildlife Action Plan Appendix A Birds-183
 American Kestrel Falco sparverius Federal Listing State Listing Global Rank State Rank Regional Status N/A SC S3 High Photo by Robert Kanter Justification (Reason for Concern in NH) The American Kestrel
Red-breasted Merganser Minnesota Conservation Summary
 Credit Jim Williams Red-breasted Merganser Minnesota Conservation Summary Audubon Minnesota Spring 2014 The Blueprint for Minnesota Bird Conservation is a project of Audubon Minnesota written by Lee A.
Chapter 2. Minnesota Species in Greatest Conservation Need
 Chapter 2. Minnesota Species in Greatest Conservation Need Definition States were required in the development of their 2005 Wildlife Action Plans to identify species in greatest conservation need and to
Note: Some squares have continued to be monitored each year since the 2013 survey.
 Woodcock 2013 Title Woodcock Survey 2013 Description and Summary of Results During much of the 20 th Century the Eurasian Woodcock Scolopax rusticola bred widely throughout Britain, with notable absences
Wildlife Habitat Patterns & Processes: Examples from Northern Spotted Owls & Goshawks
 Wildlife Habitat Patterns & Processes: Examples from Northern Spotted Owls & Goshawks Peter Singleton Research Wildlife Biologist Pacific Northwest Research Station Wenatchee WA NFS role in wildlife management:
Project summary. Key findings, Winter: Key findings, Spring:
 Summary report: Assessing Rusty Blackbird habitat suitability on wintering grounds and during spring migration using a large citizen-science dataset Brian S. Evans Smithsonian Migratory Bird Center October
Marbled Murrelet Effectiveness Monitoring, Northwest Forest Plan
 Marbled Murrelet Effectiveness Monitoring, Northwest Forest Plan 2014 Summary Report Northwest Forest Plan Interagency Regional Monitoring Program Photo credits: M. Lance, WDFW (top), M.G. Shepard (bottom)
Black-crowned Night-heron Minnesota Conservation Summary
 Credit Deborah Reynolds Black-crowned Night-heron Minnesota Conservation Summary Audubon Minnesota Spring 2014 The Blueprint for Minnesota Bird Conservation is a project of Audubon Minnesota written by
American White Pelican Minnesota Conservation Summary
 Credit Carrol Henderson American White Pelican Minnesota Conservation Summary Audubon Minnesota Spring 2014 The Blueprint for Minnesota Bird Conservation is a project of Audubon Minnesota written by Lee
Project Barn Owl. Title Project Barn Owl
 Project Barn Owl Title Project Barn Owl 1995-1997 Description and Summary of Results Throughout the 18th and early 19th centuries the Barn Owl Tyto alba was regarded as being the most common owl over much
OWL MONITORING PROGRAM
 WESTERN GREAT LAKES REGION OWL MONITORING PROGRAM 2005 Final Report Produced for Minnesota Dept. of Natural Resources Nongame Region 2 Wisconsin Dept. of Natural Resources Wildlife Management July 2005
Notes on a Breeding Population of Red-headed Woodpeckers in New York State. Jacob L. Berl and John W. Edwards
 Notes on a Breeding Population of Red-headed Woodpeckers in New York State Jacob L. Berl and John W. Edwards Division of Forestry and Natural Resources, West Virginia University Morgantown, WV 26505 The
Flammulated Owl Surveys in Sequoia National Forest 2011
 2011 Final Report Prepared for: U.S. Fish and Wildlife Service Sacramento, CA Cooperative Agreement No. 82011BJ111 Prepared by: Jenna E. Stanek, John R. Stanek, and Mary J. Whitfield Southern Sierra Research
Mississippi s Conservation Reserve Program CP33 - Habitat Buffers for Upland Birds Mississippi Bird Monitoring and Evaluation Plan
 Mississippi s Conservation Reserve Program CP33 - Habitat Buffers for Upland Birds Mississippi Bird Monitoring and Evaluation Plan 2007 Annual Report Mississippi s Conservation Reserve Program CP33 -
2016 WATERFOWL BREEDING POPULATION SURVEY MINNESOTA
 2016 WATERFOWL BREEDING POPULATION SURVEY MINNESOTA TITLE: Waterfowl Breeding Population Survey for Minnesota STRATA SURVEYED: Minnesota Strata 1, 2, and 3 DATES: May 2-May 16, 2016 DATA SUPPLIED BY: Minnesota
Protecting the Endangered Mount Graham Red Squirrel
 MICUSP Version 1.0 - NRE.G1.21.1 - Natural Resources - First year Graduate - Female - Native Speaker - Research Paper 1 Abstract Protecting the Endangered Mount Graham Red Squirrel The Mount Graham red
Project Title: Migration patterns, habitat use, and harvest characteristics of long-tailed ducks wintering on Lake Michigan.
 Sea Duck Joint Venture Annual Project Summary FY 2016 (October 1, 2015 to Sept 30, 2016) Project Title: Migration patterns, habitat use, and harvest characteristics of long-tailed ducks wintering on Lake
WESTERN GREAT LAKES REGION OWL MONITORING SURVEY
 WESTERN GREAT LAKES REGION OWL MONITORING SURVEY 2006 Final Report Produced for Minnesota Dept. of Natural Resources Nongame Region 2 Wisconsin Dept. of Natural Resources Wildlife Management Minnesota
Grassland Bird Survey Protocol Sauvie Island Wildlife Area
 Grassland Bird Survey Protocol Sauvie Island Wildlife Area Project Objective: Help determine if native grassland bird species are benefiting from restoration of grassland/pasture habitats at the Sauvie
WWF-Canada - Technical Document
 WWF-Canada - Technical Document Date Completed: September 14, 2017 Technical Document Living Planet Report Canada What is the Living Planet Index Similar to the way a stock market index measures economic
PART FIVE: Grassland and Field Habitat Management
 PART FIVE: Grassland and Field Habitat Management PAGE 64 15. GRASSLAND HABITAT MANAGEMENT Some of Vermont s most imperiled birds rely on the fields that many Vermonters manage as part of homes and farms.
Loggerhead Shrike (Lanius ludovicianus)
") Loggerhead Shrike (Lanius ludovicianus) NMPIF level: Species Conservation Concern, Level 2 (SC2) NMPIF Assessment score: 14 NM stewardship responsibility: Moderate National PIF status: No special status
Loggerhead Shrike (Lanius ludovicianus) NMPIF level: Species Conservation Concern, Level 2 (SC2) NMPIF Assessment score: 14 NM stewardship responsibility: Moderate National PIF status: No special status
Bay breasted Warbler. Appendix A: Birds. Setophaga castanea. New Hampshire Wildlife Action Plan Appendix A Birds-288
 Bay breasted Warbler Setophaga castanea Federal Listing State Listing Global Rank State Rank Regional Status N/A S5 S4 Very High Photo by Len Medlock Justification (Reason for Concern in NH) Populations
Ladd Marsh Wildlife Area BCS number: 49-3
 Oregon Coordinated Aquatic Bird Monitoring: Description of Important Aquatic Bird Site Ladd Marsh Wildlife Area BCS number: 49-3 Site description author M. Cathy Nowak, Ladd Marsh Wildlife Area Biologist
Atlantic. O n t h e. One of the best parts of fall is hearing the cacophony of honking,
 O n t h e Atlantic Flyway Keeping track of New Hampshire s waterfowl is an international affair. One of the best parts of fall is hearing the cacophony of honking, high-flying geese as they pass overhead.
Florida Field Naturalist
 Florida Field Naturalist PUBLISHED BY THE FLORIDA ORNITHOLOGICAL SOCIETY VOL. 26, NO. 3 AUGUST 1998 PAGES 77-108 Florida Field Nat. 26(2):77-83, 1998. THE PROPORTION OF SNAIL KITES ATTEMPTING TO BREED
2018 WATERFOWL BREEDING POPULATION SURVEY, MINNESOTA
 2018 WATERFOWL BREEDING POPULATION SURVEY, MINNESOTA TITLE: Waterfowl Breeding Population Survey for Minnesota STRATA SURVEYED: Minnesota Strata 1, 2, and 3 DATES: May 7-21, 2018 DATA SUPPLIED BY: Minnesota
3 rd Generation Thunderstorm Map. Predicted Duck Pair Accessibility to Upland Nesting Habitat in the Prairie Pothole Region of Minnesota and Iowa
 3 rd Generation Thunderstorm Map Predicted Duck Pair Accessibility to Upland Nesting Habitat in the Prairie Pothole Region of Minnesota and Iowa Grassland Bird Conservation Areas Wetland Reserve Program
HOW THE OTHER HALF LIVES: MONARCH POPULATION TRENDS WEST OF THE GREAT DIVIDE SHAWNA STEVENS AND DENNIS FREY. Biological Sciences Department
 HOW THE OTHER HALF LIVES: MONARCH POPULATION TRENDS WEST OF THE GREAT DIVIDE SHAWNA STEVENS AND DENNIS FREY Biological Sciences Department California Polytechnic State University San Luis Obispo, California
Sea Duck Joint Venture Annual Project Summary for Endorsed Projects FY 2010 (October 1, 2009 to Sept 30, 2010)
") Sea Duck Joint Venture Annual Project Summary for Endorsed Projects FY 2010 (October 1, 2009 to Sept 30, 2010) Project Title: No. 2 Identification of Chukchi and Beaufort Sea Migration Corridor for Sea
Sea Duck Joint Venture Annual Project Summary for Endorsed Projects FY 2010 (October 1, 2009 to Sept 30, 2010) Project Title: No. 2 Identification of Chukchi and Beaufort Sea Migration Corridor for Sea
Are pine martens the answer to grey squirrel control?
 Are pine martens the answer to grey squirrel control? Journalists seem to think so.. The Vincent Wildlife Trust Founded in 1975 by Hon. Vincent Weir A charity engaged in mammal research, surveys, monitoring
Winter Skylarks 1997/98
 Winter Skylarks 1997/98 Title Winter Skylarks 1997/98 Description and Summary of Results Numbers of breeding Skylarks Alauda arvensis declined by 58% in lowland British farmland between 1975 and 1994 but
FORT A.P. HILL DEER HARVEST REPORT
 FORT A.P. HILL DEER HARVEST REPORT 2016-2017 U.S. Army Garrison Fort A.P. Hill Directorate of Public Works Environmental and Natural Resources Division Fisheries & Wildlife Branch Date: February 2017 Page
NEST BOX TRAIL HISTORY
 NEST BOX TRAIL HISTORY 1985-2016 by KEITH EVANS and JACK RENSEL INTRODUCTION In August of 1984, members of the Wasatch Audubon Society (Ogden, Utah) held a workshop to construct bluebird nesting boxes.
AERIAL SURVEY OF BIRDS AT MONO LAKE ON AUGUST 24, 1973
 AERIAL SURVEY OF BIRDS AT MONO LAKE ON AUGUST 24, 1973 by Ronald M. Jurek Special Wildlife Investigations Wildlife Management Branch California Department of Fish and Game September 1973 Jurek, R.M. 1973.
THE COMMON LOON. Population Status and Fall Migration in Minnesota MINNESOTA ORNITHOLOGISTS UNION OCCASIONAL PAPERS: NUMBER 3
 THE COMMON LOON Population Status and Fall Migration in Minnesota MINNESOTA ORNITHOLOGISTS UNION OCCASIONAL PAPERS: NUMBER 3 Edited by Peder H. Svingen and Anthony X. Hertzel THE COMMON LOON Population
Pilot effort to develop 2-season banding protocols to monitor black duck vital rates. Proposed by: Black Duck Joint Venture February 2009
 Pilot effort to develop 2-season banding protocols to monitor black duck vital rates. Proposed by: Black Duck Joint Venture February 2009 Prepared by: Patrick Devers, Guthrie Zimmerman, and Scott Boomer
Farr wind farm: A review of displacement disturbance on golden plover arising from operational turbines
 Farr wind farm: A review of displacement disturbance on golden plover arising from operational turbines 2005-2015. Alan H Fielding and Paul F Haworth September 2015 Haworth Conservation Haworth Conservation
2. Survey Methodology
 Analysis of Butterfly Survey Data and Methodology from San Bruno Mountain Habitat Conservation Plan (1982 2000). 2. Survey Methodology Travis Longcore University of Southern California GIS Research Laboratory
Fall Trumpeter Swan Survey of the High Plains Flock
 University of Nebraska - Lincoln DigitalCommons@University of Nebraska - Lincoln US Fish & Wildlife Publications US Fish & Wildlife Service 11-2006 Fall Trumpeter Swan Survey of the High Plains Flock Shilo
Golden Eagle (Aquila chrysaetos)
") Golden Eagle (Aquila chrysaetos) NMPIF level: Biodiversity Conservation Concern, Level 2 (BC2) NMPIF assessment score: 12 NM stewardship responsibility: Low National PIF status: No special status New Mexico
Golden Eagle (Aquila chrysaetos) NMPIF level: Biodiversity Conservation Concern, Level 2 (BC2) NMPIF assessment score: 12 NM stewardship responsibility: Low National PIF status: No special status New Mexico
State of the Estuary Report 2015
 1 State of the Estuary Report 2015 Summary PROCESSES Feeding Chicks, Brandt s Cormorant Prepared by Nadav Nur Point Blue Conservation Science State of the Estuary 2015: Processes Brandt s Cormorant Reproductive
Tualatin River NWR and Wapato Lake BCS number: 47-37
 Tualatin River NWR and Wapato Lake BCS number: 47-37 ***NOTE: We were unable to determine all necessary information for this site description. If you would like to contribute the needed information to
Abstract. Introduction
 Abstract Wintering northern saw-whet owls in Johnson County, Indiana natural areas Franklin College Biology Department Student: Daniel Morris Advisor: Dr. Ben O Neal Predatory owls play a vital role in
Minnesota Loon Monitoring Program
 Minnesota Loon Monitoring Program Minnesota Department of Natural Resources Nongame Wildlife Program INSTRUCTIONS WELCOME!!! Thank you very much for participating in this year s Minnesota Loon Monitoring
1 Chickadee population trends
 1 Chickadee population trends The Analysis of Black-capped, Boreal, and Mountain Chickadee Population Trends across North America in Correlation with Changing Climate. Shyloh A. van Delft BIOL-225-001
LOCATION OF SHARP-TAILED GROUSE AND GREATER PRAIRIE-CHICKEN DISPLAY GROUNDS IN RELATION TO NPPD AINSWORTH WIND ENERGY FACILITY
 LOCATION OF SHARP-TAILED GROUSE AND GREATER PRAIRIE-CHICKEN DISPLAY GROUNDS IN RELATION TO NPPD AINSWORTH WIND ENERGY FACILITY 2006-2011 NEBRASKA GAME AND PARKS COMMISSION Bill Vodehnal, District Manager,
Golden Eagle (Aquila chrysaetos) Management Indicator Species Assessment Ochoco National Forest
 Management Indicator Species Assessment Ochoco National Forest") Golden Eagle (Aquila chrysaetos) Management Indicator Species Assessment Ochoco National Forest I. Introduction The golden eagle was chosen as a terrestrial management indicator species (MIS) on the Ochoco
Golden Eagle (Aquila chrysaetos) Management Indicator Species Assessment Ochoco National Forest I. Introduction The golden eagle was chosen as a terrestrial management indicator species (MIS) on the Ochoco
Short-eared Owl. Title Short-eared Owl
 Short-eared Owl Title Short-eared Owl 2006-2007 Description and Summary of Results Knowledge of the population size and trends of breeding Short-eared Owls Asio flammeus in Britain is poor and, although
History and status of the Franklin's Gull on Malheur National Wildlife Refuge, Oregon
 Great Basin Naturalist Volume 41 Number 4 Article 9 12-31-1981 History and status of the Franklin's Gull on Malheur National Wildlife Refuge, Oregon Carroll D. Littlefield U.S. Fish and Wildlife Service,
Appendix J Wildlife Recreation and Tourism Considerations
 Appendix J Wildlife Recreation and Tourism Considerations The conservation of Minnesota s wildlife is a long-term comprehensive process of both land and people management that results in enhanced diversity
Sea Duck Joint Venture Annual Project Summary for Endorsed Projects FY08 (October 1, 2007 to September 30, 2008)
") Sea Duck Joint Venture Annual Project Summary for Endorsed Projects FY08 (October 1, 2007 to September 30, 2008) Project Title: SDJV#16, Ducks Unlimited Canada s Common Eider Initiative (year five of a
Sea Duck Joint Venture Annual Project Summary for Endorsed Projects FY08 (October 1, 2007 to September 30, 2008) Project Title: SDJV#16, Ducks Unlimited Canada s Common Eider Initiative (year five of a
The Adirondack Tremolo
 The Adirondack Tremolo 2004 Winter Newsletter Volume 3, Issue 1 Loon Migration Linking People and the Environment Every fall, the most common question asked of the Adirondack Cooperative Loon Program is
Peregrine Falcon Falco peregrinus
 Plant Composition and Density Mosaic Distance to Water Prey Populations Cliff Properties Minimum Patch Size Recommended Patch Size Home Range Photo by Christy Klinger Habitat Use Profile Habitats Used
Oregon Dunes National Recreation Area BCS Number: 47-5
 Oregon Dunes National Recreation Area BCS Number: 47-5 ***NOTE: We were unable to determine all necessary information for this site description. If you would like to contribute the needed information to
Fall Trumpeter Swan Survey of the High Plains Flock
 University of Nebraska - Lincoln DigitalCommons@University of Nebraska - Lincoln US Fish & Wildlife Publications US Fish & Wildlife Service 10-2009 Fall Trumpeter Swan Survey of the High Plains Flock Shilo
Appendix A Little Brown Myotis Species Account
 Appendix 5.4.14A Little Brown Myotis Species Account Section 5 Project Name: Scientific Name: Species Code: Status: Blackwater Myotis lucifugus M_MYLU Yellow-listed species by the British Columbia Conservation
STATUS OF SEABIRDS ON SOUTHEAST FARALLON ISLAND DURING THE 2009 BREEDING SEASON
 STATUS OF SEABIRDS ON SOUTHEAST FARALLON ISLAND DURING THE 29 BREEDING SEASON P.M. Warzybok and R.W. Bradley Marine Ecology Division PRBO Conservation Science 382 Cypress Drive #11 Petaluma, CA, 94954
Icaricia icarioides fenderi Macy, 1931 Fender s Blue (Lycaenidae: Polyommatinae: Polyommatini)
") Black, S. H., and D. M. Vaughan. 2005. Species Profile: Icaricia icarioides fenderi. In Shepherd, M. D., D. M. Vaughan, and S. H. Black (Eds). Red List of Pollinator Insects of North America. CD-ROM Version
Black, S. H., and D. M. Vaughan. 2005. Species Profile: Icaricia icarioides fenderi. In Shepherd, M. D., D. M. Vaughan, and S. H. Black (Eds). Red List of Pollinator Insects of North America. CD-ROM Version
Materials. Time Part 1: One minute class period Part 2: One 30 minute class period Part 3: One minute class period
 Purpose To provide students with information on ruby-throated hummingbirds. To provide students with the opportunity to conduct research on hummingbirds in topic areas that interest them. To provide students
44. MARINE WILDLIFE Introduction Results and Discussion. Marine Wildlife Cook Inlet
 44. MARINE WILDLIFE 44.1 Introduction This study examined the distribution and abundance of marine-oriented wildlife (birds and mammals) during surveys conducted by ABR, Inc. Environmental Research & Services.
Habitat Modeling for Sprague s Pipit in Montana Data and Deductive and Inductive Models for Montana
 Habitat Modeling for Sprague s Pipit in Montana Data and Deductive and Inductive Models for Montana Presentation to USFWS and other Federal and State Agencies April 10 th, 2012 in Helena, Montana Bryce
Appendix D. MIS and Sensitive Plant Species and their Habitat Associations. Houston Longleaf Project Bankhead National Forest
 Appendix D MIS and Sensitive Plant Species and their Habitat Associations Houston Longleaf Project Bankhead National Forest Houston Longleaf Project Management Indicator Species and Major Terrestrial Habitat
HERON AND EGRET MONITORING RESULTS AT WEST MARIN ISLAND: 2003 NESTING SEASON
 HERON AND EGRET MONITORING RESULTS AT WEST MARIN ISLAND: 2003 NESTING SEASON A Report to the San Pablo Bay National Wildlife Refuge John P. Kelly a and Binny Fischer Cypress Grove Research Center, Audubon
Hawk Survey Summary 2007
 Hawk Survey Summary 7 Park Inventory Sites Hawk Surveys were performed in Cascade Valley and Goodyear Heights Metro Parks in conjunction with the comprehensive park inventories. These surveys were conducted
Cordilleran Flycatcher (Empidonax occidentalis)
") Cordilleran Flycatcher (Empidonax occidentalis) NMPIF level: Species Conservation Concern, Level 2 (SC2) NMPIF assessment score: 15 NM stewardship responsibility: High National PIF status: No special status
Cordilleran Flycatcher (Empidonax occidentalis) NMPIF level: Species Conservation Concern, Level 2 (SC2) NMPIF assessment score: 15 NM stewardship responsibility: High National PIF status: No special status
Wildlife Habitat Management on State Forest and Wildlife Lands
 Wildlife Habitat Management on State Forest and Wildlife Lands State Forests are managed within a sustainable forestry framework under an approved management plan. Sustainability includes managing the
EEB 4260 Ornithology. Lecture Notes: Migration
 EEB 4260 Ornithology Lecture Notes: Migration Class Business Reading for this lecture Required. Gill: Chapter 10 (pgs. 273-295) Optional. Proctor and Lynch: pages 266-273 1. Introduction A) EARLY IDEAS
Baskett Slough National Wildlife Refuge BCS number: 47-4
 Baskett Slough National Wildlife Refuge BCS number: 47-4 Site description author(s) Daphne E. Swope, Research and Monitoring Team, Klamath Bird Observatory Primary contact for this site N/A Location (UTM)
Haldimand County Winter Raptor Inventory
 Haldimand County Winter Raptor Inventory Produced For Ontario Barn Owl Recovery Team May 2003 Debbie S. Badzinski Bird Studies Canada / Études D Oiseaux Canada P.O. Box/B.P. 160, 115 Front St., Port Rowan,
Some Relationships Between Fall Hawk Migration and Weather Features at High Park, Toronto
 78 Some Relationships Between Fall Hawk Migration and Weather Features at High Park, Toronto Donald W. Barnett The annual fall migration of diurnal raptors over High Park, Toronto, Ontario has been monitored
B IRD CONSERVATION FOREST BIRD SURVEY ENTERS FINAL WINTER V OLUME 11, NUMBER 1 JANUARY Board of. Trustees. Forest bird survey 1
 B IRD CONSERVATION V OLUME 11, NUMBER 1 JANUARY 2009 INSIDE THIS ISSUE: Forest bird survey 1 Forest bird survey (continued) 2 FOREST BIRD SURVEY ENTERS FINAL WINTER Forest bird paper 3 Populations decrease
WESTERN GREAT LAKES REGION OWL SURVEY
 WESTERN GREAT LAKES REGION OWL SURVEY 2012 Report David A. Grosshuesch Hawk Ridge Bird Observatory Ryan S. Brady Wisconsin Bird Conservation Initiative Prepared for Minnesota Dept. of Natural Resources
The 2016 Bioacoustic Unit Field Season. Overview and Highlights
 The 2016 Bioacoustic Unit Field Season Overview and Highlights discover nature s symphony September 2016 The 2016 Bioacoustic Unit Field Season Table of contents Introduction o4 Wetland monitoring o5
Environment and Natural Resources Trust Fund 2019 Request for Proposals (RFP)
") Environment and Natural Resources Trust Fund 2019 Request for Proposals (RFP) Project Title: Implementing Conservation Plans for Avian Species of Concern Category: H. Proposals seeking 200,000 or less
Environment and Natural Resources Trust Fund 2019 Request for Proposals (RFP) Project Title: Implementing Conservation Plans for Avian Species of Concern Category: H. Proposals seeking 200,000 or less
McKay Creek National Wildlife Refuge BCS number: 48-19
 Oregon Coordinated Aquatic Bird Monitoring: Description of Important Aquatic Bird Site McKay Creek National Wildlife Refuge BCS number: 48-19 Site description author(s) Howard Browers, Supervisory Wildlife
I. Northern Spotted Occupancy and Reproduction Patterns.
 I. Northern Spotted Occupancy and Reproduction Patterns. Mendocino Redwood Company monitors Northern Spotted Owl (NSO) occupancy and reproduction on its property (and up to 1 beyond if necessary) every
Activity 3: Adult Monarch Survey
 Activity 3: Adult Monarch Survey Overview Participants establish an adult monarch survey route within the monitoring plot and count adult monarchs within defined spaces along the route, documenting their
Differential Timing of Spring Migration between Sex and Age Classes of Yellow-rumped Warblers (Setophaga coronata) in Central Alberta,
 in Central Alberta,") Differential Timing of Spring Migration between Sex and Age Classes of Yellow-rumped Warblers (Setophaga coronata) in Central Alberta, 1999-2015 By: Steven Griffeth SPRING BIOLOGIST- BEAVERHILL BIRD OBSERVATORY
Differential Timing of Spring Migration between Sex and Age Classes of Yellow-rumped Warblers (Setophaga coronata) in Central Alberta, 1999-2015 By: Steven Griffeth SPRING BIOLOGIST- BEAVERHILL BIRD OBSERVATORY
Greenlaw Mountain Hawk Watch Fall 2014
 Greenlaw Mountain Hawk Watch Fall 2014 Another season has come to an end. Much was learned, volunteer participation remained strong and several rarities were recorded including two new raptor species.