EFFECTS OF URBANIZATION ON THE DISTRIBUTION AND REPRODUCTIVE PERFORMANCE OF THE AMERICAN OYSTERCATCHER
|
|
|
- Beverly Thornton
- 5 years ago
- Views:
Transcription
1 EFFECTS OF URBANIZATION ON THE DISTRIBUTION AND REPRODUCTIVE PERFORMANCE OF THE AMERICAN OYSTERCATCHER (HAEMATOPUS PALLIATUS PALLIATUS) IN COASTAL NEW JERSEY By THOMAS VIRZI A dissertation submitted to the Graduate School-New Brunswick Rutgers, The State University of New Jersey In partial fulfillment of the requirements for the degree of Doctor of Philosophy Graduate Program in Ecology and Evolution Written under the direction of Julie L. Lockwood And approved by Julie L. Lockwood, Ph.D. David W. Ehrenfeld, Ph.D. Richard G. Lathrop, Jr., Ph.D. David Drake, Ph.D. New Brunswick, New Jersey October 2008
2 ABSTRACT OF THE DISSERTATION Effects of Urbanization on the Distribution and Reproductive Performance of the American Oystercatcher (Haematopus palliatus palliatus) in Coastal New Jersey By THOMAS VIRZI Dissertation Director: Julie L. Lockwood, Ph.D. Urbanization and associated human disturbance can affect American oystercatcher reproductive performance in direct and indirect ways. Nest success rates could be directly affected if human disturbance disrupts normal breeding behavior or leads to increased predation rates. Indirectly, reproductive performance could be reduced if distributional patterns are altered due to coastal development or disturbance on breeding grounds. This dissertation examines the influences that urbanization and human disturbance have on American oystercatcher reproductive rates and distribution in highly urbanized coastal ecosystems in New Jersey. Human-induced effects on oystercatcher daily nest survival rates and overall reproductive performance were analyzed across a mosaic of habitats (Chapter 1). My results showed ii
3 that the principal factor negatively influencing daily survival rates of both clutches and broods was the presence of mammalian predators, not human disturbance. The nest success rate on predator-free islands (21%) was an order of magnitude greater than the rate reported on barrier islands (2%), which have high densities of predatory mammals. Thus, the direct effect of human disturbance on reproductive performance was trumped by the effect of mammalian predators. The effect of urbanization and human disturbance on the local distribution of American oystercatchers was analyzed using species distribution modeling techniques including maximum entropy (MAXENT) modeling and classification and regression tree (CART) modeling. First, the distribution of oystercatchers in response to urbanization was analyzed using MAXENT (Chapter 2). This modeling technique provided a map of predicted habitat suitability that was used to locate oystercatcher populations. The results of validation surveys showed that the New Jersey oystercatcher population utilized alternative breeding habitats in very high concentrations. Next, the habitat suitability model was used as the starting point to develop CART models analyzing the effect of human disturbance on the local distribution on barrier beaches (Chapter 3). These models showed that high levels of human disturbance further influenced local oystercatcher distribution in New Jersey. My dissertation shows that urbanization and associated human disturbance affect the distributional patterns of the American oystercatcher. Thus, these factors indirectly iii
4 affected reproductive performance by leading to the exclusion of oystercatchers from the most highly suitable breeding habitat. iv
5 ACKNOWLEDGEMENTS First and foremost I would like to my advisor Julie Lockwood for all of her help and patience throughout this study. Her eagerness to constantly explore new analysis techniques as they emerge has shaped the way I will study ecology and conservation biology throughout the remainder of my career. I would also like to especially thank David Drake for making this whole process enormously fun and for always pushing me to hang tough regardless of the circumstances. I thank David Ehrenfeld for instilling in me a sense of what conservation biology really means, and for inspiring me to be a better writer. I thank Rick Lathrop for all of his valuable input and for providing use of the resources in the Grant F. Walton Center for Remote Sensing and Spatial Analysis (CRSSA). This study would not have gotten off the ground if not for the generosity of Larry Niles who took me under his wing early on in the project. Jim Merritt from the Sedge Island Natural Resource Education Center was another early inspiration as I began to formulate ideas, and I thank him for his enormous generosity over the years. Todd Pover from Conserve Wildlife and the New Jersey Division of Fish and Wildlife Endangered and Nongame Species Program (ENSP) deserves special mention for teaching me so much about studying beach-nesting birds in the field. I also thank Dave Jenkins, the director of ENSP, who helped considerably in Trenton. Many thanks to Steve Atzert and Vinny v
6 Turner from the Edwin B. Forsythe National Wildlife Refuge, and Diane Bennett-Chase from Island Beach State Park. Field technicians who helped considerably with data collection included Mike Ferguson and Steve Grodsky, who not only provided me with excellent data and ideas, but also with constant laughs. I also owe thanks to Chris Kisiel, Mandy Dey and Kathy Clark from ENSP, and to all of the other ENSP staff who provided field assistance. A special thanks to Jeff Faust for driving the boat and tramping around the back-bays of New Jersey with me each spring over the past two years. I am indebted to all those in the CRSSA lab who helped me along the way including Jim Trimble, John Bognar, Scott Haag, Mike Mills, Inga Parker, Caroline Phillipuk, Zewei Miao and Aaron Love. I am also indebted to all those in the International Wader Study Group who let me bounce ideas off of them including Humphrey Sitters, Bruno Ens, Les Underhill, Allen Baker and John Goss-Custard. I also thank those in the American Oystercatcher Working Group including Ted Simons, Brad Winn, Alex Wilke, Felicia Sanders, Shiloh Shulte and Connor McGowan. Support along the way also came from Roger Locandro, Pete McClean, Howard Height, Roger Cook, and especially Tony and Jackie Raniero. I would like to thank all of the birders out there who have reported oystercatcher band resights to me over the years. Thanks to my mom and dad for all of their support. Special thanks to all my friends including Zeke, Tom, Jim, Jeff and Kelly for helping me relax when I needed it most. vi
7 Financial support came from the Department of Ecology, Evolution, and Natural Resources at Rutgers University, the NJ Division of Fish and Wildlife Endangered and Nongame Species Program and the Edwin B. Forsythe National Wildlife Refuge. The Grant F. Walton Center for Remote Sensing and Spatial Analysis provided all computing resources. Finally, I thank my wife Kristen Faust for always being there both as an extra hand in the field and as a loving companion. vii
8 TABLE OF CONTENTS Title page Abstract of the Dissertation Acknowledgements Table of Contents List of Tables List of Figures ii v viii ix xi Introduction 1 Chapter 1: The Effects of Predator-Free Islands in Sustaining American 11 Oystercatchers within an Urbanized Barrier Island Complex Chapter 2: Predicting American Oystercatcher Distribution in an Urbanized 49 Coastal Ecosystem Using Maximum Entropy Modeling Chapter 3: The Effect of Human Disturbance on the Local Distribution of 89 American Oystercatchers Breeding on Barrier Island Beaches Concluding Remarks 128 Curriculum Vitae 134 viii
9 LIST OF TABLES CHAPTER 1 Table 1: Hypothesized effects of model covariates and interactions on daily Page 37 survival rates of oystercatcher clutches and broods in coastal New Jersey ( ). Table 2: Model selection results for nest-stage models assuming constant and 38 time-varying daily survival probabilities for American oystercatchers in coastal New Jersey ( ). Table 3: Model selection results for clutch survival models for American 39 oystercatchers in coastal New Jersey ( ). Table 4: Model selection results for brood survival models for American 41 oystercatchers in coastal New Jersey ( ). CHAPTER 2 Table 1: Summary of all occurrence records used as training data in our species 77 distribution models and pooled survey data for New Jersey. Training data are all occurrence records identified during 2006 surveys at select study areas. Survey data are all occurrence records identified during 2007 independent surveys at/near ix
10 randomly selected points along the New Jersey coastline (within a 4 km buffer from Atlantic coastline) pooled with 2007 survey data at training areas, which represents the total known oystercatcher population in the state. Table 2: Description of environmental variables used in MAXENT models and a 78 heuristic estimate of the relative contribution of each environmental variable on the projected distribution, as provided by MAXENT output. Table 3: Confusion matrices and error rates derived from presence/absence data 79 collected during 2007 oystercatcher surveys. Matrices based on three methods used to extract MAXENT probability values and two thresholds. CHAPTER 3 Table 1: Description of explanatory variables used in species distribution models 117 for American oystercatcher distribution in coastal New Jersey in Table 2. Variable contributions to species distribution models for American 119 oystercatcher distribution in New Jersey in Numbers in parentheses indicate rank of variable importance in the final model. x
11 LIST OF FIGURES CHAPTER 1 Figure 1: Location of three breeding areas included in our study of Page 45 breeding American oystercatchers: (1) the Southern Natural Area of Island Beach State Park (IB) located in Ocean County, New Jersey (39.77 N, W), (2) the Holgate Division of the Edwin B. Forsythe National Wildlife Refuge (HG) also located in Ocean County (39.50 N, W), and (3) Stone Harbor Point (SH) located in Cape May County (39.03 N, W). The habitat available for breeding oystercatchers at Island Beach (IB) includes 3.3 km of undeveloped barrier beach, a 1.6 km artificial inlet beach along a dike created by the Army Corp of Engineers, approximately 197 hectares of adjacent saltmarsh located within the Sedge Island Marine Conservation Zone, and an 8 hectare artificial dredge-spoil island located within Barnegat Inlet referred to as Gull Island. The habitat available for oystercatchers at Holgate (HG) includes 6.0 km of undeveloped barrier beach, approximately 74 hectares of saltmarsh located directly adjacent to the barrier beach strand, and a 5 hectare naturally-forming inlet island located within Little Egg Inlet known as Tuckers Island. The habitat available for oystercatchers at Stone Harbor (SH) includes 1.8 km of partially developed barrier beach, approximately 23 hectares of saltmarsh located directly adjacent to the barrier beach strand, a 126 hectare nearby saltmarsh island known as Nummy Island, and an 11 hectare naturally-forming inlet island located within Hereford xi
12 Inlet known as Champagne Island. Figure 2: Predicted daily survival rate of American oystercatcher clutches in 46 response to mammal activity and nest position in coastal New Jersey ( ). Daily survival rate was based on the best clutch survival model (Mammal + Gull + Nest Position) setting nest position to either high or low and allowing the mammal index to range from 0.0 to 1.0, which were levels reported for actual nests in our study. We set the gull density index at zero since the effect size for this covariate on DSR was negligible. Figure 3: Predicted daily survival rate of American oystercatcher broods in 47 response to mammal activity and human disturbance in coastal New Jersey ( ). Daily survival rate was based on the best brood survival model (Mammal*Disturb), which included an interaction term between the covariates. In this analysis we allowed the mammal index to range from 0.0 to 1.0 and set the disturbance index (DI) to three levels (0.00, 0.10, 0.20), all of which were towards the lower end of the range reported in our study. Figure 4: American oystercatcher reproductive rates by habitat type in coastal 48 New Jersey ( ). Error bars represent SE calculated using the delta method. Numbers above the error bars represent sample sizes of clutches and broods included in the nest survival models used to calculate reproductive success rates. xii
13 CHAPTER 2 Figure 1: Oystercatcher occurrence records used as training data in our species 84 distribution models. The three high density breeding areas where we conducted intensive surveys in alternative breeding habitat are identified and include: (1) the Southern Natural Area of Island Beach State Park (IB) located in Ocean County, New Jersey (39.77 N, W), (2) the Holgate Division of the Edwin B. Forsythe National Wildlife Refuge (HG) also located in Ocean County (39.50 N, W), and (3) Stone Harbor Point (SH) located in Cape May County (39.03 N, W). The habitat available for breeding oystercatchers at IB includes 3.3 km of undeveloped barrier beach, a 1.6 km artificial inlet beach along an artificial dike, approximately 197 hectares of adjacent saltmarsh, and an 8 hectare artificial dredge-spoil island located in Barnegat Bay. The habitat available for oystercatchers at HG includes 6.0 km of undeveloped barrier beach, approximately 74 hectares of saltmarsh located directly adjacent to the barrier beach strand, and a 5 hectare naturally-forming inlet island located within Little Egg Inlet. The habitat available for oystercatchers at SH includes 1.8 km of partially developed barrier beach, approximately 23 hectares of saltmarsh located directly adjacent to the barrier beach strand, a 126 hectare nearby saltmarsh island, and an 11 hectare naturally-forming inlet island located within Hereford Inlet. Figure 2: Predicted MAXENT distribution displayed using a color ramp of 85 probability values ranging from 0 (blue) 1 (red). Predictive maps were masked xiii
14 by New Jersey county boundaries to show the change in predicted oystercatcher distribution moving from north to south along the Atlantic coastline. Figure 3: Receiver operating characteristic (ROC) curves for training, test and 86 independent validation data used to evaluate the MAXENT distribution model. ROC curves for training and test data provided by MAXENT output. ROC curve for our independent validation dataset calculated using JMP software version 7.0 (SAS Institute, Cary, NC, USA) based on maximum MAXENT probability value and presence/absence data collected within a 110 m buffer around random survey points. Figure 4: Jackknife tests of training gain (gain is related to deviance), test gain 87 and AUC for the MAXENT model. Models run by removing each variable individually do not improve the gain substantially above the overall gain of the MAXENT model based on training data with the exception of distance from inlets, indicating all variables contribute to the distribution to some degree. Models run with each variable in isolation indicate that habitat type has the most useful information by itself. The jackknife of AUC indicates that habitat type, distance from tidal waters, and amount of saltmarsh habitat in close proximity to potential breeding areas (i.e. within 100 m) achieve good amounts of discriminating ability (AUC > 0.75) when looked at in isolation. Other variables that gain importance in the jackknife of AUC include amount of saltmarsh and tidal flats distant from potential breeding areas (i.e. within 1 km) and amount of urbanization within 1 km xiv
15 of breeding areas. Figure 5: New Jersey oystercatcher distribution based on results of 2007 surveys 88 conducted within a 4 km buffer from the Atlantic coastline. Data presented includes all breeding pairs located during independent surveys including those found within a 110 m buffer around random survey points, those found incidentally while traveling between random survey points, and all pairs identified during concurrent censuses at training areas. CHAPTER 3 Figure 1: Classification tree analysis showing probability of oystercatcher 123 presence or absence in response to human disturbance in coastal New Jersey in Splitting variables and their decision values are recorded at each nonterminal node of the tree. The length of each branch is proportional to the variation explained by the variable used at each split. Each terminal node is labeled (classified) according to whether oystercatchers are predominantly present or absent, and includes the proportion and number (in parentheses) of observations in that class. The misclassification rates for training and test data were 9.6% and 15.4%, respectively. Figure 2: Regression tree analysis showing the effect of human disturbance on 124 oystercatcher abundance in coastal New Jersey in Splitting variables and their decision values are recorded at each non-terminal node of the tree. Each xv
16 terminal node is labeled with the mean number of oystercatcher pairs occurring within a 100 m radius surrounding each training data point, SD, and the number of observations at the node (in parentheses). The length of each branch is proportional to the variation explained by the variable used for each split. The tree explained 37.1% of the total sum of squares. Figure 3: Cross-validation plots for (a) the classification tree analysis and (b) the 125 regression tree analysis. Plots report the relative error for a single representative 10-fold cross-validation and include 1-SE estimates for each tree size used in the analyses. The dashed lines indicate the 1-SE cutoff above the minimum error values for each analysis. The bar charts show the relative proportions of trees of each size used in each analysis based on the 1-SE rule (white bars) and minimum error rule (black bars) from a series of 50 cross-validations. The most likely tree size in each analysis (7 nodes) was determined by the modal size (under the 1-SE rule) reported in each series of cross-validations. We chose to use a more parsimonious tree (3 nodes) for our regression analysis since this sized tree was within the 1-SE rule, and since the total relative error rate did not improve much by using the larger tree. Figure 4: Variable response curves based on the final Maxent model for the four 127 most important explanatory variables for American oystercatcher species distribution models in coastal New Jersey in The response curves show the effects of the top four variables on the predicted probability of oystercatcher xvi
17 presence taking into consideration dependencies induced by correlations between variables. The first explanatory variable (RANK) is a categorical variable for the level of human disturbance, with the following parameter values: 0 very low, 1 low, 2 moderate, and 3 high. The second variable (DRIVE05) is also categorical with values of 0 (beach closed to driving during May) or 1 (beach open to driving during May). The third variable (ACCESS) is a continuous variable for the distance to nearest access point in meters. The final variable (HABITAT) is a continuous variable for based on habitat suitability values, with higher values indicating higher suitability. xvii
18 1 INTRODUCTION Oystercatchers (family Haematopodidae) are habitat specialist shorebird species (order Charadriiformes) found along the coasts of every continent except Antarctica. There are 11 recognized species, split between two typical phenotypic forms: the pied forms which are found predominantly on sandy shorelines and the black forms which are found on rocky coasts. The American oystercatcher (Haematopus palliatus) is a pied oystercatcher that is found on sandy shorelines from South America to Nova Scotia along the Atlantic coast of Canada and to California on the Pacific coast of the United States. The species is split into five distinct sub-species: H. palliatus dunfordi in Argentina, H. palliatus pitanay in southwestern South America, H. palliatus frazari in western Mexico, H. palliatus galapagensis in the Galapagos Islands and H. palliatus palliatus, which is widely distributed from northern South America to Canada. The latter sub-species is the subject species of my research (hereafter referred to as the American oystercatcher). My research examines the factors affecting the distribution and reproductive performance of American oystercatchers in coastal New Jersey. The traditional breeding habitat of the American oystercatcher historically was high elevation, sandy, isolated barrier island beach habitat along the coast of the United States (Hughes 1995; Nol 1994; Sibley 2001). Oystercatchers were previously extirpated from more northern parts of their historic breeding range, including New Jersey, as recently as 1900 due to market hunting and loss or alteration of critical breeding habitat. The species began to expand its range north
19 2 during the mid-1900s after hunting stopped (Davis et al. 2001), and the first documented record of oystercatchers breeding in New Jersey occurred on Ham Island in Ocean County in 1948 (Kramer 1948). Over the next several decades, the oystercatcher population in New Jersey increased as the species continued to expand its range northward along the Atlantic coast as it re-colonized parts of its former range. It was during this time that oystercatchers were first observed breeding in habitats other than traditional barrier island beach habitat, and it was hypothesized that this shift into alternative breeding habitat may have facilitated the recent range expansion (Humphrey 1990; Post & Raynor 1964). By the 1960s oystercatchers were regular breeders on barrier island beaches in southern parts of New Jersey, returning first to traditional barrier island habitat (Post & Raynor 1964). The first documented record of an oystercatcher breeding in alternative habitat (saltmarsh) in New Jersey was in 1963 (Frohling 1965). Post and Raynor (1964) hypothesized that by 1962 the New Jersey oystercatcher population (on barrier beaches) may have been near the maximum that the region could support and that this was one of the principal factors leading to the species range expansion northward into the region. The habitat shift into alternative breeding habitat such as saltmarsh, inlet and back-bay islands is not surprising due to anthropogenic changes to coastal ecosystems, which severely reduced the amount of traditional barrier beach habitat available for breeding. The most severe anthropogenic changes to coastal ecosystems in North America occurred between 1900 and 1950, coinciding with the period when oystercatchers began to re-
20 3 colonize former parts of their range. It was during the latter part of this period that coastal development in New Jersey increased dramatically. Prior to World War II, more than 90% of the barrier islands in the United States were still undeveloped (USFWS 2004), and coastal areas in New Jersey remained in a relatively natural state. By 1950, developed barrier island habitat in northeastern states such as New York and New Jersey reached 27% and 37%, respectively, and by 1974 increased an additional 10% in each state leaving little of the historic barrier island breeding habitat once available to beachnesting shorebirds such as the American oystercatcher. The intensive coastal development changed the landscape as roads and bridges were constructed connecting barrier islands to the mainland for the first time. This provided access to many islands that previously acted as refuges for oystercatchers and other beach-nesting avian species. The bridges led to the rapid development of these barrier islands as tourist destinations, and the landscape was quickly and severely altered. Intensive coastal development resulted in the complete loss of some potential breeding grounds on barrier beaches and the degradation of others. The dynamic nature of the barrier islands themselves was altered as beaches and inlets were stabilized with jetties in an attempt to stop the migration of sand (a natural and necessary process in the barrier island system) to protect human development interests. Access to foraging areas was cut off in many places as the shorelines on the back sides of the barrier islands were hardened with bulkheads or other man-made structures. Even where foraging areas remained intact, the historic food source for oystercatchers (American oysters Crassostrea virginica) was almost completely extirpated from our state s waters due to
21 4 over-harvesting and disease. Other bivalves such as ribbed mussels (Geukensia demissa) and blue mussels (Mytilus edulis) remained as alternative prey items, but these require different feeding strategies. Oystercatchers re-colonizing the severely altered coastline began to utilize alternative habitat to breed. Fortunately, oystercatchers show plasticity in their breeding and foraging ecology allowing them to change rapidly with their environment. Although the American oystercatcher was known to breed in alternative habitats prior to the outset of my research in 2004, little was known as to the extent of use of these habitats or the population consequences of this habitat shift. Earlier studies documented the use of alternative habitats by oystercatchers; however, these studies did not explore the factors affecting the distributional change nor did they examine differential reproductive rates between habitat types (Lauro & Burger 1989; Nol 1989). To my knowledge, no extensive study examining the factors affecting the distribution of oystercatchers across a mosaic of habitats in urbanized coastal ecosystems had been conducted before my research. Additionally, until recently, little was known about the factors influencing the nest success of American oystercatchers or the effects of utilizing alternative breeding habitat on overall reproductive performance. Several recent studies examining the factors influencing nest success for American oystercatchers have shown that predation pressure and human disturbance contributed to lower reproductive rates or alteration of breeding behavior (McGowan & Simons 2006; McGowan et al. 2005; Sabine et al. 2006; Sabine et al. 2008). However, few studies have examined differential reproductive rates for oystercatchers between habitat types. McGowan et al. (2005)
22 5 found that reproductive rates varied between barrier beach and riverine island habitats and hypothesized that the latter habitat type may be acting as an ecological trap for oystercatchers. To my knowledge, this is the only study that has examined the effects of alternative habitat use by American oystercatchers to date. Much still needs to be understood about the effects of oystercatchers utilizing alternative habitats throughout the species range taking into consideration the species high annual variation in reproductive performance. While we have begun to gain a better understanding of the breeding ecology of the American oystercatcher, much remains unknown. For example, we still do not have a clear understanding of the breeding distribution of the species. Winter surveys estimate that the population of the American oystercatcher is approximately 10,000 (Brown et al. 2005). However, breeding surveys have only identified approximately 3,000 breeding pairs, just over half of the overall estimated population (American Oystercatcher Working Group, unpublished data). Recent surveys have shown that many oystercatchers may have previously been overlooked in alternative habitats indicating that these areas may be more important than previously thought for the long-term viability of the population (Traut et al. 2006; Wilke et al. 2007). Understanding the current distribution of American oystercatchers across a mosaic of habitats and gaining a better estimate of the breeding population throughout the species range are paramount in our attempts to conserve the species.
23 6 My research is the first attempt to explain the distribution of American oystercatchers in alternative breeding habitats in response to environmental and anthropogenic factors. Further, I provide one of the first studies analyzing the factors influencing oystercatcher reproductive performance in alternative habitats. I apply novel statistical modeling techniques to accomplish my objectives, which were as follows: 1. Evaluate the factors influencing American oystercatcher nest success across a mosaic of habitats 2. Identify the factors affecting American oystercatcher distribution in highly urbanized coastal ecosystems 3. Determine the extent of use of alternative breeding habitat (saltmarsh, inlet or back-bay islands) by American oystercatchers in New Jersey 4. Provide a more accurate estimate of the American oystercatcher breeding population in New Jersey The first objective of my dissertation is examined in Chapter 1: The Effects of Predator- Free Islands in Sustaining American Oystercatchers within an Urbanized Barrier Island Complex. Here, I analyze the factors influencing American oystercatcher nest success in New Jersey. I focus on the differences in nest success rates between alternative habitat types, using a novel modeling approach to distinguish between the effects of habitat choice, predation pressure and human disturbance on daily nest survival rates.
24 7 The last three objectives of my research are examined in Chapter 2: Predicting American Oystercatcher Distribution in an Urbanized Coastal Ecosystem Using Maximum Entropy Modeling and Chapter 3: The Effect of Human Disturbance on the Local Distribution of American Oystercatchers Breeding on Barrier Island Beaches. In Chapter 2, I use a novel species distribution modeling technique to predict the realized niche of American oystercatchers across a mosaic of habitats along the entire New Jersey Atlantic coastline. A maximum entropy modeling technique was used to examine the influence of environmental variables and extent of coastal development on the distribution. The distribution model was then used to predict areas where oystercatchers may be breeding, and these predictions were tested with ground surveys in an effort to locate new oystercatcher populations in previously unsurveyed areas. In Chapter 3, I use the results of the model developed in Chapter 2 as the starting point to conduct further exploration into the effect of human disturbance on the local distribution of American oystercatchers on New Jersey barrier beaches. I used several species distribution modeling techniques including classification and regression trees, random forests and maximum entropy modeling to examine how recreational disturbance on barrier beaches further influences the local distribution. The main chapters of my dissertation were written as a series of stand-alone manuscripts that were formatted specifically for target journals. As such, each chapter is formatted differently. Additionally, the manuscripts were written in the first-person plural to indicate that they were written with my dissertation advisor, Julie L. Lockwood, as co-
25 8 author. The target journals are as follows: Chapter 1 Conservation Biology, Chapter 2 Diversity and Distributions, and Chapter 3 Animal Conservation. LITERATURE CITED Brown, S. C., S. Schulte, B. Harrington, B. Winn, and M. Howe Population size and winter distribution of eastern American oystercatchers. Journal of Wildlife Management 69: Davis, M. B., T. R. Simons, M. J. Groom, J. L. Weaver, and J. R. Cordes The breeding status of the American Oystercatcher on the east coast of North America and breeding success in North Carolina. Waterbirds 24: Frohling, R. C American Oystercatcher and Black Skimmer nesting on salt marsh. The Wilson Bulletin 77(2): Hughes, D. W New Jersey's breeding birds - their history, behavior and distribution Mid-Atlantic Photogrammetric Services 1: , Humphrey, R. C Status and range expansion of the American Oystercatcher on the Atlantic coast. Transactions of the Northeastern Section of the Wildlife Society 47: Kramer, E. Y Oyster-catcher breeding in New Jersey. The Auk:460. Lauro, B., and J. Burger Nest-site selection of American Oystercatchers (Haematopus palliatus) in salt marshes. The Auk 106:
26 9 McGowan, C. P., and T. R. Simons Effects of human recreation on the incubation behavior of American oystercatchers. The Wilson Journal of Ornithology 118: McGowan, C. P., T. R. Simons, W. Golder, and J. Cordes A comparison of American Oystercatcher reproductive success on barrier beach and river island habitats in coastal North Carolina. Waterbirds 28: Nol, E Food supply and reproductive performance of the American Oystercatcher in Virginia. The Condor 93: Nol, E American Oystercatcher (Haematopus palliatus). In: The Birds of North America (A. Poole and F. Gill, Eds.). Academy of Natural Sciences, Philadelphia, PA, and American Ornithologists' Union, Washington, DC: Post, P. W. and G. S. Raynor "Recent range expansion of the American oystercatcher into New York." The Wilson Bulletin 76(4): Sabine, J. B., S. H. Schweitzer, and J. M. Meyers Nest fate and productivity of American Oystercatchers, Cumberland Island National Seashore, Georgia. Waterbirds 29: Sabine, J. B. I., J. M. Meyers, C. T. Moore, and S. H. Schweitzer Effects of human activity on behavior of breeding American oystercatchers, Cumberland Island National Seashore, Georgia, USA. Waterbirds 31: Sibley, D. A The Sibley Guide to Bird Life & Behavior. Alfred A. Knopf, Inc. Traut, A. H., J. M. McCann, and D. F. Brinker Breeding status and distribution of American Oystercatchers in Maryland. Waterbirds 29:
27 10 USFWS Piping Plover (Charadrius melodus), Atlantic Coast Population, Revised Recovery Plan. Page 258. US Fish and Wildlife Service, Hadley, Massachusetts. Wilke, A. L., D. F. Brinker, B. D. Watts, A. H. Traut, R. Boettcher, J. M. McCann, B. R. Truitt, and P. P. Denmon American Oystercatchers in Maryland and Virginia: status and distribution. Waterbirds 30:
28 11 CHAPTER 1 Predator-Free Islands Help Sustain American Oystercatchers within an Urbanized Barrier Island Complex TOM VIRZI * AND JULIE L. LOCKWOOD * * Department of Ecology, Evolution, and Natural Resources, Rutgers University, 14 College Farm Road, New Brunswick, New Jersey 08901, tvirzi@rci.rutgers.edu Abstract: Urbanization on the barrier islands along the Atlantic coast of North America has severely altered the traditional breeding habitat for many beach-nesting birds in this region, including the American oystercatcher. We used an information theoretic approach to analyze various human-induced effects on oystercatcher daily nest survival rates and overall reproductive performance in an urbanizing coastal ecosystem. We used explanatory variables including habitat type, level of human disturbance, presence of mammalian predators, gull density and nest position as nest-specific covariates in our models to explore their effects on the daily survival rates of clutches and broods separately. We found an overall nest success rate of 4% in our study areas, which is far below the level necessary to sustain the local population. The principal factor negatively influencing daily survival rates of both clutches and broods was the presence of mammalian predators. Correspondingly, the nest success rate on predator-free islands (21%) was an order of magnitude greater than the rate reported on barrier islands (2%),
29 12 which have relatively high densities of predatory mammals. These findings show that protecting and managing alternative breeding habitats may be the best way to ensure the long-term population viability of American oystercatchers. This protection strategy may also have spillover benefits for other beach-nesting birds and wading birds. Keywords: American oystercatcher, nest success, predator-free islands, program MARK
30 13 Introduction Beach-nesting birds are in sharp decline worldwide in large part because of increasing loss or alteration of critical breeding habitat, human disturbance of breeding grounds, and mammalian predation pressure (Erwin et al. 2001; Gochfeld 1977; Lowney et al. 2005; Patterson et al. 1991). The beginning of these declines came between , coinciding with the first period of intensive coastal development in North America (Nisbet & Spendelow 1999). Coastal development pressure continues to increase, so much so that coastal counties currently make up 17% of the total land area in North America but account for 53% of the total human population (Crossett et al. 2004). Given such intense development pressure on coastal ecosystems, with all the attendant ecological issues, a legitimate question is whether we can we expect beach-nesting birds to persist without sustained intensive management efforts. American oystercatchers (Haematopus palliatus palliatus) are a prime example of a species facing this dilemma. They are a species of high conservation concern throughout their North American range because of their low population numbers and recently observed rapid range-wide population declines (Davis et al. 2001; Nol et al. 2000). Here we evaluate the breeding success of oystercatchers within a highly urbanized coastal barrier island ecosystem. We show an order of magnitude difference in breeding success across habitat types, with particularly high success on predator-free inlet and back-bay islands. Our results suggest that preserving these natural refuges can add substantially to the viability of oystercatcher populations, as well as other shorebirds, while avoiding costly management actions. Prior to World War II, the coastline of the United States remained in a relatively natural state with more than 90% of barrier island complexes undeveloped and largely
31 14 inaccessible to the public. This situation changed dramatically over the next several decades and perhaps nowhere more pronounced than in the Mid-Atlantic region. In the state of New Jersey, total urbanized coastal barrier acreage reached 37% by 1950 and 47% by the mid-1970s (USFWS 1996). Coastal development in New Jersey has slowed in some areas in recent years, but the condition of coastal habitats has already been altered so severely in many instances that the species utilizing these habitats for breeding have experienced severely reduced reproductive success. Since the population consequences of reproductive failure are postponed in long-lived species with delayed maturity (Hernandez-Matias et al. 2003), a trait shared by many of the beach-nesting species in the order Charadriiformes, North American beach-nesting birds such as the American oystercatcher warrant high conservation concern. Over the last several decades the American oystercatcher has expanded its range north along the Atlantic coast of the United States (Davis et al. 2001; Nol 1994; Post & Raynor 1964), and it was during this time that the species began to utilize non-traditional habitat to breed (e.g. saltmarsh), possibly facilitating the range expansion (Humphrey 1990; Post & Raynor 1964). In Chapter 2, we establish that the New Jersey oystercatcher population utilizes a mosaic of habitats for breeding including barrier beach strands, saltmarsh, natural inlet islands and artificial dredge-spoil islands, many of which are highly disturbed (especially as compared to breeding areas for more southerly populations). The use of alternative breeding habitats from the traditional barrier beach strand habitat historically used by American oystercatchers is becoming more widespread throughout the species range (Lauro & Burger 1989; McGowan et al. 2005; Shields &
32 15 Parnell 1990; Wilke et al. 2007). However, at present there has been little comprehensive study of the effect this habitat shift may be having on population dynamics. Lauro and Burger (1989) examined the nest site selection of oystercatchers breeding in saltmarsh habitat in New Jersey; however, these authors did not examine the differences in nest success between various habitat types. More recently, McGowan et al. (2005) examined the difference in nest success between barrier beach and river island habitats in North Carolina and found that hatching success was significantly greater on river islands; however, fledging success was lower resulting in no significant difference in overall nest success. Gaining a better understanding of the effects of the recent habitat shift on oystercatcher productivity is paramount in developing conservation strategies for the species. Methods Study Areas We collected reproductive data at three study areas located in southern New Jersey with relatively high densities of breeding oystercatchers (Fig. 1). The availability of potential oystercatcher breeding habitat was similar at each site. Potential breeding habitat included barrier beach strands, adjacent saltmarsh systems and nearby inlet or dredgespoil islands. All of the study areas were located on the north side of inlets that were breaks in the barrier island system. Controlling for the availability of alternate breeding habitat for oystercatchers at each study area provided us with replicates for each habitat type.
33 16 The three study areas represented a gradient of human disturbance from low- to high-use areas allowing analysis of the effects of human disturbance on oystercatcher reproductive rates. The Island Beach (IB) study area was the most heavily disturbed site in our study (Fig. 1). The New Jersey Division of Parks and Forestry manages Island Beach, which is the second highest use state park in New Jersey. The Holgate (HG) study area was the least disturbed site in our study (Fig. 1). The United States Fish and Wildlife Service manages Holgate as part of the Edwin B. Forsythe National Wildlife Refuge. Access was restricted during most of the breeding season primarily due to the presence of federally endangered breeding piping plovers (Charadrius melodus). Finally, the Stone Harbor (SH) study site experienced a moderate level of human disturbance (Fig. 1). The New Jersey Division of Fish and Wildlife Endangered and Nongame Species Program (ENSP) manages the beach strand and inlet island habitat at SH, which is important breeding habitat for a number of threatened and endangered beach-nesting birds (e.g. piping plover, black skimmer Rinchops niger, least tern Sternula antillarum). As part of the management plan for this site, ENSP restricted access to large parts of the breeding areas used by beach-nesting birds including American oystercatchers. Nest Searches and Monitoring We searched for oystercatcher nests from 1 April to 31 July during each year of our study ( ). We conducted nest searches by walking line transects following barrier beaches and the perimeters of inlet and dredge-spoil islands. We searched for nests in saltmarsh habitat by boat, following all navigatable shorelines and tidal creeks. We also conducted nest searches by walking line transects spaced 100 m apart in all interior
34 17 saltmarsh areas that were not accessible by boat. We located nests by intensifying searches in areas where we observed breeding behavior by adult oystercatchers. Typically, nests were located during the egg-stage (n = 205); however, we did locate nests during the nestling-stage as well (n = 6). Most nests located during the egg-stage were found prior to clutch completion (n = 147, mean number of eggs when found = 1.9, SD = 0.8). We monitored nests every 3-7 days (mode = 3.0, mean = 5.1, SD = 3.3) until the nest either successfully fledged at least one young or all nest contents were lost to predation or flooding. Clutch failure was determined when nestlings were not observed, or if there were an absence of behavioral cues that would indicate hatching (described below) after the expected hatch date and/or when the entire clutch had disappeared. A clutch was considered to have hatched upon the observation of at least one nestling in or near the nest. We considered a brood as successful when at least one chick fledged, and we considered a nest to have failed when the entire brood was lost. We considered a brood lost when no nestlings were observed or when we observed no behavioral cues over two consecutive nest visits. In these instances we determined the date of failure as the first date that nestlings or behavioral cues were not observed. We determined the cause of failure for clutches based on evidence observed at the nest site, such as signs of flooding or predation, the latter including presence of broken eggshells in nests or animal tracks leading to failed nests. Causes of failure for broods were difficult to identify since nestlings often disappeared from territories without evidence. We used a modeling approach that required accurate determination of transitions between nest stages (see below), thus we intensified nest searches near expected hatch
35 18 dates. We determined transition between these stages by observation of at least one nestling in the nest or by observation of certain behavioral cues by adults indicating that a clutch had hatched. The use of behavioral cues as an indication of hatching was necessary in order to obtain the most accurate estimate of transition date since nestlings could not be located during every nest visit. The behavioral cues included an increased vigilance by adults at nest sites, with adults exhibiting much more aggressive behavior in defense of territories upon approach. The aggressive behavior included a circling flight around observers while calling loudly with a unique, rapid, four-note staccato call that is used by adults predominantly when there is an active brood. We observed a few occasions where this behavior was used when clutches were near their expected hatch dates; however, in most instances this behavior was only observed after nests had hatched. In all cases where we relied on these behavioral cues to indicate transition between the egg- and nestling-stages we later confirmed hatching on subsequent nest visits by the observation of at least one nestling. Factors Influencing Nest Success We measured nest success as the daily survival rate (DSR) following Mayfield (1975). Recent incarnations of Mayfield s estimator allow investigators to evaluate the influence of factors on DSR using information-theoretic algorithms (see below). We included the following explanatory variables (covariates) in our nest survival models: 1. Nest Stage. Daily nest survival rates for precocial birds vary significantly between the incubation and nestling periods. We thus expected daily nest survival rates in our study to vary substantially across nest stages. We assigned
36 19 nests into two groups (egg-stage or nestling-stage) to assess differences between stages, with some nests included in both groups if they persisted past the eggstage. 2. Year. Oystercatchers are known to exhibit high annual variability in nest success (Davis et al. 2001; Nol 1989). Therefore, we included year as a covariate in our models to assess annual differences in oystercatcher nest survival. 3. Habitat. We assigned all nests into one of three habitat categories: beach, marsh or island. Beach nests were those located on major barrier island beach strands. Beach nests were typically placed in open areas with sandy substrate and little vegetation. Marsh nests were those located in Spartina dominated saltmarsh including areas of marsh attached to barrier islands and in some cases small, isolated saltmarsh islands. American oystercatchers typically placed nests in wrack deposits (dead vegetation) within marsh habitat. Island nests were those located on natural inlet islands or artificial dredge-spoil islands. These nests were usually placed in open areas with sandy substrate similar to beach nests; however, they were also placed in dense vegetation (e.g. Phragmites australis) or on wrack deposits on dredge-spoil islands. 4. Gull Density Index. Gulls (Larus spp.) are known to be nest predators for a variety of beach-nesting species, and gull predation is a major cause of nestling mortality for oystercatchers (Hockey 1996). Abundant gull species found at our study sites during summer months included great black-backed gulls (L. marinus), herring gulls (L. argentatus) and laughing gulls (L. atricilla), all of which breed in close proximity to oystercatchers. During our nest monitoring visits, we
37 20 conducted visual circular point counts of all gull species within a 100 m radius of the oystercatcher nest. We recorded the seasonal mean of all point count estimates at each nest and used this mean as an index of gull density for that nest in our models. 5. Mammal Index. Mammalian predation is the leading cause of nest failure for many ground-nesting avian species, including American oystercatchers (Davis et al. 2001; McGowan et al. 2005; Sabine et al. 2006). Mammalian species regularly observed at our study sites included red fox (Vulpes vulpes), striped skunk (Mephitis mephitis) and raccoon (Procyon lotor). In order to assess the effect that mammals have on oystercatcher nest survival, we conducted surveys for mammal tracks or other signs within a 100 m radius of all oystercatcher nests during each periodic nest visit. During each nest visit, a binary code was recorded indicating the presence (1) or absence (0) of mammal tracks or signs on each oystercatcher territory. We used these data to calculate the proportion of visits over the course of the monitoring period that we recorded mammal activity at each territory. 6. Disturbance Index. The effects of human disturbance on oystercatcher nest survival is unknown; however, McGowan et al. (2006) provided evidence that human disturbance can alter oystercatcher incubation behavior. It is probable that high rates of human activity on breeding grounds can disrupt oystercatcher incubation behavior leading to lower nest survival rates through inducing inappropriate incubation temperatures or increased nest predation due to exposure of nests during forced departures. In order to assess the effect of human
38 21 disturbance on oystercatcher nest survival, we assigned an index for human activity to each nest. During each nest visit, a binary code was recorded indicating the presence (1) or absence (0) of human activity within a 100 m radius surrounding each oystercatcher nest. We used these data to calculate the proportion of visits over the course of the monitoring period that we recorded human activity on or near each territory. 7. Nest Position. The position of oystercatcher nests near the tide line makes them particularly susceptible to flooding (Lauro & Burger 1989; Nol 1989). Therefore, we expected that the position of the nest above mean sea level would influence nest survival. We assigned each nest one of three rankings: (1) low, (2) medium and (3) high. Low nests were those located in areas that we considered susceptible to flooding caused by monthly spring tides. Medium-height nests were those nests located in areas that we expected to be safe from flooding caused by monthly spring tides, but susceptible to flooding from storm tides. High nests were those nests located in areas that we expected to be safe from flooding from all but the most severe storm tides. Data Analysis We estimated daily survival rates of oystercatcher nests using the nest survival model (Dinsmore et al. 2002) in program MARK (White & Burnham 1999). This software uses generalized linear models within a maximum likelihood approach to estimate DSR (Rotella et al. 2004). We used a hierarchical approach to generate a candidate set of a priori models for use in our analyses, similar to other recent studies using program
39 22 MARK (Colwell et al. 2007; Hood & Dinsmore 2007). We began our analyses by examining the effect of nest stage on DSR by coding our data into two groups and running models comparing constant and time-varying DSR with and without a group (stage) effect, excluding any additional nest-specific covariates. As expected, we found large differences in DSR between the two stages (egg and nestling, see below). Thus, we generated a set of a priori models examining the effects of various explanatory variables (covariates) on oystercatcher DSR during the egg- and nestling-stages separately. All generalized linear models that incorporated one or more covariates used the logit link function and all other models used the sin link function (Burnham & Anderson 2002). We ranked competing models that describe the relationship between DSR and explanatory variables using Akaike s Information Criterion (AIC c ) corrected for small sample size (Burnham & Anderson 2002). We judged models with AIC c values < 2.00 as having substantial support, AIC c values from having considerably less support, and AIC c values > 7.00 indicating essentially no support (Burnham & Anderson 2002). The effect of each explanatory variable on nest survival is represented by the beta (β) estimate for each covariate provided by program MARK. Strong effects were inferred by beta estimates with good achieved confidence interval coverage that did not cross zero (Burnham & Anderson 2002). Due to high predation rates at our study areas, it was difficult to accurately determine whether nests were in the egg-laying or incubation stages. As such, for purposes of our nest survival modeling, we combined all nests with eggs, regardless of timing within the egg-stage, into our clutch survival models. Additionally, since
40 23 individual nestlings were difficult to observe during each nest visit, we decided to model brood survival rather than individual nestling survival. We were able to accurately determine the fate of broods based on direct observation of nestlings or behavioral cues, as described previously. In such cases, it is more appropriate to model brood survival than individual nestling survival rates (Colwell et al. 2007). Within our stage-specific models, we generated separate sets of a priori candidate models that described competing hypotheses (Table 1). We developed a set of 19 a priori models explaining DSR of clutches and 19 a priori models explaining brood survival. We used a similar set of models at each stage in order to understand the factors that influence DSR during each stage of the nesting cycle for American oystercatchers since these factors may or may not be similar. We hypothesized that oystercatcher nest survival would vary between habitat type and year, and that clutch survival would be affected by nest position (see above, Nol 1989). We also hypothesized that predator activity would lead to reduced survival rates at both nest stages; however, we expected there to be different effects at each stage depending on type of predator. We included models that incorporated an interaction between predator activity and human disturbance since it is possible that human activity on breeding grounds could influence predation rates positively or negatively. In our brood survival models, we included an interaction term between our habitat and predator covariates since there may be differential nestling predation rates in habitats with different vegetation characteristics. In order to illustrate the effects of various covariates on overall oystercatcher nest success, we used the DSR of clutches and broods to extrapolate hatching and fledging
41 24 success rates, respectively (Johnson 1979). We raised the DSR estimate based on the best approximating model for each stage to a power indicating the total number of exposure days of each stage (hatching = 28 days; fledging = 42 days). Overall nest success was calculated by multiplying hatching and fledging success rates (Johnson 1979). Standard errors for hatching and fledging success rates were calculated by multiplying the standard error reported by program MARK for each stage-specific DSR estimate by the derivative of the DSR estimate (Powell 2007). The standard error for nest success was calculated using the delta method (Powell 2007; Seber 1982). Results Nest Success We monitored 205 American oystercatcher nests with eggs and 61 broods during the 2005 and 2006 breeding seasons, with reasonably large numbers of nests distributed across all habitats. Based on the best models for clutch and brood survival, the overall nest success rate for New Jersey oystercatchers was extremely low at (SE = 0.002). Contrary to expectations that the optimal breeding habitat for American oystercatchers should be barrier beach habitat, oystercatchers in New Jersey experienced their lowest reproductive rates in this habitat. Hatching success was lowest on barrier beaches at (SE = 0.001) and highest on isolated islands at 0.37 (SE = 0.03) where there was an almost complete absence of mammalian predators (Fig. 4). The hatching success rate for marsh breeding oystercatchers was 0.20 (SE = 0.01), which is a habitat where nests are also exposed to mammalian predators. Fledging success was also lowest on barrier beaches at 0.33 (SE = 0.04) and highest on isolated islands at 0.55 (SE = 0.05); however,
42 25 marsh breeders experienced a similar fledging success rate as nests on isolated islands at 0.52 (SE = 0.08). The differential hatching and fledging success rates across habitat types resulted in substantially higher overall productivity (nest success) for island breeding oystercatchers in New Jersey. In fact, nest success for island nesting oystercatchers was 0.21 (SE = 0.03), which is almost twice that of marsh nesting pairs (0.11, SE = 0.01) and an order of magnitude greater than barrier beach nesting pairs (0.019, SE = 0.001). Stage Models In our initial MARK analysis of the effect of nest stage and time on DSR, we found that the model that included only nest stage received all of the support in this analysis (Table 2; normalized Akaike weight (w, ) of 1.0). The strong difference in DSR between stages was further highlighted by the very high AIC c between the best-supported model and the next model (i.e. the constant survival model that excludes stage) of Timevarying survival models received no support in this initial analysis. American oystercatcher clutches had substantially lower DSR than broods (DSR clutches = 0.94, SE = 0.01; DSR broods = 0.983, SE = 0.003). These results confirm our expectation that breaking our dataset into two discrete groups for all further analyses was warranted as this allowed us to examine the effects of nest-specific covariates on survival during each stage separately. Additionally, all further analyses assumed constant nest survival rates since time-varying models received no support in our initial analysis. Clutch Survival
43 26 Our clutch survival models indicated that an additive model including covariates for gull density, mammal activity and nest position was the best supported (w, = 0.80; AIC c difference of 3.00). This model received substantially all of the support in our analysis (Table 3). The DSR of oystercatcher clutches based on the best-supported model was 0.93 (SE = 0.01). The negative effect of mammals on clutch survival was substantial ( = -2.51, 95% CI = -3.28, -1.75), whereas nest position had a positive effect on clutch survival ( = 0.56, 95% CI = 0.28, 0.84). Gull density also had a positive effect on clutch survival; however, the effect size was very small ( = 0.007, 95% CI = 0.002, 0.012). One of the benefits of using program MARK to model nest survival is that it provides a method to predict DSR based on the best-supported model (Dinsmore & Dinsmore 2007). For illustrative purposes, we examined the effect of different levels of mammal activity on the survival of oystercatcher nests that were susceptible to flooding (low position category) versus those that were not (high position category; Fig. 2). Our predictive analysis illustrates the large difference in DSR between nests likely to flood (low nests) versus those that were not (high nests), and more importantly, the substantial decline in DSR as the level of mammal activity increased within oystercatcher territories regardless of nest position (Fig. 2). Brood Survival The model that included an interaction between mammal activity and human disturbance received substantially all of the support in this analysis (w i = 0.75, AIC c difference of 3.47, Table 4). The DSR of oystercatcher broods based on the best-supported model was 0.97 (SE = 0.02). As with our clutch survival models, our brood survival models
44 27 indicated a substantial negative effect of mammals on DSR during this stage ( = , 95% CI = , -6.37). The best model indicated that human disturbance also negatively effects brood survival; however, the confidence interval for this parameter crosses zero ( = -1.01, 95% CI = -4.63, 2.61). The interaction term between mammal activity and human disturbance indicated a substantial positive effect on brood survival; however, the confidence interval coverage for this parameter was very wide ( = , 95% CI = 1.42, ). The poor confidence interval coverage of the human disturbance covariate and interaction terms indicates lower resolution in our brood survival models as compared to our clutch survival models. To illustrate the effect of mammal presence and human disturbance on oystercatcher brood survival we predicted brood DSR in response to varying levels of these covariates (Fig. 3). Mammal activity negatively affects brood survival, but there was an indication that human activity moderated the ill effects of mammals leading to reduced predation on nestlings (Fig. 3). Discussion Breeding success for American oystercatchers in New Jersey was low, especially compared to more southerly breeding areas outside of New Jersey. Oystercatcher nests were much more likely to fail at the egg-stage rather than the nestling-stage. As such, the low nest success rates reported were driven primarily by the extremely low hatching success rates, which ranged from 6% on barrier beaches to 37% on isolated islands. These rates were well below hatching success rates recently reported further south along the Atlantic coast. For example McGowan et al. (2005) and Sabine et al. (2006) reported
45 28 hatching success rates as high as 45% in North Carolina and Georgia respectively. Most alarming was the extremely low nest success rate we found for oystercatchers breeding on New Jersey barrier beach strands (2%), which was substantially below the success rates reported on barrier islands in more southern parts of the oystercatcher s range (11 14%) (Davis et al. 2001; McGowan et al. 2005; Nol 1989). Based on population viability analyses for North Carolina oystercatchers, Brown et al. (2008) show that nest success must be above 18% just for the population to remain stable over the next 10 years. The reproductive rates we reported for New Jersey oystercatcher s breeding along barrier beach strands, which is the preferred habitat for the species, are thus very far below what might be considered sustainable. We did observe a very large difference in nest success rates between habitats, and this may provide a potential avenue for conserving this species over the long-term. In particular, the survival rates we calculated translated into a 21% chance that a given oystercatcher egg laid will result in an independent juvenile on inlet or dredge-spoil islands. This rate was an order of magnitude higher than what we observed on barrier beach strands. The differential success rate between habitats was most pronounced during the egg-stage, where hatching success ranged from 6% on beach strands to 37% on isolated islands. The same pattern held for fledging success, where rates ranged from 33% on beach strands to 55% on isolated islands. The single factor that consistently showed a large effect on success, and best explained our observed differences between habitats, was mammalian predation. Indeed, the importance of islands as a refuge from mammalian predation was magnified as oystercatcher nests matured. The effect size for mammalian predation was seven times larger in the nestling-stage than the egg-stage.
46 29 This trend is true despite the fact that most nesting attempts in areas with high mammal density failed during the egg-stage prior to hatching, and thus nestling-stage models included few nests from high mammal density areas such as barrier beach strands. The heavy influence of mammalian predators on American oystercatcher nest success is not surprising since mammalian predation has been linked to low reproductive success for oystercatcher species throughout the world (Davis et al. 2001; Gill et al. 2004; Hockey 1996). More generally, mammalian predators are associated with reduced reproductive rates, population declines and the extinction of many avian species on oceanic islands due to a lack of defenses in island birds that evolved without the threat of terrestrial predators (Atkinson 1996; Blackburn et al. 2004; Blackburn et al. 2005). Although perhaps not as isolated from continental influences as many oceanic islands, the barrier islands off the Atlantic coast of eastern North America formerly functioned as refuges from mainland populations of mammalian predators for many of the region s threatened and endangered shorebird species. Predator movements from the mainland to islands and between islands do occur (Dueser et al. 2005). However, historic population levels of mammalian predators on barrier islands were likely lower than current levels due to the harsh conditions on these coastal islands and because of barriers to immigration that existed before automobile bridges were built connecting many of the barrier islands to the mainland (Patterson et al. 1991). In addition, important native mammalian nest predators have undergone recent range expansions as a result of coastal development and associated anthropogenic food subsidies (Burger & Lesser 1980). Food subsidies provided by human garbage are often associated with increased predator abundances due to the better physical condition of
47 30 individuals in the population, decreased mortality rates (especially winter mortality), increased reproductive rates, and higher annual recruitment into predator populations (Burger & Lesser 1980; Patterson et al. 1991). Human food subsidies may not only help sustain higher predator populations on barrier islands; subsidies on the extensively developed mainland may help ensure a constant source of migrants onto the barrier islands. In response to the loss or deterioration of barrier island habitat due to coastal urbanization and heavy predation pressure, many beach-nesting species including the American oystercatcher have already begun to use alternative breeding habitat such as saltmarsh, riverine, inlet or back-bay islands. These small islands are often more isolated than barrier islands and thus often do not have persistent populations of mammalian predators. Our results suggest that the importance of these alternative islands for beachnesting birds cannot be understated. Our results are consistent with other studies (McGowan et al. 2005) showing that American oystercatcher nest densities and success are higher on isolated islands than adjacent barrier islands. The creation of predator-free islands in coastal Virginia as a result of extensive predator removal efforts has led to increased productivity for piping plovers and American oystercatchers, and breeding population increases for a number of other threatened or endangered birds (Dueser et al. 2005). The complete removal of raccoons and red foxes on several islands resulted in significantly improved productivity for a suite of avian species. Similar results were found for oystercatchers breeding in North Carolina following red fox control (McGowan 2004).
48 31 If beach-nesting birds are already selecting smaller, isolated islands as replacements for large barrier islands for breeding, the protection of these islands becomes central to conservation management. Predators can be controlled more easily on smaller islands (Dueser et al. 2005; Parkes & Murphy 2003). In fact, complete removal of mammalian predators is possible on small islands whereas it may be impractical on large barrier islands. As such, the long-term monetary and labor costs of predator control efforts would be substantially lower than similar efforts on larger barrier islands. Additionally, it is likely that conservation managers would meet with less public opposition to predator removal programs on isolated islands that are separated from residential areas rather than targeting efforts on barrier beaches that are highly desirable recreational sites. Given the importance of isolated islands for breeding shorebirds in eastern North America, a viable management option over the long-term is to secure more isolated natural islands or create more artificial dredge-spoil islands. Furthermore, existing islands could be managed to create optimal breeding habitat for a suite of beach-nesting species (e.g. remove vegetation or increase island height). The protection of many isolated islands of various types would benefit beach-nesting birds by allowing more colonies to become established thus reducing overcrowding at existing colonies, reducing competition with other species such as gulls, and spreading the risks associated with stochastic events over more sites. Additionally, having many isolated islands would make alternative sites available in the event that mammalian predators colonize an existing breeding site.
49 32 Acknowledgements We would like to thank David Drake, David Ehrenfeld and Todd Pover for all of their valuable input into this study. We also thank Rick Lathrop for all of his input and for providing use of the resources in the Grant F. Walton Center for Remote Sensing and Spatial Analysis. We thank Jim Merritt for use of the facilities at the Sedge Island Natural Resource Education Center during the course of fieldwork. This study would not have gotten off the ground if not for the generosity of Larry Niles. Financial support came from the NJ Division of Fish and Wildlife Endangered and Nongame Species Program and the Edwin B. Forsythe National Wildlife Refuge. Field technicians who helped considerably with data collection include Steve Grodsky and Mike Ferguson. Finally, I thank my wife Kristen Faust for always being there both as an extra hand in the field and as a loving companion.
50 33 Literature Cited Atkinson, I. A. E Introductions of wildlife as a cause of species extinctions. Wildlife Biology 2: Blackburn, T. M., P. Cassey, R. P. Duncan, K. L. Evans, and K. J. Gaston Avian extinction and mammalian introductions on oceanic islands. Science 305: Blackburn, T. M., O. L. Petchey, P. Cassey, and K. J. Gaston Functional diversity of mammalian predators and extinction in island birds. Ecology 86: Brown, S., T. Simons, S. Schulte, F. Sanders, B. Winn, B. Truitt, A. Wilke, S. Johnston, S. Melvin, and t. A. O. W. Group A business plan for conservation of the American oystercatcher: a ten-year plan to secure a keystone coastal species. Burger, J., and F. Lesser Nest site selection in an expanding population of Herring Gulls. Journal of Field Ornithology 51: Burnham, K. P., and D. R. Anderson Model selection and multi-model inference: a practical information-theoretic approach. Springer-Verlag, New York, NY. Colwell, M. A., S. J. Hurley, J. N. Hall, and S. J. Dinsmore Age-related survival and behavior of Snowy Plover chicks. The Condor 109: Colwell, M. A., C. B. Millett, J. J. Meyer, J. N. Hall, S. J. Hurley, S. E. McAllister, A. N. Transou, and R. R. LeValley Snowy Plover reproductive success in beach and river habitats. Journal of Field Ornithology 76: Crossett, K. M., T. J. Culliton, P. C. Wiley, and T. R. Goodspeed Population trends along the coastal United States: Page 54. Coastal Trends Report Series. National Oceanic and Atmospheric Administration. Davis, M. B., T. R. Simons, M. J. Groom, J. L. Weaver, and J. R. Cordes The breeding status of the American Oystercatcher on the east coast of North America and breeding success in North Carolina. Waterbirds 24: Dinsmore, S. J., and J. J. Dinsmore Modeling avian nest survival in program MARK. Pages in S. L. Jones, and G. R. Geupel, editors. Beyond Mayfield: measurements of nest-survival data. Cooper Ornithological Society, Camarillo, CA.
51 34 Dinsmore, S. J., G. C. White, and F. L. Knopf Advanced Techniques for Modeling Avian Nest Survival. Ecology 83: Dueser, R. D., N. D. Moncrief, and J. D. Martin Science-Based Conservation Management on the Virginia Barrier Islands: Avian Habitat Restoration Through Predation Management. Page 30. Utah State University and Virginia Museum of Natural History. Erwin, R. M., B. R. Truitt, and J. E. Jimenez Ground-nesting waterbirds and mammalian carnivores in the Virginia barrier island region: running out of options. Journal of Coastal Research 17: Gill, V. A., S. A. Hatch, and R. B. Lanctot Colonization, population growth, and nesting success of black oystercatchers following a seismic uplift. The Condor 106: Gochfeld, M Colony and nest site selection in Black Skimmers. Pages Proceedings of the Colonial Waterbird Group. Hernandez-Matias, A., L. Jover, and X. Ruiz Predation on Common Tern eggs in relation to sub-colony size, nest aggregation and breeding synchrony. Waterbirds 26: Hockey, P. A. R Haematopus Ostralegus in Perspective: Comparisons with Other Oystercatchers. Pages in J. D. Goss-Custard, editor. The Oystercatcher: From Individuals to Populations. Oxford University Press, Oxford. Hood, S. L., and S. J. Dinsmore The influence of habitat on nest survival of Snowy and Wilson's plovers in the lower Laguna Madre region of Texas. Pages in S. L. Jones, and G. R. Geupel, editors. Beyond Mayfield: measurements of nest-survival data. Cooper Ornithological Society, Camarillo, CA. Humphrey, R. C Status and range expansion of the American Oystercatcher on the Atlantic coast. Transactions of the Northeastern Section of the Wildlife Society 47: Johnson, D. H Estimating Nest Success: The Mayfield Method and an Alternative. The Auk 96:
52 35 Johnson, D. H Methods of estimating nest success: an historical tour. Pages 1-12 in S. L. Jones, and G. R. Geupel, editors. Beyond Mayfield: measurements of nest-survival data. Cooper Ornithological Society, Camarillo, CA. Lauro, B., and J. Burger Nest-site selection of American Oystercatchers (Haematopus palliatus) in salt marshes. The Auk 106: Lowney, M., J. Cromwell, W. Servoss, and D. Reinhold Final Environmental Assessment for the Management of Predation Losses to Native Bird Populations on the Barrier and Chesapeake Bay Islands and Coastal Areas of the Commonwealth of Virginia. Page 134. United States Department of Agriculture Animal and Plant Health Inspection Service Wildlife Services, Moseley, VA. Mayfield, H. F Suggestions for Calculating Nest Success. The Wilson Bulletin 87: McGowan, C. P Factors affecting nesting success of American oystercatchers (Haematopus palliatus) in North Carolina. North Carolina State University, Raleigh. McGowan, C. P., T. R. Simons, W. Golder, and J. Cordes A comparison of American Oystercatcher reproductive success on barrier beach and river island habitats in coastal North Carolina. Waterbirds 28: Nisbet, I. C. T., and J. A. Spendelow Contribution of research to management and recovery of the Roseate Tern: Review of a twelve-year project. Waterbirds 22: Nol, E Food supply and reproductive performance of the American Oystercatcher in Virginia. The Condor 93: Nol, E American Oystercatcher (Haematopus palliatus). Pages Birds of North America. Nol, E., B. R. Truitt, D. Allen, B. Winn, and T. M. Murphy A survey of wintering American Oystercatchers from Georgia to Virginia, U.S.A International Wader Study Group Bulletin 93: Parkes, J., and E. Murphy Management of introduced mammals in New Zealand. New Zealand Journal of Ecology 30:
53 36 Patterson, M. E., J. D. Fraser, and J. W. Roggenbuck Factors affecting piping plover productivity on Assateague Island. Journal of Wildlife Management 55: Post, P. W., and G. S. Raynor Recent range expansion of the American oystercatcher into New York. The Wilson Bulletin 76: Powell, L. A Approximating variance of demographic parameters using the delta method: a reference for avian biologists. Condor 109: Rotella, J. J., D. S.J., and T. L. Shaffer Modeling nest-survival data: a comparison of recently developed methods that can be implemented in MARK and SAS. Animal Biodiversity and Conservation 27: Sabine, J. B., S. H. Schweitzer, and J. M. Meyers Nest fate and productivity of American Oystercatchers, Cumberland Island National Seashore, Georgia. Waterbirds 29: Seber, G. A. F The estimation of animal abundance and related parameters. Chapman, London and Macmillan, New York. Shields, M. A., and J. F. Parnell Marsh nesting by American Oystercatchers in North Carolina. Journal of Field Ornithology 61: USFWS Piping Plover (Charadrius melodus), Atlantic Coast Population, Revised Recovery Plan. Page 258. US Fish and Wildlife Service, Hadley, Massachusetts. White, G. C., and K. P. Burnham Program MARK: survival estimation from populations of marked animals. Bird Study 46: Wilke, A. L., D. F. Brinker, B. D. Watts, A. H. Traut, R. Boettcher, J. M. McCann, B. R. Truitt, and P. P. Denmon American Oystercatchers in Maryland and Virginia: status and distribution. Waterbirds 30:
54 37 Tables Table 1: Hypothesized effects of model covariates and interactions on daily survival rates of oystercatcher clutches and broods in coastal New Jersey ( ). Covariate/Interaction Clutch Survival Brood Survival Year Habitat type Avian predators (gulls) Mammalian predators Human disturbance Nest position Interaction between predator levels and human disturbance Interaction between predator levels and habitat type Interaction between year and habitat type High variation in survival rate between years Higher survival rate on barrier beaches than in alternate habitats High level reduces survival rate to lesser degree Mammal presence reduces survival rate substantially High level reduces survival rate substantially Lower nests have reduced survival rates May increase survival rate Not included in model set Interaction due to variation in annual flooding Same hypothesis Same hypothesis High level reduces survival rate substantially Mammal presence reduces survival rate to lesser degree Same hypothesis Not included in model set Same hypothesis Reduced survival rate in marsh habitat Same hypothesis
55 38 Table 2: Model selection results for nest-stage models assuming constant and timevarying daily survival probabilities for American oystercatchers in coastal New Jersey ( ). Model a AIC c b AIC c w i c K d Deviance DSR constant + Stage DSR constant DSR time DSR time + Stage a Models ranked by AIC c in ascending order. Additive models indicated by +. b Akaike s information criteria adjusted for small sample size. c AIC model weight. d Number of parameters.
56 39 Table 3: Model selection results for clutch survival models for American oystercatchers in coastal New Jersey ( ). Model a AIC c b AIC c w i c K d Deviance Gull + Mammal + Nest Position Year + Habitat + Gull + Mammal + Disturb + Nest Position Mammal + Nest Position Year*Habitat Gull + Mammal Gull*Disturb + Mammal*Disturb Gull + Mammal + Disturb Mammal*Disturb Mammal Mammal + Disturb Year + Habitat Habitat Gull Gull + Disturb Gull + Nest Position Gull*Disturb Nest Position DSR constant
57 40 Year Disturb a Models ranked by AIC c in ascending order. Additive models indicated by +, models with interaction terms indicated by *. b Akaike s information criteria adjusted for small sample size. c AIC model weight. d Number of parameters.
58 41 Table 4: Model selection results for brood survival models for American oystercatchers in coastal New Jersey ( ). Model a AIC c b AIC c w i c K d Deviance Mammal*Disturb Gull*Disturb + Mammal*Disturb Habitat*Gull Year*Habitat Year DSR constant Mammal Disturb Gull Habitat Habitat + Gull Year + Habitat Habitat + Mammal Mammal + Disturb Gull + Mammal Gull + Disturb Gull + Mammal + Disturb Gull*Disturb Habitat*Mammal
59 42 Year + Habitat + Gull + Mammal + Disturb a Models ranked by AIC c in ascending order. Additive models indicated by +, models with interaction terms indicated by *. b Akaike s information criteria adjusted for small sample size. c AIC model weight. d Number of parameters.
60 43 Figure Legends Figure 1: Location of three breeding areas included in our study of breeding American oystercatchers: (1) the Southern Natural Area of Island Beach State Park (IB) located in Ocean County, New Jersey (39.77 N, W), (2) the Holgate Division of the Edwin B. Forsythe National Wildlife Refuge (HG) also located in Ocean County (39.50 N, W), and (3) Stone Harbor Point (SH) located in Cape May County (39.03 N, W). The habitat available for breeding oystercatchers at Island Beach (IB) includes 3.3 km of undeveloped barrier beach, a 1.6 km artificial inlet beach along a dike created by the Army Corp of Engineers, approximately 197 hectares of adjacent saltmarsh located within the Sedge Island Marine Conservation Zone, and an 8 hectare artificial dredge-spoil island located within Barnegat Inlet referred to as Gull Island. The habitat available for oystercatchers at Holgate (HG) includes 6.0 km of undeveloped barrier beach, approximately 74 hectares of saltmarsh located directly adjacent to the barrier beach strand, and a 5 hectare naturally-forming inlet island located within Little Egg Inlet known as Tuckers Island. The habitat available for oystercatchers at Stone Harbor (SH) includes 1.8 km of partially developed barrier beach, approximately 23 hectares of saltmarsh located directly adjacent to the barrier beach strand, a 126 hectare nearby saltmarsh island known as Nummy Island, and an 11 hectare naturally-forming inlet island located within Hereford Inlet known as Champagne Island. Figure 2: Predicted daily survival rate of American oystercatcher clutches in response to mammal activity and nest position in coastal New Jersey ( ). Daily survival
61 44 rate was based on the best clutch survival model (Mammal + Gull + Nest Position) setting nest position to either high or low and allowing the mammal index to range from 0.0 to 1.0, which were levels reported for actual nests in our study. We set the gull density index at zero since the effect size for this covariate on DSR was negligible. Figure 3: Predicted daily survival rate of American oystercatcher broods in response to mammal activity and human disturbance in coastal New Jersey ( ). Daily survival rate was based on the best brood survival model (Mammal*Disturb), which included an interaction term between the covariates. In this analysis we allowed the mammal index to range from 0.0 to 1.0 and set the disturbance index (DI) to three levels (0.00, 0.10, 0.20), all of which were towards the lower end of the range reported in our study. Figure 4: American oystercatcher reproductive rates by habitat type in coastal New Jersey ( ). Error bars represent SE calculated using the delta method. Numbers above the error bars represent sample sizes of clutches and broods included in the nest survival models used to calculate reproductive success rates.
62 45 Figures Figure 1
63 46 Figure Daily Survival Rate High Nests Low Nests Mammal Index
64 47 Figure 3 Daily Survival Rate Disturbance Index (DI) DI=0.00 DI=0.10 DI= Mammal Index
65 48 Figure 4 Reproductive Rate Hatch Success Fledge Success Nest Success Beach Marsh Island
66 49 CHAPTER 2 Predicting American Oystercatcher Distribution in an Urbanized Coastal Ecosystem Using Maximum Entropy Modeling TOM VIRZI *, JULIE L. LOCKWOOD * AND RICHARD G. LATHROP, JR. ** * Department of Ecology, Evolution, and Natural Resources, Rutgers University, 14 College Farm Road, New Brunswick, NJ 08901, tvirzi@rci.rutgers.edu ** Grant F. Walton Center for Remote Sensing and Spatial Analysis, Department of Ecology, Evolution, and Natural Resources, Rutgers University, 14 College Farm Road, New Brunswick, NJ ABSTRACT Species distribution modeling has seen widespread use in ecology and conservation over the past two decades, and as a result many questions regarding the predictive capabilities of new techniques have been raised. One modeling approach that has gained popularity is the MAXENT software, which uses presence-only data to model species distributions. Although MAXENT is ordinarily used to model a species fundamental niche at large scales (e.g. continental-scale), we have used this technique to model the realized niche and local distribution of the American oystercatcher (Haematopus palliatus palliatus) at a
67 50 fine-scale. We examined the transferability of our predictive model to areas outside the training areas in an effort to locate new populations in previously unsurveyed areas. We then evaluated model performance with an independent validation dataset, which is rare in species distribution modeling. Our results showed that the MAXENT model provided predictions that were useful to locate new populations. Ground surveys based on our model located 185 previously unknown breeding pairs of oystercatchers in coastal New Jersey, which more than doubled the estimate of the local breeding population. However, validation of the MAXENT model with independent data provided by our ground surveys proved difficult. We attributed this to source-sink dynamics that affected the actual distribution of oystercatchers at a local scale rather than to errors in our modeling technique. We suggest that future researchers attempting to validate species distribution models with ground surveys take into consideration metapopulation and source-sink theory in the design of surveys and interpretation of results. Keywords American oystercatcher, MAXENT, maximum entropy modeling, model validation, realized niche, source-sink theory, species distribution modeling
68 51 (A) INTRODUCTION Species distribution modeling has been used to project species responses to land use and climate change, predict invasive species geographic limits, identify new species or populations, and establish biodiversity reserve networks (Araujo et al. 2005; Ficetola et al. 2007; Pawar et al. 2007; Raxworthy et al. 2003; Rodriguez-Estrella 2007). The increased use of species distribution modeling in ecology and conservation in recent years has led to a large body of literature comparing various techniques and exploring issues such as model application, selection, calibration, validation and transferability (Araujo & Guisan 2006; Elith et al. 2006; Guisan & Zimmerman 2000; Hirzel et al. 2006; Peterson 2006). We examined some of these issues using a novel presence-only modeling technique (MAXENT) to predict the distribution of American oystercatchers (Haematopus palliatus palliatus) in coastal New Jersey. We used a small dataset of known occurrence records collected at a local scale to model the species distribution over a larger scale in an effort to predict the occurrence of oystercatchers in previously unsurveyed areas, and to evaluate our model s performance with an independent dataset. Underlying the major issues concerning distribution modeling are the transferability of models and model validation (or evaluation) (Boitani et al. 2008; Loiselle et al. 2008; Peterson 2007; Phillips 2008). Transferability relates to the ability of a model to predict a species distribution using information assembled from somewhere outside the focal area. Model validation is the process of measuring the accuracy between model predictions and actual observations, which can be done by a variety of methods (see Guisan & Zimmerman 2000). In order to evaluate the performance and transferability of a species
69 52 distribution model it is important to first understand what is being modeled so that comparison between model results and validation data can be better interpreted. The goal of many species distribution modeling techniques is to model a species ecological niche, which is then used to predict its potential distribution over geographic space (Soberon & Peterson 2005). Many of the recent presence-only modeling techniques were designed to model a species fundamental niche, defined as the set of abiotic environmental conditions necessary for a species long-term survival (Hutchinson 1957). However, it is often difficult to distinguish in practice between a species fundamental niche and its realized niche, which is a subset of the fundamental niche taking into consideration biotic interactions. Distinguishing between the fundamental and realized niche is especially difficult in highly modified landscapes where a species may never be expected to completely fill its fundamental niche (Peterson 2006; Pulliam 2000; Soberon & Peterson 2005). Clarification of the niche concept is considered one of the major challenges in species distribution modeling (Araujo & Guisan 2006), and is an especially important consideration in any a posteriori attempt to evaluate the effectiveness of a species distribution model. Errors between predicted and actual occurrences should be expected since the training data (i.e. occurrence records used to develop the models) may better reflect the species realized niche. In addition, the actual occurrence information might be further limited within the modeled realized niche if source-sink dynamics are affecting the species local distribution (Pulliam 2000).
70 53 The scale at which the predictions are developed plays an important role in deciding whether a species fundamental or realized niche is being predicted (Fielding & Bell 1997). Models developed at the regional or continental scale using broad-scale predictor variables such as temperature, precipitation or elevation may better predict the fundamental niche of the species. Models using fine-scale predictor variables such as nesting substrate type may better predict the realized niche (Karl et al. 2000). Certainly, at a more local scale, factors such as inter-specific competition or human disturbance play an important role in affecting a species distribution (Thuiller et al. 2004). Thus, consideration of scale must be weighed when evaluating model results with independent validation data derived from ground surveys. The distribution of American oystercatchers in New Jersey provides a novel test of distribution models because this geographic area represents a recently re-colonized part of the species range. After being extirpated from northern parts of the species range by the early 1900s due to habitat loss and commercial hunting, oystercatchers have recently expanded north along the Atlantic coast of the United States (Nol & Humphrey 1994; Davis 2001). It was during this time that the species local breeding distribution began to change, possibly facilitating the range expansion (Humphrey 1990). Such plasticity in oystercatcher breeding ecology is not unprecedented. The European oystercatcher (H. ostralegus) recently moved inland in several European countries shifting its breeding habitat from coastal areas to agricultural fields (Goss-Custard et al. 1997).
71 54 Understanding the current distribution of American oystercatchers is the first step towards planning conservation actions needed for this species of special concern. American oystercatchers face significant threats throughout their range including habitat loss, habitat degradation, human disturbance, potential prey resource depletion and increasing threats from predators (Brown et al. 2005). New Jersey is the most densely populated state in the United States, and ecosystems in the state s coastal zone are highly altered. At present, we do not have a clear understanding of oystercatcher distribution in urbanized coastal ecosystems, nor do we have an accurate estimate of the breeding population in various parts of the species range including New Jersey. The main goals of our study were to: (1) understand the effects of urbanization on American oystercatcher distribution at a local scale, (2) test the transferability of the MAXENT model to unsurveyed areas outside the training areas in an effort to locate new oystercatcher populations within New Jersey, and (3) evaluate the model s predictive capability using an independent dataset to validate model results. By comparing the predictions provided by our MAXENT model to the actual distribution of oystercatchers in New Jersey we hope to test the predictive capabilities of this new modeling technique in a real-world situation and further explore niche concepts in species distribution modeling. (A) METHODS (B) Surveys
72 55 Training data for our species distribution models were provided by two datasets of oystercatcher occurrence records (Table 1; Fig. 1). First, the New Jersey Division of Fish & Wildlife Endangered and Nongame Species Program (ENSP) provided occurrence records for oystercatchers breeding on barrier beaches along the entire coast of New Jersey. This dataset was limited to occurrence records on the barrier beach strand since ENSP did not conduct systematic surveys for oystercatchers in alternative habitat. Second, we conducted independent surveys during 2006 for breeding oystercatchers at three study areas located in southern New Jersey that were known to have some of the highest densities of breeding oystercatchers in the state (Fig. 1). Our surveys were conducted on barrier beach strands and in all available alternative breeding habitats (i.e. saltmarsh and isolated inlet or back-bay islands) lying adjacent to the barrier islands. Surveys were conducted by walking line transects following barrier beaches and the perimeters of natural inlet islands and artificial dredge-spoil islands. We surveyed saltmarsh habitat by boat, following all navigatable shorelines and tidal creeks, and by walking line transects spaced 100 m apart. We identified all breeding pairs of oystercatchers and marked all nests/pairs located with a handheld GPS. The availability of potential oystercatcher breeding habitat types was similar at each study area. We conducted additional surveys during 2007 to be used as an independent validation dataset to evaluate the performance of our final species distribution model (Table 1). We conducted surveys at 283 randomly selected points stratified across the range of predictive values derived by our MAXENT model output (see below). The validation surveys were conducted from May 1 to June 15, which is the peak breeding season for
73 56 oystercatchers in New Jersey. We selected random survey points in all potential oystercatcher breeding habitat (i.e. barrier beach and alternative habitats) along the New Jersey Atlantic coastline from Sandy Hook (40.48 N, W) in the north to Cape May (38.93 N, W) in the south, and extended 4 km inland from the Atlantic coastline. Observers recorded the presence or absence of breeding pairs of oystercatchers in a 100 m radius around each random survey point, and all breeding pairs located were marked with a handheld GPS. Most random survey points were visited once; however, we visited a subset of points (25%) twice in order to quantify detection error using an occupancy modeling technique (MacKenzie et al. 2006). This effort confirmed that a single point survey was adequate to ensure detection of breeding pairs when present. (B) Predictive Model We chose to use a species distribution modeling approach developed in a machinelearning environment (MAXENT software) to model oystercatcher distribution using presence-only data. MAXENT estimates a species distribution by finding the probability distribution of maximum entropy (i.e. closest to uniform) subject to the constraint that the expected value of each environmental variable (or derived feature), and/or interactions under this target distribution, should match its empirical average (Phillips et al. 2006). MAXENT uses known occurrence records to train explanatory models (training data) and uses features composed of all pixels in the study area (background data) to predict the probability distribution over environmental space outside the training area. Recent studies have shown that MAXENT outperforms other presenceonly modeling techniques (Gibson et al. 2007; Papes & Gaubert 2007; Phillips et al.
74 ; Ward 2007), and performs well in comparison to a wide variety of other species distribution modeling techniques (Elith et al. 2006). Our training data included 67 occurrence records identified during our 2006 surveys (see above), and our background data included the recommended 10,000 points drawn randomly from our 2006 study areas using Hawth s Analysis Tools for ArcGIS (version 3.26). Within our training dataset, we randomly removed all occurrence records located within 200 m of each other in order to reduce over-fitting due to spatial autocorrelation (Dormann et al. 2007). We chose this distance based on our knowledge of local oystercatcher territory sizes and to match the survey design used to collect our validation dataset. We ran our MAXENT models using the recommended default settings for maximum iterations (500), convergence threshold (10-5 ) and regularization (1), which have been shown to improve model performance and reduce over-fitting (Phillips et al. 2006) (Dudik et al. 2007). We also selected the default auto features command to allow MAXENT to include the following feature types in our models, some of which are recently added extensions to the modeling software: linear, quadratic, product, threshold, hinge and discrete (Phillips & Dudik 2008). Finally, we set our model output to the default logistic output, which is considered the easiest output to conceptualize as it provides a continuous variable ranging from 0 1 with higher values indicating a higher probability of presence (Phillips et al. 2006). (B) Environmental Variables
75 58 MAXENT required that we create a set of spatially explicit environmental variables as background data over which the training data was modeled (Table 2). Following the recommendations of Burnham & Anderson (2002), we selected an a priori set of environmental variables that we hypothesized would influence oystercatcher distribution. These variables can be grouped into three broad categories: (1) type and amount of breeding habitat available, (2) type, proximity and amount of available foraging habitat, and (3) proximity and density of urbanization. Our original set of variables included 15 variables; however, to avoid model over-fitting (Gibson et al. 2007; Rushton et al. 2004), we reduced this set to nine by removing highly correlated variables based on a nonparametric Spearman s correlation analysis (Ward 2007). We used available land use/land cover classification data provided by the Grant F. Walton Center for Remote Sensing and Spatial Analysis (CRSSA) to derive all of our environmental variables (Table 2). We rasterized land use/land cover polygons in ArcGIS 9.2 (ESRI Inc., Redlands, CA, USA) using a 10 m cell size within an area of extent that included a 10 km buffer from the Atlantic coastline of New Jersey. All GISderived variables used the same cell size and area of extent, which was a requirement of the MAXENT software. Based on distributional patterns that were apparent in our training data, we formulated the following hypotheses about the effects of our environmental variables on oystercatcher distribution:
76 59 1. Breeding oystercatchers were expected to be more abundant in alternative habitats such as saltmarsh and back-bay islands than on barrier islands. 2. The availability of sand substrates in alternative habitats was expected to have a strong positive influence on the probability of oystercatcher presence. 3. The probability of oystercatcher presence was expected to be greater in suitable breeding habitat that was in close proximity to appropriate foraging habitat. Additionally, the total area of available foraging habitat was expected to have a positive influence on the probability of presence. 4. Oystercatcher distribution was expected be clumped near Atlantic inlets since the conditions near inlets are favorable for the development of appropriate foraging habitat. 5. Oystercatchers were expected to avoid seemingly suitable breeding habitat that was in close proximity to highly urbanized areas. Further, as the density of urbanization increased the probability of oystercatcher presence was expected to decrease substantially. MAXENT provided several outputs that offered alternative methods for analyzing the contribution of each environmental variable on the projected distribution. These included a heuristic estimate of the relative contribution that each variable had on the projected distribution and jackknife tests to examine the effects of environmental variables on the final model. (B) Model Validation
77 60 MAXENT automatically validates model output by partitioning the training data into two sets one that is used to train models and one that is set aside to test the models. We chose to partition 25% of the training data as test data. To evaluate model fit, we used a threshold-independent test using the area under the receiver operating characteristic (ROC) curve. The ROC curve plots model sensitivity (or true-positive rate) on the y-axis against the commission rate (1 specificity, or false-positive rate) on the x-axis (Fielding & Bell 1997; Swets 1988). Models are evaluated based on the area under the curve (AUC), which ranges from 0 1. A score of one indicates perfect model discrimination, a score > 0.75 indicates good model discrimination, and a score < 0.50 indicates that the model is performing no better than random (Elith et al. 2006; Swets 1988). While validation using data partitioned from the training data provides a useful measure of the discrimination ability of models, it is still preferable to validate models with an independent dataset whenever possible (Elith et al. 2006; Pearce & Ferrier 2000). Therefore, we performed additional analyses using validation data obtained from our independent surveys conducted in 2007 (see above). We calculated a ROC curve using the presence-absence data we collected, which allowed us to compare the AUC derived from the validation data with the AUC from the final MAXENT model. In order to calculate the ROC curve we extracted the maximum MAXENT probability value within a 110 m radius buffer around all random survey points. We chose to use the maximum MAXENT probability value in our validation since we expected oystercatcher pairs to be present if any suitable habitat was available within the 100 m survey radius.
78 61 Lobo et al. (2008) question the reliance on AUC values as the sole measure of model validation because it ignores predicted probability values, goodness-of-fit and spatial extent of the models. Thus, as a further performance test we analyzed model omission (false negative) and commission (false positive) rates separately using information provided in a confusion matrix (Anderson et al. 2003; Fielding & Bell 1997). We derived several confusion matrices using different methods to extract MAXENT values from our results, and we applied two commonly used thresholds to dichotomize the continuous distribution values (0.50 and 0.70). (A) RESULTS (B) Predictive Model The MAXENT model predicted a high probability of oystercatcher presence in alternative breeding habitats removed from barrier island beaches in New Jersey (Fig. 2), especially in the southern regions of New Jersey where there is a larger amount of saltmarsh habitat available behind the barrier island complex. Results of model validation based on ROC curves generated using test data partitioned from the training data indicated that the MAXENT model performed well (Fig. 3), exhibiting good discrimination ability based on analyses of both the training data (AUC = 0.95) and test data (AUC = 0.91). The MAXENT model provided predictions that were useful to locate new oystercatcher populations. Ground surveys based on our model located 185 previously unknown breeding pairs of oystercatchers in coastal New Jersey. (B) Explanatory Variables
79 62 The heuristic estimates (Table 2) indicated that distance from tidal waters had the greatest influence on predicted oystercatcher distribution with probability of presence substantially higher in areas closer to tidal waters. The heuristic estimate also indicated that habitat type had a very large influence on predicted oystercatcher distribution. The response curve for the habitat classification variable indicated oystercatchers used low marsh (Spartina alterniflora dominant marsh), vegetated dunes, barrier beaches and other beaches including those found on inlets, natural or artificial islands and saltmarsh margins. Sandy beaches found in alternative habitat had by far the highest probability of oystercatcher presence, as we hypothesized. While the availability of sand substrates appeared to increase the probability of oystercatcher occurrence, nests found in alternative habitat during our 2007 validation surveys (N = 103) were placed on both sand substrate (N = 51) and wrack deposits (N = 53). Examination of the jackknife tests of training and test gains confirmed that the most important contributing variables in the final MAXENT model were distance from tidal waters and habitat type (Fig. 4). Further examination of the jackknife test of AUC indicated that several variables were more important contributors to the final MAXENT model than indicated by the heuristic estimate. These variables included three that were related to the amount of foraging habitat available both in close proximity to potential nest sites (within 100 m) and distant from nest sites (within 1 km). This supports our hypothesis that oystercatchers select breeding habitat in close proximity to foraging areas. The jackknife test of AUC also indicated that the probability of oystercatcher presence was influenced to some degree by
80 63 the amount of urbanization within 1 km of potential breeding areas with a much lower probability in highly developed areas. (B) Model Validation Results of independent oystercatcher surveys conducted along the New Jersey Atlantic coastline during 2007 indicated that most breeding oystercatchers were distributed in alternative habitats as the MAXENT model suggested (Table 1; Fig. 5). Nevertheless, the ROC curve generated for our independent validation data indicated that the MAXENT model did not perform much better than random (AUC = 0.54). Further, the AUC for our validation data was well below the AUC for the final MAXENT model (AUC training data = 0.95) indicating poor validation of the model. In order to further examine the source of errors in our MAXENT model, we isolated errors of omission and commission by analyzing observed and predicted presence/absence patterns of our independent validation data in confusion matrices (Table 3). These matrices indicated that there was a high omission error rate ( ) regardless of method or threshold used to derive the error rate. The commission error rate was also high ( ) when a 0.50 threshold was used to derive the rate; however, the rate was lower ( ) when a 0.70 threshold was used. (A) DISCUSSION The maximum entropy modeling technique that we employed provided valuable information regarding the distribution of American oystercatchers in New Jersey s highly
81 64 urbanized coastal ecosystem. At a regional scale (statewide), the MAXENT model accurately predicted a higher probability of oystercatcher presence in alternative breeding habitats away from the barrier beach strand, which is the preferred breeding habitat for the species. Ground surveys based on our model located 185 previously unknown breeding pairs of oystercatchers in alternative habitats in coastal New Jersey, which more than doubled the estimate of the local breeding population. As a result of our surveys, we now estimate that 81% of the New Jersey oystercatcher population breeds in alternative habitats away from the barrier beach strand. The models also showed that oystercatchers were less likely to be found in areas with a high degree of urbanization. This pattern may partially explain the low predictive values reported in the northern part of the New Jersey coast, which is the most highly developed coastal area in the state. In addition, the amount of coastal development limits the total area of suitable breeding habitat in the region to small, fragmented patches. For example, the habitat surrounding Barnegat Bay has been severely altered with over 70% of the adjacent upland shoreline developed and 36% of the total shoreline bulkheaded (Lathrop & Bognar 2001). This activity limits the amount of alternative breeding and foraging habitat available to oystercatchers in this region. At the local scale, oystercatchers had a much higher probability of presence in alternative breeding habitats where sand was available as a nesting substrate, although wrack deposits were also used regularly for nest placement in these habitats. Thus, the realized niche of the American oystercatcher in New Jersey is predicted to be alternative breeding habitats such as saltmarsh, inlet or back-bay islands that have exposed sand available as a nesting substrate.
82 65 Based on this visual interpretation of our model results, the MAXENT model performed well at the regional scale and the predictions appear to be very transferable to areas outside the training area. However, at the local scale, we saw that the predictive capability of the final MAXENT model was poor. Regardless of the method used to analyze the final model with our independent validation dataset, AUC values were below those necessary to indicate good model discrimination and omission errors were unacceptably high. However, validation of models in this manner is expected to be difficult due to the incomplete information that is used to develop distribution models (Fielding 2002), and it may even be conceptually impossible to perfectly validate models in this manner (Araujo et al. 2005). There are a number of potential explanations as to why we did not see a strong validation of the MAXENT model using the independent validation dataset including: (1) over-fitting of models, (2) data errors in predictive models and (3) models accurately predict the realized niche but oystercatchers are utilizing unsuitable (sink) habitat. We explore each of these potential explanations for the weak model validation below. The first two explanations deal with possible errors in the construction of our MAXENT model. First, the high omission error rate ( ) of our validation data indicates that oystercatchers are occurring in high numbers in areas not predicted by the distribution model. This result could indicate that the MAXENT model is over-fit, thus seriously under-predicting the amount of suitable breeding habitat that is available. However, we took measures to reduce this potential error in the model-building process
83 66 by addressing issues known to cause over-fitting such as spatial autocorrelation of occurrence records, multi-collinearity of environmental variables, and using excess predictor variables with small training datasets. Further, over-fitting is prevented in the MAXENT software by the regularization and feature selection processes used in the algorithms (Dudik et al. 2007). As such, we do not feel that over-fitting is a good explanation for the poor model validation. Second, it is possible that there were errors in the background GIS data used to construct our environmental layers. Ground-truthing of habitat features at random survey points, which was performed during our surveys, revealed some classification errors in the GIS data. For example, we identified several areas where small sandy margins in saltmarsh habitat were not classified properly in our GIS layers; therefore, these areas would have received higher predicted suitability values in our final model. The occurrence of oystercatchers in these areas led to misclassified false negatives in our confusion matrices. Correction of these misclassifications would lower the omission error rate to some degree; however, there were few errors of this type identified. Therefore, the omission error rate would still be extremely high even if we corrected for these errors. In the absence of data errors in our models it is possible that the final model accurately predicts the realized niche, but oystercatchers are utilizing unsuitable (sink) habitat. The goal of our distribution model was to predict the realized niche of the species, and we expected the actual distribution to overlap this niche due to the dispersal ability of the species, keeping in mind that a good model of a species niche may not necessarily
84 67 coincide with the current distribution of that species (Phillips 2008). The MAXENT model predicted the realized niche (highly suitable areas) well, supported by the observation that these areas had much higher densities of breeding pairs (T. Virzi, personal observation). However, our independent surveys indicated that oystercatchers were also widely distributed in areas predicted to be unsuitable. Metapopulation theory indicates that species will be distributed across a range of habitat suitability rather than just in highly suitable areas (Morin 1999). Source-sink dynamics further predict that a species will often occupy seemingly unsuitable habitat in high density, especially when dispersal ability is strong (Pulliam 1988, 2000). A highly mobile species such as the American oystercatcher could be expected to show this pattern. In fact, Ens (1992) showed a despotic distribution for the European oystercatcher where individuals often attempted to breed in less suitable habitat, hypothesized to be due to intense intra-specific competition for the most suitable (and most productive) habitat. Further, many individuals also chose not to breed at all and waited in queue for an opening in the most suitable habitat. By comparing maps of the MAXENT predictions (Fig. 2) with the actual distribution (Fig. 5), it is clear that oystercatcher occurrences in unsuitable habitat are often located near areas with high suitability values. We interpret this as evidence that oystercatchers in New Jersey are exhibiting a similar despotic distributional pattern as reported for the European oystercatcher. Our study of oystercatcher nest success (Chapter 1) showed that most oystercatcher productivity in New Jersey comes from the areas predicted to be most
85 68 suitable by the MAXENT model; therefore, these areas may be acting as sources for the local population. Further, low-lying saltmarsh areas, which are predicted as unsuitable by the MAXENT model, exhibit poor nest productivity indicating these areas may be acting as sink habitat. The high density of breeding pairs in areas with high suitability values may also indicate that these areas are saturated with oystercatchers, forcing many individuals to breed in nearby low-lying saltmarsh sink habitat. Given the condition of coastal ecosystems in New Jersey it is not surprising that such a high proportion of the known oystercatcher population (69%) occurs in unsuitable (sink) habitat. The high commission error rate ( ) of our validation data indicates that our MAXENT model did not predict oystercatcher presence well, even in habitat that was predicted to be highly suitable. This suggests that there may be additional factors not included in our models that may be further influencing the local oystercatcher distribution. It is possible that human disturbance on breeding grounds, which was not included in our models, may be keeping oystercatchers from utilizing highly suitable breeding habitat. Persistent human disturbance on or near breeding grounds is known to affect settlement and territory establishment of birds, causing birds to abandon optimal habitat and subsequently settle in sub-optimal habitat (Erwin 1980; Van der Zande & Vestral 1985; Yalden & Yalden 1990). The small number of potential source populations breeding in highly suitable habitat in New Jersey does not bode well for the viability of the state s oystercatcher population. More importantly, the distributional patterns reported in New Jersey are repeated in other
86 69 urbanized ecosystems such as in Maryland, where approximately 89% of the known oystercatcher population breeds in alternative habitats (Traut et al. 2006). There could be severe consequences to the overall Atlantic coast oystercatcher population if the species is indeed expanding its range northward and concurrently shifting its breeding habitat into sink habitat. Further research is needed to understand oystercatcher productivity in alternative breeding habitats and to identify small, isolated areas that may act as local source populations. Furthermore we recommend that surveys based on predictions in a distributional model should be designed so that sink populations may also be located. This can be achieved by having a survey design that includes searches in both highly suitable habitat and adjacent unsuitable habitat where sink populations might be expected. (A) ACKNOWLEDGEMENTS We would like to David Drake and David Ehrenfeld for their valuable input. The Grant F. Walton Center for Remote Sensing and Spatial Analysis (CRSSA) provided all computing resources. We are indebted to all those in the CRSSA lab who helped us along the way including Jim Trimble, John Bognar, Scott Haag, Mike Mills, Inga Parker, Caroline Phillipuk, Zewei Miao and Aaron Love. Thanks to Larry Niles, Dave Jenkins, Todd Pover and Jim Merritt for all of their assistance and support. Financial support came from the New Jersey Division of Fish and Wildlife Endangered and Nongame Species Program and the Edwin B. Forsythe National Wildlife Refuge. A special thanks to Jeff Faust for tramping around the back-bays of New Jersey with me each spring over the past two years. And finally, thanks to my wife Kristen who spent countless hours in the field with me.
87 70 (A) LITERATURE CITED Anderson, R. P., D. Lew, and A. T. Peterson Evaluating predictive models of species' distributions: criteria for selecting optimal models. Ecological Modelling 162: Araujo, M. B., and A. Guisan Five (or so) challenges for species distribution modelling. Journal of Biogeography 33: Araujo, M. B., R. G. Pearson, W. Thuiller, and M. Erhard Validation of speciesclimate impact models under climate change. Global Change Biology 11: Boitani, L., I. Sinibaldi, F. Corsi, A. De Biase, I. d'inzillo Carranza, M. Ravagli, G. Reggiani, C. Rondinini, and P. Trapanese Distribution of medium- to large-sized African mammals based on habitat suitability models. Biodiversity and Conservation 17: Brown, S. C., S. Schulte, B. Harrington, B. Winn, and M. Howe Population size and winter distribution of eastern American oystercatchers. Journal of Wildlife Management 69: Burnham, K. P., and D. R. Anderson Model selection and multi-model inference: a practical information-theoretic approach. Springer-Verlag, New York, NY. Dormann, C. F., J. M. McPherson, M. B. Araujo, R. Bivand, J. Bolliger, G. Carl, R. G. Davies, A. Hirzel, W. Jetz, W. D. Kissling, I. Kuhn, R. Ohlemuller, P. R. Peres- Neto, B. Reineking, B. Schroder, F. M. Schurr, and R. Wilson Methods to
88 71 account for spatial autocorrelation in the analysis of species distributional data: a review. Ecography 30: Dudik, M., S. J. Phillips, and R. E. Schapire Maximum entropy density estimation with generalized regularization and an application to species distribution modeling. Journal of Machine Learning Research 8: Elith, J., C. H. Graham, R. P. Anderson, M. Dudik, S. Ferrier, A. Guisan, R. J. Hijmans, F. Huettmann, J. R. Leathwick, A. Lehmann, J. Li, L. G. Lohmann, B. A. Loiselle, G. Manion, C. Moritz, M. Nakamura, Y. Nakazawa, J. M. Overton, A. T. Peterson, S. J. Phillips, K. Richardson, R. Seachetti-Periera, R. E. Schapire, J. Soberon, S. Williams, M. S. Wisz, and N. E. Zimmerman Novel methods improve prediction of species' distributions from occurrence data. Ecography 29: Ens, B. J The despotic distribution and deferred maturity in the oystercatcher: two sides of the same coin. Pages The Social Prisoner: Causes of Natural Variation in Reproductive Success of the Oystercatcher. Van Denderen B.V., Groningen. Erwin, M. R Breeding habitat use by colonially nesting waterbirds in two mid- Atlantic U.S. regions under different regimes of human disturbance. Biological Conservation 18: Ficetola, G. F., W. Thuiller, and C. Miaud Prediction and validation of the potential distribution of a problematic alien invasive species - the American bullfrog. Diversity and Distributions 13:
89 72 Fielding, A. H What are the appropriate characteristics of an accuracy measure? Pages in J. M. Scott, P. J. Heglund, M. L. Morrison, J. B. Haufler, M. G. Raphael, W. A. Wall, and F. B. Samson, editors. Predicting species occurrences: issues of accuracy and scale. Island Press, Washington, DC, USA. Fielding, A. H., and J. F. Bell A review of methods for the assessment of prediction errors in conservation presence/absence models. Environmental Conservation 24: Frohling, R. C American oystercatcher and black skimmer nesting on salt marsh. The Wilson Bulletin 77: Gibson, L., B. Barrett, and A. Burbidge Dealing with uncertain absences in habitat modelling: a case study of a rare ground-dwelling parrot. Diversity and Distributions 13: Goss-Custard, J. D., J. Ross, S. McGrorty, S. E. A. Durell, R. W. G. Caldow, and A. D. West Locally stable numbers in the oystercatcher Haematopus ostralegus where carrying capacity has not been reached. Ibis 140: Guisan, A., and N. E. Zimmerman Predictive habitat distribution models in ecology. Ecological Modelling 135: Hirzel, A. H., G. Le Lay, V. Helfer, C. Randin, and A. Guisan Evaluating the ability of habitat suitability models to predict species presences. Ecological Modelling 199: Humphrey, R. C Status and range expansion of the American Oystercatcher on the Atlantic coast. Transactions of the Northeastern Section of the Wildlife Society 47:54-61.
90 73 Hutchinson, G. E Concluding remarks. Cold Spring Harbor Symposia on Quantitative Biology 22: Karl, J. W., P. J. Heglund, E. O. Garton, J. M. Scott, N. M. Wright, and R. L. Hutto Sensitivity of species habitat-relationship model performance to factors of scale. Ecological Applications 10: Kramer, E. Y Oyster-catcher breeding in New Jersey. The Auk:460. Lathrop, R. G. J., and J. A. Bognar Habitat loss and alteration in the Barnegat Bay region. Journal of Coastal Research Special Issue: Lauro, B., and J. Burger Nest-site selection of American Oystercatchers (Haematopus palliatus) in salt marshes. The Auk 106: Lobo, J. M., A. Jimenez-Valverde, and R. Real AUC: a misleading measure of the performance of predictive distribution models. Global Ecology And Biogeography 17: Loiselle, B. A., P. M. Jorgensen, T. Consiglio, I. Jimenez, J. G. Blake, L. G. Lohmann, and O. M. Montiel Predicting species distributions from herbarium collections: does climate bias in collection sampling influence model outcomes? Journal of Biogeography 35: MacKenzie, D. I., J. D. Nichols, J. A. Royle, K. H. Pollock, L. L. Bailey, and J. E. Hines Occupancy estimation and modeling: inferring patterns and dynamics of species occurrence. Elsevier Inc., Burlington, MA USA. McGowan, C. P., T. R. Simons, W. Golder, and J. Cordes A comparison of American Oystercatcher reproductive success on barrier beach and river island habitats in coastal North Carolina. Waterbirds 28:
91 74 Morin, P. J Community Ecology. Blackwell Science, Inc., Malden, MA. Olivier, F., and S. J. Wotherspoon Nest selection by snow petrels Pagodroma nivea in East Antarctica: validating predictive habitat selection models at the continental scale. Ecological Modelling 210: Papes, M., and P. Gaubert Modelling ecological niches from low numbers of occurrences: assessment of the conservation status of poorly known viverrids (Mammalia, Carnivora) across two continents. Biodiversity Research 13: Pawar, S., M. S. Koo, C. Kelley, M. F. Ahmed, S. Chaudhuri, and S. Sarkar Conservation assessment and prioritization of areas in Northeast India: Priorities for amphibians and reptiles. Biological Conservation 136: Pearce, J., and S. Ferrier Evaluating the predictive performance of habitat models developed using logistic regression. Ecological Modelling 133: Peterson, A. T Uses and requirements of ecological niche models and related distributional models. Biodiversity Informatics 3: Peterson, A. T. e. a Transferability and model evaluation in ecological niche modeling: a comparison of GARP and Maxent. Ecography 30. Phillips, S. J Transferability, sample selection bias and background data in presence-only modelling: a response to Peterson et al. (2007). Ecography 31: Phillips, S. J., R. P. Anderson, and R. E. Schapire Maximum entropy modeling of species geographic distributions. Ecological Modelling 190: Phillips, S. J., and M. Dudik Modeling of species distributions with Maxent: new extensions and a comprehensive evaluation. Ecography 31:
92 75 Post, P. W., and G. S. Raynor Recent range expansion of the American oystercatcher into New York. The Wilson Bulletin 76: Pulliam, H. R Sources, sinks and population regulation. American Naturalist 132: Pulliam, H. R On the relationship between niche and distribution. Ecology Letters 3: Raxworthy, C. J., E. Martinez-Meyer, N. Horning, R. A. Nussbaum, G. E. Schneider, M. A. Ortega-Huerta, and A. T. Peterson Predicting distributions of known and unknown reptile species in Madagascar. Nature 426: Rodriguez-Estrella, R Land use changes affect distributional patterns of desert birds in the Baja California peninsula, Mexico. Diversity and Distributions 13: Rushton, S. P., S. J. Ormerod, and G. Kerby New paradigms for modelling species distributions? Journal Of Applied Ecology 41: Shields, M. A., and J. F. Parnell Marsh nesting by American Oystercatchers in North Carolina. Journal of Field Ornithology 61: Soberon, J., and A. T. Peterson Interpretation of models of fundamental ecological niches and species' distributional areas. Biodiversity Informatics 2:1-10. Swets, J. A Measuring the accuracy of diagnostic systems. Science 240: Thuiller, W., L. Brotons, M. B. Araujo, and S. Lavorel Effects of restricting environmental range of data to project current and future species distributions. Ecography 27:
93 76 Traut, A. H., J. M. McCann, and D. F. Brinker Breeding status and distribution of American Oystercatchers in Maryland. Waterbirds 29: Van der Zande, A. N., and T. J. Vestral Impacts of outdoor recreation upon nestsite choice and breeding success of the Kestrel. Ardea 73: Ward, D. F Modelling the potential geographic distribution of invasive ant species in New Zealand. Biological Invasions 9: Wilke, A. L., B. D. Watts, B. R. Truitt, and R. Boettcher Breeding season status of the American Oystercatcher in Virginia, USA. Waterbirds 28: Yalden, P. E., and D. W. Yalden Recreational disturbance of breeding Golden Plovers Pluvialis apricarius. Biological Conservation 51:
94 77 (A) TABLES Table 1 Summary of all occurrence records used as training data in our species distribution models and pooled survey data for New Jersey. Training data are all occurrence records identified during 2006 surveys at select study areas. Survey data are all occurrence records identified during 2007 independent surveys at/near randomly selected points along the New Jersey coastline (within a 4 km buffer from Atlantic coastline) pooled with 2007 survey data at training areas, which represents the total known oystercatcher population in the state. Training Data Survey Data Habitat Type No. Pairs % Total No. Pairs % Total Barrier Beach % % Saltmarsh % % Inlet Islands 3 4.5% % Dredge-Spoil Islands 4 6.0% % Total % %
95 78 Table 2 Description of environmental variables used in MAXENT models and a heuristic estimate of the relative contribution of each environmental variable on the projected distribution, as provided by MAXENT output. Description 1 % Contribution Distance from nearest tidal waters 46.8% Habitat classification 33.3% Distance from nearest inlet 10.9% Area of low marsh edge within 100 m radius 3.6% Area of tidal flats within 1 km radius 1.7% Area of urbanization within 100 m radius 1.6% Area of tidal flats within 100 m radius 1.6% Area of low marsh edge within 1 km radius 0.4% Area of urbanization within 1 km radius 0.1% Total Contribution 100.0% 1 Distance variables measured as Euclidean distances using nearest neighbor function; area variables calculated as focal statistics using a 10 x 10 m moving window within a radius of either 100 m or 1 km surrounding all pixels in the area of extent; all calculations done with Spatial Analysis Tools in ArcGIS 9.2; all variables continuous except habitat classification which is categorical
96 79 Table 3 Confusion matrices and error rates derived from presence/absence data collected during 2007 oystercatcher surveys. Matrices based on three methods used to extract MAXENT probability values and two thresholds. Validation Data 1,2 AUC max = 0.54 Measure 3 Threshold 4 TP FN TN FP OE CE Point Mean Max Point Mean Max Confusion matrices based on presence/absence data at random survey points; AUC max = area under the ROC curve based on maximum MAXENT probability value within 110 m radius of points 2 TP = true positives, FN = false negatives, TN = true negatives, FP = false positives, OE = omission error rate [FN / (FN + TP)], CE = commission error rate [FP / (FP + TP)]
97 80 3 Methods used to derive confusion matrices: Point = point values, Mean = mean values within 110 m radius, Max = maximum values within 110 m radius 4 Thresholds used to dichotomize continuous distribution values
98 81 (A) FIGURE LEGENDS Figure 1 Oystercatcher occurrence records used as training data in our species distribution models. The three high density breeding areas where we conducted intensive surveys in alternative breeding habitat are identified and include: (1) the Southern Natural Area of Island Beach State Park (IB) located in Ocean County, New Jersey (39.77 N, W), (2) the Holgate Division of the Edwin B. Forsythe National Wildlife Refuge (HG) also located in Ocean County (39.50 N, W), and (3) Stone Harbor Point (SH) located in Cape May County (39.03 N, W). The habitat available for breeding oystercatchers at IB includes 3.3 km of undeveloped barrier beach, a 1.6 km artificial inlet beach along an artificial dike, approximately 197 hectares of adjacent saltmarsh, and an 8 hectare artificial dredge-spoil island located in Barnegat Bay. The habitat available for oystercatchers at HG includes 6.0 km of undeveloped barrier beach, approximately 74 hectares of saltmarsh located directly adjacent to the barrier beach strand, and a 5 hectare naturally-forming inlet island located within Little Egg Inlet. The habitat available for oystercatchers at SH includes 1.8 km of partially developed barrier beach, approximately 23 hectares of saltmarsh located directly adjacent to the barrier beach strand, a 126 hectare nearby saltmarsh island, and an 11 hectare naturally-forming inlet island located within Hereford Inlet.
99 82 Figure 2 Predicted MAXENT distribution displayed using a color ramp of probability values ranging from 0 (blue) 1 (red). Predictive maps were masked by New Jersey county boundaries to show the change in predicted oystercatcher distribution moving from north to south along the Atlantic coastline. Figure 3 Receiver operating characteristic (ROC) curves for training, test and independent validation data used to evaluate the MAXENT distribution model. ROC curves for training and test data provided by MAXENT output. ROC curve for our independent validation dataset calculated using JMP software version 7.0 (SAS Institute, Cary, NC, USA) based on maximum MAXENT probability value and presence/absence data collected within a 110 m buffer around random survey points. Figure 4 Jackknife tests of training gain (gain is related to deviance), test gain and AUC for the MAXENT model. Models run by removing each variable individually do not improve the gain substantially above the overall gain of the MAXENT model based on training data with the exception of distance from inlets, indicating all variables contribute to the distribution to some degree. Models run with each variable in isolation indicate that habitat type has the most useful information by itself. The jackknife of AUC indicates that habitat type, distance from tidal waters, and amount of saltmarsh habitat in close proximity to potential breeding areas (i.e. within 100 m) achieve good amounts of discriminating ability (AUC > 0.75) when looked at in isolation. Other variables that gain importance in the jackknife of AUC include amount of saltmarsh and tidal flats
100 83 distant from potential breeding areas (i.e. within 1 km) and amount of urbanization within 1 km of breeding areas. Figure 5 New Jersey oystercatcher distribution based on results of 2007 surveys conducted within a 4 km buffer from the Atlantic coastline. Data presented includes all breeding pairs located during independent surveys including those found within a 110 m buffer around random survey points, those found incidentally while traveling between random survey points, and all pairs identified during concurrent censuses at training areas.
101 84 (A) FIGURES Figure 1
102 Figure 2 85

103 Figure 3 86


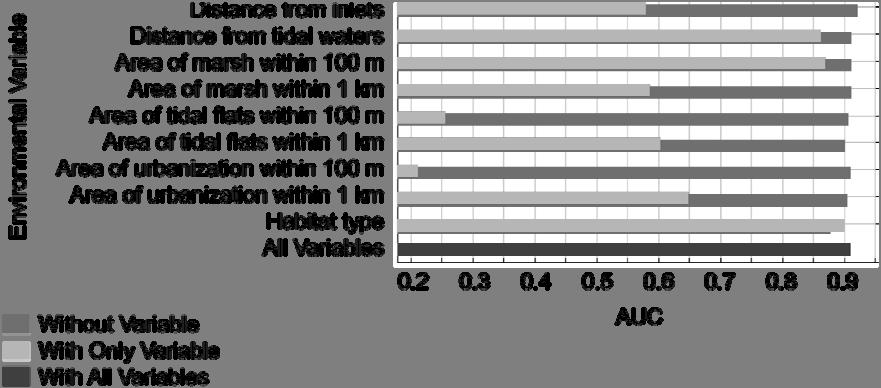

104 Figure 4 87
Update on American Oystercatcher Reseach and Conservation in New Jersey
 Update on American Oystercatcher Reseach and Conservation in New Jersey - 2007 Todd Pover, New Jersey Division of Fish and Wildlife - Endangered and Nongame Species Program Tom Virzi, PhD Candidate Department
A Comparison of American Oystercatcher Reproductive Success on Barrier Beach and River Island Habitats in Coastal North Carolina
 A Comparison of American Oystercatcher Reproductive Success on Barrier Beach and River Island Habitats in Coastal North Carolina CONOR P. MCGOWAN 1 *, THEODORE R. SIMONS 1,4, WALKER GOLDER 2 AND JEFF CORDES
Maryland Coastal Bays Colonial Waterbird and Islands Report 2018
 Maryland Coastal s Colonial Waterbird and Islands Report 2018 THE REPORT This report provides an assessment of the current state of colonial waterbird breeding in the Coastal s of Maryland behind Ocean
Florida Field Naturalist
 Florida Field Naturalist PUBLISHED BY THE FLORIDA ORNITHOLOGICAL SOCIETY VOL. 29, NO. 3 SEPTEMBER 2001 PAGES 75-112 Florida Field Naturalist 29(3):75-80, 2001. AMERICAN OYSTERCATCHERS NEST ON GRAVEL-COVERED
Piping Plovers - An Endangered Beach Nesting Bird, and The Threat of Habitat Loss With. Predicted Sea Level Rise in Cape May County.
 Piping Plovers - An Endangered Beach Nesting Bird, and The Threat of Habitat Loss With Thomas Thorsen May 5 th, 2009 Predicted Sea Level Rise in Cape May County. Introduction and Background Piping Plovers
Michael Rikard/CALO/NPS Thayer Jon Jerald
 0025457 From: To: Cc: Subject: Date: Attachments: Thayer Broili Tyler Bogardus; Britta Muiznieks Mike Murray; Darrell Echols Fw: Experimental Fence Research/Demonstration for CWB Protection at Bodie Island
Piping Plovers in Jamaica Bay
 Piping Plovers in Jamaica Bay Hanem Abouelezz, Biologist Jamaica Bay Unit Gateway National Recreation Area National Park Service Threatened and Endangered Species Our mission is to reduce the risk of
National Fish and Wildlife Foundation Executive Summary for the American Oystercatcher Business Plan
 National Fish and Wildlife Foundation Executive Summary for the American Oystercatcher Business Plan October 26, 2008 AMOY Exec Sum Plan.indd 1 8/11/09 5:24:00 PM Colorado Native Fishes Upper Green River
Project Summary. Predicting waterbird nest distributions on the Yukon-Kuskokwim Delta of Alaska
 Project Summary 1. PROJECT INFORMATION Title Project ID Predicting waterbird nest distributions on the Yukon-Kuskokwim Delta of Alaska WA2012_22 Project Period July 1, 2012 to June 30, 2014 Report submission
Winter Abundance of the American Oystercatcher in South Carolina
 Winter Abundance of the American Oystercatcher in South Carolina Author(s): Felicia J. Sanders, Thomas M. Murphy, Mark D. Spinks Source: Waterbirds, 27(1):83-88. 2004. Published By: The Waterbird Society
American Oystercatcher Best Management Practices
 American Oystercatcher Best Management Practices Brad Winn American Oystercatcher Working Group 2012 Introduction American Oystercatchers (Haematopus palliatus) are large, conspicuous shorebirds that are
HERON AND EGRET MONITORING RESULTS AT WEST MARIN ISLAND: 2003 NESTING SEASON
 HERON AND EGRET MONITORING RESULTS AT WEST MARIN ISLAND: 2003 NESTING SEASON A Report to the San Pablo Bay National Wildlife Refuge John P. Kelly a and Binny Fischer Cypress Grove Research Center, Audubon
Notes on a Breeding Population of Red-headed Woodpeckers in New York State. Jacob L. Berl and John W. Edwards
 Notes on a Breeding Population of Red-headed Woodpeckers in New York State Jacob L. Berl and John W. Edwards Division of Forestry and Natural Resources, West Virginia University Morgantown, WV 26505 The
Peregrine Falcon Falco peregrinus
 Plant Composition and Density Mosaic Distance to Water Prey Populations Cliff Properties Minimum Patch Size Recommended Patch Size Home Range Photo by Christy Klinger Habitat Use Profile Habitats Used
Sanderling. Appendix A: Birds. Calidris alba. New Hampshire Wildlife Action Plan Appendix A Birds-67
 Sanderling Calidris alba Federal Listing State Listing Global Rank State Rank Regional Status N/A N/A G5 SNR High Photo by Pamela Hunt Justification (Reason for Concern in NH) Populations of several migratory
Ruddy Turnstone. Appendix A: Birds. Arenaria interpres [M,W] New Hampshire Wildlife Action Plan Appendix A Birds-50
![Ruddy Turnstone. Appendix A: Birds. Arenaria interpres [M,W] New Hampshire Wildlife Action Plan Appendix A Birds-50](/thumbs/89/101188544.jpg "Ruddy Turnstone. Appendix A: Birds. Arenaria interpres [M,W] New Hampshire Wildlife Action Plan Appendix A Birds-50") Ruddy Turnstone Arenaria interpres [M,W] Federal Listing State Listing Global Rank State Rank Regional Status N/A N/A G5 SNR Very High Photo by Pamela Hunt Justification (Reason for Concern in NH) Populations
Ruddy Turnstone Arenaria interpres [M,W] Federal Listing State Listing Global Rank State Rank Regional Status N/A N/A G5 SNR Very High Photo by Pamela Hunt Justification (Reason for Concern in NH) Populations
Effects of human activity on the foraging behavior of sanderlings Calidris alba
 0053968 Biological Conservation 109 (2003) 67 71 www.elsevier.com/locate/biocon Effects of human activity on the foraging behavior of sanderlings Calidris alba Kate Thomas*, Rikk G. Kvitek, Carrie Bretz
Whimbrel. Appendix A: Birds. Numenius phaeopus [M] New Hampshire Wildlife Action Plan Appendix A Birds-225
![Whimbrel. Appendix A: Birds. Numenius phaeopus [M] New Hampshire Wildlife Action Plan Appendix A Birds-225](/thumbs/85/92702470.jpg "Whimbrel. Appendix A: Birds. Numenius phaeopus [M] New Hampshire Wildlife Action Plan Appendix A Birds-225") Whimbrel Numenius phaeopus [M] Federal Listing State Listing Global Rank State Rank Regional Status N/A N/A G5 SNR Very High Photo by Pamela Hunt Justification (Reason for Concern in NH) Populations of
Whimbrel Numenius phaeopus [M] Federal Listing State Listing Global Rank State Rank Regional Status N/A N/A G5 SNR Very High Photo by Pamela Hunt Justification (Reason for Concern in NH) Populations of
Are Horseshoe Crab Eggs a Limiting Resource for Red Knots?
 Are Horseshoe Crab Eggs a Limiting Resource for Red Knots? Sarah Karpanty, Jim Fraser, Jim Berkson Department of Fisheries and Wildlife Science Eric Smith Department of Statistics Shorebirds and Horseshoe
Semipalmated Sandpiper
 Semipalmated Sandpiper Calidris pusilla Federal Listing State Listing Global Rank State Rank Regional Status N/A N/A G5 SNR High Photo by Pamela Hunt Justification (Reason for Concern in NH) Populations
Expansion Work Has Begun The perimeter dike for Cell 7 is now visible
 Summer/Fall 2017 In This Issue Poplar Island Expansion Wetland Cell 5AB Development Wildlife Update Birding tours on Poplar Island Expansion Work Has Begun The perimeter dike for Cell 7 is now visible
National Audubon Society. Coastal Bird Conservation Program
 National Audubon Society Coastal Bird Conservation Program Coastal Bird Conservation Program This presentation contains original photos and data. For any use of this information, data, maps, or photographs
2015 AMOY Repeated Breeding Survey: A Preliminary Summary
 2015 AMOY Repeated Breeding Survey: A Preliminary Summary August 11, 2015 Ruth Boettcher, Virginia Dept. of Game and Inland Fisheries and Ted Simons, North Carolina State University Overarching Objectives
Cape Romain National Wildlife Refuge Climate Change Impacts
 Climate Change Impacts How will the Refuge be Affected by Climate Change? Salt marsh fragmentation by rapidly eroding tidal creeks Salt marsh submergence during high tide events leading to habitat conversion
Plover: a Subpopulation-Based Model of the Effects of Management on Western Snowy Plovers
 Plover: a Subpopulation-Based Model of the Effects of Management on Western Snowy Plovers Michele M. Tobias University of California, Davis, One Shields Avenue, Davis, CA 95616 mmtobias@ucdavis.edu Abstract.
Other Commonly Used Names: American skimmer, cut-water, knifebill, scissorbill, sea dog, storm gull, shearwater
 Common Name: BLACK SKIMMER Scientific Name: Rynchops niger Linnaeus Other Commonly Used Names: American skimmer, cut-water, knifebill, scissorbill, sea dog, storm gull, shearwater Previously Used Names:
Cat Island Chain Restoration Project Brown County Port & Resource Recovery Department
 Cat Island Chain Restoration Project Brown County Port & Resource Recovery Department February 2, 2015 Fox River and Lower Green Bay Cat Island Chain - 1938 Cat Island Brown County Aerial Photography,
Dredging, Beach Nourishment and. Bird Conservation Workshop Atlantic Coast Region
 Dredging, Beach Nourishment and US Army Corps Bird Conservation Workshop Atlantic Coast Region Beach Nourishment and Bird Habitat Restoration in Southern New Jersey Shore Protection and Ecosystem Restoration
Tahkenitch Creek Estuary BCS number: 47-35
 Tahkenitch Creek Estuary BCS number: 47-35 ***NOTE: We were unable to determine all necessary information for this site description. If you would like to contribute the needed information to this description,
THE MERSEY GATEWAY PROJECT (MERSEY GATEWAY BRIDGE) AVIAN ECOLOGY SUMMARY PROOF OF EVIDENCE OF. Paul Oldfield
 AVIAN ECOLOGY SUMMARY PROOF OF EVIDENCE OF. Paul Oldfield") HBC/14/3S THE MERSEY GATEWAY PROJECT (MERSEY GATEWAY BRIDGE) AVIAN ECOLOGY SUMMARY PROOF OF EVIDENCE OF Paul Oldfield 1 1 DESCRIPTION OF THE BIRDLIFE IN THE UPPER MERSEY ESTUARY LOCAL WILDLIFE SITE 1.1
HBC/14/3S THE MERSEY GATEWAY PROJECT (MERSEY GATEWAY BRIDGE) AVIAN ECOLOGY SUMMARY PROOF OF EVIDENCE OF Paul Oldfield 1 1 DESCRIPTION OF THE BIRDLIFE IN THE UPPER MERSEY ESTUARY LOCAL WILDLIFE SITE 1.1
Sea Duck Joint Venture Annual Project Summary for Endorsed Projects FY08 (October 1, 2007 to September 30, 2008)
") Sea Duck Joint Venture Annual Project Summary for Endorsed Projects FY08 (October 1, 2007 to September 30, 2008) Project Title: SDJV#16, Ducks Unlimited Canada s Common Eider Initiative (year five of a
Sea Duck Joint Venture Annual Project Summary for Endorsed Projects FY08 (October 1, 2007 to September 30, 2008) Project Title: SDJV#16, Ducks Unlimited Canada s Common Eider Initiative (year five of a
PART FIVE: Grassland and Field Habitat Management
 PART FIVE: Grassland and Field Habitat Management PAGE 64 15. GRASSLAND HABITAT MANAGEMENT Some of Vermont s most imperiled birds rely on the fields that many Vermonters manage as part of homes and farms.
Waterbird Nesting Ecology and Management in San Francisco Bay
 Waterbird Nesting Ecology and Management in San Francisco Bay Josh Ackerman, Alex Hartman, Mark Herzog, and Sarah Peterson U.S. Geological Survey (October 11, 2017) Outline Wetland Management for Nesting
The Effect of Human Disturbance on Foraging Behavior and Habitat Use in Piping Plover (Charadrius me/o&s)
") 0047038 Estuaries Vol. 17, No. 3, p. 695-701 September 1994 The Effect of Human Disturbance on Foraging Behavior and Habitat Use in Piping Plover (Charadrius me/o&s) JOANNA BURGER Biological Sciences Rutgers
0047038 Estuaries Vol. 17, No. 3, p. 695-701 September 1994 The Effect of Human Disturbance on Foraging Behavior and Habitat Use in Piping Plover (Charadrius me/o&s) JOANNA BURGER Biological Sciences Rutgers
2006 Beach nesting Bird Census and Report for Coastal Mississippi
 National Audubon Society Coastal Bird Conservation Program 2006 Beach nesting Bird Census and Report for Coastal Mississippi Margo Zdravkovic National Audubon Society Coastal Bird Conservation Program
Dare County DEIS Position Statement
 Dare County DEIS Position Statement SUMMARY The Dare County Board of Commissioners strongly supports open and accessible beaches for the Cape Hatteras National Seashore Recreational Area. We believe in
A Rising Tide: Conserving Shorebirds and Shorebird Habitat within the Columbia River Estuary
 A Rising Tide: Conserving Shorebirds and Shorebird Habitat within the Columbia River Estuary By Vanessa Loverti USFWS Migratory Birds and Habitat Programs, Portland, Oregon May 28, 2014 Outline of Talk
Assessing the Importance of Wetlands on DoD Installations for the Persistence of Wetland-Dependent Birds in North America (Legacy )
") Assessing the Importance of Wetlands on DoD Installations for the Persistence of Wetland-Dependent Birds in North America (Legacy 12-610) Abstract Wetlands are among the most imperiled ecosystems in the
Assessing the Importance of Wetlands on DoD Installations for the Persistence of Wetland-Dependent Birds in North America (Legacy 12-610) Abstract Wetlands are among the most imperiled ecosystems in the
Wood Stork Nesting Population Survey Results 2016 and Radio-tracking Dice
 Wood Stork Nesting Population Survey Results 2016 and Radio-tracking Dice Sara H. Schweitzer Wildlife Diversity Program North Carolina Wildlife Resources Commission Annika Anderson and Edye Kornegay (NCWRC)
Current Monitoring and Management of Tricolored Blackbirds 1
 Current Monitoring and Management of Tricolored Blackbirds 1 Roy Churchwell, 2 Geoffrey R. Geupel, 2 William J. Hamilton III, 3 and Debra Schlafmann 4 Abstract Tricolored Blackbirds (Agelaius tricolor)
Annual Report to SeaGrant. Agreement No. R/MPA-6B
 Annual Report to SeaGrant Agreement R/MPA-6B 09-015 Baseline Characterization of Newly Established Marine Protected Areas Within the North Central California Study Region - Seabird Colony and Foraging
Golden Eagle (Aquila chrysaetos) Management Indicator Species Assessment Ochoco National Forest
 Management Indicator Species Assessment Ochoco National Forest") Golden Eagle (Aquila chrysaetos) Management Indicator Species Assessment Ochoco National Forest I. Introduction The golden eagle was chosen as a terrestrial management indicator species (MIS) on the Ochoco
Golden Eagle (Aquila chrysaetos) Management Indicator Species Assessment Ochoco National Forest I. Introduction The golden eagle was chosen as a terrestrial management indicator species (MIS) on the Ochoco
Reproductive Success of the American Oystercatcher (Haematopus palliatus) in Texas
 in Texas") Natural Resource Ecology and Management Publications Natural Resource Ecology and Management 12-2014 Reproductive Success of the American Oystercatcher (Haematopus palliatus) in Texas Lianne M. Koczur
Natural Resource Ecology and Management Publications Natural Resource Ecology and Management 12-2014 Reproductive Success of the American Oystercatcher (Haematopus palliatus) in Texas Lianne M. Koczur
STATUS OF SEABIRDS ON SOUTHEAST FARALLON ISLAND DURING THE 2010 BREEDING SEASON
 STATUS OF SEABIRDS ON SOUTHEAST FARALLON ISLAND DURING THE 2010 BREEDING SEASON P.M. Warzybok and R.W. Bradley Marine Ecology Division PRBO Conservation Science 3820 Cypress Drive #11 Petaluma, CA, 94954
Oregon Dunes National Recreation Area BCS Number: 47-5
 Oregon Dunes National Recreation Area BCS Number: 47-5 ***NOTE: We were unable to determine all necessary information for this site description. If you would like to contribute the needed information to
Red-breasted Merganser Minnesota Conservation Summary
 Credit Jim Williams Red-breasted Merganser Minnesota Conservation Summary Audubon Minnesota Spring 2014 The Blueprint for Minnesota Bird Conservation is a project of Audubon Minnesota written by Lee A.
Tiered Species Habitats (Terrestrial and Aquatic)
") Tiered Species Habitats (Terrestrial and Aquatic) Dataset Description Free-Bridge Area Map The Department of Game and Inland Fisheries (DGIF s) Tiered Species Habitat data shows the number of Tier 1, 2
Tiered Species Habitats (Terrestrial and Aquatic) Dataset Description Free-Bridge Area Map The Department of Game and Inland Fisheries (DGIF s) Tiered Species Habitat data shows the number of Tier 1, 2
GULLS WINTERING IN FLORIDA: CHRISTMAS BIRD COUNT ANALYSIS. Elizabeth Anne Schreiber and Ralph W. Schreiber. Introduction
 GULLS WINTERING IN FLORIDA: CHRISTMAS BIRD COUNT ANALYSIS Elizabeth Anne Schreiber and Ralph W. Schreiber Introduction Christmas Bird Counts (CBC's) provide a unique data source for determining long term
Chesapeake Bay adaptation Designing marshes for David Curson, National Audubon Society Erik Meyers, The Conservation Fund
 Chesapeake Bay adaptation Designing marshes for 2100 David Curson, National Audubon Society Erik Meyers, The Conservation Fund Blackwater National Wildlife Refuge Maryland s Everglades Biological Resources:
Bald Eagles Productivity Summary Lake Clark National Park and Preserve Cook Inlet Coastline
 Bald Eagles Productivity Summary 1994-1996 Lake Clark National Park and Preserve Cook Inlet Coastline Introduction: Although the bald eagle (Haliaeetus leucocephalus)is not listed as endangered or threatened
Piping Plover Nesting Results in New Jersey: 2017
 Piping Plover Nesting Results in New Jersey: 2017 Prepared by Emily Heiser, Wildlife Biologist Conserve Wildlife Foundation of New Jersey and Christina Davis, Environmental Specialist II New Jersey Division
Abstract. McGowan, Conor P. Factors affecting nesting success of American Oystercatchers
 Abstract McGowan, Conor P. Factors affecting nesting success of American Oystercatchers (Haematopus palliatus) in North Carolina. (Under the direction of Theodore R. Simons) American Oystercatchers are
STATUS OF SEABIRDS ON SOUTHEAST FARALLON ISLAND DURING THE 2009 BREEDING SEASON
 STATUS OF SEABIRDS ON SOUTHEAST FARALLON ISLAND DURING THE 29 BREEDING SEASON P.M. Warzybok and R.W. Bradley Marine Ecology Division PRBO Conservation Science 382 Cypress Drive #11 Petaluma, CA, 94954
3 March 2015 The Director Sustainable Fisheries Section Department of the Environment GPO Box 787 CANBERRA ACT 2601
 3 March 2015 The Director Sustainable Fisheries Section Department of the Environment GPO Box 787 CANBERRA ACT 2601 SustainableFisheries@environment.gov.au Dear Director, Birdlife Australia welcomes the
Migration Math N79. Theme: Natural History. Author: Loris J. Chen Teacher, North Arlington Middle School. Subject Areas Science, Math
 Migration Math Theme: Natural History Author: Loris J. Chen Teacher, North Arlington Middle School Subject Areas Science, Math Duration 42-minute class period Setting Classroom Skills Reading comprehension,
A Conservation Action Plan For the American Oystercatcher (Haematopus palliatus)
") A Conservation Action Plan For the American Oystercatcher (Haematopus palliatus) for the Atlantic and Gulf Coasts of the United States Version 2.0, June 2007 Shiloh Schulte 1, Stephen Brown 2, Debra Reynolds
A Conservation Action Plan For the American Oystercatcher (Haematopus palliatus) for the Atlantic and Gulf Coasts of the United States Version 2.0, June 2007 Shiloh Schulte 1, Stephen Brown 2, Debra Reynolds
THE SPATIAL AND TEMPORAL DISTRIBUTION OF PIPING PLOVERS IN NEW JERSEY: CHRISTINA LIN KISIEL. A Thesis submitted to the
 THE SPATIAL AND TEMPORAL DISTRIBUTION OF PIPING PLOVERS IN NEW JERSEY: 1987-2007 by CHRISTINA LIN KISIEL A Thesis submitted to the Graduate School-New Brunswick Rutgers, The State University of New Jersey
Upper Klamath National Wildlife Refuge Complex Upper Klamath Unit and Hank s Marsh Unit BCS Number: 48-29
 Oregon Coordinated Aquatic Bird Monitoring: Description of Important Aquatic Bird Site Upper Klamath National Wildlife Refuge Complex Upper Klamath Unit and Hank s Marsh Unit BCS Number: 48-29 Site description
Rocky Reach Wildlife Forum 2017 Wildlife Monitoring Proposal FINAL
 Rocky Reach Wildlife Forum 2017 Wildlife Monitoring Proposal FINAL Background January 13, 2017 During the Rocky Reach Hydroelectric Project (Project 2145) relicensing process, the Public Utility District
ROSEATE SPOONBILL NESTING IN FLORIDA BAY ANNUAL REPORT
 ROSEATE SPOONBILL NESTING IN FLORIDA BAY ANNUAL REPORT 2009-2010 Methods Spoonbill Colony Surveys Forty of the Keys in Florida Bay have been used by Roseate Spoonbills as nesting colonies (Table 1). These
THE SHY ALBATROSS (THALASSARCHE CAUTA):
:") THE SHY ALBATROSS (THALASSARCHE CAUTA): Population Trends, Environmental and Anthropogenic Drivers, and the Future for Management and Conservation Rachael Louise Alderman (B.Sc. Hons) Submitted in fulfilment
THE SHY ALBATROSS (THALASSARCHE CAUTA): Population Trends, Environmental and Anthropogenic Drivers, and the Future for Management and Conservation Rachael Louise Alderman (B.Sc. Hons) Submitted in fulfilment
Ferruginous Hawk Buteo regalis
 Photo by Teri Slatauski Habitat Use Profile Habitats Used in Nevada Sagebrush Pinyon-Juniper (Salt Desert Scrub) Key Habitat Parameters Plant Composition Sagebrush spp., juniper spp., upland grasses and
1. Qualitative Assessment... II-101
 Table of Contents I. Introduction... I-1 A. Session Law 2009-479 / House Bill 709... I-2 B. Public Consultation... I-3 C. Selection of Study Sites... I-5 D. Limitations of Study... I-8 II. Physical Assessment...
Lesser Sandhill Cranes, Annual Summary Homer, Alaska, Summer By Kachemak Crane Watch
 Lesser Sandhill Cranes, Annual Summary Homer, Alaska, Summer 2016 By Kachemak Crane Watch This year s Sandhill Crane season started winding down on September 7 when roughly half of Homer s cranes took
THE COMMON LOON. Population Status and Fall Migration in Minnesota MINNESOTA ORNITHOLOGISTS UNION OCCASIONAL PAPERS: NUMBER 3
 THE COMMON LOON Population Status and Fall Migration in Minnesota MINNESOTA ORNITHOLOGISTS UNION OCCASIONAL PAPERS: NUMBER 3 Edited by Peder H. Svingen and Anthony X. Hertzel THE COMMON LOON Population
AN INSTANCE OF OSPREY BREEDING IN THE TOWN OF HEMPSTEAD
 AN INSTANCE OF OSPREY BREEDING IN THE TOWN OF HEMPSTEAD Introduction Ospreys (Pandion haliaetus) historically have bred on the eastern end of Long Island (Geraud 1843) including Gardiner's, Shelter, Plum,
Farr wind farm: A review of displacement disturbance on dunlin arising from operational turbines
 Farr wind farm: A review of displacement disturbance on dunlin arising from operational turbines 2002-2015. Alan H Fielding and Paul F Haworth September 2015 Haworth Conservation Haworth Conservation Ltd
1.0 Performance Measure Title Wetland Trophic Relationships Wading Bird Nesting Patterns. 2.0 Justification
 1.0 Performance Measure Title Wetland Trophic Relationships Wading Bird Nesting Patterns Last Date Revised: December 2006 2.0 Justification Over the past several decades, wading bird reproduction in the
threatens their survival.
 It s a Tough Life! Adapted with permission from Plover Survival: A Simulation Game. U.S. Fish and Wildlife Service. Grade Level: upper elementary/ middle school Duration: one 50-minute class period Skills:
Humboldt Bay NWR BCS number: 86-4
 Humboldt Bay NWR BCS number: 86-4 ***NOTE: We were unable to determine all necessary information for this site description. If you would like to contribute the needed information to this description, please
REVISED DRAFT - 8/21/00 BIOLOGICAL OPINION ON THE OPERATION OF THE MISSOURI RIVER MAIN STEM RESERVOIR SYSTEM,
 REVISED DRAFT - 8/21/00 BIOLOGICAL OPINION ON THE OPERATION OF THE MISSOURI RIVER MAIN STEM RESERVOIR SYSTEM, OPERATION AND MAINTENANCE OF THE MISSOURI RIVER BANK STABILIZATION AND NAVIGATION PROJECT,
Beach nesting Bird Breeding Census and Report for Coastal Alabama 2007
 National Audubon Society Coastal Bird Conservation Program Beach nesting Bird Breeding Census and Report for Coastal Alabama 27 Margo Zdravkovic National Audubon Society Coastal Bird Conservation Program
Increase of the California Gull Population in the San Francisco Bay and the Impacts on Western Snowy Plovers
 Increase of the California Gull Population in the San Francisco Bay and the Impacts on Western Snowy Plovers Caitlin Robinson-Nilsen, San Francisco Bay Bird Observatory Jill Bluso Demers, San Francisco
Least Tern (Sterna antillarum)
") Least Tern (Sterna antillarum) NMPIF level: Biodiversity Conservation Concern, Level 2 (BC2) NMPIF assessment score: 13 NM stewardship responsibility: Low NAWCP status: High Concern New Mexico BCRs: 35
Least Tern (Sterna antillarum) NMPIF level: Biodiversity Conservation Concern, Level 2 (BC2) NMPIF assessment score: 13 NM stewardship responsibility: Low NAWCP status: High Concern New Mexico BCRs: 35
McKay Creek National Wildlife Refuge BCS number: 48-19
 Oregon Coordinated Aquatic Bird Monitoring: Description of Important Aquatic Bird Site McKay Creek National Wildlife Refuge BCS number: 48-19 Site description author(s) Howard Browers, Supervisory Wildlife
Osprey Nest Abundance, Distribution, and Productivity in Casco Bay
 University of Southern Maine USM Digital Commons Publications Casco Bay Estuary Partnership (CBEP) 2012 Osprey Nest Abundance, Distribution, and Productivity in Casco Bay Chris DeSorbo Follow this and
Loggerhead Shrike (Lanius ludovicianus)
") Loggerhead Shrike (Lanius ludovicianus) NMPIF level: Species Conservation Concern, Level 2 (SC2) NMPIF Assessment score: 14 NM stewardship responsibility: Moderate National PIF status: No special status
Loggerhead Shrike (Lanius ludovicianus) NMPIF level: Species Conservation Concern, Level 2 (SC2) NMPIF Assessment score: 14 NM stewardship responsibility: Moderate National PIF status: No special status
Project summary. Key findings, Winter: Key findings, Spring:
 Summary report: Assessing Rusty Blackbird habitat suitability on wintering grounds and during spring migration using a large citizen-science dataset Brian S. Evans Smithsonian Migratory Bird Center October
The Long Point Causeway: a history and future for reptiles. Scott Gillingwater
 The Long Point Causeway: a history and future for reptiles Scott Gillingwater Environmental Effects Long Point World Biosphere Reserve UNESCO designated the Long Point World Biosphere Reserve in April
Using proxies of anthropogenic disturbance to estimate the distribution of wintering Piping Plovers
 Using proxies of anthropogenic disturbance to estimate the distribution of wintering Piping Plovers Olivia LeDee and Francesca J. Cuthbert Conservation Biology Graduate Program University of Minnesota
PHENOLOGY LESSON TEACHER GUIDE
 PHENOLOGY LESSON TEACHER GUIDE Age Group: Grades 6-12 Learning Objectives: To develop an understanding of the interconnectedness of the three trophic levels To make the connections between climate change
BYRON BIRD BUDDIES. ANNUAL REPORT September 2015 September 2016
 BYRON BIRD BUDDIES ANNUAL REPORT September 2015 September 2016 Byron Bird Buddies (BBB) is a small, self funded community education and conservation group focusing on the preservation of habitat for resident
Species of Greatest Conservation Need Priority Species for NYC Audubon. May 12, Susan Elbin Director of Conservation and Science
 Species of Greatest Conservation Need Priority Species for NYC Audubon May 12, 2011 Susan Elbin Director of Conservation and Science Working List of Species Species on the current federal or state list
2008 San Francisco Bay Shorebird Census
 2008 San Francisco Bay Shorebird Census San Francisco Bay is a great place for shorebirds! The salt ponds, tidal flats, marshes and seasonal wetlands provide important habitat for over a million resident
Nesting success in Ahuriri River
 Nesting success in Ahuriri River V. Smith A report submitted in partial fulfillment of the Post-graduate Diploma in Wildlife Management University of Otago 2006 University of Otago Department of Zoology
Alberta Conservation Association 2011/12 Project Summary Report
 Alberta Conservation Association 2011/12 Project Summary Report Project Name: Piping Plover Recovery Program Wildlife Program Manager: Doug Manzer Project Leader: Lance Engley Primary ACA staff on project:
Pilot effort to develop 2-season banding protocols to monitor black duck vital rates. Proposed by: Black Duck Joint Venture February 2009
 Pilot effort to develop 2-season banding protocols to monitor black duck vital rates. Proposed by: Black Duck Joint Venture February 2009 Prepared by: Patrick Devers, Guthrie Zimmerman, and Scott Boomer
The importance of Port Stephens for shorebirds. Alan Stuart Hunter Bird Observers Club
 The importance of Port Stephens for shorebirds Alan Stuart Hunter Bird Observers Club What we will cover tonight Migratory shorebirds their amazing story What shorebirds occur around Port Stephens? Which
Black Tern Sightings in Minnesota:
 Nongame Wildlife Program Division of Ecological Services Minnesota Department of Natural Resources Black Tern Sightings in Minnesota: 1990-1995 Submitted to the U.S. Fish and Wildlife Service, Region 3
Section 6 Federal Aid to Endangered Species E-1-39 F15AP00438
 Section 6 Federal Aid to Endangered Species E-1-39 F15AP00438 Endangered & Threatened Wildlife Conservation Interim Report, Project Year September 1, 2016 August 31, 2017 NJ Department of Environmental
THE STATUS AND DISTRIBUTION OF BREEDING BALD EAGLES (HALIAEETUS LEUCOCEPHALUS) IN ALABAMA, M. Keith Hudson and Thomas M.
 IN ALABAMA, M. Keith Hudson and Thomas M.") THE STATUS AND DISTRIBUTION OF BREEDING BALD EAGLES (HALIAEETUS LEUCOCEPHALUS) IN ALABAMA, 1985-2006 M. Keith Hudson and Thomas M. Haggerty The number of breeding Bald Eagles (Haliaeetus leucocephalus)
THE STATUS AND DISTRIBUTION OF BREEDING BALD EAGLES (HALIAEETUS LEUCOCEPHALUS) IN ALABAMA, 1985-2006 M. Keith Hudson and Thomas M. Haggerty The number of breeding Bald Eagles (Haliaeetus leucocephalus)
State of the Estuary Report 2015
 1 State of the Estuary Report 2015 Summary PROCESSES Feeding Chicks, Brandt s Cormorant Prepared by Nadav Nur Point Blue Conservation Science State of the Estuary 2015: Processes Brandt s Cormorant Reproductive
Island Habitats for Wading Birds
 Island Habitats for Wading Birds A criticallylimiting resource in the predatorrich northeast coastal zone Katharine C. Parsons Manomet Center for Conservation Sciences Short-distance migrants Most east
Ladd Marsh Wildlife Area BCS number: 49-3
 Oregon Coordinated Aquatic Bird Monitoring: Description of Important Aquatic Bird Site Ladd Marsh Wildlife Area BCS number: 49-3 Site description author M. Cathy Nowak, Ladd Marsh Wildlife Area Biologist
Smith River Mouth BCS number: 86-6
 Smith River Mouth BCS number: 86-6 ***NOTE: We were unable to determine all necessary information for this site description. If you would like to contribute the needed information to this description,
Protecting the Endangered Mount Graham Red Squirrel
 MICUSP Version 1.0 - NRE.G1.21.1 - Natural Resources - First year Graduate - Female - Native Speaker - Research Paper 1 Abstract Protecting the Endangered Mount Graham Red Squirrel The Mount Graham red
Siletz Bay BCS number: 47-29
 Siletz Bay BCS number: 47-29 ***NOTE: We were unable to determine all necessary information for this site description. If you would like to contribute the needed information to this description, please
Effects of Prescribed Burning on Golden-winged Warbler (Vermivora chrysoptera) Habitat and Populations in the Cumberland Mountains
 Habitat and Populations in the Cumberland Mountains") Effects of Prescribed Burning on Golden-winged Warbler (Vermivora chrysoptera) Habitat and Populations in the Cumberland Mountains Confer (1992) North American Breeding Bird Survey -3.36%/yr in U.S. (N=239)
Effects of Prescribed Burning on Golden-winged Warbler (Vermivora chrysoptera) Habitat and Populations in the Cumberland Mountains Confer (1992) North American Breeding Bird Survey -3.36%/yr in U.S. (N=239)
Endangered Species Monitoring - Northern Coastline of New Jersey
 Endangered Species Monitoring - Northern Coastline of New Jersey By: Mark H. Burlas, Sr. Wildlife Biologist U.S. Army Corps of Engineers New York District Planning Division Presentation Format Project
Atlantic. O n t h e. One of the best parts of fall is hearing the cacophony of honking,
 O n t h e Atlantic Flyway Keeping track of New Hampshire s waterfowl is an international affair. One of the best parts of fall is hearing the cacophony of honking, high-flying geese as they pass overhead.