2018 1Q IR PRESENTATION
|
|
|
- Jonathan Barton
- 5 years ago
- Views:
Transcription


1 2018 1Q IR PRESENTATION Investor Relation March 2018

2 Disclaimer These materials have been prepared by GRAVITY Co., Ltd. ("Gravity" or the "Company"). The statements contained in this presentation have not been independently verified. No representations or warranties, express or implied, are made as to, and no reliance should be placed on, the accuracy, fairness or completeness of the information presented or contained in these materials. Neither the Company nor any of its affiliates, advisers or representatives accepts any responsibility whatsoever for any loss or damage arising from any information presented or contained in these materials. The information presented or contained in these materials is subject to change without notice and its accuracy is not guaranteed. The presentations do not constitute an offer or invitation to purchase or subscribe for any shares or other securities of the Company and neither any part of the materials nor any information or statement contained therein shall form the basis of or be relied upon in connection with any contract or commitment whatsoever. Certain statements or other disclosure content in these presentation materials may include, in addition to historical information, "forward-looking statements" within the meaning of the "safe-harbor" provisions of the U.S. Private Securities Litigation Reform Act of Forward-looking statements can generally be identified by the use of forward-looking terminology, such as "may," "will," "expect," "intend," "estimate," "anticipate," "believe," "project," or "continue" or the negative thereof or other similar words, although not all forward-looking statements will contain these words. These forward-looking statements are based on our current assumptions, expectations and projections about future events. All forward-looking statements involve risks and uncertainties that may cause our actual performance, financial condition or results of operations to be materially different from those suggested by the forward-looking statements, including, but not limited to, our ability to diversify revenue; our ability to collect, and in a timely manner, license fees and royalty payments from overseas licensees; our ability to acquire, develop, license, launch, market or operate commercially successful online games; our ability to compete effectively in a highly competitive industry; our ability to anticipate and access technological developments in our industry; our ability to recruit and retain quality employees as we grow; our ability to implement our growth strategies; and economic and political conditions globally. Investors should consider the information contained in our submissions and filings with the United States Securities and Exchange Commission (the "SEC") including our annual report for the fiscal year ended December 31, 2017 on Form 20-F, together with such other documents that we may submit to or file with the SEC from time to time, including on Form 6-K. The forward-looking statements speak only as of this press release and we assume no duty to update them to reflect new, changing or unanticipated events or circumstances.


3 Contents Q Updates Ragnarok M The New Ragnarok Online Q Analysis Operation Results Trend Q Breakdown Q MD&A 2018 Gravity Outlook Upcoming Launchings Global Market Strategy Exhibits Company Overview Financial Statements Subsidiaries/Branch


4 2018 Q Updates Ragnarok M The New Ragnarok Online


5 Q Updates Ragnarok M Launch in Korea on March 14, 2018 Ranked as Top Mobile Game Highly Ranked in Taiwan, HK, Macau Up to No 1 in App Store, No 3 in Play Store Positioned as a Top Selling Mobile Game More than 1,200,000 downloads within a month after the launch Steady Ranking as one of the Top mobile games for more than 6 months Various Game Experience offered with continuous updates Diversified Games Users
 1 3 5 7 9 11 13 ios Android 2017 Launch in Stably")

6 Q Updates Ragnarok M Mobile Games Ranking in Korea( March 15, 2018~ April 27, 2018 by revenues) ios Android 2017 Launch in Stably Positioned as one of the Top Selling Mobile Games M A R 1 4 Successfully Occupying Casual MMROPG M A R 1Market 4,while competing other Top MMORPG games Korea


 New Maps")

7 Q Updates Ragnarok M Ragnarok M Episode 3.0 Update on April 19, 2018 Highlights of Episode 3.0 Update (by revenues) No. 1 War of Emperium Update, the killer contents of Ragnarok M New Game Characters: Rouge(thief) and Alchemist(merchant) New Maps and Extended Leveling System Stronger User Bonds and Games Experiences >> Positive Game Operating Results

8 Q Updates Ragnarok M 2018, the Year of RAGNAROK M NO. of Ragnarok Online ios No.1 Android No.3 ios No.2 Total Games No.20 ios No.1 Android No.1 Country Taiwan Philippines Korea Thailand Brazil China U.S. and Canada Japan Indonesia Russia and CIS Singapore/Malaysia Registered Accounts 12.3M 10.4M 7.7M 7.3M 5.3M 5.1M 5M 4.2M 3.2M 1.4M 1.1M Multi Language Service in 2018 For Major Ragnarok Markets Expected Launch in Japan
 RO Revo Classic -")

9 Q Updates The New Ragnarok Online New Versions of Ragnarok Online, Growth Engine for Online Game Revenues Ragnarok Online : ZERO Launch on December, 2017 Ragnarok Online Revenues highly Increased in Q Based on the current version of Ragnarok Online, developed to reflect old Ragnarok Fans feedbacks Ragnarok Online RE: START (Revo Classic) RO Revo Classic - Launch on July, 2016 in Thailand, July 2017 in Philippines, November 2017 in Singapore and Malaysia Approx. 6,000,0000 Registered IDs RO RE: Start - June, 2017 in North America, January 2018 in Taiwan, Approx. 300,0000 Registered IDs Customized version based on Original version of RO for each market More Launches of New Versions of Ragnarok Online in 2018 Ragnarok Online: ZERO


10 2018 1Q, Analysis Operation Results Trend Revenues Breakdown Q MD&A


11 Q, Analysis Operation Results Trend Revenues Operating Profit 67,521 66,311 4,373 4,820 3,299 3,422 2,941 23,352 27,028 23,722 '17 1Q '17 2Q '17 3Q '17 4Q '18 1Q '17 1Q '17 2Q '17 3Q '17 4Q '18 1Q


12 Q, Analysis Operation Results Trend Net Profit Cash and Short-term Financial Instruments 4,898 61,595 57,397 50,819 3,555 3,549 42,196 45,573 2,696 2,170 '17 1Q '17 2Q '17 3Q '17 4Q '18 1Q '17 1Q '17 2Q '17 3Q '17 4Q '18 1Q


13 Q, Analysis Revenues Breakdown Market Area Korea and Japan Main Markets Revenue Growth in Taiwan and other Asian Markets Diversified Market Area

14 Q, Analysis Revenues Breakdown Game Platforms Q Continues Revenue Growth in both Online and Mobile Games Gravity as a Leading Service Provide in Online and Mobile Game Markets


15 Q, Analysis Q MD&A Q Monthly Revenues, Non-Accrual Base Jan Feb Mar Others Mobile PC Increase in Advertising Expenses related to Ragnarok M in Korea


16 2018 Gravity Outlook Upcoming Launchings Global Market Strategy


17 Gravity Outlook Upcoming Launchings PC Ragnarok Online PC Web Browser Mobile Ragnarok Zero/ Re: Start Ragnarok Prequel (Ragnarok Journey) Ragnarok R Mobile Ragnarok M Mobile Mobile Mobile Mobile RO : Idle Poring Spear of Odin Mobile games based on Ragnarok IP Hillance Quest


18 Gravity Outlook Global Market Strategy Expansion of Global Networks Global game service know-how in more than 80 countries Establishment of Taiwanese Subsidiary (April 13, 2018) Alliance with Russian Licensee->Relaunch of Ragnarok Online US Subsidiary: Game Service in more markets


19 Exhibits Company Information Financial Statements Subsidiaries/Branch
 Employees Business Area 508(Including Subsidiaries, as of March 31, 2018)")

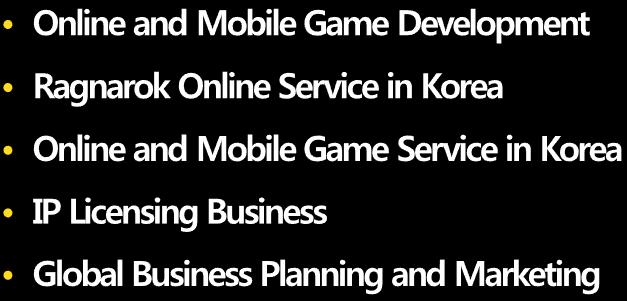
20 01 Exhibits Company Information Date of Establishment April 4, 200 Location Seoul Korea(HQ), Taipei Taiwan(Branch) Employees Business Area 508(Including Subsidiaries, as of March 31, 2018) Development and Publishing of Online Games and Mobile Games IP Licensing Business Character merchandizing and other IT Services Management CEO Hyun Chul Park COO Yoshinori Kitamura CFO Heung Gon Kim

 (13) (79) (1) 196 6 Operating Profit 3,299 4,373 3,422 2,941 4,820 Finance")
21 03 Exhibits Financial Statements Consolidated Statements of Comprehensive Income (IFRS) (In millions of KRW except share and per share data) Revenues 23,352 27,028 23,722 67,521 66,311 Online games subscription revenue 9,855 9,786 9,126 7,661 8,896 Online games royalties and license fees 4,475 3,546 3,492 4,731 4,619 Mobile games and applications 8,063 12,239 9,730 52,592 51,396 Character merchandising, animation and other revenue 959 1,457 1,374 2,537 1,400 Cost of revenues 13,675 15,116 13,922 51,521 45,784 Gross Profit 9,677 11,912 9,800 16,000 20,527 Total operating expenses 6,378 7,539 6,378 13,059 15,707 SG&A 5,528 6,577 4,943 10,964 13,827 R&D expenses 863 1,041 1,436 1,899 1,874 Other costs (income) (13) (79) (1) Operating Profit 3,299 4,373 3,422 2,941 4,820 Finance income Financial costs (452) (195) (1) (804) (293) Profit before income tax expense 3,382 4,560 3,621 2,895 5,117 Income Tax Expense 1,228 1, (2,015) 1,593 Profit for the year 2,154 3,543 2,707 4,910 3,524 Profit (loss) attributable to: Non controlling interest (16) (12) (25) Owners of the Parent Company 2,170 3,555 2,696 4,898 3,549 Earnings (loss) per share basic and diluted: Earnings (loss) per ADS basic and diluted: 624 1, ,410 1,020


22 02 Exhibits Financial Statements Consolidated Statement of Financial Position (IFRS) (In millions of KRW except share and per share data) Assets 62,409 73,397 74, , ,792 Current Assets 60,515 71,372 71, , ,748 Cash and cash equivalents 42,196 45,573 50,819 61,595 57,397 Account receivables, net 15,180 22,689 16,750 42,168 41,811 Others 3,139 3,110 4,395 5,108 5,540 Non Current Assets 1,894 2,025 2,489 7,012 7,044 Property and equipment, net Intangible asset , Deferred tax assets ,036 3,037 Other non-current financial assets ,394 1,384 Others Liabilities 29,912 37,311 35,617 71,885 64,010 Current Liabilities 25,646 29,741 29,022 64,744 57,464 Account Payables 13,056 15,709 13,032 44,410 38,248 Deferred Revenue 10,930 11,871 13,429 16,100 14,639 Others 1,660 2,161 2,561 4,234 4,578 Non Current Liabilities 4,266 7,570 6,595 7,141 6,546 Equity 32,497 36,086 38,836 43,998 47,782 Share capital 3,474 3,474 3,474 3,474 3,474 Capital surplus 27,149 27,149 27,149 27,164 27,164 Other components of equity 2,273 5,830 8,524 (40) 17,511 Retained earnings (Accumulated deficit) , Non-controlling interest (572) (585) (573) (562) (587) Total Liabilities and Equity 62,409 73,397 74, , ,792


23 02 Exhibits Subsidiaries/Branch GRAVITY Communications


24 Investor Relations Contact Information


25
2008 San Francisco Money Show August 7-10, GRAVITY Co., Ltd. (NASDAQ: GRVY)
") 2008 San Francisco Money Show August 7-10, 2008 GRAVITY Co., Ltd. (NASDAQ: GRVY) Disclaimer These materials have been prepared by GRAVITY Co., Ltd. ( Gravity or the Company ), solely for use at the Company
2008 San Francisco Money Show August 7-10, 2008 GRAVITY Co., Ltd. (NASDAQ: GRVY) Disclaimer These materials have been prepared by GRAVITY Co., Ltd. ( Gravity or the Company ), solely for use at the Company
Agenda. Overview Introduction. Group Structure. Market Overview. Financial Highlight FY2015. How & Why to Restructure?
 Disclaimer The information contained in this presentation is for information purposes only and does not constitute an offer or invitation to sell or the solicitation of an offer or invitation to purchase
First Quarter CY 2012 Results. May 9, 2012
 First Quarter CY 2012 Results May 9, 2012 2012 Activision Blizzard 1 Safe Harbor Disclosure Please review our SEC filings on Form 10-K and Form 10-Q The statements contained in this presentation that are
First Quarter 2014 Results
 First Quarter 04 Results May 6, 04 Safe Harbor Disclosure Please review our SEC filings on Form 0-K and Form 0-Q The statements contained in this presentation that are not historical facts are forward-looking
Agenda. Company Overview. 2015Q1 Financial Results. Business Review and Prospects
 Disclaimer This presentation and the accompanying slides (the Presentation ) which have been prepared by IGG INC (the Company ) do not constitute any offer or invitation to purchase or subscribe for any
Fourth Quarter 2013 Results. February 6, 2014
 Fourth Quarter 2013 Results February 6, 2014 Safe Harbor Disclosure Please review our SEC filings on Form 10-K and Form 10-Q The statements contained in this presentation that are not historical facts
First Quarter 2013 Results May 8, 2013
 First Quarter 2013 Results May 8, 2013 Safe Harbor Disclosure Please review our SEC filings on Form 10-K and Form 10-Q The statements contained in this presentation that are not historical facts are forward-looking
Second Quarter 2013 Results August 1, 2013
 Second Quarter 203 Results August, 203 2 Safe Harbor Disclosure Please review our SEC filings on Form 0-K and Form 0-Q The statements contained in this presentation that are not historical facts are forward-looking
Capcom Co., Ltd. (Tokyo Stock Exchange, First Section, 9697) 3rd Quarter Report Fiscal year ending March 31, 2018
 3rd Quarter Report Fiscal year ending March 31, 2018") Capcom Co., Ltd. (Tokyo Stock Exchange, First Section, 9697) 3rd Quarter Report Fiscal year ending March 31, 2018 0 Forward-looking Statements Strategies, plans, outlooks and other statements that are
Capcom Co., Ltd. (Tokyo Stock Exchange, First Section, 9697) 3rd Quarter Report Fiscal year ending March 31, 2018 0 Forward-looking Statements Strategies, plans, outlooks and other statements that are
Investor Conference, 2017
 Code:4994 X-Legend Entertainment Co., Ltd. Investor Conference, 2017 President: Chou Chun-Nan 2017/11/23 Legal Disclaimer The information contained in this presentation, including all forward-looking information,
Table of Contents. 1. 4Q13 Earnings Summary - Financial Highlights. 2. Service & Business Strategy. 3. Mobile 4. PC. 5. Appendix
 1 Table of Contents 1. 4Q13 Earnings Summary - Financial Highlights 2. Service & Business Strategy 3. Mobile 4. PC - Developing Quality Contents - Growth Strategy - Expanding Development - CGP & Investment
IR Presentation. March 2014
 IR Presentation March 2014 1 Table of Contents 1. 4Q13 Earnings Summary - Financial Highlights 2. Service & Business Strategy 3. Mobile 4. PC - Developing Quality Contents - Growth Strategy - Expanding
Interim Results. IGG Inc August 2018
 Interim Results IGG Inc August 2018 1 Disclaimer This presentation and the accompanying slides (the Presentation ) do not constitute any offer or invitation to purchase or subscribe for any securities,
Capcom Co., Ltd. (Tokyo Stock Exchange, First Section, 9697) Financial Highlights for the Fiscal Year ended March 31, 2016
 Financial Highlights for the Fiscal Year ended March 31, 2016") Capcom Co., Ltd. (Tokyo Stock Exchange, First Section, 9697) Financial Highlights for the Fiscal Year ended March 31, 2016 0 0 Forward-looking Statements Strategies, plans, outlooks and other statements
Capcom Co., Ltd. (Tokyo Stock Exchange, First Section, 9697) Financial Highlights for the Fiscal Year ended March 31, 2016 0 0 Forward-looking Statements Strategies, plans, outlooks and other statements
Forgame Holdings Limited
 Happiness anytime, anywhere Forgame Holdings Limited Management Presentation November 2013 Business Overview Unique Model Integrating Development and Publishing Attractive Financial Performance Development:
Explanation on FY2018 Q3
 Explanation on FY2018 (2017/10/01 2017/12/31) Gala Inc. 2018/02/09 This is a translation Copyright Gala Inc., All rights reserved 1 I. Financial Statement III. Gala Group Structure Copyright Gala Inc.,
Capcom Co., Ltd. (Tokyo Exchanges, First Section, 9697) 3rd Quarter Report Fiscal year ending March 31, 2016
 3rd Quarter Report Fiscal year ending March 31, 2016") Capcom Co., Ltd. (Tokyo Exchanges, First Section, 9697) 3rd Quarter Report Fiscal year ending March 31, 2016 0 Forward-looking Statements Strategies, plans, outlooks and other statements that are not historical
Capcom Co., Ltd. (Tokyo Exchanges, First Section, 9697) 3rd Quarter Report Fiscal year ending March 31, 2016 0 Forward-looking Statements Strategies, plans, outlooks and other statements that are not historical
Third Quarter 2014 Results
 Third Quarter 204 Results November 4, 204 Safe Harbor Disclosure Please review our SEC filings on Form 0-K and Form 0-Q The statements contained in this presentation that are not historical facts are forward-looking
January September Summary
 January September 2012 - Summary Consolidated revenue for the period is 60 239 KSEK, up 93% compared to 31 207 KSEK for the same period of 2011. This is in line with the previously communicated forecast
The resulting net sales were 87,170 million yen (up 13.2% from the previous fiscal year).
.") Attachment contents 1. Operating results overview 2 (1) Operating results for the fiscal year under review. 2 (2) Financial position overview for the fiscal year under review. 4 (3) Cash flow overview
Attachment contents 1. Operating results overview 2 (1) Operating results for the fiscal year under review. 2 (2) Financial position overview for the fiscal year under review. 4 (3) Cash flow overview
Third Quarter CY 2012 Results
 Third Quarter CY 2012 Results November 7, 2012 2012 Activision Blizzard 1 Safe Harbor Disclosure Please review our SEC filings on Form 10-K and Form 10-Q The statements contained in this presentation that
Annual General Meeting Wednesday, January 13, 2010
 Annual General Meeting Wednesday, January 13, 2010 Safe Harbour Disclosure To the extent any statements made in this presentation contain information that is not historical; these statements are forward-looking
2 nd Quarter Earnings Conference Call
 2 nd Quarter Earnings Conference Call KKR & Co. Inc. Investor Update July 26, 2018 Recent Milestones K-1 $ Converted to a Corporation on July 1, 2018 Investor Day held on July 9, 2018 2 Key Metrics Assets
Capcom Co., Ltd. (Tokyo Stock Exchange, First Section, 9697) Financial Highlights for the Fiscal Year ended March 31, 2018
 Financial Highlights for the Fiscal Year ended March 31, 2018") Capcom Co., Ltd. (Tokyo Stock Exchange, First Section, 9697) Financial Highlights for the Fiscal Year ended March 31, 2018 0 0 Forward-looking Statements Strategies, plans, outlooks and other statements
Capcom Co., Ltd. (Tokyo Stock Exchange, First Section, 9697) Financial Highlights for the Fiscal Year ended March 31, 2018 0 0 Forward-looking Statements Strategies, plans, outlooks and other statements
Second Quarter CY 2012 Results. August 2, 2012
 Second Quarter CY 2012 Results August 2, 2012 1 Safe Harbor Disclosure Please review our SEC filings on Form 10-K and Form 10-Q The statements contained in this presentation that are not historical facts
Capcom Co., Ltd. (Tokyo Stock Exchange, First Section, 9697) Overview of Strategies and Plans Fiscal Year ending March 31, 2017
 Overview of Strategies and Plans Fiscal Year ending March 31, 2017") Capcom Co., Ltd. (Tokyo Stock Exchange, First Section, 9697) Overview of Strategies and Plans Fiscal Year ending March 31, 2017 0 0 Forward-looking Statements Strategies, plans, outlooks and other statements
Capcom Co., Ltd. (Tokyo Stock Exchange, First Section, 9697) Overview of Strategies and Plans Fiscal Year ending March 31, 2017 0 0 Forward-looking Statements Strategies, plans, outlooks and other statements
Content Ⅰ. OVERVIEW. Ⅱ. SNG & Mobile Game. Ⅲ. Online Game. Ⅳ. Appendix. Company Overview Business Overview Strategic Goals
 INVESTOR RELATIONS 2012 Content Ⅰ. OVERVIEW Company Overview Business Overview Strategic Goals Ⅱ. SNG & Mobile Game R&D Superiority Global Expansion Strategy - Domestic Strategy - Japan Ⅲ. Online Game
Financial Results Briefing Session
 Financial Results Briefing Session Six-Month Period Ended September 30, 2017 November 8, 2017 SQUARE ENIX HOLDINGS CO., LTD. Statements made in this document with respect to SQUARE ENIX HOLDINGS CO., LTD.
January June Summary
 January June 2012 - Summary Consolidated revenue for the period is 36 082 KSEK, up 89% compared to 19 142 KSEK for the same period of 2011. This is in line with the previously communicated forecast of
Activision Blizzard Announces Better-Than-Expected Second Quarter 2012 Financial Results
 Activision Blizzard Announces Better-Than-Expected Second Quarter 2012 Financial Results Company Had The Top Three Best-Selling Games in North America and Europe For First Six Months of 20121 SANTA MONICA,
Wood Group Investor Briefing Q1 2016
 Wood Group Investor Briefing Q1 2016 Our business Wood Group is an international projects, production and specialist technical solutions provider with around $6bn sales and 36,000 employees. We are focused
LONG TERM VALUE CREATION BLAKE JORGENSEN, CFO
 LONG TERM VALUE CREATION BLAKE JORGENSEN, CFO SAFE HARBOR STATEMENT This presentation contains forward-looking statements that are subject to change. Statements including words such as anticipate, "believe,
Investor Presentation Q1 2014
 Investor Presentation Q1 2014 May 13, 2014 NEXON Co., Ltd. CEO Message New management team has conducted extensive bottoms-up review of the business Strengths: Unparalleled experience and knowledge in
4 th Quarter Earnings Conference Call
 4 th Quarter Earnings Conference Call KKR & Co. Inc. Investor Update February 1, 2019 Key Metrics Assets Under Management Management Fees ($ in billions) ($ in millions) $195 $1,069 $168 $905 $100 $107
4Q February 2011
 4Q 2010 28 February 2011 2 Disclaimer forward looking statements This presentation contains forward-looking statements that involve risks and uncertainties. All statements other than statements of historical
January March Summary
 January March 2012 - Summary Consolidated revenue for the period is 17 388 KSEK, up 82% compared to 9 548 KSEK for the same period of 2011. This is 1% above the previously communicated forecast of 17.2
CAYENNETECH. Investor Conference 2018/10/30
 CAYENNETECH 4946 Investor Conference 2018/10/30 Disclaimer All the related information and forward-looking information from this slides and presentation, including future outlook, financial statement,
Capcom Co., Ltd. (Tokyo Exchanges, First Section, 9697) 3rd Quarter Report Fiscal year ending March 31, 2014
 3rd Quarter Report Fiscal year ending March 31, 2014") Capcom Co., Ltd. (Tokyo Exchanges, First Section, 9697) 3rd Quarter Report Fiscal year ending March 31, 2014 0 Forward-looking Statements Strategies, plans, outlooks and other statements that are not historical
Capcom Co., Ltd. (Tokyo Exchanges, First Section, 9697) 3rd Quarter Report Fiscal year ending March 31, 2014 0 Forward-looking Statements Strategies, plans, outlooks and other statements that are not historical
Second Quarter 2014 Results
 Second Quarter 2014 Results August 5, 2014 Safe Harbor Disclosure Please review our SEC filings on Form 10-K and Form 10-Q The statements contained in this presentation that are not historical facts are
Textron Reports Second Quarter 2014 Income from Continuing Operations of $0.51 per Share, up 27.5%; Revenues up 23.5%
 Textron Reports Second Quarter 2014 Income from Continuing Operations of $0.51 per Share, up 27.5%; Revenues up 23.5% 07/16/2014 PROVIDENCE, R.I.--(BUSINESS WIRE)-- Textron Inc. (NYSE: TXT) today reported
Capcom Co., Ltd. (Tokyo Stock Exchange, First Section, 9697) Overview of Strategies and Plans Fiscal Year ending March 31, 2019
 Overview of Strategies and Plans Fiscal Year ending March 31, 2019") Capcom Co., Ltd. (Tokyo Stock Exchange, First Section, 9697) Overview of Strategies and Plans Fiscal Year ending March 31, 2019 0 0 Forward-looking Statements Strategies, plans, outlooks and other statements
Capcom Co., Ltd. (Tokyo Stock Exchange, First Section, 9697) Overview of Strategies and Plans Fiscal Year ending March 31, 2019 0 0 Forward-looking Statements Strategies, plans, outlooks and other statements
Activision Blizzard Announces Record First Quarter Financial Results
 Activision Blizzard Announces Record First Quarter Financial Results - Q1 and EPS Ahead of Prior Year and Prior - - Q1 GAAP EPS Increased 40% and Non-GAAP EPS Up 44% Over Prior Year - - Q1 from Digital
KKR & Co. L.P. Morgan Stanley Financials Conference: June 13, 2018
 KKR & Co. L.P. Morgan Stanley Financials Conference: June 13, 2018 ($ in trillions) KKR Growth in Alternative Asset Market Share KKR AUM +20% CAGR +21% CAGR Alternative AUM +12% CAGR $190 (1) ($ in billions)
Safe Harbor Disclosure
 Safe Harbor Disclosure Please review our SEC filings on Form 10-K and Form 10-Q The statements contained in this presentation that are not historical facts are forward-looking statements. The company generally
KKR and FS Investments Form Strategic BDC Partnership Creates the Leading $18BN Alternative Lending Platform. December 2017
 KKR and FS Investments Form Strategic BDC Partnership Creates the Leading $18BN Alternative Lending Platform December 2017 Strategic BDC Partnership Introduction On December 11, 2017, KKR and FS Investments
4 th Quarter Earnings Conference Call
 4 th Quarter Earnings Conference Call KKR & Co. L.P. Investor Update February 8, 2018 4Q17 Reflections Fundamentals Are Strong (Dollars in millions, except per unit amounts and unless otherwise stated)
Third Quarter CY 2010 Results. November 04, 2010
 Third Quarter CY 2010 Results November 04, 2010 Safe Harbor Disclosure The statements contained in this presentation that are not historical facts are forward-looking statements. The company generally
Confirms 2013 Financial Guidance
 Confirms 2013 Financial Guidance PROVIDENCE, R.I.--(BUSINESS WIRE)--Jul. 17, 2013-- Textron Inc. (NYSE: TXT) today reported second quarter 2013 income from continuing operations of $0.40 per share, compared
Textron Reports Third Quarter 2014 Income from Continuing Operations of $0.57 per Share, up 62.9%; Revenues up 18.1%
 Textron Reports Third Quarter Income from Continuing Operations of $0.57 per Share, up 62.9%; Revenues up 18.1% 10/17/ PROVIDENCE, R.I.--(BUSINESS WIRE)-- Textron Inc. (NYSE: TXT) today reported third
PATENT PROPERTIES ANNOUNCES SECOND QUARTER 2015 RESULTS. Announces Name Change to Walker Innovation Inc.
 PATENT PROPERTIES ANNOUNCES SECOND QUARTER 2015 RESULTS Announces Name Change to Walker Innovation Inc. Announces Name Change of its United States Patent Utility Service to Haystack IQ Trial Usage of New
KKR & Co. L.P. Goldman Sachs U.S. Financial Services Conference: December 6, 2017
 KKR & Co. L.P. Goldman Sachs U.S. Financial Services Conference: December 6, 2017 KKR Growth in Alternative Asset Market Share KKR AUM +20% CAGR Alternative AUM +12% CAGR ($ in trillions) ($ in billions)
Asiasoft Corporation PLC. (AS)
") Asiasoft Corporation PLC. (AS) Asiasoft Talk 2013 13 th March 2013 Disclaimer Agenda The information contained in this presentation is for information purposes only and does not constitute an offer or
Asiasoft Corporation PLC. (AS) Asiasoft Talk 2013 13 th March 2013 Disclaimer Agenda The information contained in this presentation is for information purposes only and does not constitute an offer or
January September Summary
 January September 2011 - Summary Consolidated revenue for the period is 31 207 KSEK (12 065 KSEK in Q3, 9 594 KSEK in Q2, 9 548 KSEK in Q1), up 112% compared to 14 707 KSEK for the same period of 2010.
Accenture plc (Exact name of registrant as specified in its charter)
") UNITED STATES SECURITIES AND EXCHANGE COMMISSION Washington, DC 20549 Form 8-K CURRENT REPORT Pursuant to Section 13 OR 15(d) of the Securities Exchange Act of 1934 Date of Report (Date of earliest event
UNITED STATES SECURITIES AND EXCHANGE COMMISSION Washington, DC 20549 Form 8-K CURRENT REPORT Pursuant to Section 13 OR 15(d) of the Securities Exchange Act of 1934 Date of Report (Date of earliest event
Activision Blizzard Reports December Quarter and Calendar Year 2009 Financial Results
 Activision Blizzard Reports December Quarter and Calendar Year 2009 Financial Results - Company Announces $1 Billion Share Repurchase Program - - Annual Cash Dividend of $0.15 per Common Share - - For
Delivering the Turnaround. Leigh Junk - Managing Director February 2018
 Delivering the Turnaround Leigh Junk - Managing Director February 2018 Cautionary Statement This presentation has been prepared by Doray Minerals Limited ( Doray ) to provide an update regarding the company
Activision Blizzard Announces Better-than-expected First Quarter 2012 Financial Results
 Activision Blizzard Announces Better-than-expected First Quarter 2012 Financial Results - Skylanders Spyro's Adventure was #1 Kids Video Game for First Quarter 2012 with 30+ Million Toys Sold Life to Date
Textron Reports First Quarter 2016 Income from Continuing Operations of $0.55 per Share, up 19.6%; Reaffirms 2016 Financial Outlook
 Textron Reports First Quarter 2016 Income Continuing Operations of $0.55 per Share, up 19.6%; Reaffirms 2016 Financial Outlook April 20, 2016 06:30 AM Eastern Daylight Time PROVIDENCE, R.I.--(BUSINESS
Results Presentation 2017 Second Quarter and Interim Results. 30 Aug, 2017
 Results Presentation 2017 Second Quarter and Interim Results 30 Aug, 2017 Disclaimer This presentation is prepared by NetDragon Websoft Holdings Limited (the Company ) solely for information purposes and
Capcom Co., Ltd. Tokyo and Osaka Exchanges, First Section, rd Quarter Report Fiscal year ending March 31, 2010
 Capcom Co., Ltd. Tokyo and Osaka Exchanges, First Section, 9697 3rd Quarter Report Fiscal year ending March 31, 2010 Precautions Concerning Forward-looking Statements Strategies, plans, outlooks and other
4 th Quarter Earnings Conference Call
 4 th Quarter Earnings Conference Call KKR & Co. L.P. Investor Update February 11, 2016 Gross Returns $1B+ Carry Paying Funds Q4 and 2015 Performance Market Indices Private Equity Real Assets Alternative
Reference Materials Nine Month Period Ended December 31, 2018
 Reference Materials Nine Month Period Ended December 31, 2018 February 5, 2019 SQUARE ENIX HOLDINGS CO., LTD. Statements made in this document with respect to SQUARE ENIX HOLDINGS CO., LTD. and its consolidated
Cherry AB. Investing in a broad gaming portfolio. CEO Anders Holmgren GP Bullhound 6 December 2017
 Cherry AB Investing in a broad gaming portfolio CEO Anders Holmgren GP Bullhound 6 December 2017 The game is on Cherry is investing in a broad portfolio of online gaming companies Cherry s strategy is
KKR & Co. Inc. Goldman Sachs U.S. Financial Services Conference December 4, 2018
 KKR & Co. Inc. Goldman Sachs U.S. Financial Services Conference December 4, 2018 KKR Today Private Markets Public Markets Capital Markets Principal Activities $104bn AUM $91bn AUM Global Franchise $19bn
Investor Presentation Q3 2015
 Investor Presentation Q3 205 November 3, 205 NEXON Co., Ltd. Owen Mahoney President and Chief Executive Officer 2 Q3 Key Highlights Q3 results exceeded our outlook PC: Strong execution of key titles in
Capcom Co., Ltd. (Tokyo Exchanges, First Section, 9697) Results of Operations and Strategies First half of fiscal year ending March 31, 2014
 Results of Operations and Strategies First half of fiscal year ending March 31, 2014") Capcom Co., Ltd. (Tokyo Exchanges, First Section, 9697) Results of Operations and Strategies First half of fiscal year ending March 31, 2014 0 Forward-looking Statements Strategies, plans, outlooks and
Capcom Co., Ltd. (Tokyo Exchanges, First Section, 9697) Results of Operations and Strategies First half of fiscal year ending March 31, 2014 0 Forward-looking Statements Strategies, plans, outlooks and
SOLID FOUNDATION, SUSTAINABLE FUTURE
 LINTEC ANNUAL REPORT 2016 For the fiscal year ended March 31, 2016 SOLID FOUNDATION, SUSTAINABLE FUTURE LINTEC Contents Editorial Policy 1 COVER STORY OUR VALUE CREATION 8 Performance Highlights 10 MANAGEMENT
A Presentation for Prospective Investors & Partners. Feb 2004
 A Presentation for Prospective Investors & Partners Feb 2004 Overview Financial Highlights Services & Products Company Profile Shareholding Structure Neowiz at a Glance Management 2004 Outlook Company
International development
 Oslo 8 th September 2015 Vicky McNiff Head of IP Slide 1 This is Aker Solutions Global provider of products, systems and services to the oil and gas industry Built on more than 170 years of industrial
Disclaimer forward looking statements
 1Q 2011 25 May 2011 Disclaimer forward looking statements This presentation contains forward-looking statements that involve risks and uncertainties. All statements other than statements of historical
Linekong Interactive Group Co., Ltd.
 Linekong Interactive Group Co., Ltd. (Incorporated in the Cayman Islands with limited liability) Stock code: 8267.HK Interim Results Presentation 2015 2015.08.11 1H Review of 2015 Review of Development
FY2005 Results Briefing Session. May 24, 2006
 FY2005 Results Briefing Session May 24, 2006 1 Statements made in this document with respect to SQUARE ENIX CO., LTD. and consolidated subsidiaries' (together, "SQUARE ENIX") plans, estimates, strategies
Analyst meeting materials 3rd quarter, FY2012. Gala Inc. 2012/2/10
 Analyst meeting materials 3rd quarter, FY2012 Gala Inc. 2012/2/10 Topics 1. 3rd quarter results 2. Online games business, highlights 3. Future efforts Copyright GALA Inc. All rights reserved. 1 1. 3rd
Q Results July 27, 2006
 Q2 2006 Results July 27, 2006 Agenda 1. Highlights in Q2 2. Market update 3. Financials 4. Game demo 2 Key financial summary Revenue growth from Dreamfall and Anarchy Online Revenues of TUSD 4,611 in Q2/06,
Investor Presentation Q4 2016
 Investor Presentation February 0, 207 Owen Mahoney President and Chief Executive Officer 2 . Scale of Asian Games Market and Value of Nexon IP the West $46Bn Asia $47Bn Games market size as of 206 (Source:
Capcom Co., Ltd. (Tokyo Exchanges, First Section, 9697) Results of Operations and Strategies First half of fiscal year ending March 31, 2015
 Results of Operations and Strategies First half of fiscal year ending March 31, 2015") Capcom Co., Ltd. (Tokyo Exchanges, First Section, 9697) Results of Operations and Strategies First half of fiscal year ending March 31, 2015 0 Forward-looking Statements Strategies, plans, outlooks and
Capcom Co., Ltd. (Tokyo Exchanges, First Section, 9697) Results of Operations and Strategies First half of fiscal year ending March 31, 2015 0 Forward-looking Statements Strategies, plans, outlooks and
Nexon Investor Presentation Q NEXON Co., Ltd.
 Nexon Investor Presentation Q3 2012 NEXON Co., Ltd. Q3 2012 Results 2 Highlights Quarterly revenue of 24.2 bn and operating income of 10.0 bn Revenues flat YoY, up 3% on constant currency basis, slightly
RAZER INC. CORPORATE PRESENTATION
 RAZER INC. CORPORATE PRESENTATION LEGAL DISCLAIMER Potential investors and shareholders (the Potential Investors and Shareholders ) of Razer Inc. (the Company ) are reminded that information contained
Helping People Worldwide Build their Financial Security
 Invesco Distinctive worldwide investment management capabilities Helping People Worldwide Build their Financial Security Helping People Worldwide Build their Financial Security CP-HK-e-Q209 The size and
Q Interim Report
 Interim Report Aug 15, Today s presenter: Lars Wingefors Co-Founder & Group CEO 1 highlights Net sales SEK 837m EBITDA SEK 207m EBIT SEK 53m YoY growth 878% YoY growth 421% YoY growth 73% 10 releases in
Second Quarter CY 2010 Results. August 05, 2010
 Second Quarter CY 2010 Results August 05, 2010 Safe Harbor Disclosure The statements contained in this presentation that are not historical facts are forward-looking statements. The company generally uses
Provided by. RESEARCH ON INTERNATIONAL MARKETS We deliver the facts you make the decisions
 Provided by April 2015 PREFACE Market reports by ystats.com inform top managers about recent market trends and assist with strategic company decisions. A list of advantages ystats.com provides secondary
S&T AG Company Presentation
 S&T AG Company Presentation Hannes Niederhauser, CEO Richard Neuwirth, CFO December 2017 About S&T 1 S&T provides IoT 4.0 technology S&T offers vertical IoT solutions and security appliances for Industrial/Infotainment/Smart
January September Summary
 January September 2010 - Summary Consolidated revenue for the period January-September 2010 is 14 707 KSEK, up 94% compared to 7 596 KSEK for the same period of 2009. Operating result for the period January-September
4 th Quarter Earnings Conference Call
 4 th Quarter Earnings Conference Call KKR & Co. L.P. Investor Update February 9, 2017 Healthy Level of New Capital Raised Year-Over-Year Capital Inflows Driving Asset Growth ($ in billions) $92 +11% $101
KKR Credit Advisors (Ireland) Unlimited Company PILLAR 3 DISCLOSURES
 Unlimited Company PILLAR 3 DISCLOSURES") KKR Credit Advisors (Ireland) Unlimited Company KKR Credit Advisors (Ireland) Unlimited Company PILLAR 3 DISCLOSURES JUNE 2017 1 1. Background The European Union Capital Requirements Directive ( CRD or
KKR Credit Advisors (Ireland) Unlimited Company KKR Credit Advisors (Ireland) Unlimited Company PILLAR 3 DISCLOSURES JUNE 2017 1 1. Background The European Union Capital Requirements Directive ( CRD or
Capcom Co., Ltd. (Tokyo and Osaka Exchanges, First Section, 9697) 1st Quarter Report Fiscal year ending March 31, 2013
 1st Quarter Report Fiscal year ending March 31, 2013") Capcom Co., Ltd. (Tokyo and Osaka Exchanges, First Section, 9697) 1st Quarter Report Fiscal year ending March 31, 2013 0 Forward-looking Statements Information in these materials concerning strategies,
Capcom Co., Ltd. (Tokyo and Osaka Exchanges, First Section, 9697) 1st Quarter Report Fiscal year ending March 31, 2013 0 Forward-looking Statements Information in these materials concerning strategies,
Financial Presentation (First Half of the Year Ending March 31, 2014) FIELDS CORPORATION. (November 7, 2013) JASDAQ Standard 2767
 FIELDS CORPORATION. (November 7, 2013) JASDAQ Standard 2767") FIELDS CORPORATION 2nd quarter (7. 2013 9. 2013) Financial Presentation (First Half of the Year Ending March 31, 2014) FIELDS CORPORATION (November 7, 2013) JASDAQ Standard 2767 The Greatest Leisure for
FIELDS CORPORATION 2nd quarter (7. 2013 9. 2013) Financial Presentation (First Half of the Year Ending March 31, 2014) FIELDS CORPORATION (November 7, 2013) JASDAQ Standard 2767 The Greatest Leisure for
Financial Results Briefing FY Q
 Financial Results Briefing FY 2013 (April 1, 2012 thru June 30, 2012) Gala Inc. August 10, 2012 Today s topics I. 1st quarter results II. 1st quarter business report III. Future efforts I. 1st quarter
Outline of Results Briefing by SQUARE ENIX and TAITO CORPORATION held on November 18, 2005
 FY 2005 First-Half Year Results Briefing Session We will now begin the briefing on SQUARE ENIX CO., LTD. ( SQUARE ENIX ) and TAITO CORPORATION ( TAITO ) for the fiscal 2005 interim period ended September
JOINT ANNOUNCEMENT CONNECTED TRANSACTION
 The Stock Exchange takes no responsibility for the contents of this announcement, makes no representation as to its accuracy or completeness and expressly disclaims any liability whatsoever for any loss
Financial Results Six-Month Period Ended September 30, 2013
 1 Statements made in this document with respect to SQUARE ENIX HOLDINGS CO., LTD. and its consolidated subsidiaries' (together, SQUARE ENIX GROUP") plans, estimates, strategies and beliefs are forward-looking
Activision Announces Second Quarter 2006 Results
 Activision Announces Second Quarter 2006 Results - Company's Q2 Results Exceed Outlook - - Company Increases FY 2006 Revenue Outlook - SANTA MONICA, Calif., Nov 02, 2005 /PRNewswire-FirstCall via COMTEX
Cherry AB. The most complete gaming company Partnering with entrepreneurs to explore exciting ideas
 Cherry AB The most complete gaming company Partnering with entrepreneurs to explore exciting ideas CEO Anders Holmgren & CFO Christine Rankin Copenhagen 10 January 2018 Investment case Positive outlook
GAMEVIL s 4 th Quarter of 2014 Financial Results & Strategic Plans for February 10, 2015
 GAMEVIL s 4 th Quarter of 2014 Financial Results & Strategic Plans for 2015 February 10, 2015 Disclaimer Some content may reflect forward-looking statements and have been prepared based on the expectations
Scienti c Games Debuts First Skill- Based Slot Machine with Classic Arcade Video Game Favorite -- SPACE INVADERS
 Scienti c Games Debuts First Skill- Based Slot Machine with Classic Arcade Video Game Favorite -- SPACE INVADERS Innovative new slot integrates authentic alien shooter bonus game, free games, and an option
FY2018 Financial Results
 Financial Results Fiscal Year ended March 31, 2018 KONAMI HOLDINGS CORPORATION May 10, 2018 Cautionary statement with respect to forward-looking statements Statements made in this presentation with respect
KOHLBERG CAPITAL CORPORATION. May 2007
 KOHLBERG CAPITAL CORPORATION May 2007 Safe Harbor Statement Private Securities Litigation Reform Act of 1995 Forward Looking Information This presentation may include forward-looking statements. These
DBS GROUP HOLDINGS LTD. 15 th Annual General Meeting & Extraordinary General Meeting. 28 April 2014
 DBS GROUP HOLDINGS LTD 15 th Annual General Meeting & Extraordinary General Meeting 28 April 2014 1 Creating Shared Value Piyush Gupta, Chief Executive Officer April 28, 2014 Disclaimer: The information
Q November 12th 2008
 Q3 2008 November 12th 2008 Disclaimer Forward looking statements This presentation contains forward-looking statements that involve risks and uncertainties. All statements other than statements of historical