Acoustical Testing 1
|
|
|
- Matthew Quinn
- 5 years ago
- Views:
Transcription


1 Material Study By: IRINEO JAIMES TEAM ANDREW MILLER SAM SHROYER NATHAN NEGRU ERICH PFISTER Acoustical Testing 1 Dr. Lauren Ronsse, Dr. Dominique Chéenne 11/05/2014
2 Table of Contents Abstract. 3 Introduction....3 Test Method and Modifications.. 4 Measurement set up and Equipment Room Modal Frequency Analysis..10 Results.. 11 Equations..13 Conclusion 14 Appendix...15
3 ABSTRACT The purpose of this experiment was to find absorption coefficient of Sonofiber Auralex panels. Parameters presented in The Standard Method for Sound Absorption and Sound Absorption Coefficients by the Reverberation Room Method (Designation: c423-00) paper were followed but limitations due to a pre-existing pillar and unavailable equipment required modifications to the parameters. INTRODUCTION The main focus of this experiment was to determine the absorption coefficient of Sonofiber Auralex absorption panels from 100Hz to 5000Hz using parameters set forth by The Standard Method for Sound Absorption and Sound Absorption Coefficients by the Reverberation Room Method (Designation: c420-00) paper. The team was able to calculate the absorption coefficients of the panels with some modifications to the parameters to best fit the property of the CCC chamber and to accommodate for a pre-existing pillar in the room. Columbia College Chicago s reverb chamber is located in the basement of 33 East Congress Parkway. The 72ft^2 (6.69m) area of the room dimensions, Sonofiber panels, and microphone positions are depicted in Figure 1.
4 TESTING METHOD AND MODIFICATIONS Figure 1: plan view of CCC reverb chamber Table 1 has been created in order to compare the standard vs. implemented parameters. In the right column (Test Standard) are the parameters, on the right column (CCC reverb Chamber) is the application of the standard and adjustments made. TEST STANDARDS 1) Volume - Room should be no less than 125 m^3 or ft^3 2) Diffuse Sound Field - Satisfactory approximation can be achieved with sound reflectors hung or distributed with random orientations about the volume of room. - Experience has shown that a satisfactory approximation can be achieved with a number of sound-reflective panels hung or distributed with random orientation. CCC REVERB CHAMBER Volume CCC reverb chamber is m^3 or ft^3 Reflection panels were not available, concluded that the present diffuse sound field in the CCC reverb chamber was close to desired diffuse sound field. *Pre -existing pillar prevent the microphones from receiving equal amounts of energy from all directions by causing unwanted early reflections
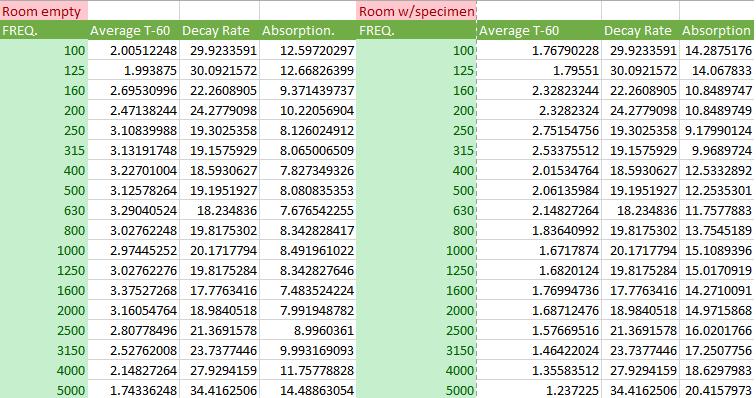
5 3) Background Noise Level - Level shall be 15dB below lowest level used to calculate decay rate. 4) A-Mounting for Specimen - The specimen can be placed on floor but should avoid placing in center of the room or avoid specimen sides being parallel to any other walls. 5) Distance From Surfaces - No part of the specimen shall be closer than 2.5ft (.75m) to a reflective surface. 6) Mic Measurements - Fixed microphone needs 5 measurements at 35 different positions which are at least 5ft (1.524m) apart. 7) Mic Distance From Specimen - Fixed microphone shall be at least 1.5ft (.0457m) from surface of the test specimen. 8) Relative Humidity - Relative humidity in the room shall be greater than 40% during the test. 9) Room Construction - The room is best constructed of massive masonry or concrete materials, but other materials, such as well-damped steel, may be used. Lighter construction may be excessively absorptive at 200Hz. 10) Microphone - The microphone or microphones used to measure decay rate shall be omnidirectional with a flat ( + 1 db within any one-third octave band) 11) Measurement of sound absorption coefficient - The average absorption coefficient of the room surfaces at each frequency, determined by Absorption of the empty room area of the room surfaces Highest level was 115dB *Lowest background noise level was at 33dB at 100Hz. Figure 1, shows the placement of the specimen. The Sonofiber Auralex absorption panels were not placed in the center and avoided and avoided the specimen s sides from being parallel to any wall. The closest distance the specimen was to a reflective surface was approximately 4ft well above 2.5ft (.75m). Figure 1 shows microphone positions, and their relative position to one another. All microphones were positioned 5ft (1.524m) above specimen. Relative humidity was at 45% *Temperature was at 73% Previously the CCC reverb chamber was a bank vault and later converted. Walls made up of composite steel with an air gap behind it followed by a concrete wall. ECM800 ( specifications of microphone located in appendix) Absorption Absorption - Empty Room coefficient
6 Shall be less than or equal to.05 12) Test Signal - The test signal shall be band of random noise with continuous spectrum covering the range over which measurements are made. The frequency range of the measurements shall include the onethird octave bands with mid-band frequencies, as defined in ANSI S1.0 from 100Hz to 5000Hz Using pink noise generated by SpectraPlus, measurements from 40Hz to 20000Hz were gathered. For test purposes, absorption coefficients from 100Hz to 5000Hz were the focus. Table 1: Conditions to qualify a room as a diffuse field compared with the conditions present/followed in the CCC reverb chamber tests Measurement set up and Equipment For test microphone an ECM8000 was used as stated in Table 1. A Motu Interface (828MK3) was used to provided a high quality signal. Figure 2: Motu interface converts analog to digital, providing good quality single


7 Four test speakers were used to produce sound in the reverberation chamber. The speakers where placed facing the corners of the reverberation chamber to create diffusion. Figure 3: Mackie speaker facing room corners The test specimen was Sonofiber Auralex Panels. The configuration of the specimen is shown in Figure 4. Figure 4: Sonofiber (72ft^2) panel, made up of 18 (2ft x 2ft) panels Aviom An-16/I were used to connect the inputs and outputs from the modeling lab to the reverberation chamber. - Figure 5: visual representation of Aviom An-16/i

8 SpectraPlus tone generator was used to excite the room with pink noise. The test microphone would then pick up the excitation then redirected back into SpectraPlus where its algorithms calculated decay time for specific frequencies. Figure 6: Computer connected through patchbay in modeling lab to patchbay in reverb chamber. Figure 7: Signal chain flow diagram of test
9 db Figure 7 is the signal chain diagram. A single tone was generated. SpectraPlus in this case generated pink noise. The tone went through signal processors, then played through the speakers in the reverberation chamber. The microphone in the reverberation chamber picked up the frequency energy content and then went back into signal processors and into SpectraPlus, where SpectraPlus calculated T-60 Values. Prior to testing, background noise levels was measured to satisfy condition 3 from Table 1. LEQ levels were measured in the CCC reverb chamber for 2 minutes. Longer LEQ could have been achieved, however, the CCC reverb chamber is located in the basement of Columbia College Chicago. The only outside interference that could have created drastic changes in background noise level would have been the CTA train, located in close proximity to the building. The low frequency boost would have occurred below 100Hz and would not be a factor in the final test result if the train happened to run by while testing SPL (db re 20uPA) Freq (Hz) Figure 8: LEQ levels for the given frequencies [numerical values are located in appendix]
10 The highest LEQ value was measured at 100 Hz at approximately 33 db. With the standard only requiring the lowest level used to calculate decay rate to be 15 db below the highest value of LEQ, the test signals generated in the chamber was at 115 db. With decay rate levels reaching 95dB at the lowest, well above the noise floor present. Satisfying the background noise level condition, microphone positions were chosen based on condition 7 & 10 from Table 1. For each microphone position, (Mic-[B thru F], 5 measurements were calculated by SpectraPlus. T-60 values for both CCC reverb chamber empty and CCC reverb chamber with specimen+, with a total of fifty T-60 values. Taking the average of each microphone s T-60 values, decay rate, absorption of room, absorption of material, and absorption coefficient of the specimen can be derived. Calculations located in Table 2.1 in appendix. Refer to the section Equations in report to review individual formulas. ROOM MODEL FREQUENCY ANALYSIS To get a better understanding of possible sound pressure level differences, the lowest modal frequencies were calculated. Mode # (Length, Width, Height) Frequency 1, 0, , 1, , 0, , 1, , 0, , 1, , 0, , 0, , 1, , 0, Table 2: under the equations section, Equation 1 was used
11 Seconds (s) When audibly testing mode (0, 1, 0), by walking throughout the room, a sound pressure level different did occur mid-way in the width (x) dimension, as predicted by the calculation. However, throughout the room unpredictable sound pressure level drops were audibly heard. Reviewing T-60 values for the same frequency at different microphone positions yields decay rate discrepancies from one microphone to the next. RESULTS The unexpected sound pressure level drops can be better understood by graphing T-60 values vs frequencies Figure Mic-B Mic-C Mic-D Mic-E Mic-F Freq (Hz) Figure 9: T-60 over each frequency tested in the CCC reverb chamber The chart, in a perfectly diffuse sound field with no interference from axial modes would have all 5 of the microphone curves layered on top of one another and theoretically just be one plotted curve. Figure 9 shows just how much T-60 differed throughout the room. The outlined
12 section covering roughly 1 2 khz, has peaks that varied when they should have been similar. The differences in T-60 values at different parts of the room were taken into account when reviewing final results. 1.2 Abs. Coefficient Figure 10: absorption coefficients of Sonofiber panels from 100Hz to 5000Hz, numerical values in Table 1.1 in Appendix Reviewing the Absorption Coefficients from Figure 10, the Sonofiber ability to reduce T-60 between 1 khz and 4 khz is high, with a roll-off happening out of this range. The expectation was below 500Hz the effectiveness of the material to reduce T-60 values would decrease due to low frequency properties. With these findings it was concluded the Sonofiber panels are great to place within an environment requiring T-60 values to be as low as possible around 1 khz to 4 KHz, in many cases would be a vocal performance space. Surprisingly, with varying T-60 values throughout the room the results did not produce skewed final absorption coefficient results.
13 EQUATIONS Equation 1 calculates axial modes, given the dimensions of the room. Equation 2 calculates the speed of sound when given temperature in Fahrenheit. Equation 3 calculates the decay rate, time it takes a signal to decay 60 db. Equation 4 calculates total absorption of the room when decay rate, speed of sound, and volume are known. Equation 5 calculates the total absorption due to the specimen. Equation 6 calculates the absorption coefficient of the specimen. Equation 1: Modal Frequencies = C ( l 2 Lx )2 + ( m Ly )2 + ( n Lz )2 l = Length integer w = width integer h = height integer [Hz] C= Speed of Sound Lx = length of room Ly = width of room Lz = height of room Equation 2: Speed of Sound = Temperature(Fahrenheit) [ft/s] Equation 3: Equation 4: Decay Rate = 60dB T60 [db/seconds] Total Absorption for both empty & with specimen = C = Speed of sound.921 (V)(Decay Rate) C V= Volume [Sabine] Equation 5: Specimen Total Absorption = [Total Abs. w/specimen - Total Abs. empty] [Sabine]
14 Equation 6: Absorption Coefficient of Specimen = Specimen Total Absorption Area of Specimen [Sabine/ft^2] *Area of specimen (Sonofiber Auralex panels) = 72 ft^2 or 6.69 m^2 *Volume of CCC reverb chamber = m^3 or ft^3 *Temperature = 73 degrees Fahrenheit CONCLUSION The focus of the paper was to find the absorption coefficient of the Sonofiber Auralex panels by averaging calculated T-60 values throughout the reverb chamber. With a less than ideal diffuse sound field modifications to the The Standard Method for Sound Absorption and Sound Absorption Coefficients by the Reverberation Room Method (Designation: c423-00) still yielded reliable applicable absorption coefficients. Finally Sonofiber Auralex absorption panels are great for vocal performance spaces. For future studies an addition of reflection panels to the reverb chamber capable of eliminating axial modes would yield more accurate results. Expanding the test method to include a frequency sweep and an impulse response can offer more useful data to analyze. Gathering data about the modal properties of the CCC reverb chamber can prevent poor microphone placement.
15 Appendix * LEQ Values (numerical values for figure 8) Freq. (Hz) SPL (db re 20uPA) Freq. (Hz) SPL(dB re 20uPA)

16 Table 1.1 Table 2.1
17 Frequency response and directionality of microphone EMC-8000 Behringer
Non-Anechoic Testing Environment
 Non-Anechoic Testing Environment Acoustical Testing 1 Dr. Lauren Ronsse, Dr. Dominique Chéenne November 15 th, 2014 By: IRINEO JAIMES TEAM: CHRIS KEZON, HAYDEN JUBERA, NATHAN NEGRU 1 Table of Contents
Acoustical Testing I Loudspeaker Study
 Acoustical Testing I Loudspeaker Study Submitted to: Dr. Dominique Chéenne & Dr. Lauren Ronsse Columbia College Chicago November 19 th, 2014 By: Andrew Hulva Cody Elston, Daniel O Brien, Erich Pfister
Reverberation time and structure loss factor
 Reverberation time and structure loss factor CHRISTER HEED SD2165 Stockholm October 2008 Marcus Wallenberg Laboratoriet för Ljud- och Vibrationsforskning Reverberation time and structure loss factor Christer
The Speaker Study. By: Jay Bliefnick. Acoustical Testing 1. Attn: Dr. Dominique Chéenne, Dr. Lauren Ronsse. Group Members:
 The Speaker Study By: Jay Bliefnick Acoustical Testing 1 Attn: Dr. Dominique Chéenne, Dr. Lauren Ronsse Group Members: Hannah Knorr, Michael Hanson, Matt Johnson, Miles Possing, & Ming Yu 11/27/13 Table
Case study for voice amplification in a highly absorptive conference room using negative absorption tuning by the YAMAHA Active Field Control system
 Case study for voice amplification in a highly absorptive conference room using negative absorption tuning by the YAMAHA Active Field Control system Takayuki Watanabe Yamaha Commercial Audio Systems, Inc.
SIA Software Company, Inc.
 SIA Software Company, Inc. One Main Street Whitinsville, MA 01588 USA SIA-Smaart Pro Real Time and Analysis Module Case Study #2: Critical Listening Room Home Theater by Sam Berkow, SIA Acoustics / SIA
TBM - Tone Burst Measurement (CEA 2010)
") TBM - Tone Burst Measurement (CEA 21) Software of the R&D and QC SYSTEM ( Document Revision 1.7) FEATURES CEA21 compliant measurement Variable burst cycles Flexible filtering for peak measurement Monitor
TBM - Tone Burst Measurement (CEA 21) Software of the R&D and QC SYSTEM ( Document Revision 1.7) FEATURES CEA21 compliant measurement Variable burst cycles Flexible filtering for peak measurement Monitor
ODEON APPLICATION NOTE ISO Open plan offices Part 2 Measurements
 ODEON APPLICATION NOTE ISO 3382-3 Open plan offices Part 2 Measurements JHR, May 2014 Scope This is a guide how to measure the room acoustical parameters specially developed for open plan offices according
ONLINE TUTORIALS. Log on using your username & password. (same as your ) Choose a category from menu. (ie: audio)
 Choose a category from menu. (ie: audio)") ONLINE TUTORIALS Go to http://uacbt.arizona.edu Log on using your username & password. (same as your email) Choose a category from menu. (ie: audio) Choose what application. Choose which tutorial movie.
ONLINE TUTORIALS Go to http://uacbt.arizona.edu Log on using your username & password. (same as your email) Choose a category from menu. (ie: audio) Choose what application. Choose which tutorial movie.
Please refer to the figure on the following page which shows the relationship between sound fields.
 Defining Sound s Near The near field is the region close to a sound source usually defined as ¼ of the longest wave-length of the source. Near field noise levels are characterized by drastic fluctuations
THE ANV MEASUREMENT SYSTEMS SOUND INSULATION TESTING SYSTEM INSTRUCTION MANUAL FOR FIELD TESTING OF WALLS, FLOORS & STAIRS
 THE ANV MEASUREMENT SYSTEMS SOUND INSULATION TESTING SYSTEM INSTRUCTION MANUAL FOR FIELD TESTING OF WALLS, FLOORS & STAIRS HASTINGS HOUSE, AUCKLAND PARK, MILTON KEYNES, MK1 1BU 01908 642846 01908 642814
Supplementary User Manual for BSWA Impedance Tube Measurement Systems
 Supplementary User Manual for BSWA Impedance Tube Measurement Systems 1 P age Contents Software Installation... 3 Absorption Measurements -- ASTM Method... 4 Hardware Set-Up... 4 Sound card Settings...
Introduction to Equalization
 Introduction to Equalization Tools Needed: Real Time Analyzer, Pink noise audio source The first thing we need to understand is that everything we hear whether it is musical instruments, a person s voice
CHAPTER 3 THE DESIGN OF TRANSMISSION LOSS SUITE AND EXPERIMENTAL DETAILS
 35 CHAPTER 3 THE DESIGN OF TRANSMISSION LOSS SUITE AND EXPERIMENTAL DETAILS 3.1 INTRODUCTION This chapter deals with the details of the design and construction of transmission loss suite, measurement details
Improving room acoustics at low frequencies with multiple loudspeakers and time based room correction
 Improving room acoustics at low frequencies with multiple loudspeakers and time based room correction S.B. Nielsen a and A. Celestinos b a Aalborg University, Fredrik Bajers Vej 7 B, 9220 Aalborg Ø, Denmark
Monitor Setup Guide The right monitors. The correct setup. Proper sound.
 Monitor Setup Guide 2017 The right monitors. The correct setup. Proper sound. Table of contents Genelec Key Technologies 3 What is a monitor? 4 What is a reference monitor? 4 Selecting the correct monitors
Experimental Investigation on the Effect of Origami Geometry on the Acoustic Characteristics
 Experimental Investigation on the Effect of Origami Geometry on the Acoustic Characteristics NURUL FARHANAH MUARAT, MOHAMED HUSSEIN, RAJA ISHAK RAJA HAMZAH, ZAIR ASRAR AHMAD, MOHD ZARHAMDY MD ZAIN, *NORASIKIN
Revision of ISO Standards on field sound insulation testing. Carl Hopkins
 Revision of ISO Standards on field sound insulation testing Carl Hopkins COST FP0702 & TU0901 meeting, EMPA, November 2011 Why revise the field testing Standards? Editorial reasons Introduction of the
FREQUENCY RESPONSE AND LATENCY OF MEMS MICROPHONES: THEORY AND PRACTICE
 APPLICATION NOTE AN22 FREQUENCY RESPONSE AND LATENCY OF MEMS MICROPHONES: THEORY AND PRACTICE This application note covers engineering details behind the latency of MEMS microphones. Major components of
Measuring procedures for the environmental parameters: Acoustic comfort
 Measuring procedures for the environmental parameters: Acoustic comfort Abstract Measuring procedures for selected environmental parameters related to acoustic comfort are shown here. All protocols are
Airborne Sound Insulation
 Airborne Sound Insulation with XL2-TA Sound Level Meter This application note describes the verification of the airborne sound insulation in buildings with the XL2-TA Sound Level Meter. All measurements
Small Room and Loudspeaker Interaction
 The common questions Several common questions are often asked related to loudspeaker s sound reproduction, such as: 1. Why does a loudspeaker sound different when moved to another room? 2. Why does my
Mei Wu Acoustics. By Mei Wu and James Black
 Experts in acoustics, noise and vibration Effects of Physical Environment on Speech Intelligibility in Teleconferencing (This article was published at Sound and Video Contractors website www.svconline.com
Acoustics. Randy Zimmerman Chief Engineer
 Acoustics Randy Zimmerman Chief Engineer Instructor Randy Zimmerman Chief Engineer 972.212.4811 rzimmerman@titus-hvac.com What You Will Learn Sound power vs sound pressure Sound quality AHRI 880/885 NC
ROOM SHAPE AND SIZE ESTIMATION USING DIRECTIONAL IMPULSE RESPONSE MEASUREMENTS
 ROOM SHAPE AND SIZE ESTIMATION USING DIRECTIONAL IMPULSE RESPONSE MEASUREMENTS PACS: 4.55 Br Gunel, Banu Sonic Arts Research Centre (SARC) School of Computer Science Queen s University Belfast Belfast,
Pre- and Post Ringing Of Impulse Response
 Pre- and Post Ringing Of Impulse Response Source: http://zone.ni.com/reference/en-xx/help/373398b-01/svaconcepts/svtimemask/ Time (Temporal) Masking.Simultaneous masking describes the effect when the masked
In-Ear Monitors using VRT Transducers A market survey
 In Ear Headphones Study In-Ear Monitors using VRT Transducers A market survey Intent It is the intention of this document to do a small scale survey of the marketplace in regards to in-ear monitors (IEM)
ODEON APPLICATION NOTE Calculation of Speech Transmission Index in rooms
 ODEON APPLICATION NOTE Calculation of Speech Transmission Index in rooms JHR, February 2014 Scope Sufficient acoustic quality of speech communication is very important in many different situations and
Orion E-STA Acoustic Test: Evaluating Predictions Against Data
 Orion E-STA Acoustic Test: Evaluating Predictions Against Data Samantha Bittinger NASA Glenn Research Center Cleveland, OH LMD/Structural Dynamics Branch June 20, 2017 samantha.bittinger@nasa.gov 216-433-8168
ECMA-108. Measurement of Highfrequency. emitted by Information Technology and Telecommunications Equipment. 5 th Edition / December 2010
 ECMA-108 5 th Edition / December 2010 Measurement of Highfrequency Noise emitted by Information Technology and Telecommunications Equipment Reference number ECMA-123:2009 Ecma International 2009 COPYRIGHT
MEASURING SOUND INSULATION OF BUILDING FAÇADES: INTERFERENCE EFFECTS, AND REPRODUCIBILITY
 MEASURING SOUND INSULATION OF BUILDING FAÇADES: INTERFERENCE EFFECTS, AND REPRODUCIBILITY U. Berardi, E. Cirillo, F. Martellotta Dipartimento di Architettura ed Urbanistica - Politecnico di Bari, via Orabona
Application Note 7. Digital Audio FIR Crossover. Highlights Importing Transducer Response Data FIR Window Functions FIR Approximation Methods
 Application Note 7 App Note Application Note 7 Highlights Importing Transducer Response Data FIR Window Functions FIR Approximation Methods n Design Objective 3-Way Active Crossover 200Hz/2kHz Crossover
Room Acoustics. March 27th 2015
 Room Acoustics March 27th 2015 Question How many reflections do you think a sound typically undergoes before it becomes inaudible? As an example take a 100dB sound. How long before this reaches 40dB?
ALTERNATING CURRENT (AC)
") ALL ABOUT NOISE ALTERNATING CURRENT (AC) Any type of electrical transmission where the current repeatedly changes direction, and the voltage varies between maxima and minima. Therefore, any electrical
ALL ABOUT NOISE ALTERNATING CURRENT (AC) Any type of electrical transmission where the current repeatedly changes direction, and the voltage varies between maxima and minima. Therefore, any electrical
Loudspeaker Array Case Study
 Loudspeaker Array Case Study The need for intelligibility Churches, theatres and schools are the most demanding applications for speech intelligibility. The whole point of being in these facilities is
A mobile reverberation cabin for acoustic measurements in an existing anechoic room
 A mobile reverberation cabin for acoustic measurements in an existing anechoic room Elsa PIOLLET 1 ; Simon LAROCHE 2 ; Marc-Antoine BIANKI 3 ; Annie ROSS 4 1,2,3,4 Ecole Polytechnique de Montreal, Canada
EQ s & Frequency Processing
 LESSON 9 EQ s & Frequency Processing Assignment: Read in your MRT textbook pages 403-441 This reading will cover the next few lessons Complete the Quiz at the end of this chapter Equalization We will now
SOUND FIELD MEASUREMENTS INSIDE A REVERBERANT ROOM BY MEANS OF A NEW 3D METHOD AND COMPARISON WITH FEM MODEL
 SOUND FIELD MEASUREMENTS INSIDE A REVERBERANT ROOM BY MEANS OF A NEW 3D METHOD AND COMPARISON WITH FEM MODEL P. Guidorzi a, F. Pompoli b, P. Bonfiglio b, M. Garai a a Department of Industrial Engineering
Holographic Measurement of the Acoustical 3D Output by Near Field Scanning by Dave Logan, Wolfgang Klippel, Christian Bellmann, Daniel Knobloch
 Holographic Measurement of the Acoustical 3D Output by Near Field Scanning 2015 by Dave Logan, Wolfgang Klippel, Christian Bellmann, Daniel Knobloch LOGAN,NEAR FIELD SCANNING, 1 Introductions LOGAN,NEAR
The vibration transmission loss at junctions including a column
 The vibration transmission loss at junctions including a column C. Crispin, B. Ingelaere, M. Van Damme, D. Wuyts and M. Blasco Belgian Building Research Institute, Lozenberg, 7, B-19 Sint-Stevens-Woluwe,
ABSORPTION MEASUREMENTS FOR TWO TABLE SCREENS FROM GÖTESSONS INDUSTRI AB
 Akustikverkstan AB, Fabriksgatan 4, 531 30 Lidköping, SWEDEN, phone: 0510-911 44 Report 17-091-R2 2017-05-03 3 pages, 2 appendices carl.nyqvist@akustikverkstan.se Direct: 070-938 00 45 ABSORPTION MEASUREMENTS
Aalborg Universitet. Published in: Acustica United with Acta Acustica. Publication date: Document Version Early version, also known as pre-print
 Downloaded from vbn.aau.dk on: april 08, 2018 Aalborg Universitet Low frequency sound field control in rectangular listening rooms using CABS (Controlled Acoustic Bass System) will also reduce sound transmission
ECMA-108. Measurement of Highfrequency. emitted by Information Technology and Telecommunications Equipment. 4 th Edition / December 2008
 ECMA-108 4 th Edition / December 2008 Measurement of Highfrequency Noise emitted by Information Technology and Telecommunications Equipment COPYRIGHT PROTECTED DOCUMENT Ecma International 2008 Standard
UBL S119 LOUDSPEAKER SYSTEM
 UBL S119 LOUDSPEAKER SYSTEM To audio professionals, the name JBL means loudspeakers that can be depended on to deliver the finest audio performance day in and day out. JBL is the first choice for recording
An Investigation on Factors That Cause Error in Reverberation Time Measurement (ISO 3382) in UTHM Lecturer Room
 in UTHM Lecturer Room") An Investigation on Factors That Cause Error in Reverberation Time Measurement (ISO 3382) in UTHM Lecturer 1 Azalan. A 1, a, Ghazali. M. I 1, Jafferi. N 1 Universiti Tun Hussein Onn Malaysia (UTHM) 86400
An Investigation on Factors That Cause Error in Reverberation Time Measurement (ISO 3382) in UTHM Lecturer 1 Azalan. A 1, a, Ghazali. M. I 1, Jafferi. N 1 Universiti Tun Hussein Onn Malaysia (UTHM) 86400
Direct Field Acoustic Test (DFAT)
") Paul Larkin May 2010 Maryland Sound International 4900 Wetheredsville Road Baltimore, MD 21207 410-448-1400 Background Original motivation to develop a relatively low cost, accessible acoustic test system
Paul Larkin May 2010 Maryland Sound International 4900 Wetheredsville Road Baltimore, MD 21207 410-448-1400 Background Original motivation to develop a relatively low cost, accessible acoustic test system
RD75, RD50, RD40, RD28.1 Planar magnetic transducers with true line source characteristics
 RD75, RD50, RD40, RD28.1 Planar magnetic transducers true line source characteristics The RD line of planar-magnetic ribbon drivers represents the ultimate thin film diaphragm technology. The RD drivers
Acoustic Calibration Service in Automobile Field at NIM, China
 Acoustic Calibration Service in Automobile Field at NIM, China ZHONG Bo National Institute of Metrology, China zhongbo@nim.ac.cn Contents 1 Overview of Calibration Services 2 Anechoic Room Calibration
Active Control of Energy Density in a Mock Cabin
 Cleveland, Ohio NOISE-CON 2003 2003 June 23-25 Active Control of Energy Density in a Mock Cabin Benjamin M. Faber and Scott D. Sommerfeldt Department of Physics and Astronomy Brigham Young University N283
Technical Data Measurement Microphones
 Technical Data s Consisting of Type Classification according IEC 61672 and ANSI S1.4 Capsule / Transducer Maximum SPL @ THD 3%, 1 khz 22 Certified MA220 + MC230 or MC230A Capsule Certified -WP Outdoor
Response spectrum Time history Power Spectral Density, PSD
 A description is given of one way to implement an earthquake test where the test severities are specified by time histories. The test is done by using a biaxial computer aided servohydraulic test rig.
What you Need: Exel Acoustic Set with XL2 Analyzer M4260 Measurement Microphone Minirator MR-PRO
 How To... Handheld Solution for Installed Sound This document provides a practical guide on how to use NTi Audio instruments for commissioning and servicing Installed Sound environments and Evacuation
(i) Sine sweep (ii) Sine beat (iii) Time history (iv) Continuous sine
 Sine sweep (ii) Sine beat (iii) Time history (iv) Continuous sine") A description is given of one way to implement an earthquake test where the test severities are specified by the sine-beat method. The test is done by using a biaxial computer aided servohydraulic test
A description is given of one way to implement an earthquake test where the test severities are specified by the sine-beat method. The test is done by using a biaxial computer aided servohydraulic test
Proceedings of Meetings on Acoustics
 Proceedings of Meetings on Acoustics Volume 19, 2013 http://acousticalsociety.org/ ICA 2013 Montreal Montreal, Canada 2-7 June 2013 Noise Session 4aNSa: Effects of Noise on Human Performance and Comfort
Transfer Function (TRF)
") (TRF) Module of the KLIPPEL R&D SYSTEM S7 FEATURES Combines linear and nonlinear measurements Provides impulse response and energy-time curve (ETC) Measures linear transfer function and harmonic distortions
(TRF) Module of the KLIPPEL R&D SYSTEM S7 FEATURES Combines linear and nonlinear measurements Provides impulse response and energy-time curve (ETC) Measures linear transfer function and harmonic distortions
Low frequency sound reproduction in irregular rooms using CABS (Control Acoustic Bass System) Celestinos, Adrian; Nielsen, Sofus Birkedal
 Celestinos, Adrian; Nielsen, Sofus Birkedal") Aalborg Universitet Low frequency sound reproduction in irregular rooms using CABS (Control Acoustic Bass System) Celestinos, Adrian; Nielsen, Sofus Birkedal Published in: Acustica United with Acta Acustica
Aalborg Universitet Low frequency sound reproduction in irregular rooms using CABS (Control Acoustic Bass System) Celestinos, Adrian; Nielsen, Sofus Birkedal Published in: Acustica United with Acta Acustica
APPLICATION NOTE. Making Accurate Voltage Noise and Current Noise Measurements on Operational Amplifiers Down to 0.1Hz. Abstract
 APPLICATION NOTE Making Accurate Voltage Noise and Current Noise Measurements on Operational Amplifiers Down to 0.1Hz AN1560 Rev.1.00 Abstract Making accurate voltage and current noise measurements on
Understanding Sound System Design and Feedback Using (Ugh!) Math by Rick Frank
 Math by Rick Frank") Understanding Sound System Design and Feedback Using (Ugh!) Math by Rick Frank Shure Incorporated 222 Hartrey Avenue Evanston, Illinois 60202-3696 (847) 866-2200 Understanding Sound System Design and
Understanding Sound System Design and Feedback Using (Ugh!) Math by Rick Frank Shure Incorporated 222 Hartrey Avenue Evanston, Illinois 60202-3696 (847) 866-2200 Understanding Sound System Design and
Microphone a transducer that converts one type of energy (sound waves) into another corresponding form of energy (electric signal).
 into another corresponding form of energy (electric signal).") 1 Professor Calle ecalle@mdc.edu www.drcalle.com MUM 2600 Microphone Notes Microphone a transducer that converts one type of energy (sound waves) into another corresponding form of energy (electric signal).
1 Professor Calle ecalle@mdc.edu www.drcalle.com MUM 2600 Microphone Notes Microphone a transducer that converts one type of energy (sound waves) into another corresponding form of energy (electric signal).
A White Paper on Danley Sound Labs Tapped Horn and Synergy Horn Technologies
 Tapped Horn (patent pending) Horns have been used for decades in sound reinforcement to increase the loading on the loudspeaker driver. This is done to increase the power transfer from the driver to the
Measuring Instrument Combinations
 PISTONPHONE START/STOP GRP NUM SLM RTA CAL LIGHT STORE MENU 1 FREQ WEIGHT TIME PUSH ON OFF ENT MODE 2 PAUSE/CONT 4 LEVEL 3 POWER PISTONPHONE Measuring Instrument Combinations 1 2 Acoustic Measurement Calibration
Rub & Buzz Detection with Golden Unit AN 23
 Rub & Buzz etection with Golden Unit A 23 Application ote to the KLIPPEL R& SYSTEM Rub & buzz effects are unwanted, irregular nonlinear distortion effects. They are caused by mechanical or structural defects
Production Noise Immunity
 Production Noise Immunity S21 Module of the KLIPPEL ANALYZER SYSTEM (QC 6.1, db-lab 210) Document Revision 2.0 FEATURES Auto-detection of ambient noise Extension of Standard SPL task Supervises Rub&Buzz,
How To... Commission an Installed Sound Environment
 How To... Commission an Installed Sound Environment This document provides a practical guide on how to use NTi Audio instruments for commissioning and servicing Installed Sound environments and Evacuation
12. PRELAB FOR INTERFERENCE LAB
 12. PRELAB FOR INTERFERENCE LAB 1. INTRODUCTION As you have seen in your studies of standing waves, a wave and its reflection can add together constructively (peak meets peak, giving large amplitude) or
ANGKASA Reverberation Acoustic Chamber Characterization
 ANGKASA Reverberation Acoustic Chamber Characterization ADHWA AMIR TAN, NURLIZA SALIM, NOOR HIDAYAH TAUHID AHMAD, SYAHRIM AZHAN IBRAHIM, MASZLAN ISMAIL Space System Development and Operation Division National
PART I: The questions in Part I refer to the aliasing portion of the procedure as outlined in the lab manual.
 Lab. #1 Signal Processing & Spectral Analysis Name: Date: Section / Group: NOTE: To help you correctly answer many of the following questions, it may be useful to actually run the cases outlined in the
Validation of lateral fraction results in room acoustic measurements
 Validation of lateral fraction results in room acoustic measurements Daniel PROTHEROE 1 ; Christopher DAY 2 1, 2 Marshall Day Acoustics, New Zealand ABSTRACT The early lateral energy fraction (LF) is one
Errata to Procedural Standard for Sound & Vibration Measurement 2015 Third Edition
 Errata to Procedural Standard for Sound & Vibration Measurement 2015 Third Edition Correction Sheet #1 Issued 01 July 2018 Copyright 2018 by NEBB All rights reserved. Published 2018. Printed in the United
THE SPEAKER. The decibel scale is related to the physical sound intensity measured in watts/cm 2 by the following equation:
 OBJECTIVES: THE SPEAKER 1) Know the definition of "decibel" as a measure of sound intensity or power level. ) Know the relationship between voltage and power level measured in decibels. 3) Illustrate how
8th AIAA/CEAS Aeroacoustics Conference June 16 18, 2002/Breckenridge, CO
 AIAA 22-2416 Noise Transmission Characteristics of Damped Plexiglas Windows Gary P. Gibbs, Ralph D. Buehrle, Jacob Klos, Sherilyn A. Brown NASA Langley Research Center, Hampton, VA 23681 8th AIAA/CEAS
New ON/OFF Absorption Technology That Includes Low Frequencies
 Toronto, Canada International Symposium on Room Acoustics 2013 June 9-11 ISRA 2013 New ON/OFF Absorption Technology That Includes Low Frequencies Niels W. Adelman-Larsen (nwl@flexac.com) Flex Acoustics
Measurement of Weighted Harmonic Distortion HI-2
 Measurement of Weighted Harmonic Distortion HI-2 Application Note for the R&D and QC SYSTEM (Document Revision 1.2) AN 7 DESCRIPTION The weighted harmonic distortion HI-2 can be measured by using the DIS-Pro
MICROPHONE TECHNIQUES
 A Shure Educational Publication MICROPHONE TECHNIQUES 1 GENERAL RULES Microphone Techniques Microphone technique is largely a matter of personal taste whatever method sounds right the particular instrument,
Holographic Measurement of the 3D Sound Field using Near-Field Scanning by Dave Logan, Wolfgang Klippel, Christian Bellmann, Daniel Knobloch
 Holographic Measurement of the 3D Sound Field using Near-Field Scanning 2015 by Dave Logan, Wolfgang Klippel, Christian Bellmann, Daniel Knobloch KLIPPEL, WARKWYN: Near field scanning, 1 AGENDA 1. Pros
Lab 18 Delay Lines. m208w2014. Setup. Delay Lines
 MUSC 208 Winter 2014 John Ellinger Carleton College Lab 18 Delay Lines Setup Download the m208lab18.zip files and move the folder to your desktop. Delay Lines Delay Lines are frequently used in audio software.
Measurement of weighted harmonic distortion HI-2
 Measurement of weighted harmonic distortion HI-2 Software of the KLIPPEL R&D and QC SYSTEM ( Document Revision 1.0) AN 7 DESCRIPTION The weighted harmonic distortion HI-2 is measured by using the DIS-Pro
STEREO IMPACT Solar Energetic Particles Package (SEP) Dynamic Test Plan
 Dynamic Test Plan") 1 2 Jet Propulsion Laboratory 352G-WBT-0507 Interoffice Memorandum January 13, 2005 To: From: Subject: References: Distribution W. B. Tsoi STEREO IMPACT Solar Energetic Particles Package (SEP) Dynamic
1 2 Jet Propulsion Laboratory 352G-WBT-0507 Interoffice Memorandum January 13, 2005 To: From: Subject: References: Distribution W. B. Tsoi STEREO IMPACT Solar Energetic Particles Package (SEP) Dynamic
EAW KF740 Technology Brief
 EAW KF740 Technology Brief Nathan Butler Principal Engineer Page 1 of 8 In 2001, EAW revolutionized the professional loudspeaker industry by introducing the first completely horn loaded, 3-way line array
3D Intermodulation Distortion Measurement AN 8
 3D Intermodulation Distortion Measurement AN 8 Application Note to the R&D SYSTEM The modulation of a high frequency tone f (voice tone and a low frequency tone f (bass tone is measured by using the 3D
DESIGN OF VOICE ALARM SYSTEMS FOR TRAFFIC TUNNELS: OPTIMISATION OF SPEECH INTELLIGIBILITY
 DESIGN OF VOICE ALARM SYSTEMS FOR TRAFFIC TUNNELS: OPTIMISATION OF SPEECH INTELLIGIBILITY Dr.ir. Evert Start Duran Audio BV, Zaltbommel, The Netherlands The design and optimisation of voice alarm (VA)
Measuring Center for Android User manual Software for analyzing sound signals
 2014 Measuring Center for Android User manual Software for analyzing sound signals Spl-Lab Version 2.2 Table of Contents Table of Contents... 2 General Information... 3 Starting Operation... 3 Program
Informations and comments on ECE-TRANS-WP.29-GRB e
 Transmitted by the expert from France Informal document GRB-63-16 (63rd GRB, 16-18 February 2016, agenda item 2) Informations and comments on ECE-TRANS-WP.29-GRB-2016-02e Louis-Ferdinand PARDO (France)
What applications is a cardioid subwoofer configuration appropriate for?
 SETTING UP A CARDIOID SUBWOOFER SYSTEM Joan La Roda DAS Audio, Engineering Department. Introduction In general, we say that a speaker, or a group of speakers, radiates with a cardioid pattern when it radiates
29th TONMEISTERTAGUNG VDT INTERNATIONAL CONVENTION, November 2016
 Measurement and Visualization of Room Impulse Responses with Spherical Microphone Arrays (Messung und Visualisierung von Raumimpulsantworten mit kugelförmigen Mikrofonarrays) Michael Kerscher 1, Benjamin
INTERNATIONAL BACCALAUREATE PHYSICS EXTENDED ESSAY
 INTERNATIONAL BACCALAUREATE PHYSICS EXTENDED ESSAY Investigation of sounds produced by stringed instruments Word count: 2922 Abstract This extended essay is about sound produced by stringed instruments,
sound reinforcement & microphones
 sound reinforcement & microphones statement most SR-systems work perfectly - until a microphone is connected. Eddy B. Brixen audio specialist ebb@dpamicrophones.com content SR and microphones what are
DISTANCE CODING AND PERFORMANCE OF THE MARK 5 AND ST350 SOUNDFIELD MICROPHONES AND THEIR SUITABILITY FOR AMBISONIC REPRODUCTION
 DISTANCE CODING AND PERFORMANCE OF THE MARK 5 AND ST350 SOUNDFIELD MICROPHONES AND THEIR SUITABILITY FOR AMBISONIC REPRODUCTION T Spenceley B Wiggins University of Derby, Derby, UK University of Derby,
Problems with the INM: Part 2 Atmospheric Attenuation
 Proceedings of ACOUSTICS 2006 20-22 November 2006, Christchurch, New Zealand Problems with the INM: Part 2 Atmospheric Attenuation Steven Cooper, John Maung The Acoustic Group, Sydney, Australia ABSTRACT
SigCal32 User s Guide Version 3.0
 SigCal User s Guide . . SigCal32 User s Guide Version 3.0 Copyright 1999 TDT. All rights reserved. No part of this manual may be reproduced or transmitted in any form or by any means, electronic or mechanical,
Acoustical Improvements in Kulturhuset Oceanen Using Slitted Low Frequency Absorbers. Mattias Davidsson, Master's Thesis 2006:18
 Acoustical Improvements in Kulturhuset Oceanen Using Slitted Low Frequency Absorbers Mattias Davidsson, 2006 Master's Thesis 2006:18 Department of Civil and Environmental Engineering Division of Applied
App Note Highlights Importing Transducer Response Data Generic Transfer Function Modeling Circuit Optimization Digital IIR Transform IIR Z Root Editor
 Application Note 6 App Note Application Note 6 Highlights Importing Transducer Response Data Generic Transfer Function Modeling Circuit Optimization Digital IIR Transform IIR Z Root Editor n Design Objective
Façade insulation at low frequencies influence of room acoustic properties
 Buenos Aires 5 to 9 September, 06 Acoustics for the st Century PROCEEDINGS of the nd International Congress on Acoustics Challenges and Solutions in Acoustics Measurement and Design: Paper ICA06-8 Façade
WITHIN GENERATOR APPLICATIONS
 POWER SYSTEMS TOPICS 9 Measuring and Understanding Sound WITHIN GENERATOR APPLICATIONS INTRODUCTION When selecting a generator, there are many factors to consider so as not to negatively impact the existing
Envelopment and Small Room Acoustics
 Envelopment and Small Room Acoustics David Griesinger Lexicon 3 Oak Park Bedford, MA 01730 Copyright 9/21/00 by David Griesinger Preview of results Loudness isn t everything! At least two additional perceptions:
Musical Acoustics, C. Bertulani. Musical Acoustics. Lecture 14 Timbre / Tone quality II
 1 Musical Acoustics Lecture 14 Timbre / Tone quality II Odd vs Even Harmonics and Symmetry Sines are Anti-symmetric about mid-point If you mirror around the middle you get the same shape but upside down
Filters And Waveform Shaping
 Physics 3330 Experiment #3 Fall 2001 Purpose Filters And Waveform Shaping The aim of this experiment is to study the frequency filtering properties of passive (R, C, and L) circuits for sine waves, and
Statistical properties of urban noise results of a long term monitoring program
 Statistical properties of urban noise results of a long term monitoring program ABSTRACT Jonathan Song (1), Valeri V. Lenchine (1) (1) Science & Information Division, SA Environment Protection Authority,
SPEAKER SC-COBRA-PEEK-WP
 2403 260 00132 SPEAKER-1115-3.5-SC-COBRA-PEEK-WP The 11 15 3.5 mm COBRA-PEEK-WP is an advanced miniature speaker of rectangular shape, specifically is a high end miniature speaker specifically designed
XLA 3200 Line Array Loudspeakers
 XLA 3200 Line Array Loudspeakers LBC 3200/00, LBC 3201/00, LBC 3210/00 en Product information and installation manual, please see www.boschsecurity.com XLA 3200 Line Array Loudspeakers Table of Contents