PSY 307 Statistics for the Behavioral Sciences. Chapter 2 Describing Data with Tables and Graphs
|
|
|
- Nigel Russell
- 5 years ago
- Views:
Transcription
1 PSY 307 Statistics for the Behavioral Sciences Chapter 2 Describing Data with Tables and Graphs
2 Class Progress To-Date Math Readiness Descriptives Midterm next Monday
3 Frequency Distributions One of the simplest forms of measurement is counting How many people show a characteristic, have a given value or are members of a category. Frequency distributions count how many observations exist for each value for a particular variable.
4 Frequency Table A frequency table is a collection of observations: Sorted into classes Showing the frequency for each class. A class is a group of observations. When each class consists of a single observation, the data is considered to be ungrouped.
5 Creating a Table List the possible values. Count how many observations exist for each possible value. One way to do this is using hash-marks and crossing off each value. Figure out the corresponding percent for each class by dividing each frequency by the total scores.
6 Unorganized Data 1, 5, 3, 3, 6, 2, 1, 5, 2, 1, 2, 6, 3, 4, 1, 6, 2, 4, 4, 2 A set of observations like this is difficult to find patterns in or interpret.
7 Example
8 When to Create Groups Grouping is a convenience that makes it easier for people to understand the data. Ungrouped data should have <20 possible values or classes (not <20 scores, cases or observations). Identities of individual observations are lost when groups are created.
9 Guidelines for Grouping See pgs in text. Each observation should be included in one and only one class. List all classes, even those with 0 frequency (no observations). All classes with upper & lower boundaries should be equal in width.
10 Optional Guidelines All classes should have an upper and lower boundary. Open-ended classes do occur. Select an interval (width) that is natural to think about: 5 or 10 are convenient, 13 is not The lower boundary should be a multiple of class width ( ). Aim for a total of about 10 classes.
11 Gaps Between Classes With continuous data, there is an implied gap between where one boundary ends and the other starts. The size of the gap equals one unit of measurement the smallest possible difference between scores. That way no observations can ever fall within that gap. Class sizes account for this.
12 Relative Frequency Relative frequency frequency of each class as a fraction (%) of the total frequency for the distribution. Relative frequency lets you compare two distributions of different sizes. Obtain the fraction by dividing the frequency for each group by the total frequency Total = 1.00 (100%)
13 Example 4/20 =.20 or 20% 5/20 =.25 or 25% 3/20 =.15 or 15% 3/20 =.15 or 15% 2/20 =.10 or 10% 3/20 =.15 or 15% Total = 20 Total = 1.0 or 100%
14 Cumulative Frequency Cumulative frequency the total number of observations in a class plus all lower-ranked classes. Used to compare relative standing of individual scores within two distributions. Add the frequency of each class to the frequencies of those below it.
15 Relative Frequency (Percent) and Cumulative Frequency
16 Cumulative Proportion (Percent) The cumulative proportion or percent is the relative cumulative frequency. Percent = proportion x 100 It allows comparison of cumulative frequencies across two distributions. To obtain cumulative proportions divide the cumulative frequency by the total frequency for each class. Highest class = 1.00 (100%)
17 Percentile Ranks Percentile rank percent of observations with the same or lower values than a given observation. Find the score, then use the cumulative percent as the percentile rank: Exact ranks can be found from ungrouped data. Only approximate ranks can be found from grouped data.
18 Qualitative Data Some categories are ordered (can be placed in a meaningful order): Military ranks, levels of schooling (elementary, high school, college) Frequencies can be converted to relative frequencies. Cumulative frequencies only make sense for ordered categories.
19 Interpreting Tables First read the title, column headings and any footnotes. Where do the data come from, source? Next, consider whether the table is well-constructed does it follow the grouping guidelines. Finally, look at the data and think about whether it makes sense. Focus on overall trends, not details.
20 Parts of a Graph
21 Constructing Graphs Select the type of graph. Place groups on the x-axis. Place frequency on the y-axis. Values for the groups and frequencies depend on the data. Label the axes and give a title to the graph.
22 Histograms For quantitative data only. Equal units across x axis represent groups. Equal units across y axis represent frequency. Use wiggly line to show breaks in the scale. Bars are adjacent no gaps.
23 Histogram Applets Uses Old Faithful geyser data tems_inc. Uses math SAT data Notice that bin width refers to class or interval size. SPSS automatically creates classes or intervals.
24 Frequency Polygons Also called a line graph. A histogram can be converted to a frequency polygon by connecting the midpoints of the bars. Anchor the line to the x axis at beginning and end of distribution. Two frequency polygons can be superimposed for comparison.
25 Number of Employees Number of Employees Number of Employees Creating a Line Graph from a Histogram Histogram Length of Service (years) Frequency Polygon Years of Service Histogram Length of S ervice (years)
26 Stem-and-Leaf Displays Constructing a display: Notice the highest and lowest 10s Arrange 10s in ascending order. Copy right-hand digits as leaves. The resulting display resembles a frequency histogram. Stems are whatever digits make sense to use.
27 Sample Stem and leaf display showing the number of passing touchdowns
28 Purpose of Frequency Graphs In statistics, we are interested in the shapes of distributions because they tell us what statistics to use. They let us identify outliers that might distort the statistics we will be using. They present data so that readers can quickly and easily grasp its meaning.
29 Shapes of Distributions Normal bell-shaped and symmetrical. Bimodal two peaks. Suggests presence of two different types of observations in the same data. Positively skewed lopsided due to extreme observations in right tail. Negatively skewed extreme observations in left tail.


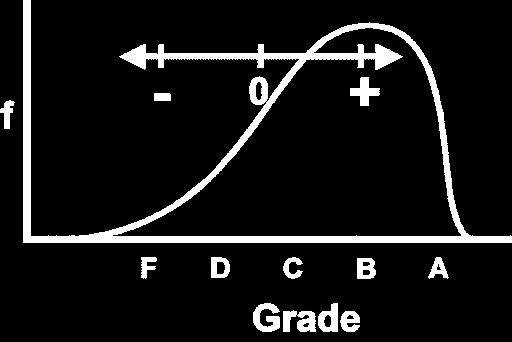
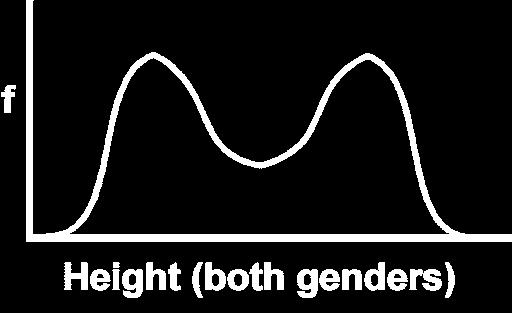
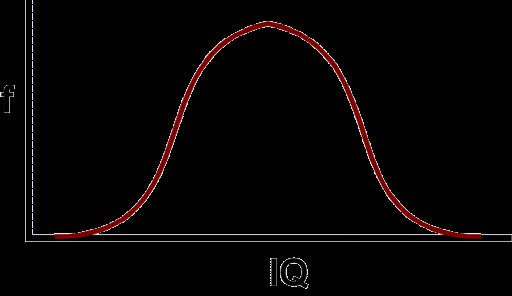
30 Shapes of Graphs bimodal normal positive skew negative skew
31 Heavy vs Light-tailed Distributions Heavy-tailed a distribution with more observations in its tails. Light-tailed a distribution with fewer observations in its tails and more in the center. Kurtosis a statistic that measures the shape of the distribution and the size of the tails.
32 Other Kinds of Graphs Frequency is not the only measure that can be displayed on the y-axis. We are using a graph to explore the shape of a distribution in this chapter. Usually the y-axis shows the dependent variable while the x-axis shows groups (independent variable). Graphs can be visually interesting!
33 Graphs Allow Visual Comparisons

34 The Best Graph Ever Drawn Source:
35 Details About the Graph The map was the work of Charles Joseph Minard ( ), a French civil engineer who was an inspectorgeneral of bridges and roads, but whose most remembered legacy is in the field of statistical graphics The chart, or statistical graphic, is also a map. And a strange one at that. It depicts the advance into (1812) and retreat from (1813) Russia by Napoleon s Grande Armée, which was decimated by a combination of the Russian winter, the Russian army and its scorched-earth tactics. To my knowledge, this is the origin of the term scorched earth the retreating Russians burnt anything that might feed or shelter the French, thereby severely weakening Napoleon s army. It unites temperature, time, geography and number of soldiers, all in one picture.

36 A Modern Version

37 Qualitative Data Bar graphs similar to histograms. Bars do not touch. Categorical groups are on x-axis. Pie charts Where tax money goes.
38 Misleading Graphs Bars should be equal widths Bars should be two-dimensional, not three-dimensional When the lower bound of the y-axis (frequency) is cut-off (not 0), the differences are exaggerated. Height and width of the graph should be approximately equal.

39 Graphs are Used to Persuade Reagan Bush Clinton Bush


40 Gallup s Terry Schiavo Poll


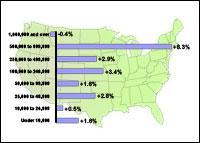
41 Who Increased the Debt? This chart is misleading because it includes social security as debt. If expressed as a % of public debt, Bush & Obama would be tied around 60-70%. Obama would look 4 times worse than Bush and twice as bad as Reagan if this were expressed as a % of income (GDP).

42 Misleading Tables Average score, reading literacy, PISA, 2009: Korea 539 Finland 536 Canada 524 New Zealand 521 Japan 520 Australia 515 Netherlands 508 Belgium 506 Norway 503 Estonia 501 Switzerland 501 Poland 500 Iceland 500 United States 500 Sweden 497 Germany 497 Ireland 496 France 496 Denmark 495 United Kingdom 494 Hungary 494 OECD average 493 Portugal 489 Italy 486 Slovenia 483 Greece 483 Spain 481 Czech Republic 478 Slovak Republic 477 Israel 474 Luxembourg 472 Austria 470 Turkey 464 Chile 449 Mexico 425

43 How Big are Crime Rates? Source: storyid=

44 How Many Groups (Categories)? This graph is misleading because income above 200k is broken into many sub-categories, making the k group look larger than higher income groups. How it would look if redrawn.
45 Comparing Scales (OK)

46 Misleading Scales The range of the scales for these two variables are too different to be compared visually without being misleading. The crossover point at 2004 disappears when the same range is used on both scales of the graph.
47 More Misleading Graphs 1/unit1/U01L02.htm
Describing Data Visually. Describing Data Visually. Describing Data Visually 9/28/12. Applied Statistics in Business & Economics, 4 th edition
 A PowerPoint Presentation Package to Accompany Applied Statistics in Business & Economics, 4 th edition David P. Doane and Lori E. Seward Prepared by Lloyd R. Jaisingh Describing Data Visually Chapter
Chapter 3. Graphical Methods for Describing Data. Copyright 2005 Brooks/Cole, a division of Thomson Learning, Inc.
 Chapter 3 Graphical Methods for Describing Data 1 Frequency Distribution Example The data in the column labeled vision for the student data set introduced in the slides for chapter 1 is the answer to the
Chapter 2 Frequency Distributions and Graphs
 Chapter 2 Frequency Distributions and Graphs Outline 2-1 Organizing Data 2-2 Histograms, Frequency Polygons, and Ogives 2-3 Other Types of Graphs Objectives Organize data using a frequency distribution.
Chapter 4. September 08, appstats 4B.notebook. Displaying Quantitative Data. Aug 4 9:13 AM. Aug 4 9:13 AM. Aug 27 10:16 PM.
 Objectives: Students will: Chapter 4 1. Be able to identify an appropriate display for any quantitative variable: stem leaf plot, time plot, histogram and dotplot given a set of quantitative data. 2. Be
Chapter 10. Definition: Categorical Variables. Graphs, Good and Bad. Distribution
 Chapter 10 Graphs, Good and Bad Chapter 10 3 Distribution Definition: Tells what values a variable takes and how often it takes these values Can be a table, graph, or function Categorical Variables Places
Section 1.5 Graphs and Describing Distributions
 Section 1.5 Graphs and Describing Distributions Data can be displayed using graphs. Some of the most common graphs used in statistics are: Bar graph Pie Chart Dot plot Histogram Stem and leaf plot Box
DESCRIBING DATA. Frequency Tables, Frequency Distributions, and Graphic Presentation
 DESCRIBING DATA Frequency Tables, Frequency Distributions, and Graphic Presentation Raw Data A raw data is the data obtained before it is being processed or arranged. 2 Example: Raw Score A raw score is
CRC Association Conference
 CRC Association Conference Brisbane, 17 19 May 2011 Productivity and Growth: The Role and Features of an Effective Innovation Policy Jonathan Coppel Economic Counsellor to OECD Secretary General 1 Outline
Numerical: Data with quantity Discrete: whole number answers Example: How many siblings do you have?
 Types of data Numerical: Data with quantity Discrete: whole number answers Example: How many siblings do you have? Continuous: Answers can fall anywhere in between two whole numbers. Usually any type of
Chapter Displaying Graphical Data. Frequency Distribution Example. Graphical Methods for Describing Data. Vision Correction Frequency Relative
 Chapter 3 Graphical Methods for Describing 3.1 Displaying Graphical Distribution Example The data in the column labeled vision for the student data set introduced in the slides for chapter 1 is the answer
Measurement Statistics, Histograms and Trend Plot Analysis Modes
 Measurement Statistics, Histograms and Trend Plot Analysis Modes Using the Tektronix FCA and MCA Series Timer/Counter/Analyzers Application Note How am I supposed to observe signal integrity, jitter or
WOODWORKING TECHNOLOGY IN EUROPE: HIGHLIGHTS European Federation of Woodworking Technology Manufacturers
 European Federation of Woodworking Technology Manufacturers ADVANCED ECONOMIES - GDP % GROWTH RATE 2017 8,0 7,0 6,0 5,0 4,0 3,0 2,0 1,0 0,0 Ireland Malta Slovenia Estonia Latvia Czech Republic Cyprus
Outline. Drawing the Graph. 1 Homework Review. 2 Introduction. 3 Histograms. 4 Histograms on the TI Assignment
 Lecture 14 Section 4.4.4 on Hampden-Sydney College Fri, Sep 18, 2009 Outline 1 on 2 3 4 on 5 6 Even-numbered on Exercise 4.25, p. 249. The following is a list of homework scores for two students: Student
Chpt 2. Frequency Distributions and Graphs. 2-3 Histograms, Frequency Polygons, Ogives / 35
 Chpt 2 Frequency Distributions and Graphs 2-3 Histograms, Frequency Polygons, Ogives 1 Chpt 2 Homework 2-3 Read pages 48-57 p57 Applying the Concepts p58 2-4, 10, 14 2 Chpt 2 Objective Represent Data Graphically
Economic Outlook for 2016
 Economic Outlook for 2016 Arturo Bris Professor of Finance, IMD Director, IMD World Competitiveness Center Yale International Center for Finance European Corporate Governance Institute 2015 IMD International.
Notes: Displaying Quantitative Data
 Notes: Displaying Quantitative Data Stats: Modeling the World Chapter 4 A or is often used to display categorical data. These types of displays, however, are not appropriate for quantitative data. Quantitative
Public Private Partnerships & Idea selection
 www.pwc.nl Public Private Partnerships & Idea selection A tool to select technological healthcare innovation ideas PPPs should select technical healthcare innovation ideas by answering seven questions
Notes 5C: Statistical Tables and Graphs
 Notes 5C: Statistical Tables and Graphs Frequency Tables A frequency table is an easy way to display raw data. A frequency table typically has between two to four columns: The first column lists all the
Who Reads and Who Follows? What analytics tell us about the audience of academic blogging Chris Prosser Politics in
 Who Reads and Who Follows? What analytics tell us about the audience of academic blogging Chris Prosser Politics in Spires @caprosser 1 What do we want to know about the audience for academic blogging?
34 th Annual PURC Conference New Technologies and Services in Telecommunications: Effects on Competition and Investment.
 34 th Annual PURC Conference New Technologies and Services in Telecommunications: Effects on Competition and Investment Kathleen Wallman 1 One Problem Worth Addressing: Universal and Affordable Broadband
Elementary Statistics. Graphing Data
 Graphing Data What have we learned so far? 1 Randomly collect data. 2 Sort the data. 3 Compute the class width for specific number of classes. 4 Complete a frequency distribution table with the following
Welcome to the IFR Press Conference 30 August 2012, Taipei
 Welcome to the IFR Press Conference 3 August 212, Taipei Continued success of the robotics industry Welcome by IFR President Dr. Shinsuke Sakakibara Presentation of the results of World Robotics 212 Industrial
OECD s Innovation Strategy: Key Findings and Policy Messages
 OECD s Innovation Strategy: Key Findings and Policy Messages 2010 MIT Europe Conference, Brussels, 12 October Dirk Pilat, OECD dirk.pilat@oecd.org Outline 1. Why innovation matters today 2. Why policies
Chem & Bio non-proliferation
 Chem & Bio non-proliferation Workshop on the Export Control of Dual-use Materials and Technologies in GUAM Countries Kyiv, Ukraine, 14 March 2018 Independent Arms Control Consultant Circe poisoning the
Frame through-beam sensors
 Frame through-beam sensors Features Wide range of sizes: passage sizes from 25 x 23 mm to 300 x 397.5 mm Metal housings Integrated evaluation unit Connection by means of connector Degree of protection
Regulatory status for using RFID in the UHF spectrum 3 May 2006
 Regulatory status for using RFID in the UHF spectrum 3 May NOTE: The following countries were updated since the last publication of 3 March : Thailand, Romania. The table attached provides an overview
OECD Science, Technology and Industry Outlook 2008: Highlights
 OECD Science, Technology and Industry Outlook 2008: Highlights Global dynamics in science, technology and innovation Investment in science, technology and innovation has benefited from strong economic
Economic and Social Council
 United Nations Economic and Social Council ECE/CES/GE.41/2013/3 Distr.: General 15 August 2013 Original: English Economic Commission for Europe Conference of European Statisticians Group of Experts on
Innovation policy mixes and implications on HEIs - emerging conclusions from the OECD innovation policy reviews
 Innovation policy mixes and implications on HEIs - emerging conclusions from the OECD innovation policy reviews Gernot Hutschenreiter Country Studies and Outlook Division Directorate for Science, Technology
THE ECONOMICS OF DATA-DRIVEN INNOVATION
 New Engines of Growth Driving Innovation and Trade in Data High-Level Transatlantic Summit 24 April 2014 THE ECONOMICS OF DATA-DRIVEN INNOVATION Opportunities and challenges for Europe Christian.Reimsbach-Kounatze@oecd.org
Chapter 4 Displaying and Describing Quantitative Data
 Chapter 4 Displaying and Describing Quantitative Data Overview Key Concepts Be able to identify an appropriate display for any quantitative variable. Be able to guess the shape of the distribution of a
Understanding Knowledge Societies Report of UNDESA/DPADM. Measurement Aspects. Irene Tinagli Tunis, 17 Nov World Summit on Information Society
 Understanding Knowledge Societies Report of UNDESA/DPADM Measurement Aspects by Irene Tinagli Tunis, 17 Nov. 2005 World Summit on Information Society About Measurement WHY? To assess & better understand
1.1 Displaying Distributions with Graphs, Continued
 1.1 Displaying Distributions with Graphs, Continued Ulrich Hoensch Thursday, January 10, 2013 Histograms Constructing a frequency table involves breaking the range of values of a quantitative variable
Innovation in Europe: Where s it going? How does it happen? Stephen Roper Aston Business School, Birmingham, UK
 Innovation in Europe: Where s it going? How does it happen? Stephen Roper Aston Business School, Birmingham, UK Email: s.roper@aston.ac.uk Overview Innovation in Europe: Where is it going? The challenge
RECOVERED PAPER DATA
 RECOVERED PAPER DATA 999- RECOVERED PAPER DATA, 999- FOOD AND AGRICULTURE ORGANIZATION OF THE UNITED NATIONS Rome, Disclaimer TABLE OF CONTENTS INTRODUCTION DEFINITIONS OF TERMS USED RECOVERED PAPER TRADE
English - Or. English NUCLEAR ENERGY AGENCY COMMITTEE ON THE SAFETY OF NUCLEAR INSTALLATIONS FINAL REPORT AND ANSWERS TO QUESTIONNAIRE
 Unclassified NEA/CSNI/R(2003)3 NEA/CSNI/R(2003)3 Unclassified Organisation de Coopération et de Développement Economiques Organisation for Economic Co-operation and Development 04-Feb-2003 English - Or.
Does exposure to university research matter to high-potential entrepreneurship?
 Does exposure to university research matter to high-potential entrepreneurship? AIMILIA PROTOGEROU, YANNIS CALOGHIROU, NICHOLAS S. VONORTAS LABORATORY OF INDUSTRIAL AND ENERGY ECONOMICS, NATIONAL TECHNICAL
OECD Science, Technology and Industry Outlook 2010 Highlights
 OECD Science, Technology and Industry Outlook 21 OECD 21 OECD Science, Technology and Industry Outlook 21 Highlights Innovation can play an important role in the economic recovery Science, technology and
Through-beam ring sensors
 Throughbeam ring sensors Features Wide range of sizes: ring diameters of 10, 15 and 20 mm Metal housings Separate evaluation unit Connection by means of S8 connector Degree of protection IP 63 Adjustable
Remote participation in Question sessions Audio options VoIP
 Remote participation in Question sessions Remote participation will use GoToMeeting. Participants must be registered to the SG13 meeting in der to be able to join 1. Use your laptop s microphone and speakers
How big is China s Digital Economy
 How big is China s Digital Economy Alicia Garcia Herrero Senior Fellow, Bruegel Jianwei Xu Beijing Normal University & Bruegel November 2017 Roadmap 1. Motivation 2. Internationally comparable measures
OBN BioTuesday: Sources of Public Non-Dilutable Funding & Export Support to UK R&D Companies
 OBN BioTuesday: Sources of Public Non-Dilutable Funding & Export Support to UK R&D Companies SME Instrument and Eurostars Jane Watkins National Contact Point Horizon 2020 SME Instrument and Eurostars Jane
Section 1: Data (Major Concept Review)
") Section 1: Data (Major Concept Review) Individuals = the objects described by a set of data variable = characteristic of an individual weight height age IQ hair color eye color major social security #
Section 1: Data (Major Concept Review) Individuals = the objects described by a set of data variable = characteristic of an individual weight height age IQ hair color eye color major social security #
Business Statistics:
 Department of Quantitative Methods & Information Systems Business Statistics: Chapter 2 Graphs, Charts, and Tables Describing Your Data QMIS 120 Dr. Mohammad Zainal Chapter Goals After completing this
2018/2019 HCT Transition Period OFFICIAL COMPETITION RULES
 2018/2019 HCT Transition Period OFFICIAL COMPETITION RULES 1. INTRODUCTION These HCT Transition Period Official Competition Rules ( Official Rules ) govern how players earn Hearthstone Competitive Points
CDP-EIF ITAtech Equity Platform
 CDP-EIF ITAtech Equity Platform New financial instruments to support technology transfer in Italy TTO Circle Meeting, Oxford June 22nd 2017 June, 2017 ITAtech: the "agent for change" in TT landscape A
Frequency Distribution and Graphs
 Chapter 2 Frequency Distribution and Graphs 2.1 Organizing Qualitative Data Denition 2.1.1 A categorical frequency distribution lists the number of occurrences for each category of data. Example 2.1.1
LESSON 2: FREQUENCY DISTRIBUTION
 LESSON : FREQUENCY DISTRIBUTION Outline Frequency distribution, histogram, frequency polygon Relative frequency histogram Cumulative relative frequency graph Stem-and-leaf plots Scatter diagram Pie charts,
Chapter 4. Displaying and Summarizing Quantitative Data. Copyright 2012, 2008, 2005 Pearson Education, Inc.
 Chapter 4 Displaying and Summarizing Quantitative Data Copyright 2012, 2008, 2005 Pearson Education, Inc. Dealing With a Lot of Numbers Summarizing the data will help us when we look at large sets of quantitative
the Reinsurance Mechanism
 The European Unemployment Insurance 2.0: the Reinsurance Mechanism Miroslav Beblavý (with Daniel Gros and Ilaria Maselli) CEPS Why Reinsurance? Appropriateness of the solution always depends on problem
Table of Contents Executive Summary 29
 Contents Table of Contents Executive Summary 29 Section 1: Introduction 33 Section 2: World 37 2.1.1. Main consumers 37 2.1.2. Main producers 2015 and 2016 39 2.1.3. Main importers 2015 and 2016 40 2.1.4.
STK110. Chapter 2: Tabular and Graphical Methods Lecture 1 of 2. ritakeller.com. mathspig.wordpress.com
 STK110 Chapter 2: Tabular and Graphical Methods Lecture 1 of 2 ritakeller.com mathspig.wordpress.com Frequency distribution Example Data from a sample of 50 soft drink purchases Frequency Distribution
Rebuilding for the Community in New Orleans
 Please cite this paper as: Bingler, S. (2010), Rebuilding for the Community in New Orleans, CELE Exchange, Centre for Effective Learning Environments, 2010/14, OECD Publishing, Paris. http://dx.doi.org/10.1787/5km4g21dwd8v-en
Getting to Equal, 2016
 Getting to Equal, 2016 Listen. Learn, Lead, 2015 Career Capital, 2014 Defining Success. Your Way, 2013 The Path Forward, 2012 Reinvent Opportunity: Looking Through a New Lens, 2011 Resilience in the Face
Stress Calibration for Jitter >1UI A Practical Method
 Stress Calibration for Jitter >1UI A Practical Method Application Note Abstract While measuring the amount of jitter present on a signal is relatively straight forward conceptually; when the levels of
Review. In an experiment, there is one variable that is of primary interest. There are several other factors, which may affect the measured result.
 Review Observational study vs experiment Experimental designs In an experiment, there is one variable that is of primary interest. There are several other factors, which may affect the measured result.
Displaying Distributions with Graphs
 Displaying Distributions with Graphs Recall that the distribution of a variable indicates two things: (1) What value(s) a variable can take, and (2) how often it takes those values. Example 1: Weights
stripax The professional stripping tool
 stripax The professional stripping tool stripax the original: developed from experience Weidmüller is the world s leading manufacturer of solutions for electrical connectivity, transmission, conditioning
ISTEAC. Paper Recycling. LABORATORY OF HEAT TRANSFER and ENVIRONMENTAL ENGINEERING
 LABORATORY OF HEAT TRANSFER and ENVIRONMENTAL ENGINEERING DEPARTMENT of MECHANICAL ENGINEERING ARISTOTLE UNIVERSITY THESSALONIKI ISTEAC Paper Recycling Coordinator: Aristotle University of Thessaloniki
The compact test- disconnect terminal interface system for protection and secondary technology
 POCON POWER Connector The compact test- disconnect terminal interface system for protection and secondary technology POCON the compact test-disconnect terminal interface system Safe control and testing
Low Capacitance Probes Minimize Impact on Circuit Operation
 Presented by TestEquity - www.testequity.com Low Capacitance Probes Minimize Impact on Circuit Operation Application Note Application Note Traditional Passive Probe Advantages Wide dynamic range Inexpensive
Story Excitement Social Compete Escapism Challenge Creation Achieve Curiosity Fantasy Hilgard et al. (2013) Rigby et al. (2006) Bartle (1996) Sherry e
 Rigby et al. (2006) Bartle (1996) Sherry e") Story Excitement Social Compete Escapism Challenge Creation Achieve Curiosity Fantasy Hilgard et al. (2013) Rigby et al. (2006) Bartle (1996) Sherry et al. (2006) LeBlanc (2004) Steinkuehler (2005) Yee
Story Excitement Social Compete Escapism Challenge Creation Achieve Curiosity Fantasy Hilgard et al. (2013) Rigby et al. (2006) Bartle (1996) Sherry et al. (2006) LeBlanc (2004) Steinkuehler (2005) Yee
Fundamentals of AC Power Measurements
 Fundamentals of AC Power Measurements Application Note Power analysis involves some measurements, terms and calculations that may be new and possibly confusing to engineers and technicians who are new
Verifying Power Supply Sequencing with an 8-Channel Oscilloscope APPLICATION NOTE
 Verifying Power Supply Sequencing with an 8-Channel Oscilloscope Introduction In systems that rely on multiple power rails, power-on sequencing and power-off sequencing can be critical. If the power supplies
Statistics for Managers using Microsoft Excel 3 rd Edition
 Statistics for Managers using Microsoft Excel 3 rd Edition Chapter 2 Presenting Data in Tables and Charts 22 Prentice-Hall, Inc. Chap 2-1 Chapter Topics Organizing numerical data The ordered array and
Monthly Summary of Troop Contribution to UN Operations
 Monthly Summary of Troop Contribution to UN Operations Month of Report : 3-Dec-3 Country Description of Post M F Totals ) Albania Individual Police............ 0 Subtotal for Country ) Algeria Experts
Statistics. Graphing Statistics & Data. What is Data?. Data is organized information. It can be numbers, words, measurements,
 Statistics Graphing Statistics & Data What is Data?. Data is organized information. It can be numbers, words, measurements, observations or even just descriptions of things. Qualitative vs Quantitative.
Automated Frequency Response Measurement with AFG31000, MDO3000 and TekBench Instrument Control Software APPLICATION NOTE
 Automated Frequency Response Measurement with AFG31000, MDO3000 and TekBench Instrument Control Software Introduction For undergraduate students in colleges and universities, frequency response testing
Financing SMEs and Entrepreneurs 2012
 Financing SMEs and Entrepreneurs 2012 AN OECD SCOREBOARD OECD Table of Contents Acronyms and abbreviations 13 Chapter 1. Financing SMEs and Entrepreneurs: Understanding and Developing an OECD Scoreboard
NFC Forum: The Evolution of a Consortium
 NFC Forum: The Evolution of a Consortium Presented by Greg Kohn Sr. Operations Director, NFC Forum ANSI Open Forum: Building Bridges across the Standards Ecosystem October 9, 2012 Part of the World Standards
OECD/ADBI 7th Round Table on Capital Market Reform in Asia October 2005 ADB Institute, Tokyo, Japan
 OECD/ADBI 7th Round Table on Capital Market Reform in Asia 27-28 October 2005 ADB Institute, Tokyo, Japan SESSION 4: DEVELOPMENTS IN VENTURE CAPITAL AND PRIVATE EQUITY SINCE THE END OF TECH BUBBLE Mr.
Lecture Slides. Elementary Statistics Twelfth Edition. by Mario F. Triola. and the Triola Statistics Series. Section 2.2- #
 Lecture Slides Elementary Statistics Twelfth Edition and the Triola Statistics Series by Mario F. Triola Chapter 2 Summarizing and Graphing Data 2-1 Review and Preview 2-2 Frequency Distributions 2-3 Histograms
BenchTop Extraction Arms with unbeatable flexibility
 BenchTop Extraction Arms with unbeatable flexibility A new generation of BenchTop extraction arms with unbeatable flexibility Nederman introduces a new generation of BenchTop arms the FX, FX and FX. These
OECD Innovation Strategy: Developing an Innovation Policy for the 21st Century
 OECD Innovation Strategy: Developing an Innovation Policy for the 21st Century Andrew Wyckoff, OECD / STI Tokyo, 4 February 2010 Overview 1. The OECD Innovation Strategy 2. The innovation imperative 3.
10 Wyner Statistics Fall 2013
 1 Wyner Statistics Fall 213 CHAPTER TWO: GRAPHS Summary Terms Objectives For research to be valuable, it must be shared. The fundamental aspect of a good graph is that it makes the results clear at a glance.
Sections Descriptive Statistics for Numerical Variables
 Math 243 Sections 2.1.2-2.2.5 Descriptive Statistics for Numerical Variables A framework to describe quantitative data: Describe the Shape, Center and Spread, and Unusual Features Shape How is the data
Patented Medicine Prices Review Board P M P R B GUIDELINES REFORM. 15 th Annual Market Access Summit. Douglas Clark Executive Director PMPRB
 Patented Medicine Prices Review Board P M P R B GUIDELINES REFORM Douglas Clark Executive Director PMPRB 15 th Annual Market Access Summit Background Canada enacted a two-fold reform of its drug patent
Simplifying DC-DC Converter Characterization using a 2600B System SourceMeter SMU Instrument and MSO/DPO5000 or DPO7000 Series Scope APPLICATION NOTE
 Simplifying DC-DC Characterization using a 2600B System SourceMeter SMU Instrument and MSO/DPO5000 or DPO7000 Series Scope Introduction DC-DC converters are widely used electronic components that convert
EU Ecolabel EMAS Environmental Technology Verification (ETV) State-of-play and evaluations
 State-of-play and evaluations") EU Ecolabel EMAS Environmental Technology Verification (ETV) State-of-play and evaluations Pierre Henry DG Environment B1 3 instruments of Circular Economy action plan Improving the efficiency and uptake
EU Ecolabel EMAS Environmental Technology Verification (ETV) State-of-play and evaluations Pierre Henry DG Environment B1 3 instruments of Circular Economy action plan Improving the efficiency and uptake
AP Statistics Composition Book Review Chapters 1 2
 AP Statistics Composition Book Review Chapters 1 2 Terms/vocabulary: Explain each term with in the STATISTICAL context. Bar Graph Bimodal Categorical Variable Density Curve Deviation Distribution Dotplot
Japan s Leading Exhibition for Robotics Technologies Jan. 17[Wed]-19[Fri], 2018 Tokyo Big Sight, Japan
![Japan s Leading Exhibition for Robotics Technologies Jan. 17[Wed]-19[Fri], 2018 Tokyo Big Sight, Japan](/thumbs/78/76786007.jpg "Japan s Leading Exhibition for Robotics Technologies Jan. 17[Wed]-19[Fri], 2018 Tokyo Big Sight, Japan") Japan s Leading Exhibition for Robotics Technologies Jan. 17[Wed]-19[Fri], 2018 Tokyo Big Sight, Japan Web: http://www.robodex.jp/en/ POST SHOW REPORT 2018 FACTS & FIGURES 17,186 Visitors 200 Exhibitors
Japan s Leading Exhibition for Robotics Technologies Jan. 17[Wed]-19[Fri], 2018 Tokyo Big Sight, Japan Web: http://www.robodex.jp/en/ POST SHOW REPORT 2018 FACTS & FIGURES 17,186 Visitors 200 Exhibitors
National Census Geography Some lessons learned and future challenges in European countries
 UNSD-AITRS Regional Workshop on the Integration of Statistical and Geospatial Information Amman, Jordan, 16-20 February, 2015 National Census Geography Some lessons learned and future challenges in European
Chapter 2. Organizing Data. Slide 2-2. Copyright 2012, 2008, 2005 Pearson Education, Inc.
 Chapter 2 Organizing Data Slide 2-2 Section 2.1 Variables and Data Slide 2-3 Definition 2.1 Variables Variable: A characteristic that varies from one person or thing to another. Qualitative variable: A
NI sbrio-9632/9642 Verification Procedure
 NI sbrio-9632/9642 Verification Procedure Conventions This document contains information about verifying the National Instruments sbrio-9632/9642. This document does not contain information about programming
Economic crisis, European Welfare State Models and Inequality
 Economic crisis, European Welfare State Models and Inequality Carlos Ochando Claramunt Department of Applied Economics, University of Valencia (Spain) Carlos.Ochando@uv.es Paper presented to XIII International
Describing Data: Frequency Tables, Frequency Distributions, and Graphic Presentation. Chapter 2
 Describing Data: Frequency Tables, Frequency Distributions, and Graphic Presentation Chapter 2 Learning Objectives Organize qualitative data into a frequency table. Present a frequency table as a bar chart
CISCO ONS /100-GHZ INTERLEAVER/DE-INTERLEAVER FOR THE CISCO ONS MULTISERVICE TRANSPORT PLATFORM
 DATA SHEET CISCO ONS 15216 50/100-GHZ INTERLEAVER/DE-INTERLEAVER FOR THE CISCO ONS 15454 MULTISERVICE TRANSPORT PLATFORM The Cisco ONS 15216 50/100-GHz Interleaver/De-interleaver is an advanced 50/100-GHz
PO01275C Tabor East Neighborhood Meeting. Monday, April 20, :30 PM 8:30 PM
 PO01275C Tabor East Neighborhood Meeting Monday, April 20, 2015 6:30 PM 8:30 PM 1 Opening Remarks, Introductions, Explanation of Agenda and Procedure Lenny Borer Moderator 2 Portland Office for Community
Munkaanyag
 TECHNICAL SPECIFICATION SPÉCIFICATION TECHNIQUE TECHNISCHE SPEZIFIKATION CEN/TS 16555-4 December 2014 ICS 03.100.40; 03.100.50; 03.140 English Version Innovation management - Part 4: Intellectual property
Time and Frequency Measurements for Oscillator Manufacturers
 Time and Frequency Measurements for Oscillator Manufacturers Using the FCA3000 and FCA3100 Series Timer/Counter/Analyzers Application Note Application Note Introduction Designing and manufacturing oscillators
AC Line Rated Disc Capacitors Class X1, 400 VAC/Class Y1, 500 VAC
 4L Series D max.5" max (3.).5" min (3) Tinned Copper Leads AC Line Rated Disc Capacitors Class X, VAC/Class Y, 5 VAC LO =.58" (4.) typ. LS LO T max FEATURES Worldwide Safety Agency Recognition Underwriters
Central and Eastern Europe Statistics 2005
 Central and Eastern Europe Statistics 2005 An EVCA Special Paper November 2006 Edited by the EVCA Central and Eastern Europe Task Force About EVCA The European Private Equity and Venture Capital Association
POWERING AMERICA S AND NEVADA S ADVANCED INDUSTRIES
 POWERING AMERICA S AND NEVADA S ADVANCED INDUSTRIES Metropolitan Policy Program at BROOKINGS Las Vegas, October 2014 1 2 3 4 Context What, why Trends Strategy 2 2 3 4 1 Context 3 Real GDP 2005Q1-2014Q2
Maintaining the Argo bibliographies. Megan Scanderbeg
 Maintaining the Argo bibliographies Megan Scanderbeg AST-17 Meeting in Yokohama, Japan March 216 Update for the past year 39 Argo papers published in 299 days in 215 3 articles in Nature Climate Change
Getting Started with the LabVIEW DSP Module
 Getting Started with the LabVIEW DSP Module Version 1.0 Contents Introduction Introduction... 1 Launching LabVIEW Embedded Edition and Selecting the Target... 2 Looking at the Front Panel and Block Diagram...
SR&ED International R&D Tax Credit Strategies
 SR&ED International R&D Tax Credit Strategies On overview of Research & Development (R&D) project management & tax credit claims. Contents International R&D Tax Credits... 1 Definition of Qualified Activities
Process-Controller HPP-25
 Process-Controller HPP-25 Riveting process monitoring 6 different control parameters Touchscreen operation Windows diagnostics software... joining is our business Process-Controller HPP-25 Riveting process
WORLD INTELLECTUAL PROPERTY ORGANIZATION. WIPO PATENT REPORT Statistics on Worldwide Patent Activities
 WORLD INTELLECTUAL PROPERTY ORGANIZATION WIPO PATENT REPORT Statistics on Worldwide Patent Activities 2007 WIPO PATENT REPORT Statistics on Worldwide Patent Activities 2007 Edition WORLD INTELLECTUAL
Power Measurement and Analysis Software
 Power Measurement and Analysis Software TPS2PWR1 Data Sheet Features & Benefits Improve Efficiency of Power Designs with Switching-loss Measurements including Turn-on, Turn-off, and Conduction Losses Reduce
Using the Ramp Rate Method for Making Quasistatic C-V Measurements with the 4200A-SCS Parameter Analyzer APPLICATION NOTE
 Using the Ramp Rate Method for Making Quasistatic C-V Measurements with the 4200A-SCS Parameter Analyzer Introduction Capacitance-voltage (C-V) measurements are generally made using an AC measurement technique.