CHANGEABILITY OF ARC FLASH PARAMETERS AND ITS IMPACT ON HAZARD MITIGATION IN LOW VOLTAGE POWER SYSTEMS
|
|
|
- Megan Fisher
- 5 years ago
- Views:
Transcription
1 CHANGEABILITY OF ARC FLASH PARAMETERS AND ITS IMPACT ON HAZARD MITIGATION IN LOW VOLTAGE POWER SYSTEMS by Abdeslem Kadri Bachelor of Engineering, Boumerdes University INELEC, 1996 A thesis presented to Ryerson University in partial fulfillment of the requirements for the degree of Master of Applied Science in the Program of Electrical and Computer Engineering Toronto, Ontario, Canada, 2016 Abdeslem Kadri, 2016
2 AUTHOR'S DECLARATION FOR ELECTRONIC SUBMISSION OF A THESIS I hereby declare that I am the sole author of this thesis. This is a true copy of the thesis, including any required final revisions, as accepted by my examiners. I authorize Ryerson University to lend this thesis to other institutions or individuals for the purpose of scholarly research. I further authorize Ryerson University to reproduce this thesis by photocopying or by other means, in total or in part, at the request of other institutions or individuals for the purpose of scholarly research. I understand that my thesis may be made electronically available to the public. ii
3 CHANGEABILITY OF ARC FLASH PARAMETERS AND ITS IMPACT ON HAZARD MITIGATION IN LOW VOLTAGE POWER SYSTEMS Master of Applied Science 2016 Abdeslem Kadri Electrical and Computer Engineering Ryerson University Abstract Arc flashes in power system result in a huge amount of incident energy that can injure human workers. Strict safety measures have to be applied in the work place for safety of technical personnel. Computation of the incident energy is imperative to determine the corresponding safety requirements. Arcing current, and hence incident energy, is a function of some system parameters which may vary due to different reasons. This research work considers the problem of parameter variability in arc flash calculations and its effect on hazard mitigation. A mathematical basis is set forth for the impact of the variation in gap between electrodes and system voltage on the incident energy value. Findings of this work emphasize that small variations in system parameters can yield inaccurate values of incident energy and misleading hazard categories. Therefore, parameter variation has to be carefully accommodated in the arc flash calculations to result in the proper hazard mitigation precautions. iii
4 Acknowledgement The completion of this thesis would not have been possible without the consistent help and support of Dr. Farah Mohammadi and Dr. Kaamran Raahemifar, who gave me the opportunity to serve as a Research Assistant under their supervision in the department of Electrical and Computer Engineering at Ryerson University. Their belief in me and my believe in them throughout the difficult times of my research and my graduate studies is what still keeps me motivated to this day. I also wish to thank all the members of Ryerson Lab research group for their constructive guidance and advice. Moreover, I would like to thank the lab technicians for their technical support. Lastly, I would like to thank my wife. Her constant encouragement made the completion of this degree possible. iv
5 Dedication Dedicated to the memory of my mother. v
6 Table of Contents Abstract... iii Acknowledgement... iv Dedication... v List of Tables... viii List of Figures... ix Glossary... xi 1 Chapter One Introduction Arc Flash Thesis Objectives and Contributions Thesis Layout Summary Chapter Two - Protection of Electric Systems Abnormality Conditions Short Circuit Faults Calculation of Fault Currents Protective Devices Circuit Breakers Fuses Summary Chapter Three - Arc Flash Calculation and Power Systems Studies Short Circuit Theory Protective Devices X/R Ratio Coordination of Protective Devices Arc Flash Hazard Arcing Current Estimation Normalized Incident Energy Estimation Incident Energy Estimation Arc Flash Protection Boundary NFPA 70E protection boundaries Energy Levels and Arc Flash Hazard Categories Summary vi
7 4 Chapter Four Changeability of Arcing Parameters and Proposal for Arc Flash Calculation Arcing Current Analysis Based on Clearing Time and Incident Energy Changeability of Incident Energy Changeability of the Gap between Electrodes and its Effect on Arcing Current Changeability of the voltage between electrodes and its effect on arcing current and time Time current curve affect on arcing time A proposed steps and flowchart of calculating arc flash hazard Summary Chapter Five - Simulation Results and Observations Increasing the working distance Modifying the protective device settings Utilize a single main CB for building shut down Install LVPCB instead of the fused disconnect mean before the MDP Install (LVPCB) in front of the step down transformers rated above 125KVA Transformers large than 125 KVA should be replaced with smaller size transformers Summary Chapter Six - Conclusions and Future Work Thesis Summary Summary of Contributions Future Work References vii
8 List of Tables Table 3-1 Tested ratios X/R for protective devices Table 3-2 Equipment classes and typical Bus gaps Table 3-3 x factor for various equipment Table 3-4 Equipment typical working distance Table 3-5 The level of incident energy associated with each category NFPA70E Table 3-6 The level of incident energy associated with each category NFPA70E Table 3-7 The level of incident energy associated with each category NFPA70E Table 3-8 The level of incident energy associated with each category NFPA70E Table 4-1 Min and Max likely changeability in LV arcing currents [39] Table 5-1 Simulation results for Bus Table 5-2 Simulation results for Bus Table 5-3 Simulation results for Bus Table 5-4 Simulation results for Bus Table 5-5 Simulation results for Bus Table 5-6 Simulation results for Bus 4 and Bus Table 5-7 Simulation results for Bus 6 and Bus viii
9 List of Figures Figure 1-1 Arc Flash and Blast (arc current >25KA) Figure 2-1 Current in RL circuit with AC voltage source [18] Figure 2-2 Resulting asymmetrical current [18]... 9 Figure 2-3 Asymmetrical fault current for X/R ratio 6 (simulation) Figure 2-4 Response curve of CB generated from ETAP Figure 2-5 Thermal action trip of CB generated from ETAP Figure 2-6 Magnetic action Instantaneous trip of CB generated from ETAP Figure 2-7 TCC curve for adjustable MCCB generated from ETAP Figure 2-8 Long Delay Time generated from ETAP Figure 2-9 Short Delay Time generated from ETAP Figure 2-10 Instantaneous Pick up generated from ETAP Figure 2-11 Long Delay Pick up generated from ETAP Figure 2-12 Typical fuse generated from ETAP Figure 3-1 Coordination of MCCB (ETAP) Figure 4-1 Histogram of LV arc current calculation error Figure 4-2 Frequency distribution of deviation of measured incident from calculated one Figure 4-3 Changeability of arc current as a function of gap for Ib=36KA and V=208V Figure 4-4 Arc current as a function of gap for different fault currents with V=208V Figure 4-5 Changeability of arc current as a function of electrodes gap and Ib=70KA Figure 4-6 Changeability of arc current as a function of voltage for Ib=70KA and G=32 mm Figure 4-7 Arc current as a function of voltage for different fault currents with G=32 mm Figure 5-1 Arc flash simulation at Bus 54 and Bus Figure 5-2 Arc flash simulation at Bus 54 at working distance of 48 inches Figure 5-3 Arc flash simulation at Bus 61 at working distance of 24 inches Figure 5-4 Simulation of the power system with the High Instantaneous setting of CB Figure 5-5 Arc flash factors affected from the High Instantaneous setting of CB Figure 5-6 Simulation of the power system with the Low Instantaneous setting of CB Figure Arc flash factors affected from the Low Instantaneous setting of CB Figure 5-8 The response of CB57 at High Instantanious setting Figure 5-9 The response of CB57 at High Instantanious setting Figure 5-10 Power system without single main CB before the MDP Figure Arc flash factors affected from the delay response of the Fuse at Bus Figure 5-12 The response of the fuse to the arcing current ix
10 Figure 5-13 The previous Power system with single main CB before the MDP Figure Arc flash factors affected by the fast response of the CB ahead MDP Figure 5-15 The response of the CB to the arcing current Figure 5-16 Power system with fused disconnect switch before the MDP Figure The response of the fuse to the arcing current Figure Arc flash factors affected by the response of the fuse ahead MDP Figure 5-19 Power system with LVCB instead of fused disconnect switch before the MDP Figure The response of the LVPCB to the arcing current Figure Arc flash factors affected by the response of the LVPCB ahead MDP Figure 5-22 Power system with thermal magnetic CB before transformer Figure 5-23 Arc flash factors at Bus 4 (Primary of Transformer T2) Figure 5-24 Arc flash factors at Bus 5 (Secondary of Transformer T2) Figure 5-25 The response of the thermal CB1 to the arcing currents Figure 5-26 Power system with LSI CB before the transformer Figure 5-27 Arc flash factors at Bus 5 (Secondary of Transformer T2) using LSI CB Figure 5-28 The response of the LSI CB to the arcing currents at primery and secondary of T Figure 5-29 Power system with large Transformer T2 feeding 120/208 loads Figure 5-30 Arc flash factors at Bus Figure 5-31 The response of CB3 to the arcing currents at Bus Figure 5-32 Power system with small size Transformers (T6, T13, and T12) instead of T2 in Figure 5-33 Arc flash factors at Bus 9, Bus 15 and Bus Figure 5-34 The response of CB s 6, 12 and 14 to the arcing currents at Bus s 9, 15 and x
11 Glossary AC AFB AFC AFHA AIC ASY Cf COPS D Eb Ei En FLA FPB G Ia Ibf ICBB IT LAB LSI LT LVPCB MCCB MDP PAB PPE RAB SLD ST TCC x Alternating current Arc Flash Boundary Available Fault Current Arc Flash Hazard Assessment Available Interrupting Current Asymmetrical Calculating Factor Critical Operating Power Systems Working Distance Incident Energy at Boundary Distance Incident Energy Normalized Energy Full Load Current Flash Protection Boundary Gap between conductors Arcing Current Bolt Fault current Insulated Case Circuit Breaker Instantaneous Time Limited Approach Boundary Long Short Instantaneous Long Time Low Voltage Power Circuit Breaker Molded Case Circuit Breaker Main Distribution Panel Prohibited Approach Boundary Personnel Protective Equipment Restricted Approach Boundary Single Line Diagram Short Time Time Current Characteristics Distance exponent xi
12 1 Chapter One Introduction The most important factor that has to be taken into consideration in the electrical systems design is safety. In recent years, electric injuries have represented a serious workplace health and safety issue. The seriousness of electric injuries is primarily due to their ability to cause serious complications including sudden cardia arrest, irregular heartbeat, hypoxia, renal failure, and sepsis [1], [2]. Further, it can also produce long term neurological complications and can greatly influence the quality of life [1], [2]. The main injury circumstance related to electric hazard are electric shocks, and arc flash and blast [2]. Since the beginning of the use of the electric power, the electric shock has been a concern. Over the last few decades, significant attention has been paid to develop and regulate the safety standards in the industry. Improper installations may cause fatal injury, fire or damage to the property and equipment. This leads to the necessity of development of the electric guidance and codes. In USA, the National Fire Protection Association (NFPA): National Electric Code (NEC) was first published in 1897 [4], [5] and it is used as a guide for the electric installations design. The Occupational Safety and Health Administration (OSHA) was formed to address the concerns of health and safety in the workplace. As a result of the collaboration between OSHA and NFPA a standard called NFPA 70E (Standard for Electrical safety in the Workplace) was developed. This standard provides guidance for a safe workplace in the electric installations industry. Primarily, it addresses the electric shock and arc flash. In Canada, the Canadian Electric Code (CEC) is the standard published by Canadian Standard Association (CSA) as guidance for electrical installations and maintenance of electrical equipment. And the CSA Z462, Workplace Electrical Safety Standard is the Canadian standard for workplace electrical safety, and was first published in January 2009 [3]. It is based on and harmonized with the NFPA 70E. Bill C45 (also known as Westray Bill) was created and introduced as a result of 1992 Westray coal mining disaster in Nova Scotia. In March 2004, Statute established a duty under Criminal Code of Canada for employers, managers, and supervisors to ensure workplace health and safety. There is no specific limit on fines against a corporation that is found guilty, and individual representatives of a corporation can receive a maximum sentence of life imprisonment [4]. Due to this law, safety has become the primary concern for companies and many have invested to eliminate or reduce the electric shock and arc flash. Both NFPA70E and CSA Z462 are the key standards that outline electrical safety required for employees and electrical safety programs that the employers must 1
13 implement. They provide guidance on how to protect workers that perform energized electrical work tasks. The standards also give guidance for the selection of Personal Protective Equipment (PPE), such as protective clothing and equipment to protect workers from electric arc flash and shock hazards. In addition, the standard also provides the working and safety distances and boundaries from energized equipment, along with the different energy levels. According to the Canadian Center for Occupational Health and Safety, CSA Z462 is a reasonable measure for an employer to follow to protect its employees [5]. CSA Z462 has been revised and we are now following the 3 rd edition, which was published in January Arc Flash In low voltage, shock injuries happen due to direct contact with electric current. However, a high voltage can create an arc that carries electric current without any direct physical contact [1], [9], [10]. It is created when an abnormal condition exists on energized electrical equipment, and an arc fault occurs that leads to an arc flash. There are many factors that can cause and increase the probability for arc flash, such as human interaction, deficiency in human performance and lack of electrical equipment maintenance. An arc flash is tremendous release of electrical energy to the air when a breakdown occurs between conductors. It can also appear when an energized conductor comes in contact with another energized conductor or with the ground, resulting in either a small spark or big explosion. This explosion is known as arc flash and it gives off thermal radiation, thermal heat and can cause burns or serious injuries to workers that are several feet away. Temperature has been recorded as high as 35000F and may cause serious burns, hearing loss, eye injuries, skin and lung damage [6]. Strong arc flash also creates considerable pressure waves that heat the surrounding air, causing a blast that can hit the worker and the equipment with strong pressure. This pressure is about ten times the value of wind resistance that walls are normally built to withstand, so such an arc could readily destroy a conventional wall at a distance of about 40 ft (12 m) or less. A 25-kA arc could similarly destroy a wall at a distance of 9.5 ft (3 m) [7]. 2

14 Figure 1-1 Arc Flash and Blast (arc current >25KA). One of the first papers concerning the arc flash quantified the incident energy released, and was written by Ralph Lee. Lee s paper developed a relationship between the heat transfer and distance and its effect on human skin. This paper highlighted some of the dangers of an arc flash, resulting in many in the industry seeking more information regarding the proper protective equipment that should be used at each particular level of exposure. Now, the focus starts on measurement and calculation of incident energy that an arc flash may produce. A paper by Doughty, Neal and Floyd discussed the measurement and prediction of the incident energy based on two factors: the available fault current, and the distance from the arc source. An important result was that incident energy is bigger when the arc source is located in an enclosure with an open door versus a source in open air with the same distance [8]. Tests were done by using manikins to understand and mimic how humans can be affected by arc flash [9]. Arc flash hazard was first considered in 1995 by NFPA 70E standards and the Personnel Protective Equipment (PPE) and Hazard Risk Table was thus introduced. The standard used 5 categories (0-3
15 4) with different PPE requirement and classified by task and not by the hazard level or the incident energy. In 2002, Institute of Electrical and Electronics Engineering (IEEE) published the IEEE guide for performance arc flash hazard calculations. This standard was the basis of evaluating the arc flash hazard based on incident energy calculation in the location required at the electric installation. It became the standardized way of hazard calculation and is still used as the primary method today. Therefore, it is possible to calculate the incident energy at any point in the installation and consequently, the related thermal exposure and the selection of the relevant PPE. Gammon and Matthews published a paper in 2005 that highlighted the comprehensive statistical analysis of the IEEE 1584 test data [10]. In 2011, Curtis Thomas discussed and suggested a few techniques used in the industry to reduce arc flash hazards [11]. The results of Curtis show important reduction of arc hazards. 1.2 Thesis Objectives and Contributions This thesis focuses on the variation of arc flash parameters such as voltage, gap between electrodes and arcing time. Examine the challenge of reducing the risk of injury, minimizing the arc flash hazard and improving the safety of workers at electric equipment. This work simulate those techniques used to mitigate arc flash and investigate the impact of arc parameters variation on them. Further, we propose calculation procedure that may lead to adequate results. 1.3 Thesis Layout In chapter 2, protection of electrical systems is discussed. Short circuit calculation and the different protective devices along with their characteristics and their use are investigated. In chapter 3 the method of fault current calculation is described. The options of protective devices are also discussed. Lastly, the arc flash hazard calculation methodology is presented. The chapter 4 is dedicated to changeability in arcing parameters such as voltage and gap. Their effect on arcing current and arcing time is discussed. The chapter 5 will focus mainly on the results and observations. Simulation of the scenarios used to mitigate the arc flash hazard using IEEE 1584 standard is performed. The same scenarios 4
16 are carried out with the consideration of voltage and gap variation. The results is compared and analyzed. Furthermore, the impact of voltage and gap between electrodes variation on incident energy and hazard category is shown. The conclusions, final thoughts and future works are presented in chapter 6. Finally, the reference section covers all the sources used in this endeavor. 1.4 Summary This Chapter gives an introduction to the topic of the research work. Arc flash is defined highlighting its causes and impacts. Historical development of industry standards related to arc flash in North America is stated. A quick literature review on the topic of arc flash is presented. The objectives of this research are stated along with the contributions of the work. Finally, the layout of this thesis report is given. 5
17 2 Chapter Two - Protection of Electric Systems The purpose of electrical systems is to provide electrical energy to equipment in a reliable and safe way. The equipment will convert the delivered energy to the form that is needed by the user. These electrical systems must be capable of delivering the required electric energy in a continuous form, which must be protected against any outage or damage in case of any abnormal circumstances. However, equipment may fail by nature, resulting in serious influx of energy, putting the users, installation and equipment in danger. The protection system is used to isolate the faults as quickly as possible and save the users from harm, and equipment from fire and damage. 2.1 Abnormality Conditions There are many situations that abnormal conditions may occur. Events such as overloads, short circuits, under voltage, single phasing of three phase systems, overvoltage and transient surges, incorrect synchronizing of frequencies, incorrect phase sequence and reverse power flow are some of the common causes of abnormality. Amongst these, the most common abnormalities in low voltage power systems are overloads and short circuits. Therefore, our focus will be on these two. Overload is caused by an extra demand from the equipment, but is not the result of any failure in the system itself. On the other hand, a fault, such as a short circuit or ground fault, is not an overload [12]. In fact, fault is caused by an electric failure and the resulting current can be huge compared to the normal operating current. As such, it must be isolated as quickly as possible in order to minimize the risk of damage and harm. 2.2 Short Circuit Faults Faults occur in normal electric installations, and an unintentional electric path will be created. As a result, the voltage will collapse and a high influx of current will flow toward the fault location from all parts of the electrical system. Fault current are reduced with distance from the source due to system impedance [13]. In power systems, there are four types of faults: (i) single line to ground, (ii) line to line, (iii) double line to ground and (iv) balanced three phase fault [14]. Line to ground faults start from few percentage to 125% of the three phase value. Line to line faults 6
18 are approximately 87% of three phase fault current. The probability of line to ground fault current value to exceed the three phase value is very low [15]. It is a well-known fact that line to line faults in equipment and cables turn into three phase faults very quickly [16]. The three phase fault is used because it gives the maximum and conservative value [15]. 2.3 Calculation of Fault Currents All currents used in arc flash simulation and modeling are three phase because three phase faults produce the maximum and conservative values. It is crucial to calculate the maximum fault current that can flow at any given point on the electrical installation to ensure the correct selection of equipment. The electric codes require that equipment intended to break current at fault level must have an interrupting rating that is sufficient enough that it can clear the fault without any damage. As we discussed before, the maximum fault current in low voltage installations occurs in three phase bolted faults. Therefore, calculations are held on this basis. It is important to mention that the fault current may not be symmetrical depending on the time at which the fault happens during the cycle. Therefore, the resulting current can be offset from the normal current axis and become asymmetrical [17]. Power systems are highly inductive (transformers and the like) [17] Figure 2-1 shows a theoretical circuit with resistance and inductance. The closing of the switch mimics a fault on the system and the current flow represents the fault current. For simplicity and conservative results, we assume zero fault impedance (bolted fault). Writing KVL: Ldi(t) dt Solving result in: + Ri(t) = 2Vsin(ωt + a) where t i(t) = i ac (t) + i dc (t) = 2V Z [sin(ωt + α θ) sin(α θ) e t T ] A
19 Figure 2-1 Current in RL circuit with AC voltage source [18]. i ac (t) = 2V sin(ωt + α θ) A Z i dc (t) = 2V Z sin(α θ)e t/t A Z = R 2 + (wl) 2 = R 2 + X 2 Ω ωl 1 θ = tan R = X tan 1 R T = L R = X ωr = X 2πR s The fault current in equation is called the asymmetrical fault current. The AC fault current given by equation is called symmetrical or steady state current and the DC offset current is given by equation The total fault current is the sum of its two components: the symmetrical fault current and the DC offset, which decays exponentially with a time constant T=L/R as shown in Figure
20 Figure 2-2 Resulting asymmetrical current [18]. From equation 2.3.4, the maximum value of the DC offset is 2V Z when sin(α θ)e t/t =1 and α = θ ± π. Since the fault may happen at any instant during the cycle of the source, we are 2 interested in the maximum possible value of the fault current. i(t) = 2V Z [sin (ωt π 2 ) t e T ] A (2.3.2) From equation 2.3.3, V Z is the RMS value of i ac(t). So, I ac = V Z A. From equation 2.3.2, we treat the exponential term as a constant and we apply the concept of rms to the asymmetrical fault i(t) with maximum DC offset. I ASY = (I ac ) 2 + (I dc ) 2 Using T=X/(2π f R) and t = τ /f, this implies: Where: I ASY = I ac 1 + 2e 2t T A I ASY = K(τ)I ac A K(τ) = 1 + 2e 4π/(x R ) p. u 9
21 The K (τ) is called the asymmetry factor. It is clear that the asymmetrical fault can have a maximum value of 3 I ac when τ =0 and reach I ac when τ is very large. Note that a higher X/R value gives a higher I ASY value. It is very convenient to consider the fault current as asymmetrical current consisting of two components: (i) symmetrical AC current alternating or superimposed on (ii) a DC current [19] [17]. The peak value of this asymmetrical fault current appears in the first half cycle of the fault known as the Available Fault Current (AFC). Note that electrical systems are generally inductive circuits, meaning the resistance is negligible. With this in mind, if we consider I ac as 1pu, then I ASY = (I ac ) 2 + (I dc ) 2 = (1.0) 2 + ( 2) 2 = 3 This means that the rms value of the asymmetrical current is 1.73 times the symmetrical current. This will result in significant mechanical and thermal stress on the electrical installation as these stresses are proportional to the square of the rms value of the current [17]. The system conditions play a serious role on the decay of the offset DC component. The rate at which the DC component decays depends on the ratio of the system X/R Figure 2-3 shows a typical low voltage electric systems with X/R = 6 as simulated in MATLAB. Figure 2-3 Asymmetrical fault current for X/R ratio 6 (simulation) 10
22 2.4 Protective Devices Circuit Breakers The main function of protective devices is to detect any abnormal situation or fault and disconnect it automatically and safely from the system. Protective devices are rated for the following parameters: 1. Maximum continuous voltage 2. Maximum continuous current 3. Interrupting rating 4. Short time current rating These are the ratings applied to the basic protective device mechanisms and there are separate ratings for the detection units incorporated into the protective device. The detection units of the protective device respond quickly to large fault currents and respond slowly for overloads. This characteristic is known as inverse time characteristic. Figure 2-4 shows a circuit breaker curve that has both the inverse time element and the instantaneous element. Figure 2-4 Response curve of CB generated from ETAP Circuit breaker parameters such as available interrupting capacity and rated continuous current are very crucial in design of the electric systems. The interrupting capacity, or the breaking capacity, 11
23 is the maximum fault current the CB can interrupt with fixed voltage. This interrupting capacity is expressed in rms current magnitude [20]. There are two types of tripping units: (i) the series and (ii) the solid state type. The series are thermal and magnetic connected in series with each power line. The thermal action provides respond to overloads that is way less than short circuit current and it trips the breaker after some delay. On the other hand, the magnetic action provides instantaneous tripping and it respond quickly to short circuit currents. Figure 2-5 shows the thermal action of MCCB, the time delay tripping and the graph of typical inverse time current response. Figure 2-6 shows the magnetic action and the instantaneous tripping of MCCB. And Figure 2-7 shows the combined thermalmagnetic action. Figure 2-5 Thermal action trip of CB generated from ETAP 12
24 Figure 2-6 Magnetic action Instantaneous trip of CB generated from ETAP Circuit breakers are analyzed graphically from their Time Current Curves (TCC) and they are available with adjustable magnetic trip. Figure 2-6 shows non-adjustable thermal magnetic MCCB. Note that the graph showing minimum and maximum values represent the boundaries of the operating band. Regardless of the precision of the circuit breaker, there will be small differences between the individual breakers of the same type. Figure 2-7 shows a thermal MCCB and its TTC curve with adjustable magnetic trip setting. In this type of MCCB s, we can adjust the pickup of the fault current. 13
25 Figure 2-7 TCC curve for adjustable MCCB generated from ETAP The other circuit breaker used in the industry of electrical power distribution is the low voltage power circuit breaker (LVPCB). It is more flexible and has a higher rating than MCCB. In fact, it is generally called power circuit breaker to be distinguished from the MCCB. The national Electrical Manufacturers Association defines the low voltage power circuit breaker as one for use on circuits rated 1000 volts alternating current and bellow, but not including molded-case circuit breakers. These breakers handle large amounts of power, up to 4000 amp at 600 volts. These breakers are heavier and larger than MCCBs. Power circuit breakers have thermal-magnetic trip for overload tripping; however, they have 30 cycle short time current rating as per the ANSI standard [21]. These features or settings are used for coordination purpose and they are called Long-time, Short-time and Instantaneous (LSI). Most of the power circuit breakers today are of the solid state type. The solid state type mimics the TCC of the thermal magnetic type and provides more flexibility, features and precision. Several settings are provided for LVPCBs. 14
26 Figures 2-8, 2-9, 2-10 and 2-11 show a typical TCC with the different possible settings in the four time domain (long delay time, short delay time, instantaneous pick up, long delay pick up, respectively). Figure 2-8 Long Delay Time generated from ETAP Figure 2-9 Short Delay Time generated from ETAP 15
27 Figure 2-10 Instantaneous Pick up generated from ETAP Figure 2-11 Long Delay Pick up generated from ETAP 16
28 Over time, the distinction between molded case breakers (MCCB) and power circuit breakers disappeared because of the development of large frame MCCB s with solid state trip units. These new MCCBs are known as hybrid circuit breakers. Insulated circuit breakers are molded case circuit breakers which have some features of low voltage power circuit breakers LVPCB [20] [22]. The industry recognizes three types of circuit breakers molded-case circuit breakers (MCCB), insulated-case circuit breakers (ICCB), and low-voltage power circuit breakers LVPCB). Insulated-case circuit breakers are designed to meet the standards for molded-case circuit breakers [23] Fuses The national electric code defines the fuse as an overcurrent protection device with a circuit opening fusible part that is heated and severed by the passage of current through it [24]. Fuses have amp rating, voltage rating and interrupting ratings. In low voltage systems, they are used to protect from overload and short circuit currents. These fuse respond to thermal energy, causing it to melt when sufficient current pass through it [25]. The heat is a function of I 2 t. So the fuse automatically has an inverse time current response TCC. Figure 2-12 shows a typical fuse response curve. The two boundaries in the graph represent the minimum melt time and the total clearing time of the fuse. The American National Standards Institute (ANSI) standards allow a maximum tolerance of +/- 10% in the melting current for any given time. The area between the two lines in the graph is the operating band of the fuse. 17
29 Figure 2-12 Typical fuse generated from ETAP 2.5 Summary This Chapter presents a few concepts of electric power system protection as related to the problem of arc flash. Abnormal operation conditions in power systems are introduced with focus on short circuit faults. Then, fault current calculations are addressed, in particular three-phase faults which give conservative results. The effects of power system components parameters (resistance and reactance) on short circuit faults are summarized. Operation of power system protective devices, especially circuit breakers, is explained. Distinction is made between circuit breaker behaviours under overload and short circuit conditions as related to their function in protecting power system components. 18
30 3 Chapter Three - Arc Flash Calculation and Power Systems Studies As part of a risk assessment procedure, an arc flash risk assessment would be required in order to reduce severity or harm. In order to do so, a fault current analysis, protective device coordination, a short circuit analysis and arc flash calculations must be carried out. By conducting the short circuit analysis, we will figure out the available fault current and consequently, the interrupting rating of the protective devices and the equipment withstand. The protective devices coordination will show the possibilities of reducing the risk through fault time reduction. Finally, the arc flash study will help us to measure the incident energy at different locations within the system. 3.1 Short Circuit Theory As discussed in sections 2.1, 2.2 and 2.3, electric fault may occur due to many reasons, whether intentionally or unintentionally. In most cases, it will be developed to three phase fault. The short circuit value at that location is called the available fault current (AFC). The equipment installed at that location must have withstand rating that is higher than the available fault current, in order to support the corresponding mechanical and thermal stresses. The protective devices must also have an available interrupting capacity (AIC) or breaking capacity higher than the AFC in order to interrupt the fault without any damage [26]. Protective devices such as fuses and circuit breakers must be capable of interrupting the biggest possible fault that may happen. All other parts of the system such as bus bars, feeders, cables must be capable of handling the faults and supporting the associated stresses. At the time of the fault in the installation, sources such as utility system, generators and all motors (both synchronous and induction) contribute to the value of the fault. The components that impede the fault current are the cables and transformers. The process of calculating the fault currents is documented in IEEE standard [19] and [32]. A point to point fault calculation method is presented here [32]. F = L AFC C n V 19
31 Where: L: Length of the conductor AFC: Available Fault current at the beginning of the run C: Constant representing conductor type n: number of conductors parallel runs V: Voltage Line to Line The available fault current AFC or the available short circuit capacity at the service entrance is provided by the local utility. Since we always prefer to take conservative values with the intention to assess the system during the worst case high fault current scenario, we consider the infinite bus calculation. This assumption not only simplifies the calculation but also gives us the maximum possible fault current that can be seen in the secondary of the service transformer. This results in the following calculation procedure: [32]. Step 1: calculate the Full Load Current at the secondary of the transformer FLA secondar = KVA 3PH 3KV LL Step 2: calculate the Available Fault Current at the secondary of the transformer AFC secondar = FLA secondary 100 %Z As we discussed in Section 2.3 and shown in Figure 2-3, the peak value of the first cycle is strongly related to the DC exponential decay value. The rate at which the DC component decays depends on the ratio of the system reactance and resistance R under fault conditions. In most power systems, the DC component decays to an insignificant value within 0.1 seconds [19]. Electrical installations are mostly resistive and inductive components due to cables, transformers and utility source. The factor X/R has a significant effect on the selection of protective devices and power distribution equipment. Once the fault happens, the current is no longer sinewave and it is a combination of symmetrical part and a decaying DC component. As shown in Section 2.3, the larger the X/R ratio, 20
32 the longer the DC part exist [33] and [34]. Therefore, the selection of the protective devices depends on the AFC as well as the X/R of the system. In case the tested X/R of the protective device is less than the X/R of the system, a de-rated factor is applied to go for higher value of AIC [35]. 3.2 Protective Devices X/R Ratio. Protective devices (circuit breakers) are tested as per ANSI and UL standards [21], [36], [37], and [38]. X/R parameter, also called DC decay factor, is of our interest. Circuit breakers used in low voltage power system installations are tested at previously determined ratios as shown below [35]. Table 3-1 Tested ratios X/R for protective devices Test X/R ratios for protective devices Protective Device Test X/R LVPCB 6.6 MCCB rated <10K AIC 1.7 MCCB rated between 10K and 20K AIC 3.2 Fuses, ICCB, MCCB rated > 20K AIC 4.9 The AIC and the X/R ratio are crucial parameters derived from the short circuit analysis of the system to decide whether or not the panel boards and the protective devices are suitable at a specific location in the installation. 3.3 Coordination of Protective Devices The goal from protective devices coordination is to minimize the damage to personnel and equipment at the time when the fault occurs. IEEE clearly stated coordination is basic ingredient of a well-designed electrical distribution system and is mandatory in certain healthcare and continuous industrial systems [32]. Coordination is applied to all series protective devices from 21
33 utility to the equipment using the power. Both fuses and circuit breakers have to be coordinated by the use of their time current curves (TTC). An example shown in Figure 3-1 below explains the process and the goal of coordination [17]. With fault at location A, the breaker with 100A trip will clear the fault before the main breaker of 300A trip and shut down the power from all the circuits. The circuit breakers are more flexible than the fuses in protection coordination because they contain adjustable settings. Circuit breakers with long time (LT), short time (ST) and instantaneous (I) settings are called LSI protective devices. Those adjustments in the three time domain allow for a circuit breaker curve to be coordinated and custom fitted for any specific application. Figure 3-1 Coordination of MCCB (ETAP) 3.4 Arc Flash Hazard The procedure which will be described here about the arc flash calculation methods is recommended by IEEE standard The empirically derived equations were developed by IEEE working group on arc flash. The conditions for which the IEEE 1584 equations are applicable are: 22
34 1- System voltage: kv to 15 kv 2- Frequencies: 50 or 60 Hz 3- Bolted fault current: 0.7 to 106 ka 4- Gap between electrodes: 13 to 153 mm 5- Equipment enclosure type: Open air, box, MCC, panel, Switchgear, cables 6- Grounding type: Ungrounded, grounded, high resistance grounded 7- Phases: 3 phase faults The results from short circuit analysis and protective device coordination are used to perform the arc flash hazard. And the arc flash hazards results are used to indicate or name the flash protection boundary and the incident energy level. The IEEE-1584 estimates the incident energy from the arc due to heat [16]. The procedure includes the calculation of the arcing current, followed by the incident energy and finally, concludes the arc flash boundary Arcing Current Estimation For low voltage systems (less than 1000V), the arc current is given by the following equation [16]. I a = 10 K log(i bf) v g v log(i bf ) G log(i bf ) 3.1 Where: I a is the arcing current (KA) K = ; open configuration = ; box configuration I bf = bolted fault current for three phase faults symmetrical RMS in KA V = voltage system KV G = Gap between conductors, mm For medium voltage system (>1000V), the arc current is given by this equation 23
35 I a = log(i bf) In our study we focus on low voltage systems (industrial or commercial buildings). Therefore, the voltage is three phase 480V and the factor K is for electric panels. The factor G is the gap between electrodes or bus bars. In our case, G will be represented by the gap between electrodes in panels or switchgears. In low voltage systems, the value of G for these panels will be 25mm or 32mm as per the IEEE [16] as can be seen from the following table: Table 3-2 Equipment classes and typical Bus gaps. Typical Bus gaps as per IEEE-1584 Equipment class Bus gap 15 KV switchgear 152 mm 5 KV switchgear 104 mm Low voltage switchgear 32 mm Low voltage MCCs and Panel boards 25 mm Cable 13 mm In case of the switchboards equation 3.1 becomes: I a = log(i bf) Normalized Incident Energy Estimation Normalized incident energy is based on 610 mm (24 inch) distance from the arc in duration of 0.2 seconds and it is given by the following equation: E n = 10 K 1+K log(i a ) G 3.3 Where E n = Incident energy normalized for time and distance (J/cm2) 24
36 I a = arcing current from Equation 3.2 K 1 = open configuration = box configuration K 2 = 0 underground and high resistance grounded system = grounded systems G = Gap between conductors (mm) As we mentioned earlier, we will be studying low voltage systems. In such systems, the protective devices are mostly within panels and switchgears, and our system is grounded for safety purposes. Therefore, K1 and K2 are and , respectively. Hence the normalized energy becomes: E n = log(i a ) Incident Energy Estimation We use the normalized incident energy to find the actual incident energy at any distance with arcing time duration at normal surface by the following equation [16]. E = 4.184C f E n ( t x 0.2 ) (610 D ) 3.5 Where E = incident energy (J/cm 2 ) Cf = calculation factor = 1.0 for voltage >1000V = 1.5 for voltage < 1000V t = arcing time (seconds) D = working distance from arc (mm) x = distance exponent as show in the following table [16] 25
37 Table 3-3 x factor for various equipment Distance factor x for various voltages and enclosure types Enclosure type to 1000V >1KV to 15KV Open air 2 2 Switchgear MCC and panels NA Cable 2 2 Our system is low voltage system. Therefore, Cf is 1.5 and x is dependent on whether we are on MCC, panel or switchgear. The distance from the arc or the energized electrical conductor to the person working on the electric panel is standardized by the IEEE-1584 as per the following table [16]. Table 3-4 Equipment typical working distance Typical working distance D as per IEEE KV and 15 KV switch gear 36 inch Low voltage switchgear 24 Low voltage Panel or MCC 18 Cable Arc Flash Protection Boundary In his paper, The other electric hazard: electric arc blast burns, Ralph lee evaluated the incident energy that causes a curable burn which is 1.2cal/cm2 [6]. This value is crucial in the arc flash hazard studies. The distance from the energized conductor at which the incident energy is equivalent to1.2cal/cm2 is named arc flash boundary. At this distance, the person without personal protective equipment may get a second degree burn which is curable. The boundary distance is given by the following equation: 26
38 1 D B = 610 [4.18C f E n ( t ) ( 1 x )] 0.2 E B 3.6 Where D B = distance of the boundary from the arcing point (mm) C f = calculation factor = 1.0 for voltage > 1000V E n = incident energy normalized = 1.5 for voltage <1000V E B = incident energy at the boundary distance (1.2cal/cm2) t = arcing time (seconds) x = the distant exponent (from IEEE-1584 distance exponent table) I bf = bolted faulted current (KA) NFPA 70E protection boundaries. According to NFPA, the flash boundaries are four: 1. Flash protection boundary: explained in the previous section Limited approach boundary: 42 inch for 480 V 3. Restricted Approach boundary: 12 inch for 480 V 4. Prohibited Approach boundary: 1 inch for 480 inch Energy Levels and Arc Flash Hazard Categories In order to protect the person who is working at the electrical equipment, he/she need to wear the appropriate clothing and the personal protective equipment (PPE) rated for the expected incident energy. The selected PPE must have rating greater than that of the maximum incident energy possible. Beside the IEEE 1584, NFPA 70E standard published a safety requirement and divides the incident energy levels into five categories (0-4), with each category representing the level of danger, which depends upon the incident energy level [NFPA 70 E 2004]. Category 0 27
39 represents 0 or no risk, whereas category 4 is very dangerous. The tables below shows the level of incident energy associated with each category. Table 3-5 The level of incident energy associated with each category NFPA70E2000 Hazard Classification as per NFPA 70E 2000 Category Energy Level 0 < 1.2 Cal/cm2 1 5 Cal/cm2 2 8 Cal/cm Cal/cm Cal/cm2 Table 3-6 The level of incident energy associated with each category NFPA70E2004 Hazard Classification as per NFPA 70E 2004 Category Energy Level 0 < 2 Cal/cm2 1 4 Cal/cm2 2 8 Cal/cm Cal/cm Cal/cm2 28
40 Table 3-7 The level of incident energy associated with each category NFPA70E2009 Hazard Classification as per NFPA 70E 2009 Category Energy Level 0 < 1.2 Cal/cm2 1 4 Cal/cm2 2 8 Cal/cm Cal/cm Cal/cm2 Table 3-8 The level of incident energy associated with each category NFPA70E2012 Hazard Classification as per NFPA 70E 2012 Category Energy Level A < 2 Cal/cm2 B 4 Cal/cm2 C 8 Cal/cm2 D 25 Cal/cm2 E 40 Cal/cm2 F 100 Cal/cm2 G 120 Cal/cm2 3.5 Summary This Chapter introduces the calculations of arc flashes and reports relevant power system studies in the context of arc flash hazards. The application of short circuit current calculation in power system is highlighted with emphasis on the effect of X/R ratio on protective devices. The coordination of protective devices within a power system is explained. Arc flash calculations are presented in light of the IEEE 1584 Guide underlining the arcing current, normalized energy, incident energy, and protection boundary. Different risk categories with their corresponding values of incident energy are reported based on different industry standards. 29
41 4 Chapter Four Changeability of Arcing Parameters and Proposal for Arc Flash Calculation This chapter contains a review of comments of IEEE 1584 guide methodology. It is not possible to calculate the exact arc current or the related incident energy due to the randomness nature of arc flash. The equations used in IEEE standard are empirical and based on regression analysis. The IEEE equations is a best fit curve with an R-square of 98.3%, R-square is a measure of the equation fit to the data [16]. These results are based on specific humidity, pressure, ambient temperature and other factors. Various studies indicate these factors affect the value of arc flash even though they are not represented in IEEE equation [39]. Therefore, applying these equations using data from various facilities may not produce the same result analysis. 4.1 Arcing Current Analysis Based on Clearing Time and Incident Energy The arc current will determine the arc clearing time. If the calculated arc current is close enough to the knee of the time current curve TTC, a tiny variation in current will cause a big change in arc time. This may result in huge variation in incident energy. The IEEE proposed solution is to have two arcing currents. The first is the calculated arc current and the second is 85% of the first calculated arc current. Moreover, the relevant values of the incident energy are calculated and the bigger one will be selected. This approach is derived from the difference between the test data in the laboratory and the calculated data using empirical equations. Figure 4.1 indicated the error percentage between calculated and lab results. First, the estimated arc current was calculated for different conditions, and compared with the measured data. The difference between these two presented as the percentage of estimated values. The positive error represents bigger calculated data then measured one. The median located at negative value of -4.2%, which is in the safe side. The red graph in Figure 4.1 represents the same procedure with 85% of the calculated currents. The median also 30
42 located at -18.4% of the measured arc current. The remaining of the points (8.5%) are bigger than the measured values. (IEEE Data Appendix A). Even though we are calculating a definite value, in reality it is a number that may lay between upper and lower limits. Figure 4-1 Histogram of LV arc current calculation error Table 4-1 highlights the upper and lower limits of low voltage arcing currents for different probability values. Table 4-1 Min and Max likely changeability in LV arcing currents [39]. Mean Standard Minimum Maximum Deviation, % Deviation, % Probability, % arcing Current arcing Current
43 The changeability in arcing current will affect the clearing time and consequently may cause variation in incident energy level. The incident energy may become bigger for smaller arc currents in case the arc current falls in the inverse time part of the time current characteristics. 4.2 Changeability of Incident Energy The actual incident energy is different from the estimated one. By examining the IEEE data (Appendix A) we can plot the difference between the measured and estimated value of the incident energy verses the frequency of its appearance. Figure 4-2 shows the frequency distribution of the deviation of the actual incident energy from estimated value. This is done by examining the IEEE data found in Appendix A. The estimated incident energy was calculated in different conditions, and compared with the measured values. The difference as a percentage of estimated values. As indicated in Figure 4-2, the arcs in open air have measured incident energy which is smaller than estimated. Therefore, the difference between the measured and estimated energy is negative. However, in box configuration, calculated incident energy may or may not be greater than measurement. This creates a possibility that calculations may be misleading in some cases. Accordingly, the reflection on the changes in hazard mitigation is obvious. The approximation of deviation is greater or equal than 20%. In other words, the actual incident energy is less or equal to 80% of the estimated one. However, this is not the case for arcs in enclosure or box. From figure 4-2 we can see clearly that the deviation of measured incident energy in box can be bigger than 70% of the estimated one. 32
44 Figure 4-2 Frequency distribution of deviation of measured incident from calculated one 4.3 Changeability of the Gap between Electrodes and its Effect on Arcing Current The arcing current developed in the standard IEEE 1584 is a function of gap between conductors in Equation 3.1 reproduced bellow: I a = 10 K log(i bf) v g v log(i bf ) G log(i bf ) 3.1 It is not possible to assess the hazard at every point in the power installation, nor necessary. Therefore, the assessment will be conducted only at those locations where workers are exposed to arc flash risk. Switchgears, panels and MCC s are all subject to arc flash hazard assessment (AFH) if, they represent a threat or risk. An engineer will take a look at the single line diagram of the installation or make a site visit and decide about the different locations. Therefore, the assumption is to have fixed voltage and fixed fault current in specific locations. In order to examine the effect of electrode gaps on the arcing current the Equation 3.1 has to be represented as a function of the gap G. 33
45 I a = F(G) = 10 K log(i bf) v g v log(i bf ) G log(i bf ) Therefore, df(g) dg df(g) dg df(g) dg = ln(10) F(G)[ log(i bf)] = ln(10) F(G) [ log(i bf)] = ln(10) F(G) [ log(i bf)] df(g) dg > 0 if I bf < df(g) dg < 0 if I bf > Which is always the case. This yield that the gap increases. df(g) dg < 0 and the arcing current decrease as Figure 4-3 shows the variation of arc current as a function of gap between phases. The arcing current is an exponential function of the gap G. However, within limited range of gap variation the function has linear behavior. Moreover, by examining the graph in Figure 4-3 it is clear that there is a variation to arc current. If we can approximate the limits of the variation, then we determine the bounds of the arcing current and clearing time which lead us to the possible incident energy. 34
46 Figure 4-3 Changeability of arc current as a function of gap for Ib=36KA and V=208V As it can be interpreted from figure 4-4, change of available fault current effects the changeability of the arcing current accordingly considering different rate of change. Change in arcing current may express in terms rate of change and gap variation as it stated in 4.1: ΔIa = k G ΔG + C Such that k G is the slop where K G < 0 a constant that can be derived from the graph k G = Ia 1 Ia 2 G 1 G 2 The percentage variation in arcing current can be expressed as follows: Ia (%) = k G G(%) + C By including this variation in the calculation of the arcing current Ia, we are more close to an adequate value of arcing current and the associated incident energy. 35
47 Figure 4-4 Arc current as a function of gap for different fault currents with V=208V Figure 4-5 Changeability of arc current as a function of electrodes gap and Ib=70KA 36
48 4.4 Changeability of the voltage between electrodes and its effect on arcing current and time The arcing current also is a function of voltage system. Arcing current is responsive to voltage fluctuation. There are several electric code standard for voltage drops. These electric codes restrict the voltage drop of 5% for low voltage systems. However this voltage drop is 8% for medium voltage systems. As we know, equipment may operate at ±10% of their rating voltage. The voltage fluctuates as the loads are connected and disconnected. Equation 3.1 reproduced bellow: I a = 10 K log(i bf) v g v log(i bf ) G log(i bf ) Rewriting I a as a function of V: I a = F(V) = 10 K log(i bf) v g v log(i bf ) G log(i bf ) Therefore, df(v) dv df(v) dv = ln(10) F(V) [ log(i bf)] = ln(10) F(V) [ log(i bf)] df(v) dv > 0 if I bf > Which is always the case. This yield that the voltage increases. df(g) dg > 0 and the arcing current increase as Figure 4-6 shows the variation of arc current as a function of system voltage. The arcing current is an exponential function of the system voltage V. However, within limited range of voltage variation the function has linear behavior. Moreover, by examining the graph in Figure 4-6 it is clear that there is a variation to arc current. If we can approximate the limits of the variation, then we determine the bounds of the arcing current and clearing time which lead us to the possible incident energy. 37
49 Figure 4-6 Changeability of arc current as a function of voltage for Ib=70KA and G=32 mm As it can be interpreted from figure 4-6, change of available fault current effects the changeability of the arcing current accordingly considering different rate of change. Change in arcing current may express in terms rate of change and gap variation as it stated in 4.3: ΔIa = K V ΔV + C Such that k V is the slop where K V > 0 a constant that can be derived from the graph k V = Ia 1 Ia 2 V 1 V 2 The percentage variation in arcing current can be expressed as follows: Ia % = k V V% + C If we assume V=1volt, this will result in Ia % = k V % which means that if the voltage varies by 1 volt this will result in a variation of k V % in the value of arcing current (Ia). By including this 38
50 variation in the calculation of the arcing current Ia, we are more close to an adequate value of arcing current and the associated incident energy. Figure 4-7 Arc current as a function of voltage for different fault currents with G=32 mm 4.5 Time current curve affect on arcing time The TCC for protective devices is used to determine the arcing current time that the protective device need to clear the fault. The response characteristics are shown on standard time current curves. There is always a differences between individual breakers or fuses of the same kind, type and rate even though they have the same rate. In the case that the TCC of a fuse represented by a line and all the variations are below the actual line, the curve may be formulated base on the manufacturer data using curve fitting technique. However, if there is any added manufacturer tolerance have to be taken into consideration for more adequate value to the arcing time 39
51 4.6 A proposed steps and flowchart of calculating arc flash Start hazard Location/Equipment AFHA Data collection for Isc Mode of operation 3ph Isc (Bolted Fault Current) for different operating modes Ib (min) & Ib (max) Ia at 100% of IEEE1584 for Ib (min) and for Ib (max) Ia at 85% of IEEE1584 for Ib(min) and for Ib (max) Tolerance due to random variation based on actual data Variation of arcing current with arc gap Ia (%) = k G G(%) + C 1 Variation of arcing current with Voltage Limits for arc currents Ia % = k V V% + C 2 Limits for arc currents Arcing Time Consider the tolerances associate Incident Energy IE, HRC Category and PPE HRC accepted; Print Label Finish 40
52 4.7 Summary This Chapter considers the issue of parameter changeability and its effects on arc flash hazard mitigation. First, the technical studies on the empirical formulae given in the IEEE 1584 Guide and their suitability to address accurate values of arc flash variables are highlighted. The impact of uncertainty in the gap length between electrodes on the arc flash hazard is mathematically derived. The same is repeated for the system voltage value. Next, a methodology is proposed to incorporate the variations of gap and voltage in arc flash calculation procedures. 41
53 5 Chapter Five - Simulation Results and Observations In Chapters 1-4, we detailed the arc flash circumstances, calculations and analysis. The work performed in this thesis focuses on the effect of the variation in arcing current and arcing time due to the variation in voltage and gap between electrodes. In this chapter we test our analysis through the approaches recommended by other researchers to reduce the danger of arc flash incident energy. We investigate these approaches and simulate them in ETAP and MATLAB software platforms in order to compare the results after we consider the effect of voltage and gap variations. Tinsley et. al recommend in their paper, Beyond the Calculations: Life after Arc Flash Analysis, that the arc flash incident energy can be reduced by changing the work procedure, modifying existing settings and increasing the working distances [40]. In addition, it is also recommend that the best way to mitigate personnel exposure to the arc flash hazard is to accomplish the work in a de-energized state [41]. Further, others recommend certain techniques must be implemented at the time of the initial design in order to mitigate the risk of arc flash [11]. We will now highlight these various approaches and we test and measure the impact of the voltage variation and gap variation on the final results of arc current and incident energy. 5.1 Increasing the working distance Based on equation 3.5, the incident energy is inversely proportional to the distance, meaning that as the distance increases, the incident energy decreases [42]. The increase in the distance can be achieved by performing the switching or racking operation away from the panels by using remote operating equipment [41] and [43]. Figure 5-1, Figure 5-2 and Figure 5-3 show the simulation output and the impact that the increased distance has on the energy level and the risk category. Table 5-1 and table 5-2 highlight the simulation results. It is clear that the increasing the working distance from 24 and 18 inches to 48 and 24 inches in Buses 54 and 61 respectively. This will results in the incident energy decreases from Cal/cm 2 to Cal/cm 2 in Bus 54 which affect the risk category decreases from 42
54 category Dangerous (4) to category 3. In Bus 61 the incident energy decreases from 1.25 Cal/cm 2 which represent risk category 1 to Cal/cm 2 which represent category 0 (no risk). Now if we consider voltage variation as ±10%, the voltage may decrease from 480V to 432V. This will reflect on the arcing current as per equation (4-4) The simulation gives an incident energy of Cal/cm 2 AFH category 03, instead of Cal/cm2. Even though the risk category is the same but the IE has increased. Now if we consider variation of the gap as ±8 mm, so the gap may increase from 32 mm to 40 mm. This will reflect on the arcing current as per equation (4-2) The simulation gives an incident energy of Cal/cm 2 AFH category 03, instead of Cal/cm 2. Even though the risk category is the same but the incident energy IE has increased. 43
55 Figure 5-1 Arc flash simulation at Bus 54 and Bus

56 Figure 5-2 Arc flash simulation at Bus 54 at working distance of 48 inches. Figure 5-3 Arc flash simulation at Bus 61 at working distance of 24 inches 45
57 Table 5-1 Simulation results for Bus 54 Working Distance 24 Working Distance 48 Notes Arcing Current (Iac) KA KA No Change Fault Clearing Time (FCT) 2 Sec 2 sec No Change Arc Flash Boundary (AFB) ft ft No Change PPE Level 4 3 Changed Incident Energy (IE) Cal/cm Cal/cm 2 Changed Table 5-2 Simulation results for Bus Working Distance 18 Working Distance 24 Notes Arcing Current (Iac) 10.7 KA KA No Change Fault Clearing Time (FCT) Sec sec No Change Arc Flash Boundary (AFB) 1.54 ft 1.54 ft No Change PPE Level 1 0 Changed Incident Energy (IE) 1.25 Cal/cm Cal/cm 2 Changed 5.2 Modifying the protective device settings E = 4.184C f E n ( t x 0.2 ) (610 D ) 3.5 Based on equation 3.5, the incident energy is proportional with the fault clearing time (t), and this time is obtained from the protective device time current characteristics (TTC). This means that by modifying the settings of the circuit breaker, we can decrease the time, resulting in a decrease in the incident energy (IE) and consequently, the hazard risk. Figure 5-4, Figure 5-5, Figure 5-6 and Figure 5-7 shows the simulation output and the impact of setting modification on the energy level and the risk category. 46
58 Figure 5-4 Simulation of the power system with the High Instantaneous setting of CB57 47

59 Figure 5-5 Arc flash factors affected from the High Instantaneous setting of CB57 48
60 Figure 5-6 Simulation of the power system with the Low Instantaneous setting of CB57 49

61 Figure Arc flash factors affected from the Low Instantaneous setting of CB57 The Instantaneous Setting of CB57 is high as demonstrated in figure 5-4 and Figure 5-5. If we modify the Instantaneous setting to low state, the incident energy is dramatically reduced as shown in figure 5-6 and Figure 5-7. Table 5-3 highlights the simulation results. It is clear that changing the setting from Hight Setting 2 (2665 A) to Low Setting (1500 A) will result in the incident energy decreasing from Cal/cm2 to 1.25 Cal/cm 2 and the risk category decreasing from category 4 (Dangerous) to category 0 (No Risk). 50
62 Table 5-3 Simulation results for Bus 61 CB57 Setting High (2665A) CB57 Setting Low (1500A) Notes Working Distance 18 inch 18 inch No change Arcing current 9.09 KA 10.7 KA ±No change Arc Flash Boundary AFB ft Changed Incident Energy IE Cal/cm Cal/cm2 Changed Fault Clearing Time FCT 120 cycle cycles Changed PPE Level Dangerous Level 0 No risk Changed 51
63 Figure 5-8 The response of CB57 at High Instantanious setting 52

64 Figure 5-9 The response of CB57 at High Instantanious setting This technique can only be applied on a temporary basis as long as the worker is working on the energized equipment. Once the worker leaves the area, the setting must be restored to the original setting. It must be noted that the protective device coordination will be affected as we decrease the clearing time [40]. However, we can continue to operate the system regardless of the selective coordination, and decreasing the clearing time will reduce the arcing current, consequently reducing the incident energy. Therefore, we will avoid any damage to electrical equipment and working personnel. Even though the code suggests that the selective coordination only for critical operating power systems (COPS), most of the industrial organizations prefer to use the selective coordination. The drawback from this technique is that any fault that occurs will interrupt all the 53
65 nearby feeders. The manufacturers do not like to disturb the production process and increase the down time, as it is very costly. Now if we consider variation of the voltage as ±10%, so the voltage may decrease from 208 V to 188 V. This will reflect on the arcing current as per equation (4-4) The simulation gives an incident energy of 7.35 Cal/cm2 AFH category 2, instead of 1.25 Cal/cm2 Hazard risk category 1. Now if we consider variation of the gap as +10mm, so the gap may increase from 25 mm to 35 mm. This will reflect on the arcing current as per equation (4-2) This results in an incident energy of 3.28 Cal/cm2 AFH category 1, instead of 1.25 Cal/cm2 Hazard risk category Utilize a single main CB for building shut down There are different power systems which are already installed in buildings. Some of these power systems have a main panel without a main circuit breaker, and the power is supplied to the building through several feeders, which are protected by circuit breakers. The number of feeders cannot exceed six as per the code regulation. The simulation of a power system that does not have a main circuit breaker results in Figure 5-10 and Figure These figures show a main distribution panel (MDP) that has no main breaker and is connected to five feeders, which supply all the loads in the building. The five feeders are protected by five CB, which represent the disconnecting means of the building. The protective device of the main panel is the fuse located at the primary side of the service transformer. 54
66 Figure 5-10 Power system without single main CB before the MDP 55
. This is a very long time, resulting in an increase in the incident energy to an extremely dangerous level. 56")
67 Figure Arc flash factors affected from the delay response of the Fuse at Bus 1 The TCC in Figure 5-12 shows the fuse interrupting the arcing current in 500 seconds (few minutes). This is a very long time, resulting in an increase in the incident energy to an extremely dangerous level. 56
68 Figure 5-12 The response of the fuse to the arcing current A single main CB that is located outside the main distribution board (MDB) can serve as a disconnect mean for the building. The CB should be an LSI type. Therefore, we can adjust the setting in the long time, short time, and instantaneous time domains to achieve the desired incident energy and consequently, reduce the danger level. Figure 5-13 shows the simulation of the same system with main circuit breaker installed before/outside the MDP. The results are summarized in Figure
69 Figure 5-13 The previous Power system with single main CB before the MDP 58

70 Figure Arc flash factors affected by the fast response of the CB ahead MDP Figure 5-4 shows the TCC of the system after we utilize the main breaker. The arcing current is now interrupted in 0.18 seconds. This is a very short time, which will impact the value of the incident energy and reduce the danger level. 59

71 Figure 5-15 The response of the CB to the arcing current Table 5-4 highlights the simulation results. 60
72 Table 5-4 Simulation results for Bus 3 With CB Without CB Notes Available Fault Current KA KA No change Working Distance 24 inch 24 inch No change Arcing current 5.94 KA 5.05 KA ±No change Arc Flash Boundary AFB 2.98 ft 599 ft Changed Incident Energy IE 2.16 Cal/cm Cal/cm2 Changed Fault Clearing Time FCT 0.18 sec 530 sec Changed PPE Level 1 4 Dangerous Changed Note that the AFC and the arcing current at the MDP remain the same and the incident energy is reduced from 5340 to 2.16 Cal/cm2. Overall, this results in going from category 4 extremely dangerous to category 1. Now if we consider variation of the voltage as ±10%, so the voltage may decrease from 208V to 188V. This will reflect on the arcing current as per equation (4-4) The simulation gives an incident energy of 7.3 Cal/cm2 AFH category 2, instead of 2.15 Cal/cm2. Now if we consider variation of the gap as +8mm, so the gap may increase from 32mm to 40 mm. This will reflect on the arcing current as per equation (4-2) This results in an incident energy of 7.29 Cal/cm2 AFH category 2, instead of 2.15 Cal/cm2 Hazard risk category Install LVPCB instead of the fused disconnect mean before the MDP The other type of power system installation that exists in buildings is one which has the main panel with a main fused disconnecting switch at the service entrance. This is acceptable based on the installation standards and electric codes. However, the disconnecting mean must be accessible, 61
73 [NEC 230]. Figure 5-16 shows a single line diagram (SLD) of a main distribution panel (MDP) protected and preceded by main fused disconnect switch. Figure 5-16 Power system with fused disconnect switch before the MDP The incident energy is Cal/cm2, which is very high and represents a dangerous arc flash hazard category. NFPA regulation does not allow the work to be performed under these conditions. Figure 5-17 and Figure 5-18 show the TCC graph and the arc flash factors which helps analyze this situation in the time versus current domain. It is clear that the fuse curve interrupts the arcing current at more than 2 seconds, resulting in a dangerous arch flash hazard category. 62

74 Figure The response of the fuse to the arcing current 63
75 Figure Arc flash factors affected by the response of the fuse ahead MDP Figure 5-19 shows the same power system under one different condition. This time, we applied a low voltage power circuit breaker LVPCB in the place of the fused disconnect switch. 64
76 Figure 5-19 Power system with LVCB instead of fused disconnect switch before the MDP Under this scenario, the incident energy decreases to 2.17 cal/cm 2, representing low hazard risk category (category 0). Figure 5-20 and figure 5-21 show the TCC curve of the CB curve, and the arc flash factors demonstrating that the instantaneous setting interrupts the arcing current in a very short time (0.05 seconds) resulting in a hazard category 1. 65

77 Figure The response of the LVPCB to the arcing current 66

78 Figure Arc flash factors affected by the response of the LVPCB ahead MDP The results of the simulation for this system are displayed in Table 5-5 Table 5-5 Simulation results for Bus 2 CB Fused disconnecting SW Notes Available Fault Current KA KA No change Working Distance 24 inch 24 inch No change Arc Flash Boundary AFB 3 ft 35.3 ft Changed Incident Energy IE 2.16 Cal/cm Cal/cm2 Changed Fault Clearing Time FCT 0.05 sec 2.3 sec sec Changed PPE Level 1 >4 Dangerous Changed Now if we consider variation of the voltage as ±10%, so the voltage may decrease from 480V to 432V. This will reflect on the arcing current as per equation (4-4). The simulation gives an incident energy of 9.17 Cal/cm2 AFH category 3. Now if we consider variation of the gap as +8mm, so the gap may increase from 32mm to 40 mm. This will reflect on the arcing current as per equation (4-2) 67
79 This results in an incident energy of 9.16 Cal/cm2 AFH category 3, instead of 2.17 Cal/cm2 Hazard risk category Install (LVPCB) in front of the step down transformers rated above 125KVA Equipment/loads such as receptacles, lighting, services, heating, ventilating and air conditioning require 120/208V in their operation. Due to this, we require transformers that are large enough to handle these loads. The arc flash hazard at low voltage transformers is critical since these transformers, along with the panels that are fed from them, are subjected to regular maintenance checkups. These transformers are generally fed from the main distribution panel (MDP) and they are protected by thermal magnetic circuit breakers in most of the power systems. Figure 5-22 shows a typical power system with step down transformer T2, which protected with a thermal magnetic circuit breaker CB1. Due to the impedance of the transformer, we expect a lower fault current and arcing current at the secondary side of the transformer. 68
80 Figure 5-22 Power system with thermal magnetic CB before transformer The arc flash simulation reveals the following results: The AFC at both the primary and secondary sides of the transformer are KA and 9.06 KA respectively. And from equation 3.1, the arcing current and the fault current are proportional with each other. Therefore, the arcing current at the secondary side of the transformer will be lower in value compared to the arcing current at the primary side. This will result in more time required for the circuit breaker to interrupt the arcing fault that occurs in the secondary side of the transformer. This will result in higher incident energy and a more dangerous hazard category. This has been supported by the results from the arc flash simulation. See Figure 5-23 and Figure 5-24 for the results on Bus 4 and Bus 5 of the primary and secondary sides of the transformer respectively. 69
")
81 Figure 5-23 Arc flash factors at Bus 4 (Primary of Transformer T2) Figure 5-24 Arc flash factors at Bus 5 (Secondary of Transformer T2) 70

82 The incident energy at the primary side is Cal/cm2 while at the secondary side, it is 459 Cal/cm2. Figure 5-25 highlights the time versus current domain results. The circuit breaker interrupts the arc current at the primary side of the transformer in seconds, which is a relatively short time. Consequently, this results in lower incident energy, representing AFH category 0. Figure 5-25 shows also the delay in the interruption of the arcing current at the secondary side, resulting in a higher incident energy and AFH category 4. Figure 5-25 The response of the thermal CB1 to the arcing currents. Now, let s apply a low voltage circuit breaker with adjustable LSI instead of the thermal circuit breaker. Figure 5-26 shows the simulation of the same power system with LSI CB. The results show that the AFC on both sides of the transformer, primary and secondary, are still the same, 71
83 meaning that the arcing currents on both sides of the transformer have not been changed. However, the incident energy is reduced dramatically from 459 Cal/cm2 to 1.37 Cal/cm2 on the secondary side. This result reflects AFH category 1 on the secondary side of the transformer instead of 4, as was observed previously see figure Figure 5-26 Power system with LSI CB before the transformer 72

84 Figure 5-27 Arc flash factors at Bus 5 (Secondary of Transformer T2) using LSI CB In Figure 5-28, the TCC shows the LSI circuit breaker and arcing current at the primary and secondary sides of the transformer. The lowering of the arcing current at the secondary side of the transformer brings it to the adjustable short time range of the LSI breaker. This results in a reduction of the arcing time, which will reduce the incident energy and the AFH risk category. 73

85 Figure 5-28 The response of the LSI CB to the arcing currents at primery and secondary of T2 Table 5-6 highlights the above results: Table 5-6 Simulation results for Bus 4 and Bus 5. Bus 4 Bus 5 Mag Thermal CB LSI CB Arcing current 8.77 KA 8.77 KA Incident Energy Cal/cm Cal/cm2 Fault Clearing T sec 0.05sec PPE Level 0 0 Arcing current 3.32 KA 3.9 Incident Energy 459 Cal/cm Fault Clearing 72 sec 0.18 PPE Level >4 1 74
86 Now if we consider variation of the voltage as ±10%, so the voltage may decrease from 208V to 188V. This will reflect on the arcing current as per equation (4-4) The simulation gives an incident energy of 18.7 Cal/cm2 AFH category 3. Now if we consider variation of the gap as +8mm, so the gap may increase from 32mm to 40 mm. This will reflect on the arcing current as per equation (4-2) This results in an incident energy of 18.7 Cal/cm2 AFH category Transformers large than 125 KVA should be replaced with smaller size transformers Since the 120/208V loads represent a substantial amount of electric power, we require large transformers to feed these loads. Typical power systems are shown in Figure Figure 5-29 Power system with large Transformer T2 feeding 120/208 loads. 75
.")
87 The simulation of this power system is summarized in figure Figure 5-30 Arc flash factors at Bus 6 The incident energy at bus 6 is 804 Cal/cm2 which represents AFH category 4 (Dangerous). The TCC in Figure 5-31 shows the CB takes longer time to interrupt the arcing current, resulting in higher incident energy. 76

88 Figure 5-31 The response of CB3 to the arcing currents at Bus 6. We simulate a scenario that utilizes three small transformers that are 75KVA each, instead of one large transformer that is 0.2MVA (200KVA). The results are shown in Figure 5-32 below. 77
89 Figure 5-32 Power system with small size Transformers (T6, T13, and T12) instead of T2 in 5-29 The simulation of this power system is summarized in Figure

90 . Figure 5-33 Arc flash factors at Bus 9, Bus 15 and Bus 13. It is clear that the arcing current is reduced because of the increased impedance of the small size of transformers and cables. Therefore, applying small circuit breakers will be sufficient to interrupt the arcing current at small values. Figure 5-34 shows the TCC for such circuit breakers and the time required for interrupting the arc current. It is clear that the interrupting time is less than 0.05 sec, which results in incident energy less than 2 Cal/cm2 and AFH category 0. 79

91 Figure 5-34 The response of CB s 6, 12 and 14 to the arcing currents at Bus s 9, 15 and 13. Table 5-7 summarize the simulation results in both case when we use large transformer and when we use small one. Table 5-7 Simulation results for Bus 6 and Bus 9 Using 75KVA TR Using 200KVA TR Working Distance 24 inch 24 inch Incident Energy IE Cal/cm Cal/cm2 Fault Clearing Time FCT 0.043sec >2 sec sec PPE Level 0 >4 Dangerous 80
92 Now if we consider variation of the voltage as ±10%, so the voltage may decrease from 208V to 188V. This will reflect on the arcing current as per equation (4-4) The simulation gives the same result of the incident energy of Cal/cm2 AFH category 1. Now if we consider variation of the gap as +8mm, so the gap may increase from 32mm to 40 mm. This will reflect on the arcing current as per equation (4-2) This results in an incident energy of 0.2 Cal/cm2 AFH category Summary In this Chapter, the simulation, results, and observation of the thesis work are reported. Six benchmark cases are selected from literature in order to show the impact of parameter uncertainty on arc flash hazard mitigation. The six cases symbolize different techniques to reduce the hazard of arc flashes without considering parameter variations. Simulations, which clarify the effects of parameter variations on such previously proposed techniques, are carried out. Different system layouts are selected from standard topologies to experiment the simulations. Results show that parameter uncertainty may affect incident energy values as well as the risk category of a given arc flash case. Consequently, care must be taken when arc flash calculations are performed as to the possible changes in results caused by parameter variability, in particular gap length and system voltage, as shown by the results of this Chapter. 81
93 6 Chapter Six - Conclusions and Future Work 6.1 Thesis Summary In this work, a thorough study of arc flash and short circuit was initially performed. Different components of power system protection were investigated, and different design implementations of such components and methods were researched with an examination of their benefits. Moreover, different factors and phenomena affecting the arc flash energy estimation, such voltage, gap between electrodes, clearing time, etc. were investigated. Additionally, in Chapter 4 a new method of arc flash calculation was proposed which takes into consideration the variation in some parameters such as voltage. This is useful for evaluating more adequate arcing current and the arc flash incident energy. Furthermore, in Chapter 5 different power system topology situations and know techniques were built using Electric Transient and Analysis Program (ETAP), the simulation is carried out with and without the proposed variations. The results of which showed the more accurate calculation of such considerations. 6.2 Summary of Contributions Proposed voltage variation to be used and to be taken into consideration when we calculate the arc current and the incident energy associated. Variation in voltage and gap between electrodes may lead to higher incident energy bigger than the estimated one. The bigger value of incident energy should be used to get the maximum risk safety. Variation in voltage and gap between electrodes should be taken into consideration in the evaluation process of arc flash mitigation. 82
94 6.3 Future Work Although the consideration of the variation in voltage and gaps between electrodes showed the difference in incident energy calculation, there are other factors that need to be addressed and considered such as humidity degree, ambient temperature and pressure. Therefore, improved models will produce better results of estimated incident energy which provide better protection to personal dealing with power distribution systems. 83
95 7 References [1] R. B. Campbell and D. A. Dini, "Occupational injuries from electrical shock and arc flash events," Technical Report, The Fire Protection Research Foundation, Quincy, MA, USA, [2] M. Cooper and T. Price, "Electrical and lightning injuries," Emergency Medicine Clinic of North America, vol. 12, no. 2, 2002, pp [3] J. Noble, M. Gomez and J. Fish, "Quality of life and return to work following electrical burns," Burns, vol. 32, no. 2, 2006, pp [4] C. T. Latzo, "Approach to arc flash hazard mitigation in 600 volt power systems," PhD Dissertation, University of south Florida, Los Angles, [5] H. L. Floyd, D. R. Doan, C. T. Wu, and S. L. Lovasic, Arc flash hazards and electrical safety program implementation, Proc. Industry Applications Conference, vol. 3, 2005, pp [6] K. Heid, T. E. Neal, D. Roberts, and S. Wilson, "Why are NFPA 70E and CSA Z462 different?," Proc. IEEE-IAS Electrical Safety Workshop, 2012, pp [7] Teamsters Canada Rail Conference, What is Bill C45? available online at [8] G. D. Gregory, I. Lyttle, and C. M. Wellman, Arc flash calculations in systems protected by low-voltage circuit breakers, IEEE Trans. Industry Applications, vol. 39, no. 4, 2003, pp [9] A. Koumbourlis, "Electric Injuries," Critical Care Medicine, vol. 30, no. 11, 2002, pp [10] R. C. Lee, "Biophysical injury mechanism in electrical shock victims, Annual Review Of Biomedical Engineering," Proc. Annual International Conference of the IEEE Engineering Medicine and Biology Society, 1990, pp [11] R. H. Lee, "The other electrical hazard: Electric arc blast burns," IEEE Trans. Industry Applications, vol. 18, no. 3, 1982, pp [12] R. H. Lee, "Presures developed by arcs," IEEE Trans. Industry Applications, vol. 23, no. 4, 1987, pp
96 [13] R. L. Doughty, E. N. Thomas, and H. L. Floyd, "Predicting incident energy to better manage the electric arc hazard on 600 V power distribution systems," Proc. IEEE Industry Application Society Annual Petroleum and Chemical Industry Conference, 1998, pp [14] R. Jones, D. Liggett, M. Capelli-Schellpfeffer, T. Macalady, L. Saunders, R. Downey, L. Mc-Clung, A. Smith, S. Jamil, and V. Saporita, "Staged tests to increase awareness of arcflash hazards in electrical equipment," IEEE Trans. Industry Applications, vol. 36, no. 2, 2000, pp [15] T. Gammon and,. J. Matthews, "IEEE , incident energy factors and simple 480V incident energy equations," IEEE Industry Application Magazine, vol. 11, no. 1, 2005, pp [16] National Electric Code, National Fire Protection Association (NFPA), [17] J. J. Burke, Power Distribution Engineering: Fundamentals and Applications, CRC Press, [18] C. D. Richard, The Electrical Engineering HandBook, CRC Press, [19] IEEE Recommended Practice for Electrical Power Distribution for Industrial Plants, IEEE Std. 141 (Red Book), [20] IEEE Guide for arc flash hazard calculation, IEEE Std. 1584, [21] H. S. David, Electrical Systems in Buildings, New York: Dalmar Publishers Inc, [22] G. J. Duncan, M. S. Sarma and T. J. Overbye, Power System Analysis and Design, Cengage Learning, [23] C. Christopoulos and A. wright, Electrical Power System Protection, Springer, [24] IEEE Recommended practice for applying low voltage circuit breakers used in industrial and commercial power systems (IEEE Blue Book), IEEE Std. 1015, [25] D. D. Roybal, "Circuit breaker interrupting capacity and short time current rating," Proc. Pulp and Paper Industry Technical Conference, 2004, pp [26] IEEE standard for low voltage AC power circuit breakers used in enclosures, IEEE Std. C37,
97 [27] C. W. Kimblin and R. W. Long, "Low voltage power circuit breakers and molded case circuit breakers - a comparision of test requirements," Proc. IEEE Industrial and Commercial Power Systems Technical Conference, 1999, pp [28] C. H. Flurscheim, Power Circuit Breaker Theory and Design, IEE Power Engineering Series 1, [29] IEEE Recommended Practice for Grounding of Industrial and Commercial Power Systems (Green Book), IEEE Std. 142, [30] P. G. Newberry, "Fuse technology progress to date," Electronic and Power Magazine, Vol. 22, No. 2, 1976, pp [31] K. Lane, "Beware of simplistic fault current calculations," Electrical Construction and Maintenance, Available online at: [32] IEEE Recommended Practice for Protection and Coordination of Industrial and Commercial Power Systems (Buff Book), IEEE Std. 242, [33] G. Parise, L. Martirano, U. Grasselli, and L. Benetti, The arc-fault circuit protection, Proc. IEEE Industry Applications Conference, Vol. 3, 2001, pp [34] E. Ralph, Industrial Power Distribution, 1 st Edition, New Jersey: Printice hall, [35] N. Tleis, Power System Modelling and Fault Analysis: Theory and Practice, Newnes, [36] UL Standard for Low-Voltage AC and DC Power Circuit Breakers Used in Enclosures, UL 1066, [37] IEEE Standard for Trip Systems for Low-Voltage AC and General Purpose DC Power Circuit Breakers, IEEE Std. C , [38] D. D. Roybal, Standards and ratings for the application of molded case, insulated case, and power circuit breakers, Proc. IEEE Pulp and Paper Industry Technical Conference, June, 2000, pp
98 [39] C. S. Pierre, D. Castor, C. Davis, R. Luo, and S. Shrestha, Practical solution guide to arc flash hazards, EasyPower, Available online at: [40] T. H. Wallace, A. M. Graham, and H. Michael, Beyond the calculations: Life after arc flash analysis, Proc. IEEE Pulp and Paper Industry Technical Conference, June 2007, pp [41] I. Catherine, U. Kerssebaum, H. Eichinger, and D. Daniel, " Mitigating personnel exposure to the arc flash hazard," Proc. Conference of the European Petroleum and Chemical Industry Committee (PCIC Europe), May 2009, pp [42] C. Inshaw and R. A. Wilson, "Arc flash hazard analysis and mitigation," Proc. IEEE Annual Conference for Protective Relay Engineers, 5-7 April 2005, pp [43] D. R. Doan, J. Slivka, and C. Bohrer, "A summary of arc flash hazard assessments and safety improvements," Proc. IEEE Petrolum and Chemical Industry Technical Conference, 2007, pp

99 APPENDIX A: IEEE Data 88
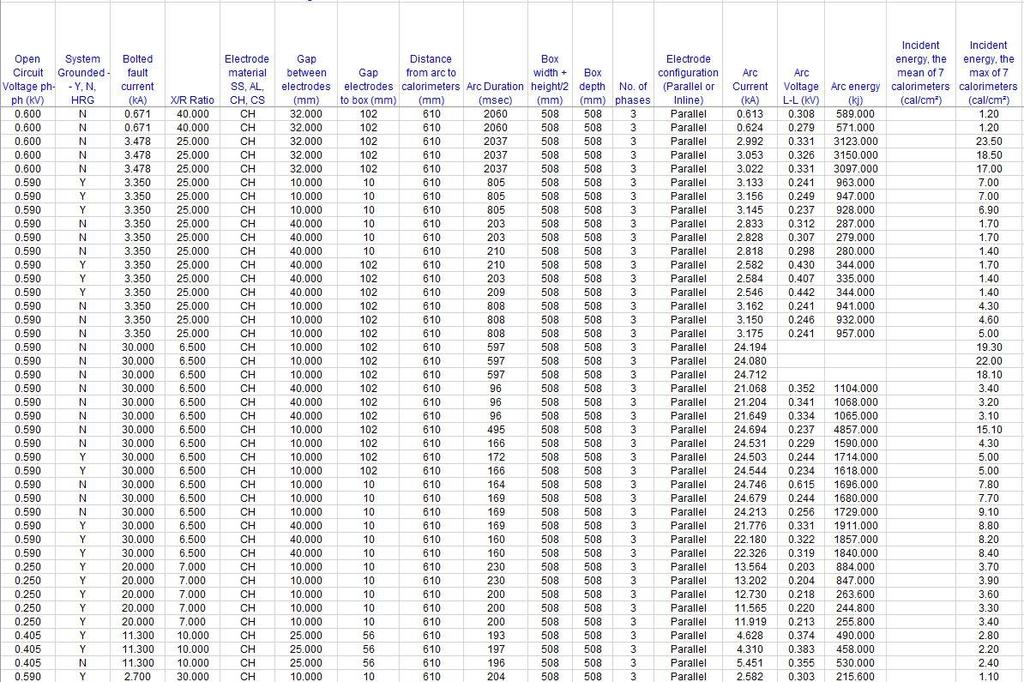
100 89
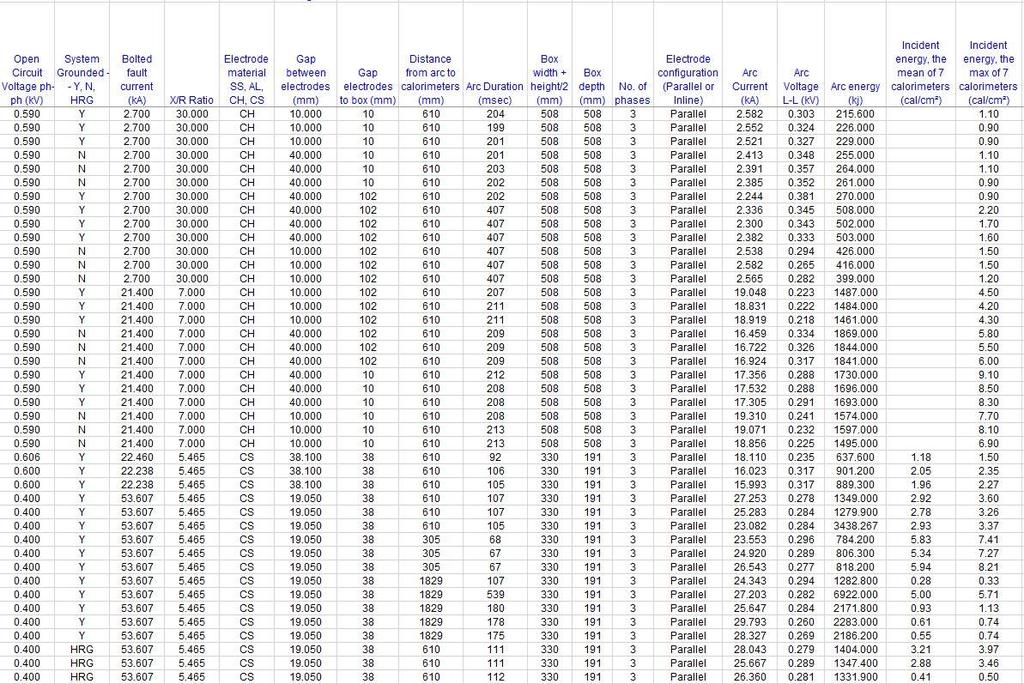
101 90
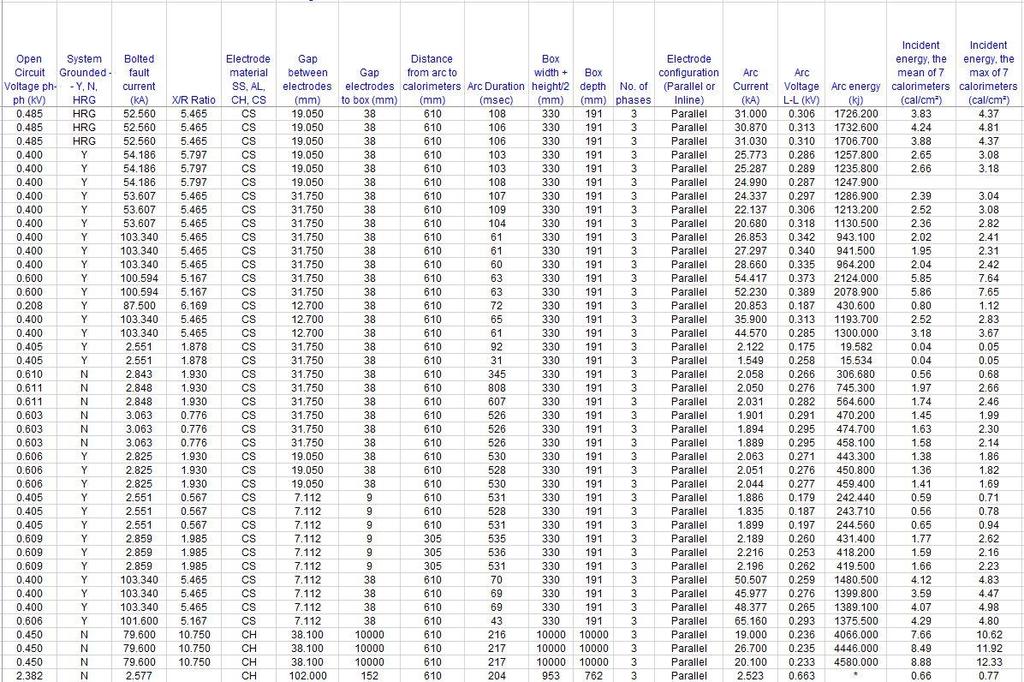
102 91
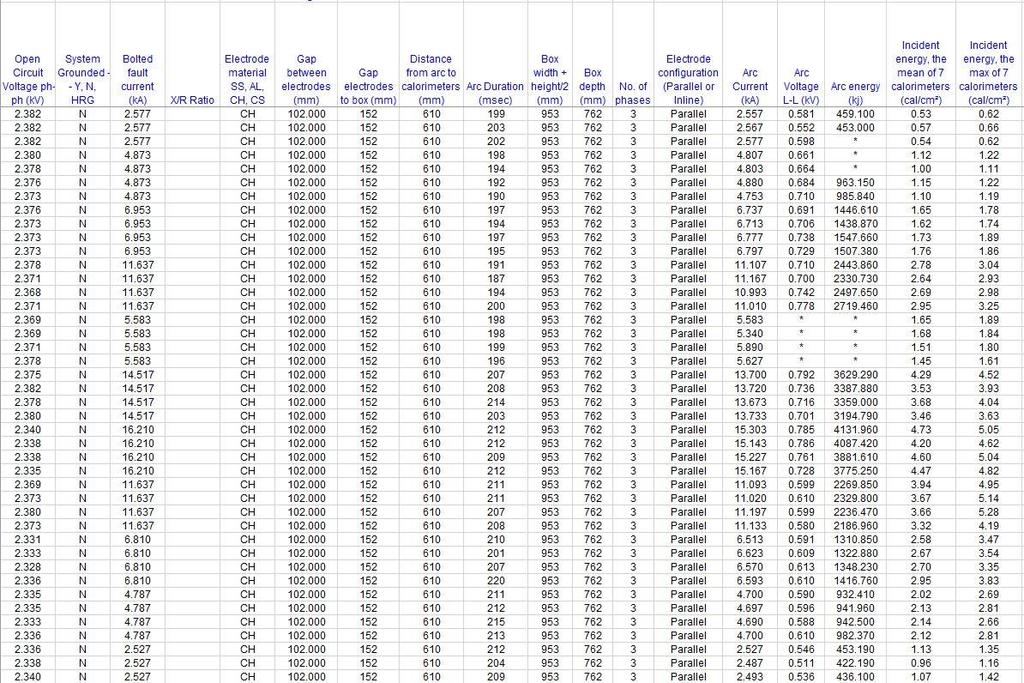
103 92
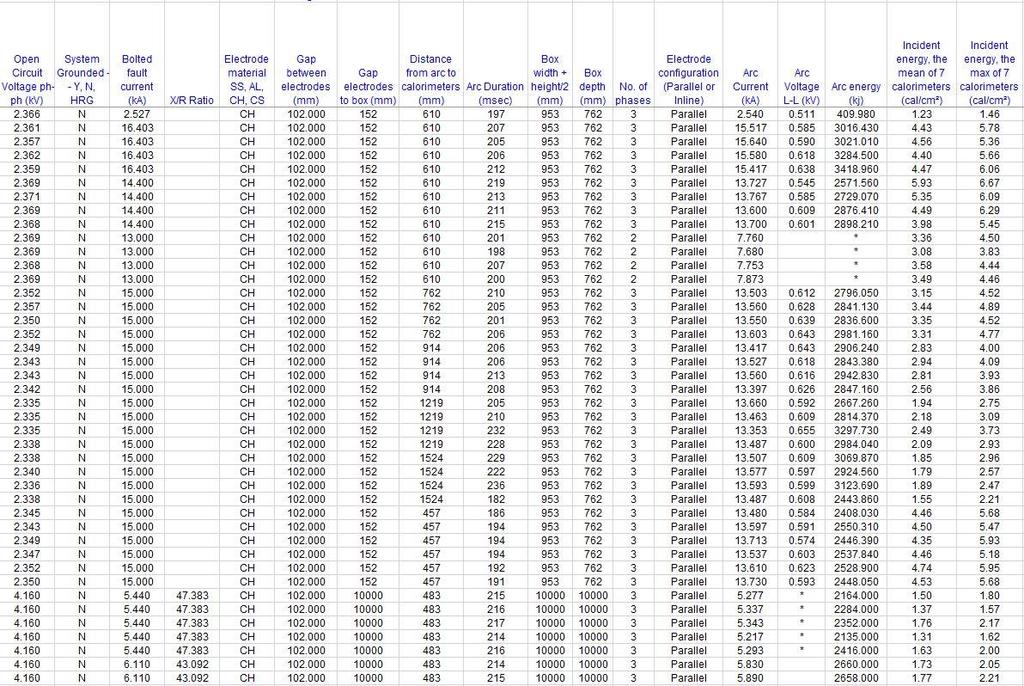
104 93
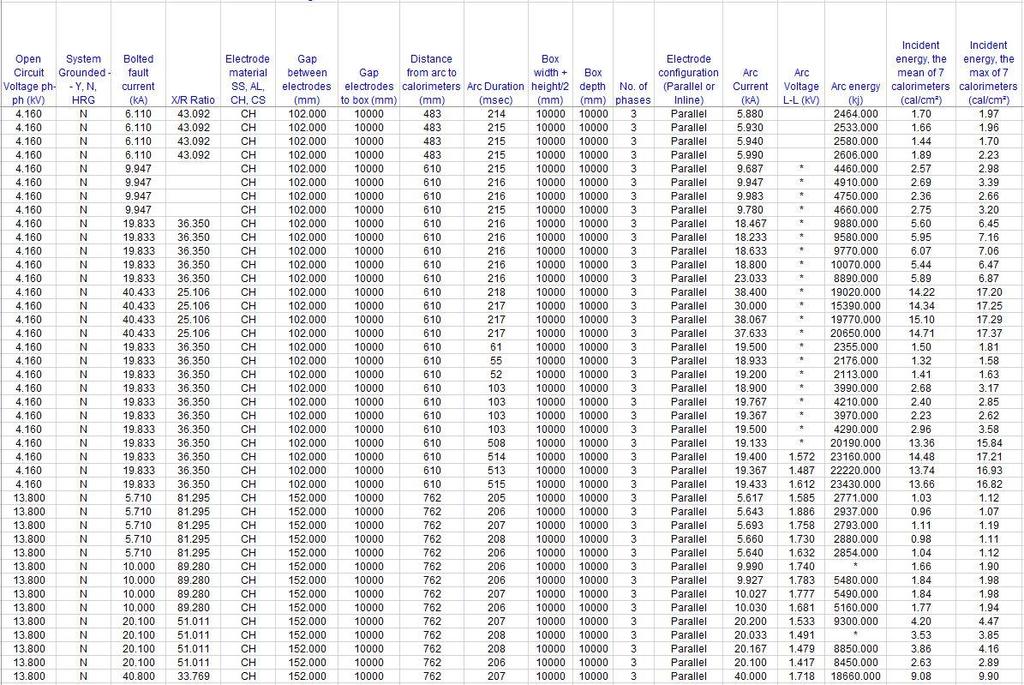
105 94
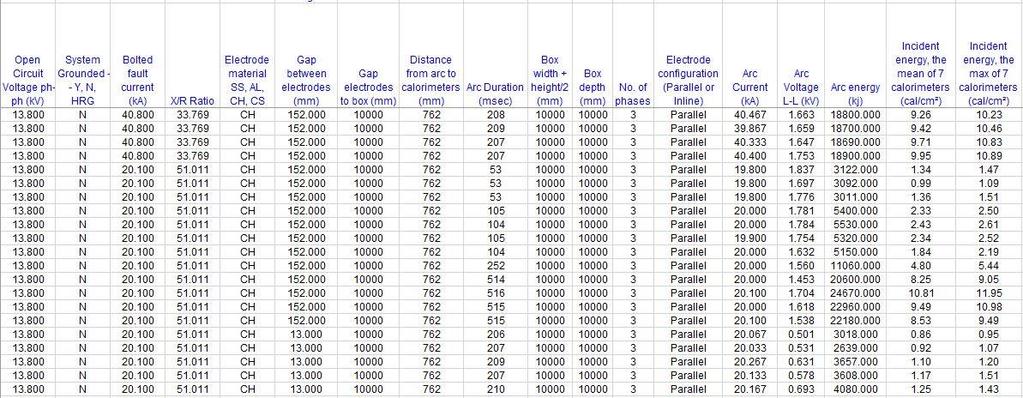
106 95
{40C54206-A3BA D8-8D8CF }
 Informative Annex D Incident Energy and Arc Flash Boundary Calculation Methods This informative annex is not a part of the requirements of this NFPA document but is included for informational purposes
Electrical Arc Hazards
 Arc Flash Analysis 1996-2009 ETAP Workshop Operation Notes Technology, 1996-2009 Inc. Operation Workshop Technology, Notes: Arc Inc. Flash Analysis Slide 1 Electrical Arc Hazards Electrical Arcs can occur
First Draft Language
 110.16 First Draft Language (B) Service Equipment. In addition to the requirements in (A), service equipment shall contain the following information: (1) Nominal system voltage (2) Arc flash boundary (3)
Arc Flash Calculation Methods
 Arc Flash Calculation Methods Course No: E04-033 Credit: 4 PDH Velimir Lackovic, Char. Eng. Continuing Education and Development, Inc. 9 Greyridge Farm Court Stony Point, NY 10980 P: (877) 322-5800 F:
Arc Flash Mitigation An Overview. Gus Nasrallah, P.E. Electroswitch May 30, 2013
 Arc Flash Mitigation An Overview Gus Nasrallah, P.E. Electroswitch May 30, 2013 Agenda Origin of Modern Arc Flash studies Why Now more than before NFPA 70E Standards Protection Zone IEEE 1584 2002 IEEE
Arc Flash Analysis and Documentation SOP
 Arc Flash Analysis and Documentation SOP I. Purpose.... 2 II. Roles & Responsibilities.... 2 A. Facilities Maintenance (FM).... 2 B. Zone Supervisors/ Shop Foremen... 2 C. PMCS & CPC... 2 III. Procedures...
ARC FLASH HAZARD ANALYSIS AND MITIGATION
 ARC FLASH HAZARD ANALYSIS AND MITIGATION J.C. Das IEEE PRESS SERIES 0N POWER ENGINEERING Mohamed E. El-Hawary, Series Editor IEEE IEEE PRESS WILEY A JOHN WILEY & SONS, INC., PUBLICATION CONTENTS Foreword
ARC FLASH PPE GUIDELINES FOR INDUSTRIAL POWER SYSTEMS
 The Electrical Power Engineers Qual-Tech Engineers, Inc. 201 Johnson Road Building #1 Suite 203 Houston, PA 15342-1300 Phone 724-873-9275 Fax 724-873-8910 www.qualtecheng.com ARC FLASH PPE GUIDELINES FOR
Cause, Effect & Mitigation Strategies
 WSU HANDS ON RELAY SCHOOL 2019 Arc Flash Fault Cause, Effect & Mitigation Strategies Joe Xavier, Technical Manager West Region Arc Flash Fault - Agenda What is an Arc Flash? Why and when does Arc Flash
Arc Hazard Assessment for DC Applications in the Transit Industry
 Arc Hazard Assessment for DC Applications in the Transit Industry Kenneth S.Y. Cheng Kinectrics Inc. Toronto, Canada Stephen L. Cress Kinectrics Inc. Toronto, Canada Donald J. Minini Excalibur Associates,
AN EXAMPLE OF A STANDARD ARC FLASH PPE LABELING STRATEGY
 The Electrical Power Engineers Qual-Tech Engineers, Inc. 201 Johnson Road Building #1 Suite 203 Houston, PA 15342-1300 Phone 724-873-9275 Fax 724-873-8910 www.qualtecheng.com AN EXAMPLE OF A STANDARD ARC
THREE PHASE PAD MOUNTED DISTRIBUTION TRANSFORMER ARC FLASH TESTING JUNE 23, 2009 FERRAZ SHAWMUT HIGH POWER LABORATORY NEWBURYPORT, MA
 THREE PHASE PAD MOUNTED DISTRIBUTION TRANSFORMER ARC FLASH TESTING JUNE 23, 2009 FERRAZ SHAWMUT HIGH POWER LABORATORY NEWBURYPORT, MA Witnessed by: Jim Phillips, PE, Consultant Craig DeRouen, ERMCO Director
Webinar: An Effective Arc Flash Safety Program
 Webinar: An Effective Arc Flash Safety Program Daleep Mohla September 10 th, 2015: 2pm ET Agenda Arc Flash Defined and Quantified NFPA 70E / CSA Z 462 - Recent Updates What is the ANSI Z10 Hierarchy of
Arc Flash Hazard and Mitigation 2 nd Workshop on Power Converters for Particle Accelerators June 14 16, 2010
 Arc Flash Hazard and Mitigation 2 nd Workshop on Power Converters for Particle Accelerators June 14 16, 2010 Paul Bellomo June 14-16, 2010 2nd Workshop on Power Converters for Particle Accelerators - Arc
3Ø Short-Circuit Calculations
 3Ø Short-Circuit Calculations Why Short-Circuit Calculations Several sections of the National Electrical Code relate to proper overcurrent protection. Safe and reliable application of overcurrent protective
Ft Worth IEEE-PES. Presented by: Doug Harris Specifications Engineer Dallas, TX. Arc-Flash Hazard Mitigation & Selectivity
 Ft Worth IEEE-PES Presented by: Doug Harris Specifications Engineer Dallas, TX Arc-Flash Hazard Mitigation & Selectivity Electrical hazards Energized circuit/conductor Today s power system engineer must
Short Circuit Current Calculations
 Introduction Several sections of the National Electrical Code relate to proper overcurrent protection. Safe and reliable application of overcurrent protective devices based on these sections mandate that
CREATING A COMPARATIVE MAP OF RELATIVE POWER FOR DC ARC FLASH METHODOLOGIES. A Thesis. presented to
 CREATING A COMPARATIVE MAP OF RELATIVE POWER FOR DC ARC FLASH METHODOLOGIES A Thesis presented to the Faculty of California Polytechnic State University, San Luis Obispo In Partial Fulfillment of the Requirements
A Guide to Establish an Arc Flash Safety Program for Electric Utilities
 A Guide to Establish an Arc Flash Safety Program for Electric Utilities by Craig Clarke, P.E. Eaton Corporation 50 Soccer Park Rd. Fenton, MO 63026 (636) 717-3406 CraigClarke@Eaton.com Ilanchezhian Balasubramanian,
NFPA-70E. Electrical Safety in the Workplace. Standard for Edition
 NFPA-70E Standard for Electrical Safety in the Workplace 2015 Edition NFPA-70E 90.1 Purpose. The purpose of this standard is to provide a practical safe working area for employees relative to the hazards
Selective Coordination for Emergency and Legally-Required Standby Power Distribution Systems
 Selective Coordination for Emergency and Legally-Required Standby Power Distribution Systems Presented for the IEEE Central TN Section / Music City Power Quality Group August 1, 2006 By Ed Larsen and Bill
A DUMMIES GUIDE TO GROUND FAULT PROTECTION
 A DUMMIES GUIDE TO GROUND FAULT PROTECTION A DUMMIES GUIDE TO GROUND FAULT PROTECTION What is Grounding? The term grounding is commonly used in the electrical industry to mean both equipment grounding
Arc Flash Analysis Training
 Arc Flash Analysis Training Contact us Today for a FREE quotation to deliver this course at your company?s location. https://www.electricityforum.com/onsite-training-rfq An arc flash analysis study is
2018 Consultant s Handbook Division 26 Electrical ARC Flash Hazard Analysis
 1 Summary 1.1 Provide a complete Arc Flash Hazard Analysis for the project indicated in the accompanying RFP. The Analysis may be performed: independent of the construction project in concert with the
DC ARC FLASH. THE IMPLICATIONS OF NFPA 70E 2012 ON BATTERY MAINTENANCE
 DC ARC FLASH. THE IMPLICATIONS OF NFPA 70E 2012 ON BATTERY MAINTENANCE William Cantor, P.E. TPI Exton, PA 19341 Phil Zakielarz TPI Exton, PA 19341 Mario Spina Verizon Wireless Uniontown, OH 44685 Abstract
ADDENDUM NO. 2 PROJECT: COURTLAND PUMP STATION CONTRACT: IFB NO COM.00030
 ADDENDUM NO. 2 PROJECT: COURTLAND PUMP STATION CONTRACT: IFB NO. 2018-008-COM.00030 To: Prospective Bidders of Record Date: December 17, 2018 The following changes, additions, revisions, and/or deletions
SECTION SHORT CIRCUIT, COMPONENT PROTECTION, FLASH HAZARD AND SELECTIVE COORDINATION STUDY
 SECTION 16075 - SHORT CIRCUIT, COMPONENT PROTECTION, FLASH HAZARD AND SELECTIVE COORDINATION STUDY PART 1 GENERAL 1.1 SUMMARY A. Section Includes: 1. Provide a short-circuit, component protection, flash
COMMON SOURCES OF ARC FLASH HAZARD IN INDUSTRIAL POWER SYSTEMS
 COMMON SOURCES OF ARC FLASH HAZARD IN INDUSTRIAL POWER SYSTEMS Joost Vrielink Hans Picard Wilbert Witteman Eaton Eaton SABIC-IP Europalaan 202 7559 SC Hengelo Europalaan 202 7559 SC Hengelo Plasticslaan
STANDARDIZING ARC FLASH PPE LABELS
 The Electrical Power Engineers Qual-Tech Engineers, Inc. 01 Johnson Road Building #1 Suite 03 Houston, PA 1534-1300 Phone 74-873-975 Fax 74-873-8910 www.qualtecheng.com STANDARDIZING ARC FLASH PPE LABELS
AN EXAMPLE OF A STANDARD ARC FLASH PPE LABELING STRATEGY
 The Electrical Power Engineers Qual-Tech Engineers, Inc. 201 Johnson Road Building #1 Suite 203 Houston, PA 15342-1300 Phone 724-873-9275 Fax 724-873-8910 www.qualtecheng.com AN EXAMPLE OF A STANDARD ARC
CHAPTER 2 ELECTRICAL POWER SYSTEM OVERCURRENTS
 CHAPTER 2 ELECTRICAL POWER SYSTEM OVERCURRENTS 2-1. General but less than locked-rotor amperes and flows only Electrical power systems must be designed to serve in the normal circuit path. a variety of
APPLYING LOW-VOLTAGE CIRCUIT BREAKERS TO LIMIT ARC FLASH ENERGY
 APPLYING LOW-VOLTAGE CIRCUIT BREAKERS TO LIMIT ARC FLASH ENERGY Copyright Material IEEE Paper No. PCIC-2006-2 George Gregory Kevin J. Lippert Fellow Member, IEEE Senior Member, IEEE Schneider Electric
Electrical Measurement Safety. Sponsored By:
 Electrical Measurement Safety Sponsored By: About the Viewer Panel Slides: Go to the Links tab at the top and click on the link to download the PDF of the slides If you re watching the archive version,
Lightning test in lab. Symmetrical fault and protection. Olof Samuelsson
 Lightning test in lab Symmetrical fault and protection Olof Samuelsson Outline Three-phase short-circuit fault current Network representation Circuit breakers and disconnectors Measurement transformers
2 Grounding of power supply system neutral
 2 Grounding of power supply system neutral 2.1 Introduction As we had seen in the previous chapter, grounding of supply system neutral fulfills two important functions. 1. It provides a reference for the
Arc Flash Hazard Standards:
 Arc Flash Hazard Standards: The Burning Question Presented by Sesha Prasad Specialist Power System Engineer Welcon Technologies At IDC Electrical Arc Flash Forum Melbourne April 14th & 15th 2010. Session
2015 NFPA 70E. SESHA 2015 ARIZONA MINI CONFERENCE December 10, 2015 Intel Corporation
 2015 NFPA 70E SESHA 2015 ARIZONA MINI CONFERENCE December 10, 2015 Intel Corporation Introduction Jeffrey A. Pugh, P.E. Pugh Engineering LLC Bachelor of Science Degrees in Electrical Engineering and Computer
SECTION OVERCURRENT PROTECTIVE DEVICE COORDINATION STUDY
 PART 1 - GENERAL 1.1 DESCRIPTION SECTION 26 05 73 OVERCURRENT PROTECTIVE DEVICE COORDINATION STUDY SPEC WRITER NOTE: Delete between // -- // if not applicable to project. Also, delete any other item or
Poly Canyon Cogeneration System
 Poly Canyon Cogeneration System By Jaideep Gill Senior Project Electrical Engineering Department California Polytechnic State University San Luis Obispo 2011 ii Table of Contents Section Acknowledgements
Design Approaches for Hospital Distribution Systems With Considerations for Future Expansion, Operator Safety, and Cost
 Design Approaches for Hospital Distribution Systems With Considerations for Future Expansion, Operator Safety, and Cost Adam T. Powell, PE President Emerald Engineering, Inc. Jeffrey L. Small, Sr. Senior
Steve Kovach District Sales Engineer
 Steve Kovach District Sales Engineer 630-740-7463 Steveekovach@Eaton.com Institute of Electrical and Electronics Engineers American Society of Safety Engineers 1 Electrical Hazards Electrical Hazards Shock
SECTION POWER SYSTEMS STUDIES
 PART 1 - GENERAL 1.1 RELATED SECTIONS: Refer to Division 15 for Mechanical requirements. Refer to Division 16 for Electrical requirements. 1.2 OBJECTIVE: A. The short-circuit study is to calculate the
Safety through proper system Grounding and Ground Fault Protection
 Safety through proper system Grounding and Ground Fault Protection November 4 th, 2015 Presenter: Mr. John Nelson, PE, FIEEE, NEI Electric Power Engineering, Inc. Event to start shortly Scheduled time:
Key factors to maintaining arc flash safety
 APPLICATI TE Key factors to maintaining arc flash safety Arc flash and blast When an arc fault occurs, the result is a massive electrical explosion. The light and heat emitted by the explosion is known
NATIONAL ELECTRIC SAFETY CODE 2012 EDITION
 NATIONAL ELECTRIC SAFETY CODE (ANSI C2 / NESC) 2012 EDITION Jim Tomaseski IBEW Director of Safety and Health EEI Safety and Health Committee Conference NESC 2012 IMPORTANT DATES SEPTEMBER 1, 2009 - Preprint
PREFACE ********************************************************** IT IS NOT INTENDED THAT THESE STANDARDS BE COPIED AND USED AS A SPECIFICATION!
 PREFACE This publication has been prepared as a guide for Architectural and Engineering (A&E) firms in the preparation of documents for the design and construction of new structures and the remodeling
Paul Dobrowsky Innovative Technology Services
 Significant Changes to NFPA 70E -2009 Edition Paul Dobrowsky Innovative Technology Services 2008 IEEE PCIC 1 Repeat Presentation This has been previously presented 2008 IEEE Electrical Safety Workshop
WAVEFORM CORRECTOR (WAVEFORM CORRECTORS) REPLACES SURGE PROTECTION DEVICES (SPD) PREVIOUSLY KNOWN AS (TVSS)
 REPLACES SURGE PROTECTION DEVICES (SPD) PREVIOUSLY KNOWN AS (TVSS)") WAVEFORM CORRECTOR (WAVEFORM CORRECTORS) REPLACES SURGE PROTECTION DEVICES (SPD) PREVIOUSLY KNOWN AS (TVSS) 1 PART 1: GENERAL This section describes materials and installation requirements for low voltage
WAVEFORM CORRECTOR (WAVEFORM CORRECTORS) REPLACES SURGE PROTECTION DEVICES (SPD) PREVIOUSLY KNOWN AS (TVSS) 1 PART 1: GENERAL This section describes materials and installation requirements for low voltage
Electrical Severity Measurement Tool Revision 4
 Electrical Severity Measurement Tool Revision 4 November 2017 Electrical Severity Measurement Tool 1.0 Purpose: This tool is intended to measure the severity of exposure to an electrical safety event based
SHORT CIRCUIT ANALYSIS OF 220/132 KV SUBSTATION BY USING ETAP
 SHORT CIRCUIT ANALYSIS OF 220/132 KV SUBSTATION BY USING ETAP Kiran V. Natkar 1, Naveen Kumar 2 1 Student, M.E., Electrical Power System, MSS CET/ Dr. B.A.M. University, (India) 2 Electrical Power System,
Overcurrent and Overload Protection of AC Machines and Power Transformers
 Exercise 2 Overcurrent and Overload Protection of AC Machines and Power Transformers EXERCISE OBJECTIVE When you have completed this exercise, you will understand the relationship between the power rating
NOTICE ER Roland Flood Pumping Station Arc Flash Study
 NOTICE This document contains the expression of the professional opinion of SNC-Lavalin Inc. (SLI) as to the matters set out herein, using its professional judgment and reasonable care. It is to be read
DESIGN STANDARD DS 29
 Assets Delivery Group Engineering DESIGN STANDARD DS 29 VERSION 1 REVISION 2 MAY 2018 FOREWORD The intent of Design Standards is to specify requirements that assure effective design and delivery of fit
Protection Basics Presented by John S. Levine, P.E. Levine Lectronics and Lectric, Inc GE Consumer & Industrial Multilin
 Protection Basics Presented by John S. Levine, P.E. Levine Lectronics and Lectric, Inc. 770 565-1556 John@L-3.com 1 Protection Fundamentals By John Levine 2 Introductions Tools Outline Enervista Launchpad
Bruce L. Graves /01/$ IEEE. IEEE Industry Applications Magazine PhotoDisc, Inc.
 Bruce L. Graves A Defining a Power System A power system is an assembly of generators, transformers, power lines, fuses, circuit breakers, protective devices, cables, and associated apparatus used to generate
(2) New Standard IEEE P (3) Core : (4) Windings :
 New Standard IEEE P (3) Core : (4) Windings :") (d) Electrical characteristics (such as short-circuit withstand, commutating reactance, more number of windings, etc); (e) Longer life expectancy; (f) Energy efficiency; (g) more demanding environment.
(d) Electrical characteristics (such as short-circuit withstand, commutating reactance, more number of windings, etc); (e) Longer life expectancy; (f) Energy efficiency; (g) more demanding environment.
How OSHA s New Transient Overvoltage Requirements Affect Work Practices. B.A. YEUNG, H. BRANCO Leidos Engineering, LLC USA
 21, rue d Artois, F-75008 PARIS CIGRE US National Committee http : //www.cigre.org 2016 Grid of the Future Symposium How OSHA s New Transient Overvoltage Requirements Affect Work Practices B.A. YEUNG,
This section applies to the requirements for the performance of power system studies by both the Design Engineer and the Contractor.
 Basis of Design This section applies to the requirements for the performance of power system studies by both the Design Engineer and the Contractor. Background Information A Short Circuit and Coordination
ARC FLASH & PPE UPDATE. Michael Olivo, P.E. Aaron Ramirez, E.I.T.
 ARC FLASH & PPE UPDATE Michael Olivo, P.E. Aaron Ramirez, E.I.T. What is Arc Flash? Arc Flash is the release of heat and light produced when electrical current flows through an air gap between two conductors
1960 Research Drive, Suite 100, Troy, Michigan with. REVISION: December 10, 2007 (Supersedes previous versions) Prepared by:
 Prepared by:") ENGINEERING SERVICES 1960 Research Drive, Suite 100, Troy, Michigan 48083 ARC FLASH REDUCTION with SEPAM RELAY ZONE SELECTIVE INTERLOCKING REVISION: December 10, 2007 (Supersedes previous versions) Prepared
ENGINEERING SERVICES 1960 Research Drive, Suite 100, Troy, Michigan 48083 ARC FLASH REDUCTION with SEPAM RELAY ZONE SELECTIVE INTERLOCKING REVISION: December 10, 2007 (Supersedes previous versions) Prepared
Overview of Grounding for Industrial and Commercial Power Systems Presented By Robert Schuerger, P.E.
 Overview of Grounding for Industrial and Commercial Power Systems Presented By Robert Schuerger, P.E. HP Critical Facility Services delivered by EYP MCF What is VOLTAGE? Difference of Electric Potential
RESEARCH ON CLASSIFICATION OF VOLTAGE SAG SOURCES BASED ON RECORDED EVENTS
 24 th International Conference on Electricity Distribution Glasgow, 2-5 June 27 Paper 97 RESEARCH ON CLASSIFICATION OF VOLTAGE SAG SOURCES BASED ON RECORDED EVENTS Pengfei WEI Yonghai XU Yapen WU Chenyi
How to maximize reliability using an alternative distribution system for critical loads
 White Paper WP024001EN How to maximize reliability using an alternative distribution system for critical loads Executive summary The electric power industry has several different distribution topologies
Electrical PIP ELEGL03 Guidelines for Power Systems Analysis
 July 2016 Electrical PIP ELEGL03 PURPOSE AND USE OF PROCESS INDUSTRY PRACTICES In an effort to minimize the cost of process industry facilities, this Practice has been prepared from the technical requirements
ADVANCES IN INDUSTRIAL SUBSTATION DESIGN USING THREE WINDING POWER TRANSFORMERS
 ADVANCES IN INDUSTRIAL SUBSTATION DESIGN USING TREE WINDING POWER TRANSFORMERS Copyright Material IEEE Paper No. PCIC-2008-XX Doug Brooks P.Eng Don Morency P.Eng. Pascal Tang P.Eng Senior Member, IEEE
Tab 2 Voltage Stresses Switching Transients
 Tab 2 Voltage Stresses Switching Transients Distribution System Engineering Course Unit 10 2017 Industry, Inc. All rights reserved. Transient Overvoltages Decay with time, usually within one or two cycles
CONTENTS. 1. Introduction Generating Stations 9 40
 CONTENTS 1. Introduction 1 8 Importance of Electrical Energy Generation of Electrical Energy Sources of Energy Comparison of Energy Sources Units of Energy Relationship among Energy Units Efficiency Calorific
Preface...x Chapter 1 Electrical Fundamentals
 Preface...x Chapter 1 Electrical Fundamentals Unit 1 Matter...3 Introduction...3 1.1 Matter...3 1.2 Atomic Theory...3 1.3 Law of Electrical Charges...4 1.4 Law of Atomic Charges...5 Negative Atomic Charge...5
Unit 3 Magnetism...21 Introduction The Natural Magnet Magnetic Polarities Magnetic Compass...21
 Chapter 1 Electrical Fundamentals Unit 1 Matter...3 Introduction...3 1.1 Matter...3 1.2 Atomic Theory...3 1.3 Law of Electrical Charges...4 1.4 Law of Atomic Charges...4 Negative Atomic Charge...4 Positive
Company Directive STANDARD TECHNIQUE: SD7F/2. Determination of Short Circuit Duty for Switchgear on the WPD Distribution System
 Company Directive STANDARD TECHNIQUE: SD7F/2 Determination of Short Circuit Duty for Switchgear on the WPD Distribution System Policy Summary This document provides guidance on calculation of fault levels
Arrester Disconnector
 Arrester Disconnector ArresterFacts 005 Photo ArresterWorks Prepared by Jonathan Woodworth Consulting Engineer ArresterWorks May 4, 2008 Copyright ArresterWorks 2008 Jonathan J. Woodworth Page1 The Arrester
Topic 6 Quiz, February 2017 Impedance and Fault Current Calculations For Radial Systems TLC ONLY!!!!! DUE DATE FOR TLC- February 14, 2017
 Topic 6 Quiz, February 2017 Impedance and Fault Current Calculations For Radial Systems TLC ONLY!!!!! DUE DATE FOR TLC- February 14, 2017 NAME: LOCATION: 1. The primitive self-inductance per foot of length
I P. /dt. di p V S Applications. Standards 1) IEC : 2007; IEC : ) IEC : 2016; IEC : 2017
 IEC : 2007; IEC : ) IEC : 2016; IEC : 2017") Ref: ART-B22-D70, ART-B22-D125, ART-B22-D175, ART-B22-D300 Flexible clip-around Rogowski coil for the electronic measurement of AC current with galvanic separation between the primary circuit (power) and
Ref: ART-B22-D70, ART-B22-D125, ART-B22-D175, ART-B22-D300 Flexible clip-around Rogowski coil for the electronic measurement of AC current with galvanic separation between the primary circuit (power) and
Modelling of Sf6 Circuit Breaker Arc Quenching Phenomena In Pscad
 Day 2 - Session IV-A High Voltage 163 Modelling of Sf6 Circuit Breaker Arc Quenching Phenomena In Pscad B. Kondala Rao, Gopal Gajjar ABB Ltd., Maneja, Vadodara, India Introduction Circuit breakers play
Arc Flash and NFPA 70E
 Arc Flash and NFPA 70E Presented by: J.D. Kyle Safe Work Practices Wearing Proper PPE? OSHA 1910.333 (a) (1) not to work hot or live except : 1. De energizing introduces additional or increased hazards
CHAPTER 15 GROUNDING REQUIREMENTS FOR ELECTRICAL EQUIPMENT
 CHAPTER 15 GROUNDING REQUIREMENTS FOR ELECTRICAL EQUIPMENT A. General In a hazardous location grounding of an electrical power system and bonding of enclosures of circuits and electrical equipment in the
AGN 005 Fault Currents and Short Circuit Decrement Curves
 Application Guidance Notes: Technical Information from Cummins Generator Technologies AGN 005 Fault Currents and Short Circuit Decrement Curves DESCRIPTION To facilitate the correct design of an electrical
Section 6: System Grounding Bill Brown, P.E., Square D Engineering Services
 Section 6: System Grounding Bill Brown, P.E., Square D Engineering Services Introduction The topic of system grounding is extremely important, as it affects the susceptibility of the system to voltage
Numbering System for Protective Devices, Control and Indication Devices for Power Systems
 Appendix C Numbering System for Protective Devices, Control and Indication Devices for Power Systems C.1 APPLICATION OF PROTECTIVE RELAYS, CONTROL AND ALARM DEVICES FOR POWER SYSTEM CIRCUITS The requirements
G. KOEPPL Koeppl Power Experts Switzerland
 PS3: Substation Design: New Solutions and Experiences Bus-Node Substation A Big Improvement in Short-Circuit and Switching Properties at Reduced Substation Costs G. KOEPPL Koeppl Power Experts Switzerland
1. All electrical switches and outlets used shall be equal to Hubbell heavy duty, specification grade or equivalent quality.
 PART 1: GENERAL 1.01 Wiring Devices A. This section of the standard includes design requirements for wiring connections, including receptacles and switches to equipment specified in other sections. 1.02
Effective System Grounding
 Effective System Grounding By Andrew Cochran of I-Gard and John DeDad of DeDad Consulting The costs associated with losses stemming from ground faults are staggering. For example, over a seven year period,
System Protection and Control Subcommittee
 Power Plant and Transmission System Protection Coordination Reverse Power (32), Negative Sequence Current (46), Inadvertent Energizing (50/27), Stator Ground Fault (59GN/27TH), Generator Differential (87G),
Grounding System Theory and Practice
 Grounding System Theory and Practice Course No. E-3046 Credit: 3 PDH Grounding System Theory and Practice Velimir Lackovic, Electrical Engineer System grounding has been used since electrical power systems
Upgrading Your Electrical Distribution System To Resistance Grounding
 Upgrading Your Electrical Distribution System To Resistance Grounding The term grounding is commonly used in the electrical industry to mean both equipment grounding and system grounding. Equipment grounding
thepower to protect the power to protect i-gard LITERATURE Low and medium voltage
 thepower to protect i-gard LITERATURE Low and medium voltage distribution systems Arc Flash Hazards and High Resistance Grounding Grounding of Standby and Emergency Power Systems Neutral Grounding Resistors
E N G I N E E R I N G M A N U A L
 1 1 1.0 PURPOSE The purpose of this document is to define policy and provide engineering guidelines for the AP operating companies (Monongahela Power Company, The Potomac Edison Company, and West Penn
Ground Fault Currents in Unit Generator-Transformer at Various NGR and Transformer Configurations
 Ground Fault Currents in Unit Generator-Transformer at Various NGR and Transformer Configurations A.R. Sultan, M.W. Mustafa, M.Saini Faculty of Electrical Engineering Universiti Teknologi Malaysia (UTM)
Protection of a 138/34.5 kv transformer using SEL relay
 Scholars' Mine Masters Theses Student Theses and Dissertations Fall 2016 Protection of a 138/34.5 kv transformer using SEL 387-6 relay Aamani Lakkaraju Follow this and additional works at: http://scholarsmine.mst.edu/masters_theses
Embedded Generation Connection Application Form
 Embedded Generation Connection Application Form This Application Form provides information required for an initial assessment of the Embedded Generation project. All applicable sections must be completed
Arc Flash Study Principles & Procedures for below 15 kv AC Systems. Xuan Wu, Dennis Hoffman, Ronald Wellman, and Manish Thakur
 Arc Flash Study Principles & Procedures for below 15 kv AC Systems Xuan Wu, Dennis Hoffman, Ronald Wellman, and Manish Thakur Agenda Arc Flash Study Purposes Introduction of Arc Flash Arc Flash Risk Locations
The Importance of the Neutral-Grounding Resistor. Presented by: Jeff Glenney, P.Eng. and Don Selkirk, E.I.T.
 The Importance of the Neutral-Grounding Resistor Presented by: Jeff Glenney, P.Eng. and Don Selkirk, E.I.T. Presentation Preview What is high-resistance grounding (HRG)? What is the purpose of HRG? Why
Circuit Breaker Based Feeder Pillar
 IJIRST International Journal for Innovative Research in Science & Technology Volume Issue 09 February 06 ISSN (online): 349-600 Circuit Breaker Based Feeder Pillar Neha A. Ninave Nikita M. Nimbulkar Minal
Thomas Wilkins Wilkins Consulting Henderson Nevada U.S.A.
 Medium Voltage Vacuum Circuit Breaker with Mechanically Interlocked Grounding Switch (VDH/GSMI) Provides Better Safety and Reliability for Wind and Solar Power Plants and Their Personnel than Remote Transfer
TECHNICAL BULLETIN 004a Ferroresonance
 May 29, 2002 TECHNICAL BULLETIN 004a Ferroresonance Abstract - This paper describes the phenomenon of ferroresonance, the conditions under which it may appear in electric power systems, and some techniques
A Guide to the DC Decay of Fault Current and X/R Ratios
 A Guide to the DC Decay of Fault Current and X/R Ratios Introduction This guide presents a guide to the theory of DC decay of fault currents and X/R ratios and the calculation of these values in Ipsa.
HIGH VOLTAGE CIRCUIT BREAKERS
 HIGH VOLTAGE CIRCUIT BREAKERS Design and Applications Second Edition, Revised and Expanded RUBEN D. GARZON Square D Co. Smyrna, Tennessee MARCEL Ш D E К К E R MARCEL DEKKER, INC. NEW YORK BASEL CONTENTS
Table of Contents. Introduction... 1
 Table of Contents Introduction... 1 1 Connection Impact Assessment Initial Review... 2 1.1 Facility Design Overview... 2 1.1.1 Single Line Diagram ( SLD )... 2 1.1.2 Point of Disconnection - Safety...
The Isolator/Surge Protector (ISP)
") The Isolator/Surge Protector (ISP) Technical Literature INTRODUCTION The Isolator/Surge Protector (ISP) is a solid-state device with logic-controlled circuitry which simultaneously provides DC isolation
The Isolator/Surge Protector (ISP) Technical Literature INTRODUCTION The Isolator/Surge Protector (ISP) is a solid-state device with logic-controlled circuitry which simultaneously provides DC isolation
The Isolator/Surge Protector (ISP)
") The Isolator/Surge Protector (ISP) Technical Literature INTRODUCTION The Isolator/Surge Protector (ISP) is a solid-state device with logic-controlled circuitry which simultaneously provides isolation and
The Isolator/Surge Protector (ISP) Technical Literature INTRODUCTION The Isolator/Surge Protector (ISP) is a solid-state device with logic-controlled circuitry which simultaneously provides isolation and