Effects of Instrumentation Recorder time Base Error on Spectral Purity
|
|
|
- Opal Hampton
- 6 years ago
- Views:
Transcription
1 Effects of Instrumentation Recorder time Base Error on Spectral Purity Item Type text; Proceedings Authors Leeke, P. D. Publisher International Foundation for Telemetering Journal International Telemetering Conference Proceedings Rights Copyright International Foundation for Telemetering Download date 08/06/ :48:36 Link to Item
2 EFFECTS OF INSTRUMENTATION RECORDER TIME BASE ERROR ON SPECTRAL PURITY P. D. LEEKE Manager of Instrumentation Recording Products Mincom Division Minnesota Mining and Manufacturing Company Summary Experimental data is presented to show how carrier amplitude of a recorded signal is affected by Time Base Error. Time Base Error effects on the sideband structure of a recorded signal are also shown for different amounts of Time Base Error and at several frequencies. The effect of capstan servo adjustment on spectral purity demonstrates the need for new methods of performance evaluation to achieve optimum performance when recording spectrum information. The data presented shows that skew (ITDE) has little effect on spectral purity for analysis bandwidths of 50 Hz or greater. Introduction Experience has shown that the Time Base Error characteristics of an instrumentation tape recorder can have a significant effect on the ability to accurately reproduce information when the analysis is being carried out in the frequency domain. It is quite easy to determine and apply the known characteristics of Time Base Error to data signals in the time domain, since the figures given for the equipment can be related dir6ctly to the errors they would cause in the information processed. However, the effects that Time Base Errors have in the frequency domain are less clearly recognizable and more difficult to predict. Previous information published on the effect of Time Base Error on spectral purity (Bradford and Jaffe) 1 dealt with the problem of predicting the reduction in amplitude of the center frequency being measured as a function of increasing Time Base Error or as a function of increasing frequency with a fixed Time Base Error. The derivations presented were based on a theoretical prediction of the reduction in carrier amplitude as Time Base Error increased from zero to a maximum of one radian of the frequency being measured. A primary purpose of my work in preparing for this paper was to verify that the predicted performance could be supported by experimental data. I have also attempted to provide data on two other characteristics. These are the effect of skew on spectral dispersion and the effect of capstan servo adjustment on the carrier frequency sideband spectrum. These 1 Bradford, R. S. and Jaffe, R. M., The Output Signal-to-Noise Ratio, Achieved When a Sinusoid is Recorded and Played Back on a Tape Recorder Having a Specified, Mean-Square TDE ; Mincom Division of 3M Company
3 latter tests were undertaken to show that although one can predict within a limited range the effect of Time Base Error on carrier amplitude reduction, it is very difficult to predict the makeup or shape of the sideband structures without specific information about the machine being used. I must point out that the data presented in this paper uses a different bandwidth analysis filter than that described by Bradford and Jaffe. I have used a 50 Hz analysis bandwidth which will integrate out the errors that could be seen with a narrower filter. This will be particularly true when we analyze the effects of skew on spectral purity since most skew rates are well within a 50 cycle band limit. The overall purpose of this paper is to present experimental evidence showing how increasing Time Base Error affects frequencies in different portions of the passband of a wideband instrumentation recorder and how capstan servo adjustment can have a strong effect on the shape of the sideband structure on data signals. The data shown in Figure 1 does not have a strong correlation with the predicted results described in the referenced paper. I would like to point out that this should not be interpreted as being a refutation of their derivations, but should be viewed as possible errors caused by the limitations of the measuring system (i.e., analysis bandwidth) and the necessary assumptions made during the mathematical derivation. The two limiting cases presented by Bradford and Jaffe are for peak-to-peak Time Base Errors which are less than one radian of the signal being measured and for Time Base Errors much larger than one radian of the measured signal. In the data presented, the measured Time Base Errors transcend from the one limiting case to the other and, therefore, lie in that never, never land between the two limiting cases described by Bradford and Jaffe. The wider analysis bandwidth which I have used can mask some of the effects that would otherwise be shown and, in particular, will affect the correlation of the carrier amplitude reduction. A narrower analysis filter would be much more desirable, but limitations of equipment did not permit use of such a setup. The 50 Hz filter bandwidth used will mask some of the detailed characteristics of the sideband structure very near the carrier and will also show errors as the baseline noise level adds into the filter and causes the curves to deviate from their expected path when the signal level begins to fall off. Figure 2 is a block diagram of the experimental apparatus used to gather the information presented. The recorder was a Mincom TICOR III, 14 track recorder using one inch wide magnetic tape. The analyzer used to measure the spectral distribution of the various carrier frequencies was a Hewlett-Packard Model 8553B/8552A connected to a Hewlett- Packard 7035 X-Y plotter for printout. I F bandwidth in the analyzer was 50 Hz. Slew rate of the analyzer was set at 200 Hz per second. This slow rate was used to make sure that the rate of analysis did not exceed the writing rate of the X-Y plotter. The recorder capstan servo was connected to an external breadboard phase modulator to allow artificial generation of specific levels of peak-to-peak Time Base Error to monitor the effects on spectral purity. The phase modulator was driven from a noise generator band
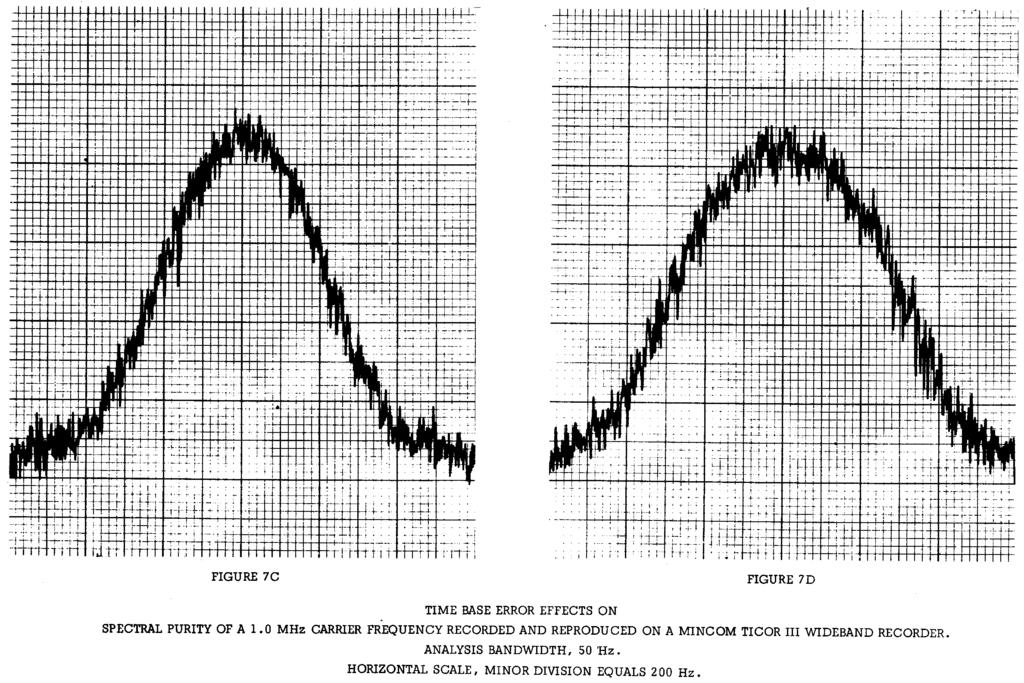
4 limited to 10 khz. This technique gave a random distribution for induced large Time Base Errors. Figure 3 shows the spectral purity of the oscillator used for the experiments. A very clean oscillator was needed to eliminate any possible masking of recorder effects due to poor oscillator performance. Figure 4A shows the spectral distribution of a 200 khz carrier frequency recorded at 120 ips and played back with a peak-to-peak Time Base Error of 400 nanoseconds. The spectrum clearly shows several significant characteristics of the recorder. The high first order of sidebands reaching to -30 db represent the servo corner frequency at approximately 900 Hz. The deep trough immediately adjacent to the center carrier, which extends to -50 db, is at approximately 300 Hz and represents the zero db flutter rejection frequency of the servo. The residual sidebands above and below 300 Hz represent uncorrected power in the flutter spectrum. Figure 4B shows the same recorder under identical conditions of operation with the exception that a defect was purposely introduced into the reproduce heads to show the effect of mechanical resonances on spectral dispersion. You will note the significant sidebands at a frequency of approximately 450 Hz. These sidebands are caused by head mechanical resonance. The significance of this demonstration is that the flutter and Time Base Error performance of the recorder showed only a very slight change between these two cases. The Time Base Error was increased approximately 100 nanoseconds and broadband flutter, as measured on a flutter meter, appeared essentially unchanged. The point is, significant changes can be made in the composition-of the sideband structure without these effects being clearly apparent in traditional methods of measurement. Spectral purity analysis is truly a much more sensitive means of measuring the subtle characteristics of a tape transport s performance. Figures 5A through 5D show the change in sideband structure as greater amounts of peak-to-peak Time Base Error are applied to the signal. These curves show the spectral dispersion effects for Time Base Errors of 0.5, 1.0, 3.0 and 5.0 microseconds, respectively, on a 200 khz carrier frequency. Similar effects are shown in Figures 6A through 7D for carrier frequencies of 500 khz and 1.0 MHz. Please note that, for Time Base Errors of I microsecond or greater, the sideband structure takes on the appearance of random noise and the coherency of the sidebands that was evident at lower Time Base Errors disappears. This is true because the forcing function used to create these higher Time Base Errors was random noise. The effect for large Time Base Errors (see Figure 7D) is similar to that predicted by Bradford and Jaffe for Time Base Error greater than one radian. Had these been created by a poorly functioning tape transport or one with less sophisticated servo performance, the sideband structures would take on characteristics similar to those for low Time Base Error performance, but with higher residual sideband levels.
5 Figures 8A through 8C show the effect of skew on the sideband spectrum for a 200 khz frequency. Skew (ITDE) would show a significant impact on the sideband spectrum if a narrower analysis filter had been used. However, since the bandwidth of 50 Hz encompasses a large percentage of skew rates, the effect is not clearly shown. Figures 9A through 10C show a comparison of different capstan servo adjustments on the spectral purity of a 200 khz carrier frequency. Figure 9A shows the performance of the system with the capstan servo adjusted for minimum peak-to-peak Time Base Error (300 nanoseconds). Figure 9B is the same condition of operation with the servo gain increased approximately 2 db, with a peak-to-peak Time Base Error of 600 nanoseconds Figure 9C shows the results with an increase in capstan servo gain of 3 db and a peak-topeak Time Base Error of 1.0 microsecond. The increase in Time Base Error is caused, for the most part, by an increase in the ringing rate at the servo corner frequency which is obvious from the dramatic increase in the sidebands at approximately 900 Hz. In Figure 9C, the gain increase has generated second order sidebands of the servo corner frequency at approximately 1800 Hz. I would like to point out, however, that in all three cases the machine was meeting typical Time Base Error specdfications for this type of equipment - Figures 10A through IOC show the same conditions of operation with reduced capstan servo gain. Figure IOA is identical to the previous Figure 9A. Figure IOB shows the results with the capstan servo gain reduced by 2 db which gives a resultant peak-to-peak Time Base Error of 380 nanoseconds. Figure 10C is for a reduction in capstan servo gain of 7 db and a resultant peak-to-peak Time Base Error of 550 nanoseconds. You will note that the significant change is a reduction in amplitude of the higher frequency sidebands and an increase in the level of the sidebands nearest to the carrier. This demonstrates the trade-off between the ability to reduce low frequency flutter and the generation of unwanted high frequency sidebands in a high performance servo. The relative importance of this information depends upon the bandwidth of the analysis instrument and the data of interest. Again, I would like to point out that the Time Base Error changed less than 2 to 1 for these latter cases, but there was a significant shift in the makeup of the sideband structure for the signal being analyzed. The Time Base Error for the conditions described by Figures 10A.- IOB and IOC meets published specifications. In this particular case, it would appear that it would be wise to run the servo at a slightly lower gain setting than that which would provide lowest Time Base Error. These data are another demonstration that traditional methods for performance measurement may not be adequate for the user who is concerned about spectral purity. The overall objective of the user is to minimize the errors introduced by the recorder so that his results reflect data from the signal of interest and not anomalies introduced by the data storage process.

6
7

8

9

10

11

12

13

14
15

16

17

18
Magnetic Tape Recorder Spectral Purity
 Magnetic Tape Recorder Spectral Purity Item Type text; Proceedings Authors Bradford, R. S. Publisher International Foundation for Telemetering Journal International Telemetering Conference Proceedings
PHASE NOISE MEASUREMENT SYSTEMS
 PHASE NOISE MEASUREMENT SYSTEMS Item Type text; Proceedings Authors Lance, A. L.; Seal, W. D.; Labaar, F. Publisher International Foundation for Telemetering Journal International Telemetering Conference
L AND S BAND TUNABLE FILTERS PROVIDE DRAMATIC IMPROVEMENTS IN TELEMETRY SYSTEMS
 L AND S BAND TUNABLE FILTERS PROVIDE DRAMATIC IMPROVEMENTS IN TELEMETRY SYSTEMS Item Type text; Proceedings Authors Wurth, Timothy J.; Rodzinak, Jason Publisher International Foundation for Telemetering
Local Oscillator Phase Noise and its effect on Receiver Performance C. John Grebenkemper
 Watkins-Johnson Company Tech-notes Copyright 1981 Watkins-Johnson Company Vol. 8 No. 6 November/December 1981 Local Oscillator Phase Noise and its effect on Receiver Performance C. John Grebenkemper All
Troubleshooting Common EMI Problems
 By William D. Kimmel, PE Kimmel Gerke Associates, Ltd. Learn best practices for troubleshooting common EMI problems in today's digital designs. Industry expert William Kimmel of Kimmel Gerke Associates
HF Receivers, Part 2
 HF Receivers, Part 2 Superhet building blocks: AM, SSB/CW, FM receivers Adam Farson VA7OJ View an excellent tutorial on receivers NSARC HF Operators HF Receivers 2 1 The RF Amplifier (Preamp)! Typical
FCC and ETSI Requirements for Short-Range UHF ASK- Modulated Transmitters
 From December 2005 High Frequency Electronics Copyright 2005 Summit Technical Media FCC and ETSI Requirements for Short-Range UHF ASK- Modulated Transmitters By Larry Burgess Maxim Integrated Products
CHAPTER 3 FREQUENCY DIVISION MULTIPLEXING TELEMETRY STANDARDS
 CHAPTER 3 FREQUENCY DIVISION MULTIPLEXING TELEMETRY STANDARDS Paragraph Subject Page 3.1 General... 3-1 3.2 FM Subcarrier Characteristics... 3-1 3.3 FM Subcarrier Channel Characteristics... 3-1 3.4 Tape
Application of a Telemetry System using DSB-AM Sub-Carriers
 Application of a Telemetry System using DSB-AM Sub-Carriers Item Type text; Proceedings Authors Roche, A. O. Publisher International Foundation for Telemetering Journal International Telemetering Conference
Using Frequency Diversity to Improve Measurement Speed Roger Dygert MI Technologies, 1125 Satellite Blvd., Suite 100 Suwanee, GA 30024
 Using Frequency Diversity to Improve Measurement Speed Roger Dygert MI Technologies, 1125 Satellite Blvd., Suite 1 Suwanee, GA 324 ABSTRACT Conventional antenna measurement systems use a multiplexer or
EENG473 Mobile Communications Module 3 : Week # (12) Mobile Radio Propagation: Small-Scale Path Loss
 Mobile Radio Propagation: Small-Scale Path Loss") EENG473 Mobile Communications Module 3 : Week # (12) Mobile Radio Propagation: Small-Scale Path Loss Introduction Small-scale fading is used to describe the rapid fluctuation of the amplitude of a radio
EENG473 Mobile Communications Module 3 : Week # (12) Mobile Radio Propagation: Small-Scale Path Loss Introduction Small-scale fading is used to describe the rapid fluctuation of the amplitude of a radio
Experiment No. 2 Pre-Lab Signal Mixing and Amplitude Modulation
 Experiment No. 2 Pre-Lab Signal Mixing and Amplitude Modulation Read the information presented in this pre-lab and answer the questions given. Submit the answers to your lab instructor before the experimental
MAKING TRANSIENT ANTENNA MEASUREMENTS
 MAKING TRANSIENT ANTENNA MEASUREMENTS Roger Dygert, Steven R. Nichols MI Technologies, 1125 Satellite Boulevard, Suite 100 Suwanee, GA 30024-4629 ABSTRACT In addition to steady state performance, antennas
A Compatible Double Sideband/Single Sideband/Constant Bandwidth FM Telemetry System for Wideband Data
 A Compatible Double Sideband/Single Sideband/Constant Bandwidth FM Telemetry System for Wideband Data Item Type text; Proceedings Authors Frost, W. O.; Emens, F. H.; Williams, R. Publisher International
DECEMBER 1964 NUMBER OF COPIES: 75
 NATIONAL RADIO ASTRONOMY OBSERVATORY Green Bank, West Virginia E ectronics Division Internal Report No. 42 A DIGITAL CROSS-CORRELATION INTERFEROMETER Nigel J. Keen DECEMBER 964 NUMBER OF COPIES: 75 A DIGITAL
PULSE CODE MODULATION TELEMETRY Properties of Various Binary Modulation Types
 PULSE CODE MODULATION TELEMETRY Properties of Various Binary Modulation Types Eugene L. Law Telemetry Engineer Code 1171 Pacific Missile Test Center Point Mugu, CA 93042 ABSTRACT This paper discusses the
Transmit filter designs for ADSL modems
 EE 233 Laboratory-4 1. Objectives Transmit filter designs for ADSL modems Design a filter from a given topology and specifications. Analyze the characteristics of the designed filter. Use SPICE to verify
14 fasttest. Multitone Audio Analyzer. Multitone and Synchronous FFT Concepts
 Multitone Audio Analyzer The Multitone Audio Analyzer (FASTTEST.AZ2) is an FFT-based analysis program furnished with System Two for use with both analog and digital audio signals. Multitone and Synchronous
IMPROVEMENTS TO FM AND IBOC SIGNAL QUALITY THROUGH THE USE OF PRE-EQUALIZATION
 IMPROVEMENTS TO FM AND IBOC SIGNAL QUALITY THROUGH THE USE OF PRE-EQUALIZATION Mike Woods Nautel Maine Inc. Bangor, Maine ABSTRACT FM HD Radio transmission, whether pure digital or hybrid (FM+HD), requires
EXPERIMENTAL RESULTS FOR PCM/FM, TIER 1 SOQPSK, AND TIER II MULTI-H CPM WITH CMA EQUALIZATION
 EXPERIMENTAL RESULTS FOR PCM/FM, TIER 1 SOQPSK, AND TIER II MULTI-H CPM WITH CMA EQUALIZATION Item Type text; Proceedings Authors Geoghegan, Mark Publisher International Foundation for Telemetering Journal
Understanding Mixers Terms Defined, and Measuring Performance
 Understanding Mixers Terms Defined, and Measuring Performance Mixer Terms Defined Statistical Processing Applied to Mixers Today's stringent demands for precise electronic systems place a heavy burden
Shively Labs. Spectral Regrowth
 Shively Labs Spectral Regrowth Abstract Intermodulation products, or spurs, can develop within the analog and digital transmitters in combined systems using high-level injection. In some cases, spurs can
Optical generation of frequency stable mm-wave radiation using diode laser pumped Nd:YAG lasers
 Optical generation of frequency stable mm-wave radiation using diode laser pumped Nd:YAG lasers T. Day and R. A. Marsland New Focus Inc. 340 Pioneer Way Mountain View CA 94041 (415) 961-2108 R. L. Byer
SEQUENTIAL NULL WAVE Robert E. Green Patent Pending
 SEQUENTIAL NULL WAVE BACKGROUND OF THE INVENTION [0010] Field of the invention [0020] The area of this invention is in communication and wave transfer of energy [0030] Description of the Prior Art [0040]
AN EXTENDED PHASE-LOCK TECHNIQUE FOR AIDED ACQUISITION
 AN EXTENDED PHASE-LOCK TECHNIQUE FOR AIDED ACQUISITION Item Type text; Proceedings Authors Barbour, Susan Publisher International Foundation for Telemetering Journal International Telemetering Conference
Glossary of VCO terms
 Glossary of VCO terms VOLTAGE CONTROLLED OSCILLATOR (VCO): This is an oscillator designed so the output frequency can be changed by applying a voltage to its control port or tuning port. FREQUENCY TUNING
CHAPTER 3. Frequency Division Multiplexing Telemetry Standards
 CHAPTER 3 Division Multiplexing Telemetry Standards Acronyms... 3-iii 3.1 General... 3-1 3.2 FM Subcarrier Characteristics... 3-1 3.3 FM Subcarrier Channel Characteristics... 3-1 3.3.1 Proportional-Bandwidth
Transmit filter designs for ADSL modems
 Transmit filter designs for ADSL modems 1. OBJECTIVES... 2 2. REFERENCE... 2 3. CIRCUITS... 2 4. COMPONENTS AND SPECIFICATIONS... 3 5. DISCUSSION... 3 6. PRE-LAB... 4 6.1 RECORDING SPECIFIED OPAMP PARAMETERS
EE390 Final Exam Fall Term 2002 Friday, December 13, 2002
 Name Page 1 of 11 EE390 Final Exam Fall Term 2002 Friday, December 13, 2002 Notes 1. This is a 2 hour exam, starting at 9:00 am and ending at 11:00 am. The exam is worth a total of 50 marks, broken down
Fourier Theory & Practice, Part I: Theory (HP Product Note )
") Fourier Theory & Practice, Part I: Theory (HP Product Note 54600-4) By: Robert Witte Hewlett-Packard Co. Introduction: This product note provides a brief review of Fourier theory, especially the unique
Fourier Theory & Practice, Part I: Theory (HP Product Note 54600-4) By: Robert Witte Hewlett-Packard Co. Introduction: This product note provides a brief review of Fourier theory, especially the unique
ECE 476/ECE 501C/CS Wireless Communication Systems Winter Lecture 6: Fading
 ECE 476/ECE 501C/CS 513 - Wireless Communication Systems Winter 2004 Lecture 6: Fading Last lecture: Large scale propagation properties of wireless systems - slowly varying properties that depend primarily
Antenna Measurements using Modulated Signals
 Antenna Measurements using Modulated Signals Roger Dygert MI Technologies, 1125 Satellite Boulevard, Suite 100 Suwanee, GA 30024-4629 Abstract Antenna test engineers are faced with testing increasingly
RECOMMENDATION ITU-R BT.655-7
 Rec. ITU-R BT.655-7 1 RECOMMENDATION ITU-R BT.655-7 Radio-frequency protection ratios for AM vestigial sideband terrestrial television systems interfered with by unwanted analogue vision signals and their
SHF Communication Technologies AG. Wilhelm-von-Siemens-Str. 23D Berlin Germany. Phone Fax
 SHF Communication Technologies AG Wilhelm-von-Siemens-Str. 23D 12277 Berlin Germany Phone +49 30 772051-0 Fax ++49 30 7531078 E-Mail: sales@shf.de Web: http://www.shf.de Application Note Jitter Injection
Chapter 5 Window Functions. periodic with a period of N (number of samples). This is observed in table (3.1).
. This is observed in table (3.1).") Chapter 5 Window Functions 5.1 Introduction As discussed in section (3.7.5), the DTFS assumes that the input waveform is periodic with a period of N (number of samples). This is observed in table (3.1).
Chapter 5 Window Functions 5.1 Introduction As discussed in section (3.7.5), the DTFS assumes that the input waveform is periodic with a period of N (number of samples). This is observed in table (3.1).
Land and Coast Station Transmitters Operating in the Band khz
 Issue 3 January 2016 Spectrum Management Radio Standards Specification Land and Coast Station Transmitters Operating in the Band 200-535 khz Aussi disponible en français CNR-117 Preface Radio Standards
Timing Noise Measurement of High-Repetition-Rate Optical Pulses
 564 Timing Noise Measurement of High-Repetition-Rate Optical Pulses Hidemi Tsuchida National Institute of Advanced Industrial Science and Technology 1-1-1 Umezono, Tsukuba, 305-8568 JAPAN Tel: 81-29-861-5342;
Wireless Channel Propagation Model Small-scale Fading
 Wireless Channel Propagation Model Small-scale Fading Basic Questions T x What will happen if the transmitter - changes transmit power? - changes frequency? - operates at higher speed? Transmit power,
STUDIO TO TRANSMITTER LINKING SYSTEM
 RFS37 May 1995 (Issue 1) SPECIFICATION FOR RADIO LINKING SYSTEM: STUDIO TO TRANSMITTER LINKING SYSTEM USING ANGLE MODULATION WITH CARRIER FREQUENCY SEPARATION BETWEEN 75 AND 500 khz Communications Division
Hints. for making. Better. Spectrum Analyzer. Measurements. Application Note
 Hints for making Better Spectrum Analyzer Measurements Application Note 1286-1 The Heterodyne Spectrum Analyzer The spectrum analyzer, like an oscilloscope, is a basic tool used for observing signals.
A 3 TO 30 MHZ HIGH-RESOLUTION SYNTHESIZER CONSISTING OF A DDS, DIVIDE-AND-MIX MODULES, AND A M/N SYNTHESIZER. Richard K. Karlquist
 A 3 TO 30 MHZ HIGH-RESOLUTION SYNTHESIZER CONSISTING OF A DDS, -AND-MIX MODULES, AND A M/N SYNTHESIZER Richard K. Karlquist Hewlett-Packard Laboratories 3500 Deer Creek Rd., MS 26M-3 Palo Alto, CA 94303-1392
TETRA Tx Test Solution
 Product Introduction TETRA Tx Test Solution Signal Analyzer Reference Specifications ETSI EN 300 394-1 V3.3.1(2015-04) / Part1: Radio ETSI TS 100 392-2 V3.6.1(2013-05) / Part2: Air Interface May. 2016
ECEN 5014, Spring 2013 Special Topics: Active Microwave Circuits and MMICs Zoya Popovic, University of Colorado, Boulder
 ECEN 5014, Spring 2013 Special Topics: Active Microwave Circuits and MMICs Zoya Popovic, University o Colorado, Boulder LECTURE 13 PHASE NOISE L13.1. INTRODUCTION The requency stability o an oscillator
Definitions. Spectrum Analyzer
 SIGNAL ANALYZERS Spectrum Analyzer Definitions A spectrum analyzer measures the magnitude of an input signal versus frequency within the full frequency range of the instrument. The primary use is to measure
SC5407A/SC5408A 100 khz to 6 GHz RF Upconverter. Datasheet. Rev SignalCore, Inc.
 SC5407A/SC5408A 100 khz to 6 GHz RF Upconverter Datasheet Rev 1.2 2017 SignalCore, Inc. support@signalcore.com P R O D U C T S P E C I F I C A T I O N S Definition of Terms The following terms are used
ECE 4670 Spring 2014 Lab 1 Linear System Characteristics
 ECE 4670 Spring 2014 Lab 1 Linear System Characteristics 1 Linear System Characteristics The first part of this experiment will serve as an introduction to the use of the spectrum analyzer in making absolute
Agilent 8657A/8657B Signal Generators
 Agilent / Signal Generators Profile Spectral performance for general-purpose test Overview The Agilent Technologies and signal generators are designed to test AM, FM, and pulsed receivers as well as components.
note application Measurement of Frequency Stability and Phase Noise by David Owen
 application Measurement of Frequency Stability and Phase Noise note by David Owen The stability of an RF source is often a critical parameter for many applications. Performance varies considerably with
Making Noise in RF Receivers Simulate Real-World Signals with Signal Generators
 Making Noise in RF Receivers Simulate Real-World Signals with Signal Generators Noise is an unwanted signal. In communication systems, noise affects both transmitter and receiver performance. It degrades
Outline. Communications Engineering 1
 Outline Introduction Signal, random variable, random process and spectra Analog modulation Analog to digital conversion Digital transmission through baseband channels Signal space representation Optimal
Wavelength Control and Locking with Sub-MHz Precision
 Wavelength Control and Locking with Sub-MHz Precision A PZT actuator on one of the resonator mirrors enables the Verdi output wavelength to be rapidly tuned over a range of several GHz or tightly locked
ECE 476/ECE 501C/CS Wireless Communication Systems Winter Lecture 6: Fading
 ECE 476/ECE 501C/CS 513 - Wireless Communication Systems Winter 2005 Lecture 6: Fading Last lecture: Large scale propagation properties of wireless systems - slowly varying properties that depend primarily
Application Note #60 Harmonic Measurement for IEC And other Radiated Immunity Standards
 Application Note #60 Harmonic Measurement for IEC 61000-4-3 And other Radiated Immunity Standards By: Applications Engineering In the rush to complete RF immunity testing on schedule, it is not all that
Keywords: ISM, RF, transmitter, short-range, RFIC, switching power amplifier, ETSI
 Maxim > Design Support > Technical Documents > Application Notes > Wireless and RF > APP 4929 Keywords: ISM, RF, transmitter, short-range, RFIC, switching power amplifier, ETSI APPLICATION NOTE 4929 Adapting
VHF LAND MOBILE SERVICE
 RFS21 December 1991 (Issue 1) SPECIFICATION FOR RADIO APPARATUS: VHF LAND MOBILE SERVICE USING AMPLITUDE MODULATION WITH 12.5 khz CARRIER FREQUENCY SEPARATION Communications Division Ministry of Commerce
Signal Detection with EM1 Receivers
 Signal Detection with EM1 Receivers Werner Schaefer Hewlett-Packard Company Santa Rosa Systems Division 1400 Fountaingrove Parkway Santa Rosa, CA 95403-1799, USA Abstract - Certain EM1 receiver settings,
Modulation Methods Frequency Modulation
 Modulation Methods Frequency Modulation William Sheets K2MQJ Rudolf F. Graf KA2CWL The use of frequency modulation (called FM) is another method of adding intelligence to a carrier signal. While simple
Agilent 71400C Lightwave Signal Analyzer Product Overview. Calibrated measurements of high-speed modulation, RIN, and laser linewidth
 Agilent 71400C Lightwave Signal Analyzer Product Overview Calibrated measurements of high-speed modulation, RIN, and laser linewidth High-Speed Lightwave Analysis 2 The Agilent 71400C lightwave signal
INTERNATIONAL STANDARD
 INTERNATIONAL STANDARD IEC 60268-16 Third edition 2003-05 Sound system equipment Part 16: Objective rating of speech intelligibility by speech transmission index Equipements pour systèmes électroacoustiques
Introduction. In the frequency domain, complex signals are separated into their frequency components, and the level at each frequency is displayed
 SPECTRUM ANALYZER Introduction A spectrum analyzer measures the amplitude of an input signal versus frequency within the full frequency range of the instrument The spectrum analyzer is to the frequency
Linear Time-Invariant Systems
 Linear Time-Invariant Systems Modules: Wideband True RMS Meter, Audio Oscillator, Utilities, Digital Utilities, Twin Pulse Generator, Tuneable LPF, 100-kHz Channel Filters, Phase Shifter, Quadrature Phase
ECE 476/ECE 501C/CS Wireless Communication Systems Winter Lecture 6: Fading
 ECE 476/ECE 501C/CS 513 - Wireless Communication Systems Winter 2003 Lecture 6: Fading Last lecture: Large scale propagation properties of wireless systems - slowly varying properties that depend primarily
Introduction to Envelope Tracking. G J Wimpenny Snr Director Technology, Qualcomm UK Ltd
 Introduction to Envelope Tracking G J Wimpenny Snr Director Technology, Qualcomm UK Ltd Envelope Tracking Historical Context EER first proposed by Leonard Kahn in 1952 to improve efficiency of SSB transmitters
SC5307A/SC5308A 100 khz to 6 GHz RF Downconverter. Datasheet SignalCore, Inc.
 SC5307A/SC5308A 100 khz to 6 GHz RF Downconverter Datasheet 2017 SignalCore, Inc. support@signalcore.com P RODUCT S PECIFICATIONS Definition of Terms The following terms are used throughout this datasheet
NXDN Signal and Interference Contour Requirements An Empirical Study
 NXDN Signal and Interference Contour Requirements An Empirical Study Icom America Engineering December 2007 Contents Introduction Results Analysis Appendix A. Test Equipment Appendix B. Test Methodology
A SIMPLIFIED APPROACH TO NOISE FIGURE MEASUREMENTS
 MAURY MICROWAVE A SIMPLIFIED APPROACH TO NOISE FIGURE MEASUREMENTS Model MT956D 25 Aug 2000 Commercially available instruments designed to measure noise performance factors (noise figure, effective input
Studying the Sensitivity of Remote-Field Testing Signals when Faced with Pulling Speed Variations
 More info about this article: http://www.ndt.net/?id=21592 Studying the Sensitivity of Remote-Field Testing Signals when Faced with Pulling Speed Variations Marc-André Guérard 1, Joe Renaud 1, David Aubé
Satellite Communications: Part 4 Signal Distortions & Errors and their Relation to Communication Channel Specifications. Howard Hausman April 1, 2010
 Satellite Communications: Part 4 Signal Distortions & Errors and their Relation to Communication Channel Specifications Howard Hausman April 1, 2010 Satellite Communications: Part 4 Signal Distortions
RECOMMENDATION ITU-R F *, ** Signal-to-interference protection ratios for various classes of emission in the fixed service below about 30 MHz
 Rec. ITU-R F.240-7 1 RECOMMENDATION ITU-R F.240-7 *, ** Signal-to-interference protection ratios for various classes of emission in the fixed service below about 30 MHz (Question ITU-R 143/9) (1953-1956-1959-1970-1974-1978-1986-1990-1992-2006)
HOW TO UNDERSTAND THE WORKINGS OF RADIO CONTROL
 HOW TO UNDERSTAND THE WORKINGS OF RADIO CONTROL By: Roger Carignan This article resulted from a workshop hosted by a member of our R/C model club, the 495 th R/C Squadron. I was asked to make a presentation
Measuring Batteries using the Right Setup: Dual-cell CR2032 and Battery Holder
 Measuring Batteries using the Right Setup: Dual-cell CR2032 and 18650 Battery Holder Introduction Knowing the exact specifications when testing batteries or any other energy-storage device is crucial.
The design of Ruthroff broadband voltage transformers M. Ehrenfried G8JNJ
 The design of Ruthroff broadband voltage transformers M. Ehrenfried G8JNJ Introduction I started investigating balun construction as a result of various observations I made whilst building HF antennas.
DOUBLE DENSITY RECORDING ACQUISITION AND PLAYBACK
 DOUBLE DENSITY RECORDING ACQUISITION AND PLAYBACK Item Type text; Proceedings Authors Roth, Paul Publisher International Foundation for Telemetering Journal International Telemetering Conference Proceedings
Experiment 2: Transients and Oscillations in RLC Circuits
 Experiment 2: Transients and Oscillations in RLC Circuits Will Chemelewski Partner: Brian Enders TA: Nielsen See laboratory book #1 pages 5-7, data taken September 1, 2009 September 7, 2009 Abstract Transient
ALMA Memo No NRAO, Charlottesville, VA NRAO, Tucson, AZ NRAO, Socorro, NM May 18, 2001
 ALMA Memo No. 376 Integration of LO Drivers, Photonic Reference, and Central Reference Generator Eric W. Bryerton 1, William Shillue 2, Dorsey L. Thacker 1, Robert Freund 2, Andrea Vaccari 2, James Jackson
C/N Ratio at Low Carrier Frequencies in SFQ
 Application Note C/N Ratio at Low Carrier Frequencies in SFQ Products: TV Test Transmitter SFQ 7BM09_0E C/N ratio at low carrier frequencies in SFQ Contents 1 Preliminaries... 3 2 Description of Ranges...
Rec. ITU-R F RECOMMENDATION ITU-R F *,**
 Rec. ITU-R F.240-6 1 RECOMMENDATION ITU-R F.240-6 *,** SIGNAL-TO-INTERFERENCE PROTECTION RATIOS FOR VARIOUS CLASSES OF EMISSION IN THE FIXED SERVICE BELOW ABOUT 30 MHz (Question 143/9) Rec. ITU-R F.240-6
ERC Recommendation 54-01
 ERC Recommendation 54-01 Method of measuring the maximum frequency deviation of FM broadcast emissions in the band 87.5 to 108 MHz at monitoring stations Approved May 1998 Amended 13 February 2015 Amended
FREQUENCY AGILE FM MODULATOR INSTRUCTION BOOK IB
 FMT615C FREQUENCY AGILE FM MODULATOR INSTRUCTION BOOK IB1215-02 TABLE OF CONTENTS SECTION SUBJECT 1.0 Introduction 2.0 Installation & Operating Instructions 3.0 Specification 4.0 Functional Description
Modification Details.
 Front end receiver modification for DRM: AKD Target Communications receiver. Model HF3. Summary. The receiver was modified and capable of receiving DRM, but performance was limited by the phase noise from
MEASUREMENT PROCEDURE AND TEST EQUIPMENT USED
 MEASUREMENT PROCEDURE AND TEST EQUIPMENT USED Except where otherwise stated, all measurements are made following the Electronic Industries Association (EIA) Minimum Standard for Portable/Personal Land
Phase Noise and Tuning Speed Optimization of a MHz Hybrid DDS-PLL Synthesizer with milli Hertz Resolution
 Phase Noise and Tuning Speed Optimization of a 5-500 MHz Hybrid DDS-PLL Synthesizer with milli Hertz Resolution BRECHT CLAERHOUT, JAN VANDEWEGE Department of Information Technology (INTEC) University of
DOUBLE SIDEBAND SUPPRESSED CARRIER TELEMETRY SYSTEM 1
 DOUBLE SIDEBAND SUPPRESSED CARRIER TELEMETRY SYSTEM 1 F. J. SCHMITT Lockheed Electronics Company White Sands Missile Range, New Mexico. Summary Vibration, shock, and acoustic data constitute one of the
Direct-Conversion I-Q Modulator Simulation by Andy Howard, Applications Engineer Agilent EEsof EDA
 Direct-Conversion I-Q Modulator Simulation by Andy Howard, Applications Engineer Agilent EEsof EDA Introduction This article covers an Agilent EEsof ADS example that shows the simulation of a directconversion,
IEEE 802.3aq Task Force Dynamic Channel Model Ad Hoc Task 2 - Time variation & modal noise 10/13/2004 con-call
 IEEE 802.3aq Task Force Dynamic Channel Model Ad Hoc Task 2 - Time variation & modal noise 10/13/2004 con-call Time variance in MMF links Further test results Rob Coenen Overview Based on the formulation
Experiment No. 3 Pre-Lab Phase Locked Loops and Frequency Modulation
 Experiment No. 3 Pre-Lab Phase Locked Loops and Frequency Modulation The Pre-Labs are informational and although they follow the procedures in the experiment, they are to be completed outside of the laboratory.
RECOMMENDATION ITU-R SA (Question ITU-R 131/7) a) that telecommunications between the Earth and stations in deep space have unique requirements;
 a) that telecommunications between the Earth and stations in deep space have unique requirements;") Rec. ITU-R SA.1014 1 RECOMMENDATION ITU-R SA.1014 TELECOMMUNICATION REQUIREMENTS FOR MANNED AND UNMANNED DEEP-SPACE RESEARCH (Question ITU-R 131/7) Rec. ITU-R SA.1014 (1994) The ITU Radiocommunication
Rec. ITU-R SA.1014 1 RECOMMENDATION ITU-R SA.1014 TELECOMMUNICATION REQUIREMENTS FOR MANNED AND UNMANNED DEEP-SPACE RESEARCH (Question ITU-R 131/7) Rec. ITU-R SA.1014 (1994) The ITU Radiocommunication
Spectrum Analyzer. EMI Receiver
 Challenges in Testing by Werner Schaefer Narrowband and Broadband Discrimination with a Spectrum Analyzer or EMI Receiver photo provided by Agilent 26 Conformity December 2007 In the field of EMC, the
MATRIX TECHNICAL NOTES MTN-109
 200 WOOD AVENUE, MIDDLESEX, NJ 08846 PHONE (732) 469-9510 E-mail sales@matrixtest.com MATRIX TECHNICAL NOTES MTN-109 THE RELATIONSHIP OF INTERCEPT POINTS COMPOSITE DISTORTIONS AND NOISE POWER RATIOS Amplifiers,
Keysight Technologies Making Accurate Intermodulation Distortion Measurements with the PNA-X Network Analyzer, 10 MHz to 26.5 GHz
 Keysight Technologies Making Accurate Intermodulation Distortion Measurements with the PNA-X Network Analyzer, 10 MHz to 26.5 GHz Application Note Overview This application note describes accuracy considerations
Method of measuring the maximum frequency deviation of FM broadcast emissions at monitoring stations. Recommendation ITU-R SM.
 Recommendation ITU-R SM.1268-4 (11/217) Method of measuring the maximum frequency deviation of FM broadcast emissions at monitoring stations SM Series Spectrum management ii Rec. ITU-R SM.1268-4 Foreword
University of Jordan School of Engineering Electrical Engineering Department. EE 219 Electrical Circuits Lab
 University of Jordan School of Engineering Electrical Engineering Department EE 219 Electrical Circuits Lab EXPERIMENT 7 RESONANCE Prepared by: Dr. Mohammed Hawa EXPERIMENT 7 RESONANCE OBJECTIVE This experiment
Unexplained Resonances in the Gravitation Field of the Earth
 Unexplained Resonances in the Gravitation Field of the Earth Herbert Weidner a Abstract: High resolution spectra of 74 SG stations were calculated with quadruple precision in order to reduce the numerical
The Effects of Crystal Oscillator Phase Noise on Radar Systems
 Thomas L. Breault Product Applications Manager FEI-Zyfer, Inc. tlb@fei-zyfer.com The Effects of Crystal Oscillator Phase Noise on Radar Systems Why Radar Systems need high performance, low phase noise
Measurement Procedure & Test Equipment Used
 Measurement Procedure & Test Equipment Used Except where otherwise stated, all measurements are made following the Electronic Industries Association (EIA) Minimum Standard for Portable/Personal Land Mobile
IE-35 & IE-45 RT-60 Manual October, RT 60 Manual. for the IE-35 & IE-45. Copyright 2007 Ivie Technologies Inc. Lehi, UT. Printed in U.S.A.
 October, 2007 RT 60 Manual for the IE-35 & IE-45 Copyright 2007 Ivie Technologies Inc. Lehi, UT Printed in U.S.A. Introduction and Theory of RT60 Measurements In theory, reverberation measurements seem
A DSP IMPLEMENTED DIGITAL FM MULTIPLEXING SYSTEM
 A DSP IMPLEMENTED DIGITAL FM MULTIPLEXING SYSTEM Item Type text; Proceedings Authors Rosenthal, Glenn K. Publisher International Foundation for Telemetering Journal International Telemetering Conference
ADC Based Measurements: a Common Basis for the Uncertainty Estimation. Ciro Spataro
 ADC Based Measurements: a Common Basis for the Uncertainty Estimation Ciro Spataro Department of Electric, Electronic and Telecommunication Engineering - University of Palermo Viale delle Scienze, 90128
Lab 10: Oscillators (version 1.1)
") Lab 10: Oscillators (version 1.1) WARNING: Use electrical test equipment with care! Always double-check connections before applying power. Look for short circuits, which can quickly destroy expensive equipment.
Lab 10: Oscillators (version 1.1) WARNING: Use electrical test equipment with care! Always double-check connections before applying power. Look for short circuits, which can quickly destroy expensive equipment.
Specify Gain and Phase Margins on All Your Loops
 Keywords Venable, frequency response analyzer, power supply, gain and phase margins, feedback loop, open-loop gain, output capacitance, stability margins, oscillator, power electronics circuits, voltmeter,