Acoustic Measuring System
|
|
|
- Abner Moses Barton
- 6 years ago
- Views:
Transcription
 Same calibrated sine wave level for both SPL and Impedance THD and 2 nd to 9 th harmonic distortion Precise Thiele/Small Parameters at correct drive level SPL + Phase / Imp +")
1 Acoustic Measuring System Up-to-date Replacement for LMS and MLSSA Multiple curves ? (depending on memory) Same calibrated sine wave level for both SPL and Impedance THD and 2 nd to 9 th harmonic distortion Precise Thiele/Small Parameters at correct drive level SPL + Phase / Imp + Phase in one measurement file Windows 7 64 bit compatible Preview & Drag & drop files from/to Klippel / LMS / VACS / MLSSA etc. FINE Hardware (USB) with built-in 25W Power Amplifier Fast measurements < 1 sec Measures also USB devices: o USB Headphones o USB Radios o USB Speakers o USB output level in % FSD Works with FINE QC End of Line Testing: o SPL & Sensitivity with individual tolerances o Automatic Golden Average o Advanced Rub & Buzz : FINEBuzz o Running Average and Statistics o File-sharing with FINE QC / R+D and other LOUDSOFT programs FINE R+D and FINE QC are both developed by experienced engineers 1
2 Contents Contents... 1 Overview... 3 HOW TO GET STARTED... 4 Select hardware and drivers:... 4 Then Do Calibration (ASIO recommended)... 6 Frequency Response / SPL Measurement... 9 Room Response Measurements Impedance Measurement Thiele/Small Parameter Measurements THD and Harmonic Distortion Waterfall (Cumulative Decay Spectrum) Stimulus Import/Export of SPL and Imp to FINE X- over and other Printing and Reports (PDF) Properties Windows Sound Settings / WDM drivers FAQ USB/Hardware problems


3 Overview Figure 1 - FINE R+D Main Screen 3


4 HOW TO GET STARTED 1. First install the FINE R+D software as ADMINISTRATOR from the CD without hardware connected. You must install for ALL users. 2. Then you will be asked to install the ASIO4ALL driver, which is needed to work with the FINE hardware. (The driver Is also available as download from 3. Then connect the power supply to the hardware box 4. Connect the hardware box to the computer with the USB cable 5. Start FINE R+D Select your hardware first! First you need to specify which hardware you are using: Go to properties (View/Toolbars and Docking Windows/Properties) and select the hardware you are using: 4


![Then press the [ASIO Settings] tab and the [ASIO Control Panel] button to open the](/docs-images/76/73781592/images/5-2.jpg "ASIO4ALL window. Here are listed the current sound drivers.")
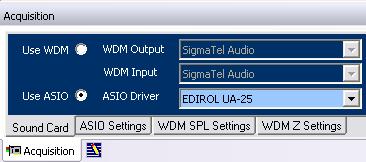
5 Verify Driver Settings Open the acquisition window and verify that ASIO driver is selected. Then make sure that the ASIO4ALL driver is selected in the drop-down box. Right click the acquisition window to select either docking or floating. Docking will show always as a part of the screen. Then press the [ASIO Settings] tab and the [ASIO Control Panel] button to open the ASIO4ALL window. Here are listed the current sound drivers. Click on the left buttons until you get ONLY the USB Audio Codec highlighted as shown: 5
 as well as soundcards with ASIO drivers. Open the acquisition window driver is active. and select Use ASIO.")
6 Then Do Calibration (ASIO recommended) Before you can measure with high accuracy we strongly recommend performing the ASIO system calibration below. This is valid for the FINE Hardware and FINELab (hardware) as well as soundcards with ASIO drivers. Open the acquisition window driver is active. and select Use ASIO. Check that the chosen ASIO Select Tools/Calibration ASIO to perform accurate system calibration using the precise ASIO drivers (When you use the WDM Windows drivers, select that calibration instead) Figure 2 - Output calibration Connect a true RMS voltmeter to the output and click the [Test] button. A short 1 khz sine wave is played at the speaker output. Enter the measured value (here 1.255Vrms) in the blank field and click [Set Cal.] This will calibrate the output to 1.00 Vrms. (press Test again if you want to verify). Press [Next] Connect a special loopback cable from output to microphone input. Press [Measure] and measure the total loopback response as a green response curve. When you press [Apply] this curve will be used to calibrate and equalize the total system. 6
![Figure 3 - Loopback response calibration Press [Next]. Connect a precise known power resistor to the output.](/docs-images/76/73781592/images/7-0.jpg "The value should be around 4 ohms. If you normally measure high impedance devices you can choose a higher value.")
7 Figure 3 - Loopback response calibration Press [Next]. Connect a precise known power resistor to the output. The value should be around 4 ohms. If you normally measure high impedance devices you can choose a higher value. Figure 4 - Impedance Loopback calibration 7
![Enter the resistor value in the upper field [ ] and press [Measure]. (Do not enter anything in the lower field [ ], that is done automatically).](/docs-images/76/73781592/images/8-0.jpg "When you press [Apply] this curve will be used to calibrate and equalize the system for impedance Press [Next] Connect a microphone calibrator if available and press [Measure].")
8 Enter the resistor value in the upper field [ ] and press [Measure]. (Do not enter anything in the lower field [ ], that is done automatically). When you press [Apply] this curve will be used to calibrate and equalize the system for impedance Press [Next] Connect a microphone calibrator if available and press [Measure]. The measured microphone calibration is shown as db re 1V/Pa. Press [Apply] to calibrate the system for correct SPL measurements using this microphone. Alternatively you can enter the microphone calibration data from the calibration sheet, which for example is supplied with the LOUDSOFT FL1 microphone. The full system calibration is now done and the settings have been saved for future use. You may perform this calibration again when needed. Figure 5 - Microphone calibration 8
.")

, or set the voltage you need.")
9 Frequency Response / SPL Measurement This chapter is a tutorial how to measure a normal loudspeaker with FINE R+D. If you have not yet done calibration, please do this first (go to page 4). Select New from the menu, or open another worksheet to add measurements. Figure 6 - View/Toolbars/Acquisition Acquisition is where you define output and input levels. See View/Toolbars and Docking Windows to set which windows are active. Under the tab ASIO Settings you may set the output voltage to 2.83V (industry standard), or set the voltage you need. Figure 7 - Acquisition window: Set Output When you measure you may get a warning that the input level is too high. In that case you need to bring down the input level using the attenuator in 10 db steps. Figure 8 - Open SPL window 9
 Figure 9 - Initial SPL Window - Set FFT time window for later measurements Now measure the speaker by clicking the (upper) [Measure] button in the SPL window.")
10 For the first measurement you should open the SPL window to set the FFT window to exclude any reflections and smoothing etc: (You can then use the button to measure all following curves with this setting) Figure 9 - Initial SPL Window - Set FFT time window for later measurements Now measure the speaker by clicking the (upper) [Measure] button in the SPL window. The upper part will normally display the large pulse at left thanks to the Auto Delay. The Time domain impulse response measured 1m from a typical satellite speaker is shown in Fig. 11. The time axis is automatically set to 0 at the start of the main impulse. (This arrived after ~3ms, corresponding to 1m (The speed of sound is ~343m/s or 34.3cm/ms ~1ft/ms). All you need here is to set a value for the Cosine Window Out / End, ideally to exclude all reflections in the time domain. When using 1300 samples / 27ms the response is valid down to 40 Hz (indicated by the red field). However that gives a very ragged frequency response because we have included all the reflections in the room (Fig. 11). So we need a much smaller window to exclude also the first reflection at ~2.5ms. Next is shown (Fig. 12) the response using a 2.7ms window, which this time excludes all the reflections. The curve is now nice and smooth, but the red field indicates that the curve is only valid above ~400 Hz. 10
 time window until the first reflection unfortunately gives poor low frequency response, because the 1/f ratio using 2.")
11 Figure 10 - Satellite response using short 2.7ms window. Only valid from ~400 Hz Using this short (2.7ms) time window until the first reflection unfortunately gives poor low frequency response, because the 1/f ratio using 2.7ms will only allow ~400 Hz as the lowest frequency (indicated by the red field). The impulse at 2.7ms is the reflection from the floor, which in this example was only 82cm below the speaker and microphone, see Fig. 13. Click [Save (F) to Current Block)] to transfer the response to the current response main window using the chosen window settings and smoothing if selected. 11


12 Figure 11 - Satellite close to floor, Red is Reflection Fig. 13 is illustrating the problem where the reflection from the floor is too close to the main signal, because there is little difference between the direct distance (green arrow) and the reflection path (red arrows). We can do two things to improve this: Move the microphone closer to the speaker and/or move both speaker and microphone further away from the floor (and other surfaces). Figure 12 - Satellite Speaker measured at 1m and 0.5m/away from walls (Green curve #4) 12

13 Both have been done for the green curve no. 4 (Fig. 15), by moving both the microphone and speaker up to 154cm from the floor and adjusting the microphone distance to 0.5m. This time we get the reflections much later and can use a window of 10.4ms. Therefore we can measure the real low frequency response of the satellite, starting from approximately 150 Hz. Note the dashed line in the SPL window is the acoustical phase response of the corresponding SPL/ frequency responses. All FINE R+D measurements are full resolution responses with phase, but the phase is here only selected for curve no.4 As soon as you have found a satisfying SPL window and suitable microphone distance plus speaker placement in the room you can continue to measure only by clicking the button, and you will every time get a new curve in another color. You will be prompted for inserting a comment for each curve. This way of saving measurements is called frequency NPPO (green) Note: You can also save the raw (Time-) measurements in the SPL window using the white button [Save (T) to the current Block] Fig. 14. This will save the raw (unwindowed) response and show it in the main display. Despite it looks ragged it may later be used for calculation of distortion and waterfall. Figure 13 - Time / frequency (NPPO) Save in SPL window 13
 curve was measured in the listening position on axis with the tweeter.")
14 Room Response Measurements In case you want to measure how the loud speaker actually sounds in your room, you should include all the reflections, by using the maximum Window/End. The next example is a measurement of a very good Hi-Fi loudspeaker measured in a good listening room. The first (brown) curve was measured in the listening position on axis with the tweeter. Note that the curve was 1/3 octave smoothed by selecting 1/3Oct in the SPL window. This response is well behaved above 1000 Hz, while the low frequency peaks and dips are caused by the standing waves in the room, Fig. 16. In stead of the 1/3 octave smoothing you can also select ½ octave or even 1/1 octave smoothing. 1/1 octave smoothing will not show the room modes, but only indicate the general sound balance in the room. The other (red) curve was measured after the loudspeaker was moved to another position in the room. Some of the low frequency peaks are now less dominating, indicating that these standing waves are less excited in the room. These two examples are well behaved room responses; however in many cases you will see much more variation in the low frequency range. FINE R+D is extremely useful for adjusting your (room-) EQ and/or finding the best loudspeaker position in the room. Also furniture positions and damping material can be optimised this way. Figure 14 - Room responses measured far from loudspeaker 14
 since the Cosine Window Out/End should be using the max (9600) always.")
15 Impedance Measurement Measuring loudspeaker impedance is done simply by clicking the right button Since the impedance measurement is purely electrical, the range and time window is already defined and set with the Auto delay. There is normally no need to open the impedance window (Z view) since the Cosine Window Out/End should be using the max (9600) always. Impedances down to 2 ohms can be measured well, if the max power of 25W is not exceeded. Lower impedances are also possible at low power. The measured impedance may later be used to calculate the TS Parameters (Thiele/Small Parameters). If the Added Mass or Added Volume option is used you need to measure an additional impedance curve with the added mass/volume. These two curves should then be transferred to the TS window. (See later page 16). Please see Fig.18, showing two impedance curves in the lower part of the main screen. Here is used the combined (SPL +Imp) display with the *button depressed Fig. 17. The impedance curves can be scaled independently of the SPL curves with the up/down arrows on the right side. Figure 15 Combined SPL+ Imp (Z) display selected [*] Figure 16 - Main Display with both SPL and Impedance 15
 and Sd will automatically be calculated.")
16 Thiele/Small Parameter Measurements In this chapter I want to measure the TS parameters of an 8 inch subwoofer. Press the TS Parameter button First I need to input the cone area Sd and Re Fig. 19. I choose to input the effective diameter of 17cm (half of surround) and Sd will automatically be calculated. FINE R+D can estimate Re (DCR) from the impedance curve, but in order to get the best accuracy I have measured Re=3.2 ohms with a precise Multimeter (DVM). That value is fixed by lock [v]. Now you can choose a measured impedance curve if not already present from the last measurement. There are two ways to select an already measured impedance curve: (1) Either press [block] and find the curve in the table, or (2) drag the curve from the main display by holding down the left mouse button and drop it over the [Drop] field. The Fixed Mass option is the most accurate method. However this requires that you know the total moving mass of cone + Voice Coil + half surround + half spider (including dust cap and glue etc.) = Fixed Mass Md. If you know this mass (from the datasheet) you should enter that, which causes the air load mass (Mair) to be calculated, Md + Mair=Mms. When the Calculate button is pressed, FINE R+D will calculate all the TS parameters by fitting a simulated impedance curve (blue) in the chosen frequency range. In this case we get a very good fit around Fs, which is important for getting accurate TS parameters. If none of the masses are known you can choose the standard Added Mass or Added Box methods, which both require you to make a second impedance measurement. In those cases we end up with a total of 4 curves, 2 measured and 2 fitted. If the curve fitting is bad, you should set [x] in the Reset box, causing a restart of fitting. Figure 17 TS Parameter window with accurate curve fitting 16
 to the current Block] or drag it to the distortion window.")
17 THD and Harmonic Distortion In order to calculate distortion you need the raw time (T) data. If you have not yet measured that go to the SPL window and make a new measurement, and then save it using the white button [Save (T) to the current Block] or drag it to the distortion window. Now open the distortion window and select the measurement(s) having the raw time (T-) response saved. Press [From block] or drag the Time response to the [drop] field. The saved time blocks have a white vertical stripe after the curve number. (Frequency NPPO files have a green stripe) Figure 18 - Select raw (T) time data for distortion calculation Click [Calculate from SPL Chirp] to get the THD and 2 nd -9 th harmonics calculated and displayed in % (x1-x10) for a 2.5in full range, see Fig. 21. The red fill at left is invalid data. Figure 19 - THD and 2nd-9th harmonic Distortion x10 for 2.5in full range 17

18 Fig 22 gives the THD and 2 nd -9 th harmonics for the same 2.5, but now as responses in db. The fundamental is also shown in blue. Figure 20 - THD and 2nd-9th harmonics for the same 2.5, but now as responses in db 18

19 Waterfall (Cumulative Decay Spectrum) Figure 21 - Example of Waterfall from a woofer with Time ms The raw time data further gives the possibility to view the decay of a measured response as a waterfall called Cumulative Decay spectrum. Thereby resonances will show clearly as ridges parallel to the time axis, while reflections will show as dips and peaks in the time direction in the 3D display. The special Time Curtain may be used to see the individual time slices as shown in Fig. 21, where the Time Curtain is set at ms. Use the lower right screen to control the Time Curtain, however you can also just roll the mouse wheel to change the position. Press [From block] or drag the Time response you want to see as waterfall to the [drop] field like in the distortion window. The saved time blocks have a white vertical stripe after the curve number. (Frequency NPPO files have a green stripe). Press [Calculate] and the waterfall will then be calculated using default settings. When you change settings the waterfall curve will turn grey to indicate that a recalculation is needed. There are several settings for the display like Isometric + shear View and Perspective View. In all cases you can rotate and move the curve by holding and dragging with the left mouse button The default resolution is 1/12 octave. Press High Res. [ ] to show the Waterfall in the full 1/48 octave resolution. 19


20 Figure 22 - Select Raw Time Data from Block Figure 23 - Waterfall of well-behaved Tweeter in High Resolution (1/48 Oct) View Mode Fig. 23 shows the waterfall of a good tweeter using the default Isometric display in High Resolution 1/48 Oct. mode. The time Range is this time set to max 2mS, and the displayed waterfall shows that the response has dropped below the floor after approximately 1mS. The step size between slices is set to 2, so the automatic settings indicate there will be 48 slices in the waterfall. Fig. 24 explains how to set the Display settings. The high resolution 1/48 Oct. mode is very detailed and may take some CPU time to calculate. Be sure to set the (Cosine) Window End to exclude the unwanted reflections like you have done when measuring the SPL response. Fig. 25 shows the setup of the waterfall slices and Time Curtain. The max Time is automatically taken from the Time Range (see Fig. 24) so you only have to specify the step (slice) size, which has to be an integer number. The step size is calculated in the right column, and the number of steps is automatically calculated to fill the available display. Below you find the setting of the special Time Curtain. Moving the lower slider with the left mouse button will move the Time Curtain in the main display, while highlighting the current response, which is also shown in the small display. Alternatively you may move the Time Curtain with the + / - buttons. 20
 Window End.")
 The slider below the small picture is used to set the Time Curtain, which will highlight a certain")
21 Select View Mode and Zoom with these buttons Select 1/48 Oct. High resolution Display (Slower) Set min. and max display frequency Set Time Range Choose SPL range Figure 24 - Waterfall Display settings Set (Cosine-) Window End. Normally use same setting as for frequency measurement (To avoid reflections from room) Most of these settings are automatic. You only have to select the step size (size of Time slice) The slider below the small picture is used to set the Time Curtain, which will highlight a certain Time slice in the main display. The slice is also shown here in the small picture Figure 25 - Slices and Curtain settings 21

22 Stimulus Here you can set the used sweep range. It is recommended to start min ½ octave lower than needed. For ASIO use max. =23kHz with 48kHz sampling. For WDM max freq is 21 khz. The sweep time can be set from 0.1 to 2.5 sec, but below 0.5 sec is not recommended. Figure 26 - Stimulus settings Import/Export of SPL and Imp to FINE X- over and other FINE R+D is a unique tool for measuring loudspeaker responses, which may be exported in the standard Loudsoft format *.lab or text format, for example to the acclaimed software FINE X-over ( FINE R+D will export the responses with phase, which is necessary for getting precise cross-over designs, that measure exactly as simulated. The SPL and Impedance can also be imported or exported in standard *.txt formats for most other software, like Klippel, VACS, LMS and MLSSA, see Fig 25. Figure 27 - SPL and Impedance export from FINE R+D 22

23 Figure 28 - File (Import) Preview of FRQ, TXT, Lab FSIM etc. responses 23
 shows a 3-way cross-over designed in FINE X-over.")

24 Figure 29-3-way crossover optimised in FINE X-over using SPL and Imp from FINE R+D The example above (Fig.26) shows a 3-way cross-over designed in FINE X-over. The SPL responses and impedance were imported with phase directly from FINE R+D. The crossover was optimized while keeping the minimum impedance (here 3.2 ohms for 4 ohms nominal Imp.). Printing and Reports (PDF) Figure 30 - Print Preview 24
 to see what you print in advance, Fig. 28. PDF Reports can be made by downloading for example the free PDF writer 995 http://www.pdf995.com/.")
25 The print command will print up to 5 pages including Main Overview, SPL and Imp windows, TS Parameters and Distortion. Select Print Preview (Expand down if not visible) to see what you print in advance, Fig. 28. PDF Reports can be made by downloading for example the free PDF writer Then you can print 1-5 pages to this and thereby create a fine PDF-report (See example in documents) Figure 31 - Print Preview Main, SPL and Imp, TS Pars and Distortion 25
.")
26 Properties Go to properties (View/Toolbars and Docking Windows/Properties) Figure 32 Properties (The Auto Delay has a default amplitude threshold of 5% of max. If the program is triggered on unwanted noise spikes, you can change this setting in Properties, but only if you are really sure). Select the hardware you are using in Acquisition Common: (Default is FINE Hardware). 26

27 Windows Sound Settings / WDM drivers Figure 33 - Windows Sound Input 27


28 Figure 34 Windows Sound Output Figure 35 Windows Microphone Level 28
29 FAQ FINE Hardware USB problems If you have USB Problems with the FINE Hardware here are some tips: If the USB cable is plugged out, DO remember to switch off the power to the FINE hardware, and switch it on again, before you plug the USB cable in the computer again. Otherwise Windows might not be able to detect the ASIO USB hardware. If a similar problem happens when restarting the computer, you can go through the following procedure to solve the problem: o Unplug the USB cable from the computer o Switch off the power to the FINE Hardware o Switch it on again o Plug in the USB cable Verify Driver Settings If you get error messages or wrong levels during measurements, you should verify that the correct drivers are being used and selected. Go to page 5 and perform the listed checks. You must have installed the ASIO4ALL drivers (page 4), and selected the correct hardware (page4). Peter Larsen 29
CONTENTS. How to get started FINEQC calibration procedure 3
 CONTENTS How to get started.. 2 1. FINEQC calibration procedure 3 1.1 Output level.. 3 1.2 SPL Loopback calibration.. 4 1.3 Impedance (Z) Loopback calibration using FINELab hardware.. 5 1.4 Impedance (Z)
FINEBox. Non-Linear High Power Box Design Program For Hi-Fi, PA and Micro loudspeakers T U T O R I A L
 FINEBox Non-Linear High Power Box Design Program For Hi-Fi, PA and Micro loudspeakers T U T O R I A L 1 FINEBox is the ideal Box Design Program for all Loudspeakers including Micro and PA drivers. Simulation
Practical Impedance Measurement Using SoundCheck
 Practical Impedance Measurement Using SoundCheck Steve Temme and Steve Tatarunis, Listen, Inc. Introduction Loudspeaker impedance measurements are made for many reasons. In the R&D lab, these range from
FINEBox T U T O R I A L
 FINEBox Non-Linear High Power Box Design Program For Hi-Fi, PA and Micro loudspeakers T U T O R I A L www.loudsoft.com 1 Contents 1. Micro Loudspeaker / Receiver Box Design... 4 2. 15 inch PRO-Sound Woofer...
Dayton Audio is proud to introduce DATS V2, the best tool ever for accurately measuring loudspeaker driver parameters in seconds.
 Dayton Audio is proud to introduce DATS V2, the best tool ever for accurately measuring loudspeaker driver parameters in seconds. DATS V2 is the latest edition of the Dayton Audio Test System. The original
Tolerances of the Resonance Frequency f s AN 42
 Tolerances of the Resonance Frequency f s AN 42 Application Note to the KLIPPEL R&D SYSTEM The fundamental resonance frequency f s is one of the most important lumped parameter of a drive unit. However,
Maximizing LPM Accuracy AN 25
 Maximizing LPM Accuracy AN 25 Application Note to the KLIPPEL R&D SYSTEM This application note provides a step by step procedure that maximizes the accuracy of the linear parameters measured with the LPM
CLIO Pocket is Audiomatica's new Electro-Acoustical Multi-Platform Personal measurement system.
 Release 1.5! CLIO Pocket is Audiomatica's new Electro-Acoustical Multi-Platform Personal measurement system. The system comes complete of the CLIO Pocket software (Windows and OSX native), the CLIO CP-01
SigCal32 User s Guide Version 3.0
 SigCal User s Guide . . SigCal32 User s Guide Version 3.0 Copyright 1999 TDT. All rights reserved. No part of this manual may be reproduced or transmitted in any form or by any means, electronic or mechanical,
Measurement at defined terminal voltage AN 41
 Measurement at defined terminal voltage AN 41 Application Note to the KLIPPEL ANALYZER SYSTEM (Document Revision 1.1) When a loudspeaker is operated via power amplifier, cables, connectors and clips the
Measurement of Weighted Harmonic Distortion HI-2
 Measurement of Weighted Harmonic Distortion HI-2 Application Note for the R&D and QC SYSTEM (Document Revision 1.2) AN 7 DESCRIPTION The weighted harmonic distortion HI-2 can be measured by using the DIS-Pro
The Woofer Tester Pro. Integrated Speaker Measurement & Design. Web: Phone:
 Integrated Speaker Measurement & Design 1 Features Precision Thiele-Small Measurement System (Microwatt to 200W test range) Measures Voice Coil and Suspension AC and DC Compression Effects 100pF-1000uF,
SigCalRP User s Guide
 SigCalRP User s Guide . . Version 4.2 Copyright 1997 TDT. All rights reserved. No part of this manual may be reproduced or transmitted in any form or by any means, electronic or mechanical, for any purpose
Measurement of weighted harmonic distortion HI-2
 Measurement of weighted harmonic distortion HI-2 Software of the KLIPPEL R&D and QC SYSTEM ( Document Revision 1.0) AN 7 DESCRIPTION The weighted harmonic distortion HI-2 is measured by using the DIS-Pro
Rub & Buzz Detection with Golden Unit AN 23
 Rub & Buzz etection with Golden Unit A 23 Application ote to the KLIPPEL R& SYSTEM Rub & buzz effects are unwanted, irregular nonlinear distortion effects. They are caused by mechanical or structural defects
Balanced Armature Check (BAC)
") Balanced Armature Check (BAC) S39 Module of the KLIPPEL ANALYZER SYSTEM (QC Ver. 6.1, db-lab Ver. 210) Document Revision 1.1 FEATURES Measure the Armature offset in μm No additional sensor required Ultra-fast
Balanced Armature Check (BAC) S39 Module of the KLIPPEL ANALYZER SYSTEM (QC Ver. 6.1, db-lab Ver. 210) Document Revision 1.1 FEATURES Measure the Armature offset in μm No additional sensor required Ultra-fast
Transfer Function (TRF)
") (TRF) Module of the KLIPPEL R&D SYSTEM S7 FEATURES Combines linear and nonlinear measurements Provides impulse response and energy-time curve (ETC) Measures linear transfer function and harmonic distortions
(TRF) Module of the KLIPPEL R&D SYSTEM S7 FEATURES Combines linear and nonlinear measurements Provides impulse response and energy-time curve (ETC) Measures linear transfer function and harmonic distortions
ONLINE TUTORIALS. Log on using your username & password. (same as your ) Choose a category from menu. (ie: audio)
 Choose a category from menu. (ie: audio)") ONLINE TUTORIALS Go to http://uacbt.arizona.edu Log on using your username & password. (same as your email) Choose a category from menu. (ie: audio) Choose what application. Choose which tutorial movie.
ONLINE TUTORIALS Go to http://uacbt.arizona.edu Log on using your username & password. (same as your email) Choose a category from menu. (ie: audio) Choose what application. Choose which tutorial movie.
Loudspeaker Design & Measurement
 Loudspeaker Design & Measurement Keith Larson Smith & Larson Audio Presentation to the Lone Star Audio Fest 5/3/2008 Overview Bass Enclosure Design (WT2, ST or WTPro) Thiele Small Measurements Designing
QUICKSTART OWNER S MANUAL (ENGLISH) 1 8 MANUAL DE INICIO RÁPIDO DEL USUARIO (ESPAÑOL) 9 16 GUIDE D UTILISATION SIMPLIFIÉ (FRANÇAIS) 17 24
 1 8 MANUAL DE INICIO RÁPIDO DEL USUARIO (ESPAÑOL) 9 16 GUIDE D UTILISATION SIMPLIFIÉ (FRANÇAIS) 17 24") QUICKSTART OWNER S MANUAL (ENGLISH) 1 8 MANUAL DE INICIO RÁPIDO DEL USUARIO (ESPAÑOL) 9 16 GUIDE D UTILISATION SIMPLIFIÉ (FRANÇAIS) 17 24 KURZBEDIENUNGSANLEITUNG (DEUTSCH) 25 32 MANUALE RAPIDO DI UTILIZZO
QUICKSTART OWNER S MANUAL (ENGLISH) 1 8 MANUAL DE INICIO RÁPIDO DEL USUARIO (ESPAÑOL) 9 16 GUIDE D UTILISATION SIMPLIFIÉ (FRANÇAIS) 17 24 KURZBEDIENUNGSANLEITUNG (DEUTSCH) 25 32 MANUALE RAPIDO DI UTILIZZO
AXIHORN CP5TB: HF module for the high definition active loudspeaker system "NIDA Mk1"
 CP AUDIO PROJECTS Technical paper #4 AXIHORN CP5TB: HF module for the high definition active loudspeaker system "NIDA Mk1" Ceslovas Paplauskas CP AUDIO PROJECTS 2012 г. More closely examine the work of
Production Noise Immunity
 Production Noise Immunity S21 Module of the KLIPPEL ANALYZER SYSTEM (QC 6.1, db-lab 210) Document Revision 2.0 FEATURES Auto-detection of ambient noise Extension of Standard SPL task Supervises Rub&Buzz,
Supplementary User Manual for BSWA Impedance Tube Measurement Systems
 Supplementary User Manual for BSWA Impedance Tube Measurement Systems 1 P age Contents Software Installation... 3 Absorption Measurements -- ASTM Method... 4 Hardware Set-Up... 4 Sound card Settings...
Micro Receiver Analysis
 Micro Receiver Analysis The following 15mm example specifications are given by the customer: Diaphragm Material Properties: Young s modulus : 620 kg/mm2 Poisson Ratio : 0.24 Density : 1.36 g/cm3 Thickness
Experiment 8: An AC Circuit
 Experiment 8: An AC Circuit PART ONE: AC Voltages. Set up this circuit. Use R = 500 Ω, L = 5.0 mh and C =.01 μf. A signal generator built into the interface provides the emf to run the circuit from Output
Linear Lumped Parameter Measurement
 Hands-On Training 1 Linear Lumped Parameter Measurement 1 Objectives of the Hands-on Training - Understanding physical mechanis of electro-dynamic transducers - Applying lumped parameter modeling - Measuring
Crossover Design by Software
 ALMA Europe 2009 Paper Presentation: Crossover Design by Software Peter Larsen The Purpose of the Crossover: 1. Protect midrange and tweeter from LF overload 2. Obtain smooth transition between drivers
SoundCheck 12.0 Quick Start Guide
 Software Install Basics Upgrading From an Earlier Version If you are upgrading from an earlier version of SoundCheck 12.0 (or Beta version) you should copy the old installation folder and name it "SoundCheck
Causes for Amplitude Compression AN 12
 Causes for Amplitude AN 2 Application Note to the R&D SYSTEM Both thermal and nonlinear effects limit the amplitude of the fundamental component in the state variables and in the sound pressure output.
A Guide to Reading Transducer Specification Sheets
 A Guide to Reading Transducer Specification Sheets There are many numbers and figures appearing on a transducer specification sheet. This document serves as a guide to understanding the key parameters,
Measurement of Amplitude Modulation AN 6
 Measurement of Application Note to the KLIPPEL R&D System (Document Revision 1.1) DESCRIPTION In a loudspeaker transducer, the difference between the amplitude response of the fundamental high frequency
Quadra 10 Available in Black and White
 S P E C I F I C A T I O N S Quadra 10 Available in Black and White Frequency response, 1 meter on-axis, swept-sine in anechoic environment: 74 Hz 18 khz (±3 db) Usable low frequency limit (-10 db point):
20 VOICE COIL. Figure 7: BlieSMA T34A-4 SoundCheck CSD waterfall plot
 and off-axis response of the T34A-4 high-frequency device. Figure 4 shows the off-axis curves normalized to the on-axis response. Figure 5 shows the CLIO 1 polar plot (measured in 10 increments). The two-sample
Using Audacity to make a recording
 Using Audacity to make a recording Audacity is free, open source software for recording and editing sounds. It is available for Mac OS X, Microsoft Windows, GNU/Linux, and other operating systems and can
Impulse response. Frequency response
 CLIOwin 7, by Audiomatica, is the new measurement software for the CLIO System. The CLIO System is the easiest and less expensive way to measure: - electrical networks - electronic equipment - loudspeaker
Material Parameter Measurement (MPM)
") Material Parameter Measurement (MPM) C4 Software Module and Accessory of the KLIPPEL ANALYZER SYSTEM (Document Revision 1.3) FEATURES Measure E modulus and damping Evaluate raw materials Specify loudspeaker
Material Parameter Measurement (MPM) C4 Software Module and Accessory of the KLIPPEL ANALYZER SYSTEM (Document Revision 1.3) FEATURES Measure E modulus and damping Evaluate raw materials Specify loudspeaker
C7: Speaker Components
 Reference this. 2 C7: Speaker Components The C7 project was directed by JL Audio s Chief Engineer and CEO, Lucio Proni, with a clear mission to create our finest-ever automotive component speakers. Challenging
SoundCheck 11 Quick Start Guide
 Software Install Basics Upgrading From an Earlier Version If you are upgrading from an earlier version of SoundCheck 11.1 (or Beta version) you should copy the old installation folder and name it "SoundCheck
klippel qc system 100% end-of-line testing
 klippel qc system 100% end-of-line testing What KLIPPEL QC Offers for End-of-line Testing: KLIPPEL instruments, the recognized standard in R&D loudspeaker analysis, developed a new generation of diagnostics
QC Software Feature Overview
 QC Feature Overview QC Version 1-6 Rev 1.2 2018-08-01 1 QC System Feature Overview Valid for QC Version 6 / db-lab version 210 August 2018 For details please see specifications under www.klippel.de. Measurements
Using MiniDSP 2x4 to Time-Align Multiple Subs on One Channel before Room Correction (Last updated March 10, 2017)
") Using MiniDSP 2x4 to Time-Align Multiple Subs on One Channel before (Last updated March 10, 2017) Contents Contents... 2 Overview... 3 The Procedure... 4 Step 1: Gain-matching the subwoofers.... 4 Step
Using MiniDSP 2x4 to Time-Align Multiple Subs on One Channel before (Last updated March 10, 2017) Contents Contents... 2 Overview... 3 The Procedure... 4 Step 1: Gain-matching the subwoofers.... 4 Step
Ulteé Audiotechnik. Professional Audio Measurement. User s Manual
 Ulteé Audiotechnik Professional Audio Measurement User s Manual 2 Foreword The Digital Audio Analysis System DAAS 4usb was developed and produced by Ulteé Audiotechnik, Germany. The legal owner is allowed
Warning: Power amplifier contain high voltages of several hundred volts. Setup errors can easily damage your health or your equipment.
 Tutorial: Power Measurements of a high Power Amplifier Warning: Power amplifier contain high voltages of several hundred volts. Setup errors can easily damage your health or your equipment. Purpose This
Quadra 15 Available in Black and White
 S P E C I F I C A T I O N S Quadra 15 Available in Black and White Frequency response, 1 meter onaxis, swept-sine in anechoic environment: 64 Hz to 18 khz (±3 db) Usable low frequency limit (-10 db point):
How To... Commission an Installed Sound Environment
 How To... Commission an Installed Sound Environment This document provides a practical guide on how to use NTi Audio instruments for commissioning and servicing Installed Sound environments and Evacuation
P a g e 1 ST985. TDR Cable Analyzer Instruction Manual. Analog Arts Inc.
 P a g e 1 ST985 TDR Cable Analyzer Instruction Manual Analog Arts Inc. www.analogarts.com P a g e 2 Contents Software Installation... 4 Specifications... 4 Handling Precautions... 4 Operation Instruction...
Test Bench: Wavecor TW030WA13/14 Neodymium Tweeters
 Test Bench: Wavecor TW030WA13/14 Neodymium Tweeters April 02, 2016by Vance Dickason The transducer, actually transducers, I examined in This Test Bench were the new Wavecor TW030WA13/14 (see Photo 1).
A R T A - A P P L I C A T I O N N O T E
 Introduction A R T A - A P P L I C A T I O N N O T E The AES-Recommendation 2-1984 (r2003) [01] defines the estimation of linear displacement of a loudspeaker as follows: Voice-coil peak displacement at
Lab 10 - INTRODUCTION TO AC FILTERS AND RESONANCE
 159 Name Date Partners Lab 10 - INTRODUCTION TO AC FILTERS AND RESONANCE OBJECTIVES To understand the design of capacitive and inductive filters To understand resonance in circuits driven by AC signals
What you Need: Exel Acoustic Set with XL2 Analyzer M4260 Measurement Microphone Minirator MR-PRO
 How To... Handheld Solution for Installed Sound This document provides a practical guide on how to use NTi Audio instruments for commissioning and servicing Installed Sound environments and Evacuation
Application Note 7. Digital Audio FIR Crossover. Highlights Importing Transducer Response Data FIR Window Functions FIR Approximation Methods
 Application Note 7 App Note Application Note 7 Highlights Importing Transducer Response Data FIR Window Functions FIR Approximation Methods n Design Objective 3-Way Active Crossover 200Hz/2kHz Crossover
Quadra 12 Available in Black and White
 S P E C I F I C A T I O N S Quadra 12 Available in Black and White Frequency response, 1 meter onaxis, swept-sine in anechoic environment: 76 Hz to 18 khz (±3 db) Usable low frequency limit (-10 db point):
ODEON APPLICATION NOTE ISO Open plan offices Part 2 Measurements
 ODEON APPLICATION NOTE ISO 3382-3 Open plan offices Part 2 Measurements JHR, May 2014 Scope This is a guide how to measure the room acoustical parameters specially developed for open plan offices according
Gentec-EO USA. T-RAD-USB Users Manual. T-Rad-USB Operating Instructions /15/2010 Page 1 of 24
 Gentec-EO USA T-RAD-USB Users Manual Gentec-EO USA 5825 Jean Road Center Lake Oswego, Oregon, 97035 503-697-1870 voice 503-697-0633 fax 121-201795 11/15/2010 Page 1 of 24 System Overview Welcome to the
Electro-Voice S40. Full Range Compact Speaker System 160 Watts Power Handling Available is Black or White
 Electro-Voice S40 Full Range Compact Speaker System 160 Watts Power Handling Available is Black or White NOTE: This data sheet refers to several graphs. In order to keep the size of this document reasonable
TBM - Tone Burst Measurement (CEA 2010)
") TBM - Tone Burst Measurement (CEA 21) Software of the R&D and QC SYSTEM ( Document Revision 1.7) FEATURES CEA21 compliant measurement Variable burst cycles Flexible filtering for peak measurement Monitor
TBM - Tone Burst Measurement (CEA 21) Software of the R&D and QC SYSTEM ( Document Revision 1.7) FEATURES CEA21 compliant measurement Variable burst cycles Flexible filtering for peak measurement Monitor
Fast Quality Control of Suspension Parts AN 53
 Application Note for the KLIPPEL QC SYSTEM The performance and quality of loudspeaker drivers and complete audio systems is mainly determined by the quality of the single components. To ensure a consistent
DiGi++ Noise Meter. Main functions
 Main functions DiGi++ Noise Meter This application brings the functionalities of a Sound Level Meter (SLM) and of a Spectrum Analizer (RTA) to your phone: mobile hardware introduce some limitations (lower
FINEMotor. Magnet System & Voice Coil Design Program T U T O R I A L
 FINEMotor Magnet System & Voice Coil Design Program T U T O R I A L 1 The FINEMotor program is ideal for simulating and designing the magnet system and voice coil for any kind of loudspeaker driver. This
Audio System Evaluation with Music Signals
 Audio System Evaluation with Music Signals Stefan Irrgang, Wolfgang Klippel GmbH Audio System Evaluation with Music Signals, 1 Motivation Field rejects are $$$ Reproduce + analyse the problem before repair
BIG 3 WAY SPEAKER: INTEGRATION OF BASS AND MIDRANGER DRIVERS. 3D Acoustics Research, January
 BIG 3 WAY SPEAKER: INTEGRATION OF BASS AND MIDRANGER DRIVERS 1. Introduction 3D Acoustics Research, January 2010 www.3dar.ru In this article we show how 3D Response simulator can be used in low mid frequency
WinMLS I very much like the convenience of the tool and how quickly measurements can be made - Christopher Pye, Integral Acoustics, Canada
 WinMLS 2004 What is WinMLS? WinMLS is a sound card based software for high quality audio, acoustics and vibrational measurements using your PC/laptop. The fact that it is sound card based, makes it possible
Introduction to Simulink
 EE 460 Introduction to Communication Systems MATLAB Tutorial #3 Introduction to Simulink This tutorial provides an overview of Simulink. It also describes the use of the FFT Scope and the filter design
Investigating Electromagnetic and Acoustic Properties of Loudspeakers Using Phase Sensitive Equipment
 Investigating Electromagnetic and Acoustic Properties of Loudspeakers Using Phase Sensitive Equipment Katherine Butler Department of Physics, DePaul University ABSTRACT The goal of this project was to
REW V5.18 Help. Copyright John Mulcahy All Rights Reserved
 Copyright 2004-2016 John Mulcahy All Rights Reserved REW Help Contents REW Help Contents 1. Welcome 2. Getting Started 3. Signals and Measurements 4. REW Overview 5. Calibrating the Soundcard 6. Checking
Experiment: P34 Resonance Modes 1 Resonance Modes of a Stretched String (Power Amplifier, Voltage Sensor)
") PASCO scientific Vol. 2 Physics Lab Manual: P34-1 Experiment: P34 Resonance Modes 1 Resonance Modes of a Stretched String (Power Amplifier, Voltage Sensor) Concept Time SW Interface Macintosh file Windows
PASCO scientific Vol. 2 Physics Lab Manual: P34-1 Experiment: P34 Resonance Modes 1 Resonance Modes of a Stretched String (Power Amplifier, Voltage Sensor) Concept Time SW Interface Macintosh file Windows
The Naim Balanced Mode Radiator The Naim Ovator Bass Driver
 1 The Naim Balanced Mode Radiator The Naim Ovator Bass Driver Lampos Ferekidis & Karl-Heinz Fink Fink Audio Consulting on behalf of Naim Audio Southampton Road, Salisbury SP1 2LN, ENGLAND The Balanced
RLC Software User s Manual
 RLC Software User s Manual Venable Instruments 4201 S. Congress, Suite 201 Austin, TX 78745 512-837-2888 www.venable.biz Introduction The RLC software allows you to measure the frequency response of RLC
New transducer technology A.R.T. = Accelerated Ribbon Technology - evolution of the air motion transformer principle
 106. AES Convention Munich 1999 Klaus Heinz Berlin New transducer technology A.R.T. = Accelerated Ribbon Technology - evolution of the air motion transformer principle Abstract The paper describes new
8A. ANALYSIS OF COMPLEX SOUNDS. Amplitude, loudness, and decibels
 8A. ANALYSIS OF COMPLEX SOUNDS Amplitude, loudness, and decibels Last week we found that we could synthesize complex sounds with a particular frequency, f, by adding together sine waves from the harmonic
3-Way Active Crossover Model XOVER-3. Xkitz.com. User s Manual. Features. Rev 2.1
 3-Way Active Crossover Model XOVER-3 User s Manual Rev 2.1 Xkitz.com Features 3-way Active Crossover for driving separate subwoofer, midrange and tweeter amplifiers Linkwitz-Riley crossover, 4 th order,
Laboratory Experiment #1 Introduction to Spectral Analysis
 J.B.Francis College of Engineering Mechanical Engineering Department 22-403 Laboratory Experiment #1 Introduction to Spectral Analysis Introduction The quantification of electrical energy can be accomplished
Sunlight Electronics Laboratory
 MODEL 7116C OPERATION MANUAL Mar. 26, 2008 Sunlight Electronics Laboratory 490, Sec. 2, Chung Shan Rd., Chung Ho, Taipei, Taiwan 23557 Tel :+886 2 2222 3759 Fax : +886 2 2223 0727 http://www.sunlilab.com.tw
SPECS. Impulse (4 and 8 ohm) Two-Way Weather-Resistant Injection-Molded Speaker System SPECIFICATIONS. Built under U.S.
 Two-Way Weather-Resistant Injection-Molded Speaker System SPECIFICATIONS. Built under U.S.") SPECS P E A V E Y E L E C T R O N I C S Impulse 1012 (4 and 8 ohm) Two-Way Weather-Resistant Injection-Molded Speaker System Built under U.S. Patent 6,064,745 SPECIFICATIONS Enclosure: Peavey Impulse 1012
SPECS P E A V E Y E L E C T R O N I C S Impulse 1012 (4 and 8 ohm) Two-Way Weather-Resistant Injection-Molded Speaker System Built under U.S. Patent 6,064,745 SPECIFICATIONS Enclosure: Peavey Impulse 1012
Measuring Center 2.6 User Manual Software for sound signal analysis
 2016 Measuring Center 2.6 User Manual Software for sound signal analysis Spl-Lab Ver. 2.6.6 Table of Contents Table of Contents... 2 General Information... 4 Starting Operation... 4 Program Interface...
3D Distortion Measurement (DIS)
") 3D Distortion Measurement (DIS) Module of the R&D SYSTEM S4 FEATURES Voltage and frequency sweep Steady-state measurement Single-tone or two-tone excitation signal DC-component, magnitude and phase of
3D Distortion Measurement (DIS) Module of the R&D SYSTEM S4 FEATURES Voltage and frequency sweep Steady-state measurement Single-tone or two-tone excitation signal DC-component, magnitude and phase of
IX Feb Operation Guide. Sequence Creation and Control Software SD011-PCR-LE. Wavy for PCR-LE. Ver. 5.5x
 IX000693 Feb. 015 Operation Guide Sequence Creation and Control Software SD011-PCR-LE Wavy for PCR-LE Ver. 5.5x About This Guide This PDF version of the operation guide is provided so that you can print
Meta-Hearing Defect Detection
 Meta-Hearing Defect Detection S20 Specification to the KLIPPEL ANALYZER SYSTEM (QC6.1, db-lab 210) Document Revision 2.0 FEATURES Extension of regular Rub&Buzz detection method for highest sensitivity
The Mimir. Enclosure and stuffing. Drive units
 The Mimir Named after Mimir, a primal god of Norse mythology who was renowned for his knowledge and wisdom, we present a new high-end two-way speaker kit. The Mimir consist of an 18 cm long throw woofer
The Woofer Tester 2. Precision Thiele-Small & RLC Measurement Simulation and Box Analysis. Web: Phone:
 Precision Thiele-Small & RLC Measurement Simulation and Box Analysis 1 Features Precision Thiele Small Measurement System using Constant Current Source Advanced Thiele Small Simulator with Frequency Dependent
Application Note 4. Analog Audio Passive Crossover
 Application Note 4 App Note Application Note 4 Highlights Importing Transducer Response Data Importing Transducer Impedance Data Conjugate Impedance Compensation Circuit Optimization n Design Objective
DC and AC Circuits. Objective. Theory. 1. Direct Current (DC) R-C Circuit
 R-C Circuit") [International Campus Lab] Objective Determine the behavior of resistors, capacitors, and inductors in DC and AC circuits. Theory ----------------------------- Reference -------------------------- Young
[International Campus Lab] Objective Determine the behavior of resistors, capacitors, and inductors in DC and AC circuits. Theory ----------------------------- Reference -------------------------- Young
PRELIMINARY. group S. M i cro W e dge M W 15 Speci f i cations. 2-Way full-range stage monitor See NOTES TABULAR DATA for details FEATURES DESCRIPTION
 FEATURES Highly coherent coaxial design (15 inch LF) Enhanced fidelity and power handling Upgraded transducers and crossover design Switchable single-amp/bi-amp modes Convenient input connector location
Resonance Tube. 1 Purpose. 2 Theory. 2.1 Air As A Spring. 2.2 Traveling Sound Waves in Air
 Resonance Tube Equipment Capstone, complete resonance tube (tube, piston assembly, speaker stand, piston stand, mike with adaptors, channel), voltage sensor, 1.5 m leads (2), (room) thermometer, flat rubber
Features: Description
 Features: Peavey Exclusive Lo Max 18" Subwoofer Extended frequency response down to 33 Hz (half-space) 2400 watts of program power rating Full power low frequency response down to 38 Hz! Neutrik Speakon
PRELIMINARY. group S. MicroWedge MW12 Specifications 2-WAY FULL-RANGE STAGE MONITOR FEATURES DESCRIPTION. CONFIGURATION Subsystem
 FEATURES Highly coherent coaxial design (12-inch LF) Enhanced fidelity and power handling Upgraded transducers and crossover design Switchable single-amp/bi-amp modes Convenient input connector location
PSM Soft. Features and Functions January PC Software Guide. Getting connected and Communication
 PSM Soft PC Software Guide Features and Functions January 2010 The PSM series Phase Sensitive Multimeters provide a wide range of exceptionally accurate and versatile instrumentation in one unique package.
Introduction to Equalization
 Introduction to Equalization Tools Needed: Real Time Analyzer, Pink noise audio source The first thing we need to understand is that everything we hear whether it is musical instruments, a person s voice
Quick Start Guide for the PULSE PROFILING APPLICATION
 Quick Start Guide for the PULSE PROFILING APPLICATION MODEL LB480A Revision: Preliminary 02/05/09 1 1. Introduction This document provides information to install and quickly start using your PowerSensor+.
Loudspeaker Distortion Measurement and Perception Part 2: Irregular distortion caused by defects
 Loudspeaker Distortion Measurement and Perception Part 2: Irregular distortion caused by defects Wolfgang Klippel, Klippel GmbH, wklippel@klippel.de Robert Werner, Klippel GmbH, r.werner@klippel.de ABSTRACT
Since the advent of the sine wave oscillator
 Advanced Distortion Analysis Methods Discover modern test equipment that has the memory and post-processing capability to analyze complex signals and ascertain real-world performance. By Dan Foley European
Model Owner s Manual. Active 3-Way Studio Monitor System.
 Model 4288 Active 3-Way Studio Monitor System Owner s Manual www.chrispelonisspeakers.com Model 4288 The Model 4288 is a 3-way active monitoring system for a Full range listening experience. Similarly
(c) Bill Waslo
 Bill Waslo") OmniMic software version 5 (c) 2010-2017 Bill Waslo Contents OmniMic software version 5... 1 USING OMNIMIC... 3 OmniMic Adjustments... 5 Frequency Response... 8 Frequency Response - Advanced Functions...
OmniMic software version 5 (c) 2010-2017 Bill Waslo Contents OmniMic software version 5... 1 USING OMNIMIC... 3 OmniMic Adjustments... 5 Frequency Response... 8 Frequency Response - Advanced Functions...
The NEO8 and NEO8 PDR high performance wideband, planar-magnetic transducers
 The NEO8 and NEO8 PDR high performance wideband, planar-magnetic transducers The NEO8 and Neo8 PDR are planar-magnetic (ribbon) transducers that use an innovative hightech diaphragm material called Kaladex
2-Way Active Crossover Model XOVER-2. Xkitz.com. User s Manual. Features. Rev 5.0
 2-Way Active Crossover Model XOVER-2 User s Manual Rev 5.0 Xkitz.com Features 2-way Active Crossover for driving separate woofer and tweeter amplifiers Linkwitz-Riley crossover, 4 th order, 24dB/Octave
Sampling and Reconstruction
 Experiment 10 Sampling and Reconstruction In this experiment we shall learn how an analog signal can be sampled in the time domain and then how the same samples can be used to reconstruct the original
LAB 8: Activity P52: LRC Circuit
 LAB 8: Activity P52: LRC Circuit Equipment: Voltage Sensor 1 Multimeter 1 Patch Cords 2 AC/DC Electronics Lab (100 μf capacitor; 10 Ω resistor; Inductor Coil; Iron core; 5 inch wire lead) The purpose of
DELTA-15LF-4. American Standard series. SPL vs Freq. Specification. Materials of Construction
 American Standard series DELTA-15LF-4 Low frequency woofer for pro audio as a midbass or floor monitor in a sealed enclosure. Also suitable as a woofer in vented, bass guitar or PA enclosures. Midrange
Polar Measurements of Harmonic and Multitone Distortion of Direct Radiating and Horn Loaded Transducers
 Audio Engineering Society Convention Paper 8915 Presented at the 134th Convention 2013 May 4 7 Rome, Italy This paper was accepted as abstract/precis manuscript for presentation at this Convention. Additional