Sample size, sample weights in household surveys
|
|
|
- Garry Atkinson
- 5 years ago
- Views:
Transcription
1 Sample size, sample weights in household surveys
2 Outline Background Total quality in surveys Sampling Controversy Sample size, stratification and clustering effects


3 An overview of the quality dimensions in household surveys The integration of sampling design, questionnaires and tools, field work and data management Sampling Data Tools Field work with the goal of delivering analysts a reliable database on time management Data loses their value if they don t represent the reality of the day The end product 3
4 Background Did you know that cooks are excellent at sampling? When they add salt to a stew or a soup which they have just finished cooking, they mix it in, they take a spoonful, they taste it and decide whether there is enough salt or some more should be added. They do not have to eat all the soup they have prepared. They only taste a sample. Researchers and analysts are confronted with similar challenges 30/10/2017 4
5 Background cont d Because the number of individuals, households, programmes, etc. that must be studied is large, it would be impossible or very expensive to study all of them. Hence, we study a relatively small sample, with the intention of inferring from the sample the situation of the entire population. But, how confident can we be that the results observed in the sample properly represent the population? Should it depend on how numerous the population is (the so called population size,) or on the number of items selected (the sample size,) and how diverse these items are in regards to what we wish to know? 30/10/2017 5
6 Background cont d In order to describe these concepts we use sampling theory (Formulae that frighten the lay and have acquired the reputation of being something that only experts can understand notwithstanding). 30/10/2017 6
7 The Sampling controversy Shere Hite s book Women and Love: A Cultural Revolution in Progress (1987) produced the following findings: 84% of the women are not satisfied emotionally in their relationships (Page 804) 95% of women report forms of emotional and psychological harassment from men with whom they are in love relationships (page 810) 30/10/2017 7
8 III. The Sampling Controversy cont d The book was widely criticised in the US and some referred to the conclusions as dubious and doubtful But what was the problem with the findings: The research allowed women to discuss their experience to a great length in a way a multiple question questionnaire could not He went ahead and generalised the results to all women and yet the sample was self selected (interviewed those willing to participate) 30/10/2017 8
9 III. The Sampling Controversy cont d Questionnaires were sent to professional women organisations, groups etc whose views may differ from the rest who are non members Some questions were leading questions while other were vague ( according to Sharon Lohr) The questionnaire was so large that only those willing to fill it responded (120 pages) The response rate was extremely low(4.5% returned out of 100,000 questionnaires mailed) 30/10/2017 9
10 III. The Sampling Controversy cont d Does research that is not based on probability or random sample give one the right to generalise from the results of the study to the entire population? Answer : It depends on how large the sample is Questionnaires were sent to professional women organisations, groups etc whose views may differ from the rest who are non members Some questions were leading questions while other were vague This example is documented in the book Sampling Design and Analysis by Sharon L. Lohr 30/10/
11 Stratification considerations
12 Stratification considerations Geographic domains Districts, Urban/rural review definition, understand changes between censuses Examples of other domains used in labour force surveys
13 Two-stage sampling Instead of taking a SRS We divide the territory into small areas, called Primary Sampling Units (PSUs). In the first stage, we choose PSUs. In the second stage, we select households in the chosen PSUs 13
14 Other Stratification considerations Number of households/population Employment groups 1-4, 5-9, etc Gross output Less than 1m, etc Type of Health facility Health facility- hospitals, Health centre III, etc Ownership (private/ Public)
15 Stratification (continued) Important to distinguish geographic domains and sampling strata Domain requires minimum sample size to provide required level of precision Sampling strata only require at least two PSUs per stratum Possible to divide geographic domains into smaller more homogeneous sampling strata (for example, province, urban/rural)
16 Implicit stratification Implicit stratification - order the sampling frame of PSUs geographically in a serpentine manner (rural urban within district, ascending order then descending order etc) Ordering of PSUs in large city can be based on socioeconomic classification as well as geography Selection of PSUs systematically with PPS provides implicit stratification Implicit stratification ensures effective representation and proportional allocation to lower levels of geography Problem some geographic codes are assigned alphabetically, not geographically
17 Allocation of sample to strata Proportional allocation Effective for precision of estimates at the national level Equal allocation to each domain Used when each domain requires same level of precision Optimum allocation takes into account differential variance and costs by stratum For example, variability may be higher in urban areas and enumeration costs may be higher in rural areas in this case, higher sampling rate for urban areas
18 Subnational Estimates Sample size depends on number of different geographic domains for which separate, equally reliable estimates are required As a compromise, larger sampling errors accepted for subnational estimates One proposal (by Dr. Vijay Verma) increase national sample size by factor of D 0.65, where D is the number of domains Results in an average increase in the sampling errors for domain estimates by a factor of about 1.5 Minimum number of PSUs required for each domain for example, 30 clusters Allocation of sample to domains Equal allocation Modified proportional allocation, with a minimum and maximum number of sample PSUs per domain
19 Stratification for special sub populations In some cases, it may be important to measure indicators for minority subpopulations Special strata identified for areas with concentration of minorities Higher sampling rates used for strata with concentration of minorities Example Examples of minorities in Suriname?
20 Small area estimation Innovative methods linking Census to survey data are being applied to generate estimates using small area estimation techniques for smaller administrative units Depends on availability of recent census together with survey results Different regression, and estimation models available Important to validate the results
21 SAMPLE SIZE DETERMINATION AND COMPLETION RATES Sample Size Completion rates
22 Major steps in designing a sample Define objectives Key indicators Desired level of precision Sub-national domains of estimation Identify most appropriate sampling frame Most recent census of population and housing Sample for another survey conducted recently Determine sample size and allocation Determine availability of previous results to provide measures of sampling parameters
23 Selection of key indicators for sample size determination Choose an important indicator that will yield the largest sample size Step 1: Select 2 or 3 target populations representing each a small percentage of the total population (pb); typically
24 Selection cont d Step 2: Review important indicators for these target groups but ignore indicators with very low or very high prevalence (less 10% or over 40%, respectively) Do not choose from the desirably low coverage indicators an indicator that is already acceptably low
25 Sample size Requirements Margin of error/ precision requirements A relative error, also known as coefficient of variation (cv) of 10 to 20 percent is, in fact, commonly specified as the precision needed for the key estimates of a survey Statistically, the coefficient of variation is equal to the standard error of the survey estimate divided by the estimate. For example, if you want to estimate each of its important items at the 95-percent level of confidence with, say, a relative error of 10 percent; for a 20-percent item this would translate into a standard error of 2 percentage points, while for a 40-percent item it would be 4 percentage points, and so forth Reliability of the estimates for domains Survey Budget and constraints
26 Sample size n is the sample size we wish to calculate, p is the anticipated proportion of facilities with the attribute of interest, q is equal to 1- p f is the so-called design effect (shortened from deff), is the relative variance, (square of the relative error), and 3.84 is the square of the normal deviate (1.96) needed to provide an estimate at the 95 percent level of confident
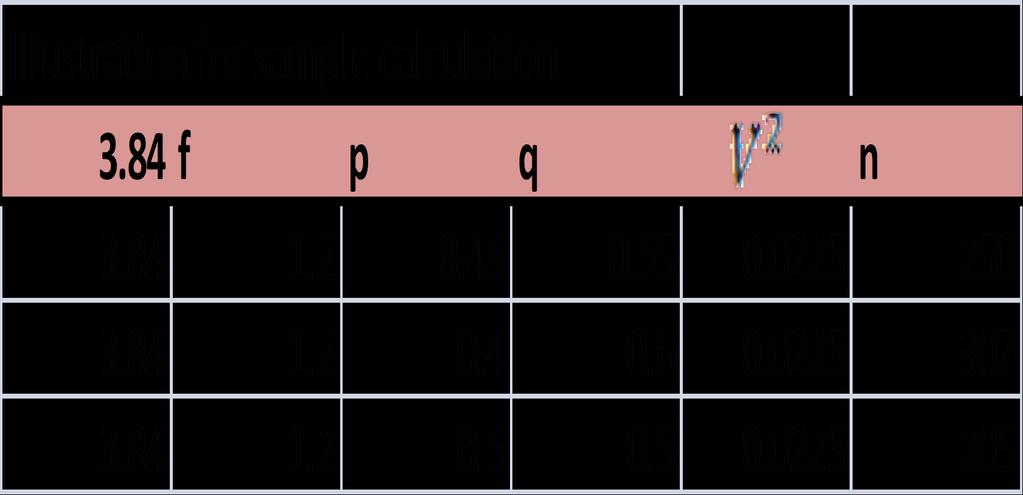
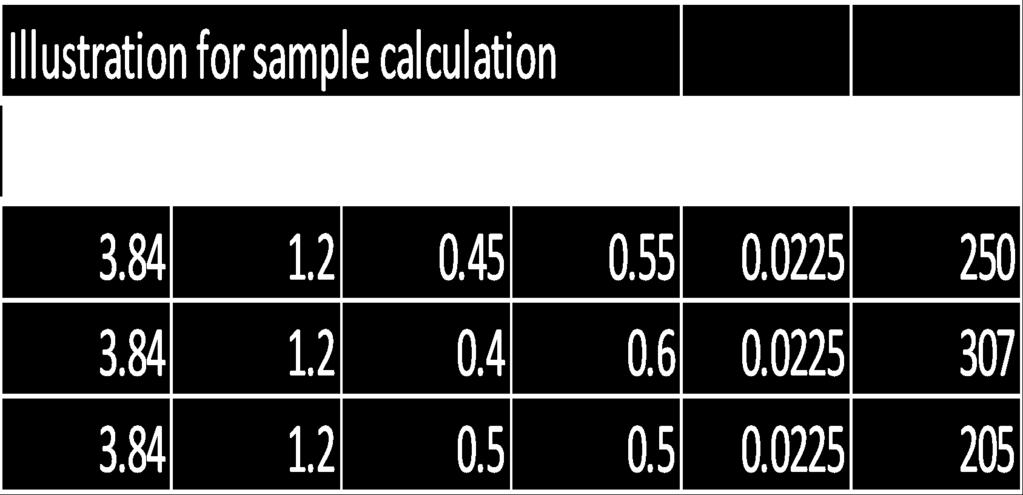
27 sample calculation
28 Determining sample size Important to examine tables of sampling errors and design effects from final report for previous surveys (e.g Labourforce surveys, MICS, or DHS) In addition to using previous estimates for the indicators and design effects, possible to conduct simulation of sampling errors based on alternative sampling proposals, using results from previous survey Example - Uzbekistan
29 Two-stage sampling Solves the problems of SRS Reduces transportation costs Reduces sample frame problems The sample can be made self-weighting if We choose PSUs with Probability Proportional to Size (PPS), and then We take a fixed number of households in each PSU The price to pay is cluster effect 29
30 Number of sample PSUs and cluster size Important to balance statistical efficiency and cost considerations Review DEFF for key indicators from previous survey reports to determine whether number of sample households per cluster should be changed Some household characteristics like safe water and improved sanitation have high intra class correlation, and thus high DEFFs, but these are less important
31 Completion rate The actual effective sample size depends on the completion rate, which is generally close to the response rate The difference between the completion rate and the response rate depends on the number of selected households that are out-ofscope, such as selected vacant housing units
32 Completion rate (continued) When a census list or older listing is used for selecting sample households, there will be more out-of-scope households selected, and the completion rate will be lower than the response rate In this case the expected completion rate should be used instead of the response rate in the template for calculating the sample size
33 CLUSTERING EFFECTS AND STAGES OF SAMPLE SELECTION
34 Cluster effect Standard error grows if, instead of taking a Simple Random Sample of n households, we take a two-stage sample, with k PSUs and m households per PSU (n=k m) Intra-Cluster Correlation e 2 TSS e 2 SRS 1 m 1 Cluster effect Two-Stage Sample Simple Random Sample
35 Cluster Effect For a total sample size of 12,000 households Number of PSUs HHs per PSU Intra-Cluster Correlation , , , ,
36 Design effect In a two-stage sample Cluster effect = e 2 TSS / e 2 SRS In a more complex design (with two or more stages, stratification, etc.) Design effect = Deff = e 2 Complex design / e 2 SRS Can be interpreted as an apparent contraction of the sample size, as a result of clustering and stratification Can be estimated with special software (e.g., Stata s svy commands) 36
37 Optimum cluster size Socioeconomic surveys optimum cluster size in the range of 8 to 15 households Perhaps more research can be done on design effects and optimum cluster size, but general range of households for income/ expenditure surveys appear to be effective Discussion of experiences from the labour sampling experts Any other experiences?
38 Levels of clustering For three-stage design, with multiple clusters selected at second stage two levels of clustering; reduces dispersion of sample, increases design effects When one cluster is selected in each PSU, treated as two-stage design, where the PSUs are considered intermediary stage for selecting clusters
39 First stage selection of PSUs Standard methodology for DHS and other household surveys select Enumeration Area Blocks or clusters systematically with PPS Advantage a constant number of sample households selected at second stage provides approximately self-weighting sample within stratum Provides implicit stratification
40 Sampling procedures for selecting PSUs with PPS Important to sort frame before selection, in order to ensure effective implicit stratification Traditional procedure cumulate measures of size, determine sampling interval and random start, generate selection numbers Labourforce, MICS template cumulate probabilities, formulas for identifying sample based on random start SPSS Complex Samples option for selecting stratified sample systematically with PPS Will not work if any PSU is larger than the sampling interval
41 Large sample PSUs in PPS sampling Sometimes a PSU may have a measure of size larger than the sampling interval PSU may be selected more than once in the systematic PPS selection Option 1 if the PSU is selected two or more times, multiply the number of households to be selected by the number of hits Option 2 separate the large PSUs and include in sample with a probability of 1
42 SECOND STAGE SELECTION OF SAMPLE HOUSEHOLDS
43 Household Listing Objectives: Provide an updated list of all dwellings and households in each selected PSU to be used as sampling frame for second stage selection Adjust for differences in PSU sizes during weighting: size used for PPS selection in the first stage differs from the observed size from the listing operation due to imperfections in the frame or demographic mobility
44 Household samples Choosing the households The best sample frame is the full list of all households in the selected PSUs The household listing operation requires time and money. Relative to the project s overall calendar and budget, these are Marginal, if they are accounted for beforehand Large enough to be a big headache, if they are not Information to be reported on the listing Name and address, as a minimum Additional data required for the selection (e.g., presence of pregnant women, or children any examples???) Households are generally selected from the listing by systematic equal probability sampling Beware of imitations, such as random walks snowballing expert opinion Do not ask additional information that is not essential 44
45 Household Listing cont d Create the list of dwellings and households for the survey or borrow an existing list from a census or another survey Borrowing existing lists from a census or another survey: Need to critically examine lists to ensure they are recent, complete and good maps are available Information on the lists should allow the selected households to be located easily
46 Household Listing cont d Borrowing existing lists from a census or another survey: Lists that are more than 1 or 2 years old by the time of actual fieldwork can be outdated due to demographic mobility Household listing operation: a separate field operation before the survey starts or combined with household selection and interviewing into one single operation
47 Household Listing cont d Household listing as a separate field operation: More reliable as listing staff are less likely than interviewers to bias the sample by excluding households that are difficult to reach Allows household selection to be done in a single central location using reliable and uniform procedures More expensive but costs can be reduced by using segmentation A separate household listing operation is usually recommended
48 Household Listing
49 Listing of households Common problems found in listing operations Problem with quality of sketch maps difficult to determine segment boundaries Sometimes large differences found between number of households in frame (census) and number listed
50 Listing of households cont d Importance of new listing to represent current population Problems with using previous listing (older than 1 year) Does not represent newer households Distribution of sample population by age group distorted, generally with higher median age Difficulty of finding households in old list
51 Selection of sample households from listing Selection of households in the office following listing operation Advantages conducted by specialized staff, possible to avoid selection bias Disadvantage increased costs from having two field visits Selection of households in field Advantage cost savings of having one integrated field operation Disadvantage - correct sampling may be difficult for field staff, selection may be biased
52 Household selection table One option for selection of households in field - household selection table When households selected in the field, it is best to avoid the use of random number tables and manual calculations, which can lead to mistakes and selection bias Excel spreadsheet used for generating systematic selection of fixed number of households based on number of households listed
53 Household selection table (continued) Providing household selection numbers to field staff provides more control Makes it difficult to cheat in selection of households, since selected households are not determined until the listing is completed and the total number of households is known Possible to verify later whether interviewer selected the correct households
54 Standard errors Effect of population size Effect of sample size Sampling error vs non sampling error
55 Effect of the population size e = 1 n N P(1 P) n Finite population correction In practice this is almost always so close to 1 that we can safely ignore it 55
56 Effect of the population size Sample size needed to achieve a given precision In practice, the size of the population has very little influence on the sample size needed to achieve a given precision Size of the population 56
57 Effect of the sample size Standard error To halve the standard error sample size needs to be quadrupled Sample size 57
58 Sampling error vs non sampling error Sampling error Total error Non sampling error Sample size 58
59 Power calculations
60 Power calculations permit making recommendations about the sample size needed for an impact evaluation In the previous sessions, the key variable to recommend a sample size was the standard error, because the analytical technique was a point estimation with a confidence interval In this session, the key variable is power (i.e. the probability of not getting a false negative), because the analytical technique is a statistical test Both techniques are needed for an impact evaluation The key ingredient of a good power calculation is the standard error 60
61 Fundamentals of power calculations Power calculations permit making recommendations about the sample size needed for an impact evaluation In the previous sessions, the key variable to recommend a sample size was the standard error, because the analytical technique was a point estimation with a confidence interval In this session, the key variable is power (i.e. the probability of not getting a false negative), because the analytical technique is a statistical test Both techniques are needed for an impact evaluation The key ingredient of a good power calculation is the standard error 61
62 Fundamental formula of power calculations MDE = (t 1 α/2 + t 1 β )e MDE:Minimum detectable effect α/2:rate of Type I errors (false positives) (typically α/2 = 2.5%) β: e: Rate of Type II errors (false negatives) (typically β = 10-20% Power = 90 80%) Standard error of the estimated effect 62
63 Solve for n the equation: 63
64 Table of normal deviates t Probability Valor t 1 tail 2 tails 1-γ t1-γ t1-γ/2 80% % % % % Value of t for a 95% confidence level MDE = 1,96 + t 1 β 2σ 2 n 64
65 Problem 1 What do you think of this sampling design? 65
66 Answer 1 Problems with the sampling design of this impact evaluation: 1. It is using SRS for a household survey, which can be costly. 2. The population of reference are only the young who enrolled in June
67 Problem 2 Evaluate the power of this sampling design 1. Reference power: 1-β=90%. 2. Calculate the MDE: MDE = t 1 α/2 + t 1 β 2σ 2 n 67
68 Answer 2 Table of normal deviates t Probability Valor t 1 tail 2 tails 1-γ t1-γ t1-γ/2 80% % % % % Value of t for a 95% confidence level MDE = 1,96 + t 1 β 2σ 2 n 68
69 Answer 2 Table of normal deviates t Probability Valor t 1 tail 2 tails 1-γ t1-γ t1-γ/2 80% % % % % Value of t for a power of 90% MDE = σ 2 n 69
70 Answer 2 The variance of the drop out rate p is equal to p(1- p). It is maximum for p=0.5 MDE = (1 0.5) n 70
71 Answer 2 The sample size is 250. MDE = (1 0.5)
72 Answer 2 The Minimum Detectable Effect is 14.5 percent points in the drop_out rate MDE = (1 0.5) 250 =
73 Sample Weights computation Base weight calculations: Selection probabilities p1 and p2, where p1 = selection probability for PSUs, p2 = selection probability for households within PSU. These selection probabilities are available in an Excel format. The selection probability for the individual within each household p3 is given by 1/the number of eligible persons in the household (hh2). The number of eligible people in the household is obtained from the survey response data. The overall base weight (wb) is calculated as:
74 Base weight (wb) wb = 1 p1 p2 p3 In addition, the base weight at the psu level (wb_psu) and at the household level (wb_hh) are calculated as: wb psu = 1 p1, wb_hh = 1 p1 p2
75 Nonresponse adjustment: The non-response adjustment will be done at three levels: PSU level, household level and respondent level. The PSU level non-response adjustment is calculated by partitioning the 1079 PSUs into weighting classes defined by Region and residence, giving 37 * 2 = 74 adjustment cells. The PSU level non-response adjustment is: psu_nr = wb_psu eligible PSUs wb_psu non missing PSUs
76 Nonresponse adjustment: cnt d The PSU non-response adjusted weight wr_psu is the product of the base weight wb and the PSU-level non-response adjustment. hhid wb_psu eligible wb_psu nonmissing psu_nr wr_psu
77 Nonresponse adjustment: cont d The household non-response adjustment is calculated by PSU, so there are 1079 adjustment cells one for each PSU. The household level non-response adjustment is calculated as: wb_hh eligible households hh_nr = wb_hh completed rosters
78 Nonresponse adjustment: cont d The household non-response adjusted weight wr_hh is the product of the PSU non-response adjusted weight wr_psu and the household non-response adjustment hh_nr. Due to large values of hh_nr for 182 cases, the household nonresponse adjustment was trimmed at hh_nr = 3. hhid wb_hheligible wb_hhcompleted hh_nr wr_hh
79 Nonresponse adjustment: cont d The person non-response adjustment is calculated by residence (urban/rural), gender, smoking status and age taken from the household roster. Therefore, there are 2*2*2*4=32 adjustment cells for the person non-response adjustment. The person-level nonresponse adjustment is: pp_nr = wb eligible households wb completed interviews
80 Nonresponse adjustment: cont d The final non-response adjusted weight is the product of the household non-response adjusted weight (wr_hh_pp) and the person non-response adjustment (pp_nr). hhid wb_eligible wb_completed pp_nr wr_hh_pp
81 Post-stratification adjustment. The post-stratification adjustment is calculated as: r = pop wb_hh_pp
82 Weighting The final weight (wf) is the product of the non-response adjusted weight (wr_hh_pp) and the post-stratification adjustment (r). hhid State Gender Agegroup pop wr_hh_pp r wf
83 Data Cleaning, editing
84 Data cleaning Data collection generates errors due to design of questionnaire as well as errors attributable to respondents and interviewers At Design level, efforts to minimize design errors is ensured. However, the flow of the questions may demand a more consistent system of editing Stages requiring data cleaning: During data collection During field supervision visits Consistency checks and range checks during data entry/processing Comparison with known demographics (sex ratio, cut-offs for nutrition data,
85 Data cleaning Treatment of screening questions for labourforce questions Treatment of extreme values Compare with data from other sources Review existing literature/ previous reports on similar or related subjects Conduct some re-interviews All these are possible BUT: Requires staff who know the subject very well Staff who are capable of detecting errors that may go beyond the machine edits Need a small and knowledgeable team to edit and clean the data
86 Data cleaning, CAPI all possible range checks should be built into the application at the time of its development However, allow the application flexibility to continue to run even when an inconsistency is detected during an interview (this could be flagged for follow up after the interview) Plan for a small team of editors to validate the information as it comes in from the field. These could also perform a double role as editors/coders Develop do files or Cspro syntax to check population distribution, sex composition, sample distribution on a sample of data at regular intervals (every week or month,)
87 Coverage and content errors in Household surveys Coverage errors in Household surveys: Ideally, a random sample is targeted but variation from the norm arises due to imperfect sampling frames Sometimes, the sampling units are not identical to the unit of observations being studied Non coverage error: failure to include some units of observation in the frame Duplication of variables hence assigning more weight than is desired The main source of coverage error is the sampling frame (obsolete information which is not updated, and inappropriate Enumeration Area blocks etc) Ensure there is no overlap, no duplication, and assign unique identification in the frame,
88 Coverage and content errors in Household surveys cont d Content errors in Household surveys: Completion rates Vs response rates Item non response rates Vs unit non response rates Refusals and failure to contact respondents partly responsible Respondents fatigue /burden increases content error Interviewer characteristics (training, level of education etc)
89 END THANK YOU
Sierra Leone - Multiple Indicator Cluster Survey 2017
 Microdata Library Sierra Leone - Multiple Indicator Cluster Survey 2017 Statistics Sierra Leone, United Nations Children s Fund Report generated on: September 27, 2018 Visit our data catalog at: http://microdata.worldbank.org
Session V: Sampling. Juan Muñoz Module 1: Multi-Topic Household Surveys March 7, 2012
 Session V: Sampling Juan Muñoz Module 1: Multi-Topic Household Surveys March 7, 2012 Households should be selected through a documented process that gives each household in the population of interest a
Turkmenistan - Multiple Indicator Cluster Survey
 Microdata Library Turkmenistan - Multiple Indicator Cluster Survey 2015-2016 United Nations Children s Fund, State Committee of Statistics of Turkmenistan Report generated on: February 22, 2017 Visit our
Section 2: Preparing the Sample Overview
 Overview Introduction This section covers the principles, methods, and tasks needed to prepare, design, and select the sample for your STEPS survey. Intended audience This section is primarily designed
Guyana - Multiple Indicator Cluster Survey 2014
 Microdata Library Guyana - Multiple Indicator Cluster Survey 2014 United Nations Children s Fund, Guyana Bureau of Statistics, Guyana Ministry of Public Health Report generated on: December 1, 2016 Visit
Nigeria - Multiple Indicator Cluster Survey
 Microdata Library Nigeria - Multiple Indicator Cluster Survey 2016-2017 National Bureau of Statistics of Nigeria, United Nations Children s Fund Report generated on: May 1, 2018 Visit our data catalog
SURVEY ON USE OF INFORMATION AND COMMUNICATION TECHNOLOGY (ICT)
") 1. Contact SURVEY ON USE OF INFORMATION AND COMMUNICATION TECHNOLOGY (ICT) 1.1. Contact organization: Kosovo Agency of Statistics KAS 1.2. Contact organization unit: Social Department Living Standard Sector
1. Contact SURVEY ON USE OF INFORMATION AND COMMUNICATION TECHNOLOGY (ICT) 1.1. Contact organization: Kosovo Agency of Statistics KAS 1.2. Contact organization unit: Social Department Living Standard Sector
Zambia - Demographic and Health Survey 2007
 Microdata Library Zambia - Demographic and Health Survey 2007 Central Statistical Office (CSO) Report generated on: June 16, 2017 Visit our data catalog at: http://microdata.worldbank.org 1 2 Sampling
INTEGRATED COVERAGE MEASUREMENT SAMPLE DESIGN FOR CENSUS 2000 DRESS REHEARSAL
 INTEGRATED COVERAGE MEASUREMENT SAMPLE DESIGN FOR CENSUS 2000 DRESS REHEARSAL David McGrath, Robert Sands, U.S. Bureau of the Census David McGrath, Room 2121, Bldg 2, Bureau of the Census, Washington,
Botswana - Botswana AIDS Impact Survey III 2008
 Statistics Botswana Data Catalogue Botswana - Botswana AIDS Impact Survey III 2008 Statistics Botswana - Ministry of Finance and Development Planning, National AIDS Coordinating Agency (NACA) Report generated
Lao PDR - Multiple Indicator Cluster Survey 2006
 Microdata Library Lao PDR - Multiple Indicator Cluster Survey 2006 Department of Statistics - Ministry of Planning and Investment, Hygiene and Prevention Department - Ministry of Health, United Nations
SAMPLE DESIGN A.1 OBJECTIVES OF THE SAMPLE DESIGN A.2 SAMPLE FRAME A.3 STRATIFICATION
 SAMPLE DESIGN Appendix A A.1 OBJECTIVES OF THE SAMPLE DESIGN The primary objective of the sample design for the 2002 Jordan Population and Family Health Survey (JPFHS) was to provide reliable estimates
PMA2020 Household and Female Survey Sampling Strategy in Nigeria
 PMA2020 Household and Female Survey Sampling Strategy in Nigeria The first section describes the overall survey design and sample size calculation method of the Performance, Monitoring and Accountability
Jamaica - Multiple Indicator Cluster Survey 2011
 Microdata Library Jamaica - Multiple Indicator Cluster Survey 2011 Statistical Institute of Jamaica, United Nations Children s Fund Report generated on: January 12, 2015 Visit our data catalog at: http://ddghhsn01/index.php
Sampling Techniques. 70% of all women married 5 or more years have sex outside of their marriages.
 Sampling Techniques Introduction In Women and Love: A Cultural Revolution in Progress (1987) Shere Hite obtained several impacting results: 84% of women are not satisfied emotionally with their relationships.
Malawi - MDG Endline Survey
 Microdata Library Malawi - MDG Endline Survey 2013-2014 United Nations Children s Fund, National Statistical Office of Malawi Report generated on: December 15, 2015 Visit our data catalog at: http://microdata.worldbank.org
AmericasBarometer, 2016/17
 AmericasBarometer, 2016/17 Technical Information LAPOP AmericasBarometer 2016/17 round of surveys The 2016/17 AmericasBarometer study is based on interviews with 43,454 respondents in 29 countries. Nationally
Moldova - Multiple Indicator Cluster Survey 2012
 Microdata Library Moldova - Multiple Indicator Cluster Survey 2012 National Centre of Public Health - Ministry of Health, National Bureau of Statistics, United Nations Children s Fund Report generated
Barbados - Multiple Indicator Cluster Survey 2012
 Microdata Library Barbados - Multiple Indicator Cluster Survey 2012 United Nations Children s Fund, Barbados Statistical Service Report generated on: October 6, 2015 Visit our data catalog at: http://ddghhsn01/index.php
Chapter 4: Sampling Design 1
 1 An introduction to sampling terminology for survey managers The following paragraphs provide brief explanations of technical terms used in sampling that a survey manager should be aware of. They can
Ghana - Ghana Living Standards Survey
 Microdata Library Ghana - Ghana Living Standards Survey 5+ 2008 Institute of Statistical, Social and Economic Research - University of Ghana Report generated on: June 11, 2015 Visit our data catalog at:
Introduction INTRODUCTION TO SURVEY SAMPLING. Why sample instead of taking a census? General information. Probability vs. non-probability.
 Introduction Census: Gathering information about every individual in a population Sample: Selection of a small subset of a population INTRODUCTION TO SURVEY SAMPLING October 28, 2015 Karen Foote Retzer
SURVEY ON POLICE INTEGRITY IN THE WESTERN BALKANS (ALBANIA, BOSNIA AND HERZEGOVINA, MACEDONIA, MONTENEGRO, SERBIA AND KOSOVO) Research methodology
 Research methodology") SURVEY ON POLICE INTEGRITY IN THE WESTERN BALKANS (ALBANIA, BOSNIA AND HERZEGOVINA, MACEDONIA, MONTENEGRO, SERBIA AND KOSOVO) Research methodology Prepared for: The Belgrade Centre for Security Policy
SURVEY ON POLICE INTEGRITY IN THE WESTERN BALKANS (ALBANIA, BOSNIA AND HERZEGOVINA, MACEDONIA, MONTENEGRO, SERBIA AND KOSOVO) Research methodology Prepared for: The Belgrade Centre for Security Policy
K.R.N.SHONIWA Director of the Production Division Zimbabwe National Statistics Agency
 Information and Communication Technology (ICT) Household Survey 2014: Zimbabwe s Experience 22 November 2016 Gaborone, Botswana K.R.N.SHONIWA Director of the Production Division Zimbabwe National Statistics
PUBLIC EXPENDITURE TRACKING SURVEYS. Sampling. Dr Khangelani Zuma, PhD
 PUBLIC EXPENDITURE TRACKING SURVEYS Sampling Dr Khangelani Zuma, PhD Human Sciences Research Council Pretoria, South Africa http://www.hsrc.ac.za kzuma@hsrc.ac.za 22 May - 26 May 2006 Chapter 1 Surveys
Chapter 3 Monday, May 17th
 Chapter 3 Monday, May 17 th Surveys The reason we are doing surveys is because we are curious of what other people believe, or what customs other people p have etc But when we collect the data what are
An Introduction to ACS Statistical Methods and Lessons Learned
 An Introduction to ACS Statistical Methods and Lessons Learned Alfredo Navarro US Census Bureau Measuring People in Place Boulder, Colorado October 5, 2012 Outline Motivation Early Decisions Statistical
Liberia - Household Income and Expenditure Survey 2016
 Microdata Library Liberia - Household Income and Expenditure Survey 2016 Liberia Institute for Statistics and Geo-Information Services - Government of Liberia Report generated on: April 9, 2018 Visit our
Benefits of Sample long Form to Enlarge the scope of Census Data Analysis: The Experience Of Bangladesh
 yed S. Hossain, University of Dhaka A K M Mahabubur Rahman Joarder, Statistics Division, GOB Md. Abdur Rahim, BBS, GOB eeds Assessment Conference On Census Analysis III Benefits of Sample long Form to
Montenegro - Multiple Indicator Cluster Survey Roma Settlements
 Microdata Library Montenegro - Multiple Indicator Cluster Survey 2013 - Roma Settlements United Nations Children s Fund, Statistical Office of Montenegro Report generated on: October 15, 2015 Visit our
Albania - Demographic and Health Survey
 Microdata Library Albania - Demographic and Health Survey 2008-2009 Institute of Statistics (INSTAT), Institute of Public Health (IShP) Report generated on: June 16, 2017 Visit our data catalog at: http://microdata.worldbank.org
Introduction INTRODUCTION TO SURVEY SAMPLING. General information. Why sample instead of taking a census? Probability vs. non-probability.
 Introduction Census: Gathering information about every individual in a population Sample: Selection of a small subset of a population Census INTRODUCTION TO SURVEY SAMPLING Sample February 14, 2018 Linda
Polls, such as this last example are known as sample surveys.
 Chapter 12 Notes (Sample Surveys) In everything we have done thusfar, the data were given, and the subsequent analysis was exploratory in nature. This type of statistical analysis is known as exploratory
Census: Gathering information about every individual in a population. Sample: Selection of a small subset of a population.
 INTRODUCTION TO SURVEY SAMPLING October 18, 2012 Linda Owens University of Illinois at Chicago www.srl.uic.edu Census or sample? Census: Gathering information about every individual in a population Sample:
Experiences with the Use of Addressed Based Sampling in In-Person National Household Surveys
 Experiences with the Use of Addressed Based Sampling in In-Person National Household Surveys Jennifer Kali, Richard Sigman, Weijia Ren, Michael Jones Westat, 1600 Research Blvd, Rockville, MD 20850 Abstract
AF Measure Analysis Issues I
 AF Measure Analysis Issues I José Manuel Roche Washington, 11 July 2013 Analysis Issues I 1. Metadata 2. Survey design and representativeness 3. Non response rate and other non sampling error 4. Missing
Namibia - Demographic and Health Survey
 Microdata Library Namibia - Demographic and Health Survey 2006-2007 Ministry of Health and Social Services (MoHSS) Report generated on: June 16, 2017 Visit our data catalog at: http://microdata.worldbank.org
October 6, Linda Owens. Survey Research Laboratory University of Illinois at Chicago 1 of 22
 INTRODUCTION TO SURVEY SAMPLING October 6, 2010 Linda Owens University of Illinois at Chicago www.srl.uic.edu 1 of 22 Census or sample? Census: Gathering information about every individual in a population
The challenges of sampling in Africa
 The challenges of sampling in Africa Prepared by: Dr AC Richards Ask Afrika (Pty) Ltd Head Office: +27 12 428 7400 Tele Fax: +27 12 346 5366 Mobile Phone: +27 83 293 4146 Web Portal: www.askafrika.co.za
Use of administrative sources and registers in the Finnish EU-SILC survey
 Use of administrative sources and registers in the Finnish EU-SILC survey Workshop on best practices for EU-SILC revision Marie Reijo, Senior Researcher Content Preconditions for good registers utilisation
FINANCIAL LITERACY SURVEY IN BOSNIA AND HERZEGOVINA 2011
 Public Disclosure Authorized Public Disclosure Authorized Methodological Report FINANCIAL LITERACY SURVEY IN BOSNIA AND HERZEGOVINA 2011 Public Disclosure Authorized For: World Bank re Authorized May 2011
6 Sampling. 6.2 Target Population and Sample Frame. See ECB (2011, p. 7). Monetary Policy & the Economy Q3/12 addendum 61
. Monetary Policy & the Economy Q3/12 addendum 61") 6 Sampling 6.1 Introduction The sampling design of the HFCS in Austria was specifically developed by the OeNB in collaboration with the Institut für empirische Sozialforschung GmbH IFES. Sampling means
6 Sampling 6.1 Introduction The sampling design of the HFCS in Austria was specifically developed by the OeNB in collaboration with the Institut für empirische Sozialforschung GmbH IFES. Sampling means
Egypt, Arab Rep. - Multiple Indicator Cluster Survey
 Microdata Library Egypt, Arab Rep. - Multiple Indicator Cluster Survey 2013-2014 United Nations Children s Fund, El-Zanaty & Associates, Ministry of Health and Population Report generated on: December
Statistical and operational complexities of the studies I Sample design: Use of sampling and replicated weights
 Statistical and operational complexities of the studies I Sample design: Use of sampling and replicated weights Andrés Sandoval-Hernández IEA DPC Workshop on using PISA, PIAAC, TIMSS & PIRLS, TALIS datasets
6 Sampling. 6.2 Target population and sampling frame. See ECB (2013a), p. 80f. MONETARY POLICY & THE ECONOMY Q2/16 ADDENDUM 65
, p. 80f. MONETARY POLICY & THE ECONOMY Q2/16 ADDENDUM 65") 6 Sampling 6.1 Introduction The sampling design for the second wave of the HFCS in Austria was specifically developed by the OeNB in collaboration with the survey company IFES (Institut für empirische
6 Sampling 6.1 Introduction The sampling design for the second wave of the HFCS in Austria was specifically developed by the OeNB in collaboration with the survey company IFES (Institut für empirische
Proceedings of the Annual Meeting of the American Statistical Association, August 5-9, 2001
 Proceedings of the Annual Meeting of the American Statistical Association, August 5-9, 2001 COVERAGE MEASUREMENT RESULTS FROM THE CENSUS 2000 ACCURACY AND COVERAGE EVALUATION SURVEY Dawn E. Haines and
Saint Lucia Country Presentation
 Saint Lucia Country Presentation Workshop on Integrating Population and Housing with Agricultural Censuses 10 th 12 th June, 2013 Edwin St Catherine Director of Statistics Household and Population Census
Indonesia - Demographic and Health Survey 2007
 Microdata Library Indonesia - Demographic and Health Survey 2007 Central Bureau of Statistics (Badan Pusat Statistik (BPS)) Report generated on: June 16, 2017 Visit our data catalog at: http://microdata.worldbank.org
Vanuatu - Household Income and Expenditure Survey 2010
 National Data Archive Vanuatu - Household Income and Expenditure Survey 2010 Vanuatu Nationall Statistics Office - Ministry of Finance and Economic Management Report generated on: August 20, 2013 Visit
LOGO GENERAL STATISTICS OFFICE OF VIETNAM
 THE 2009 POPULATION AND HOUSING CENSUS OF VIETNAM: INNOVATION AND ACHIEVEMENTS LOGO 1 Main contents INTRODUCTION CENSUS SUBJECT - MATTERS INNOVATION OF THE 2009 CENSUS ACHIEVEMENTS OF THE 2009 CENSUS 2
Chapter 12: Sampling
 Chapter 12: Sampling In all of the discussions so far, the data were given. Little mention was made of how the data were collected. This and the next chapter discuss data collection techniques. These methods
Chapter 12 Summary Sample Surveys
 Chapter 12 Summary Sample Surveys What have we learned? A representative sample can offer us important insights about populations. o It s the size of the same, not its fraction of the larger population,
Sampling Subpopulations in Multi-Stage Surveys
 Sampling Subpopulations in Multi-Stage Surveys Robert Clark, Angela Forbes, Robert Templeton This research was funded by the Statistics NZ Official Statistics Research Fund 2007/2008, and builds on the
Stat472/572 Sampling: Theory and Practice Instructor: Yan Lu Albuquerque, UNM
 Stat472/572 Sampling: Theory and Practice Instructor: Yan Lu Albuquerque, UNM 1 Chapter 1: Introduction Three Elements of Statistical Study: Collecting Data: observational data, experimental data, survey
SAMPLING. A collection of items from a population which are taken to be representative of the population.
 SAMPLING Sample A collection of items from a population which are taken to be representative of the population. Population Is the entire collection of items which we are interested and wish to make estimates
MATRIX SAMPLING DESIGNS FOR THE YEAR2000 CENSUS. Alfredo Navarro and Richard A. Griffin l Alfredo Navarro, Bureau of the Census, Washington DC 20233
 MATRIX SAMPLING DESIGNS FOR THE YEAR2000 CENSUS Alfredo Navarro and Richard A. Griffin l Alfredo Navarro, Bureau of the Census, Washington DC 20233 I. Introduction and Background Over the past fifty years,
São Tomé and Príncipe - Multiple Indicator Cluster Survey 2014
 Microdata Library São Tomé and Príncipe - Multiple Indicator Cluster Survey 2014 United Nations Children s Fund, National Institute of Statistics, UNDP/Global Fund project, National Centre for Endemic
Stats: Modeling the World. Chapter 11: Sample Surveys
 Stats: Modeling the World Chapter 11: Sample Surveys Sampling Methods: Sample Surveys Sample Surveys: A study that asks questions of a small group of people in the hope of learning something about the
Vincent Thomas Mule, Jr., U.S. Census Bureau, Washington, DC
 Paper SDA-06 Vincent Thomas Mule, Jr., U.S. Census Bureau, Washington, DC ABSTRACT As part of the evaluation of the 2010 Census, the U.S. Census Bureau conducts the Census Coverage Measurement (CCM) Survey.
Elements of the Sampling Problem!
 Elements of the Sampling Problem! Professor Ron Fricker! Naval Postgraduate School! Monterey, California! Reading Assignment:! 2/1/13 Scheaffer, Mendenhall, Ott, & Gerow,! Chapter 2.1-2.3! 1 Goals for
Survey of Massachusetts Congressional District #4 Methodology Report
 Survey of Massachusetts Congressional District #4 Methodology Report Prepared by Robyn Rapoport and David Dutwin Social Science Research Solutions 53 West Baltimore Pike Media, PA, 19063 Contents Overview...
Chapter 8. Producing Data: Sampling. BPS - 5th Ed. Chapter 8 1
 Chapter 8 Producing Data: Sampling BPS - 5th Ed. Chapter 8 1 Population and Sample Researchers often want to answer questions about some large group of individuals (this group is called the population)
Pacific Training on Sampling Methods for Producing Core Data Items for Agricultural and Rural Statistics
 Pacific Training on Sampling Methods for Producing Core Data Items for Agricultural and Rural Statistics 13-17 August, Suva, Fiji Module 2: Review of Basics of Sampling Methods Session 2.1: Terminology,
SAMPLE IMPLEMENTATION
 SAMPLE IMPLEMENTATION Appendix A A.1 SAMPLE DESIGN The primary objective of the 2004 Malawi Demographic and Health Survey (MDHS) is to provide estimates with acceptable precision for important population
Key Words: age-order, last birthday, full roster, full enumeration, rostering, online survey, within-household selection. 1.
 Comparing Alternative Methods for the Random Selection of a Respondent within a Household for Online Surveys Geneviève Vézina and Pierre Caron Statistics Canada, 100 Tunney s Pasture Driveway, Ottawa,
Objectives. Module 6: Sampling
 Module 6: Sampling 2007. The World Bank Group. All rights reserved. Objectives This session will address - why we use sampling - how sampling can create efficiencies for data collection - sampling techniques,
Sampling Designs and Sampling Procedures
 Business Research Methods 9e Zikmund Babin Carr Griffin 16 Sampling Designs and Sampling Procedures Chapter 16 Sampling Designs and Sampling Procedures 2013 Cengage Learning. All Rights Reserved. May not
2011 National Household Survey (NHS): design and quality
: design and quality") 2011 National Household Survey (NHS): design and quality Margaret Michalowski 2014 National Conference Canadian Research Data Center Network (CRDCN) Winnipeg, Manitoba, October 29-31, 2014 Outline of the
2011 National Household Survey (NHS): design and quality Margaret Michalowski 2014 National Conference Canadian Research Data Center Network (CRDCN) Winnipeg, Manitoba, October 29-31, 2014 Outline of the
Sample Surveys. Chapter 11
 Sample Surveys Chapter 11 Objectives Population Sample Sample survey Bias Randomization Sample size Census Parameter Statistic Simple random sample Sampling frame Stratified random sample Cluster sample
Comparing Generalized Variance Functions to Direct Variance Estimation for the National Crime Victimization Survey
 Comparing Generalized Variance Functions to Direct Variance Estimation for the National Crime Victimization Survey Bonnie Shook-Sa, David Heller, Rick Williams, G. Lance Couzens, and Marcus Berzofsky RTI
These days, surveys are used everywhere and for many reasons. For example, surveys are commonly used to track the following:
 The previous handout provided an overview of study designs. The two broad classifications discussed were randomized experiments and observational studies. In this handout, we will briefly introduce a specific
Estimation Methodology and General Results for the Census 2000 A.C.E. Revision II Richard Griffin U.S. Census Bureau, Washington, DC 20233
 Estimation Methodology and General Results for the Census 2000 A.C.E. Revision II Richard Griffin U.S. Census Bureau, Washington, DC 20233 1. Introduction 1 The Accuracy and Coverage Evaluation (A.C.E.)
COUNTRY REPORT MONGOLIA
 Integrated Global Census Microdata Workshop Durban, South Africa, 16 th August 2009 COUNTRY REPORT MONGOLIA B. Tserenkhand Head, Data Processing and Technology Department, NSO of Mongolia Content History
The main focus of the survey is to measure income, unemployment, and poverty.
 HUNGARY 1991 - Documentation Table of Contents A. GENERAL INFORMATION B. POPULATION AND SAMPLE SIZE, SAMPLING METHODS C. MEASURES OF DATA QUALITY D. DATA COLLECTION AND ACQUISITION E. WEIGHTING PROCEDURES
THE 2009 VIETNAM POPULATION AND HOUSING CENSUS
 THE 2009 VIETNAM POPULATION AND HOUSING CENSUS (Prepared for the 11 th Meeting of the Head of NSOs of East Asian Countries) Dr. Le Manh Hung Director-General General Statistics Office Vietnam This paper
The Savvy Survey #3: Successful Sampling 1
 AEC393 1 Jessica L. O Leary and Glenn D. Israel 2 As part of the Savvy Survey series, this publication provides Extension faculty with an overview of topics to consider when thinking about who should be
Pakistan - Demographic and Health Survey
 Microdata Library Pakistan - Demographic and Health Survey 2006-2007 National Institute of Population Studies Report generated on: June 16, 2017 Visit our data catalog at: http://microdata.worldbank.org
A QUALITY ASSURANCE STRATEGY IN MALAYSIA 2020 POPULATION AND HOUSING CENSUS
 United Nations Regional Workshop on The 2020 World Programme on Population and Housing Censuses: International Standards and Contemporary Technologies SESSION 6: A QUALITY ASSURANCE IN POPULATION AND HOUSING
NATIONAL SOCIO- ECONOMIC SURVEY (SUSENAS) 2001 MANUAL HEAD OF PROVINCIAL, REGENCY/ MUNICIPALITY AND CORE SUPERVISOR/ EDITOR
 2001 MANUAL HEAD OF PROVINCIAL, REGENCY/ MUNICIPALITY AND CORE SUPERVISOR/ EDITOR") Manual 1.A NATIONAL SOCIO- ECONOMIC SURVEY (SUSENAS) 2001 MANUAL HEAD OF PROVINCIAL, REGENCY/ MUNICIPALITY AND CORE SUPERVISOR/ EDITOR Statistics Indonesia (BPS), Jakarta- Indonesia CONTENTS CONTENTS I.
Manual 1.A NATIONAL SOCIO- ECONOMIC SURVEY (SUSENAS) 2001 MANUAL HEAD OF PROVINCIAL, REGENCY/ MUNICIPALITY AND CORE SUPERVISOR/ EDITOR Statistics Indonesia (BPS), Jakarta- Indonesia CONTENTS CONTENTS I.
Some Indicators of Sample Representativeness and Attrition Bias for BHPS and Understanding Society
 Working Paper Series No. 2018-01 Some Indicators of Sample Representativeness and Attrition Bias for and Peter Lynn & Magda Borkowska Institute for Social and Economic Research, University of Essex Some
Tonga - National Population and Housing Census 2011
 Tonga - National Population and Housing Census 2011 Tonga Department of Statistics - Tonga Government Report generated on: July 14, 2016 Visit our data catalog at: http://pdl.spc.int/index.php 1 Overview
Italian Americans by the Numbers: Definitions, Methods & Raw Data
 Tom Verso (January 07, 2010) The US Census Bureau collects scientific survey data on Italian Americans and other ethnic groups. This article is the eighth in the i-italy series Italian Americans by the
Strategies for the 2010 Population Census of Japan
 The 12th East Asian Statistical Conference (13-15 November) Topic: Population Census and Household Surveys Strategies for the 2010 Population Census of Japan Masato CHINO Director Population Census Division
NATIONAL SOCIO-ECONOMIC SURVEY 1993
 MANUAL I NATIONAL SOCIO-ECONOMIC SURVEY 1993 W O R K M A N U A L HEAD OF PROVINCIAL AND REGENCY/MUNICIPALITY STATISTIC OFFICE Central Bureau of Statistics, Jakarta - Indonesia 1 C O N T E N T S CONTENTS
Other Effective Sampling Methods
 Other Effective Sampling Methods MATH 130, Elements of Statistics I J. Robert Buchanan Department of Mathematics Fall 2018 Stratified Sampling Definition A stratified sample is obtained by separating the
3. Data and sampling. Plan for today
 3. Data and sampling Business Statistics Plan for today Reminders and introduction Data: qualitative and quantitative Quantitative data: discrete and continuous Qualitative data discussion Samples and
Maintaining knowledge of the New Zealand Census *
 1 of 8 21/08/2007 2:21 PM Symposium 2001/25 20 July 2001 Symposium on Global Review of 2000 Round of Population and Housing Censuses: Mid-Decade Assessment and Future Prospects Statistics Division Department
Understanding and Using the U.S. Census Bureau s American Community Survey
 Understanding and Using the US Census Bureau s American Community Survey The American Community Survey (ACS) is a nationwide continuous survey that is designed to provide communities with reliable and
population and housing censuses in Viet Nam: experiences of 1999 census and main ideas for the next census Paper prepared for the 22 nd
 population and housing censuses in Viet Nam: experiences of 1999 census and main ideas for the next census Paper prepared for the 22 nd Population Census Conference Seattle, Washington, USA, 7 9 March
Working Paper n. 79, January 2009
 Methodology of European labour force surveys: (2) Sample design and implementation Francesca Gagliardi, Vijay Verma, Giulia Ciampalini Working Paper n. 79, January 2009 Methodology of European labour
Working with NHS and Taxfiler data to measure income and poverty in Toronto neighbourhoods
 Working with NHS and Taxfiler data to measure income and poverty in Toronto neighbourhoods Wayne Chu Planning Analyst Social Development, Finance & Administration, City of Toronto CCSD Community Data Canada
Ghana - Financial Inclusion Insights Survey 2014
 Microdata Library Ghana - Financial Inclusion Insights Survey 2014 InterMedia Report generated on: December 1, 2016 Visit our data catalog at: http://ddghhsn01/index.php/microdata.worldbank.org 1 2 Sampling
Liberia - Demographic and Health Survey 2007
 Microdata Library Liberia - Demographic and Health Survey 2007 Liberia Institute for Statistics and Geo-Information Services (LISGIS) Report generated on: June 16, 2017 Visit our data catalog at: http://microdata.worldbank.org
The American Community Survey. An Esri White Paper August 2017
 An Esri White Paper August 2017 Copyright 2017 Esri All rights reserved. Printed in the United States of America. The information contained in this document is the exclusive property of Esri. This work
MAT 1272 STATISTICS LESSON STATISTICS AND TYPES OF STATISTICS
 MAT 1272 STATISTICS LESSON 1 1.1 STATISTICS AND TYPES OF STATISTICS WHAT IS STATISTICS? STATISTICS STATISTICS IS THE SCIENCE OF COLLECTING, ANALYZING, PRESENTING, AND INTERPRETING DATA, AS WELL AS OF MAKING
Comparative Study of Electoral Systems (CSES) Module 4: Design Report (Sample Design and Data Collection Report) September 10, 2012
 Module 4: Design Report (Sample Design and Data Collection Report) September 10, 2012") Comparative Study of Electoral Systems 1 Comparative Study of Electoral Systems (CSES) (Sample Design and Data Collection Report) September 10, 2012 Country: Poland Date of Election: 09.10.2011 Prepared
Comparative Study of Electoral Systems 1 Comparative Study of Electoral Systems (CSES) (Sample Design and Data Collection Report) September 10, 2012 Country: Poland Date of Election: 09.10.2011 Prepared
Vietnam - Household Living Standards Survey 2004
 Microdata Library Vietnam - Household Living Standards Survey 2004 General Statistical Office (GSO) - Ministry of Planning and Investment, Vietnam Report generated on: September 11, 2017 Visit our data
FOREWORD. [ ] FAO Home Economic and Social Development Department Statistics Division Home FAOSTAT
![FOREWORD. [ ] FAO Home Economic and Social Development Department Statistics Division Home FAOSTAT](/thumbs/74/69823929.jpg "FOREWORD. [ ] FAO Home Economic and Social Development Department Statistics Division Home FAOSTAT") Conducting of Agricultural Censuses and Surveys [ ] FAO Home Economic and Social Development Department Statistics Division Home FAOSTAT Other Statistics World Programme for the Census of 2010 Conducting
Conducting of Agricultural Censuses and Surveys [ ] FAO Home Economic and Social Development Department Statistics Division Home FAOSTAT Other Statistics World Programme for the Census of 2010 Conducting
Blow Up: Expanding a Complex Random Sample Travel Survey
 10 TRANSPORTATION RESEARCH RECORD 1412 Blow Up: Expanding a Complex Random Sample Travel Survey PETER R. STOPHER AND CHERYL STECHER In April 1991 the Southern California Association of Governments contracted
1 NOTE: This paper reports the results of research and analysis
 Race and Hispanic Origin Data: A Comparison of Results From the Census 2000 Supplementary Survey and Census 2000 Claudette E. Bennett and Deborah H. Griffin, U. S. Census Bureau Claudette E. Bennett, U.S.