ECONOMIC AND SOCIAL COMMISSION FOR WESTERN ASIA (ESCWA) A STUDY OF AGE REPORTING IN SELECTED ARAB CENSUSES OF POPULATION.
|
|
|
- Donna McGee
- 5 years ago
- Views:
Transcription
1 ECONOMIC AND SOCIAL COMMISSION FOR WESTERN ASIA (ESCWA) A STUDY OF AGE REPORTING IN SELECTED ARAB CENSUSES OF POPULATION United Nations

2 Distr. GENERAL E/ESCWA/SD/2013/5 4 October 2013 ORIGINAL: ENGLISH ECONOMIC AND SOCIAL COMMISSION FOR WESTERN ASIA (ESCWA) A STUDY OF AGE REPORTING IN SELECTED ARAB CENSUSES OF POPULATION United Nations New York,
3 Acknowledgements To the best of our knowledge, A Study of Age Reporting in Selected Arab Censuses of Population provides the first comparative assessment of age reporting and patterns of digit preference at both the national and subnational levels in Arab censuses of population. It was prepared by the Statistics Division of the Economic and Social Commission for Western Asia (ESCWA) under the supervision of Mr. Marwan Khawaja and Mr. Ismail Lubbad. The contributions of Mr. Evan Brand, Mr. Raffi Shirinian and Ms. Zeina Sinno of the Statistics Division of ESCWA are acknowledged. It is hoped that findings of this study will be useful to national statistical offices as well as to researchers, students, journalists and the public at large. We express our gratitude to the Integrated Public Use Microdata Series International (IPUMS-I), a project of the Minnesota Population Center at the University of Minnesota, in the United States for providing microdata files for Egypt, Iraq, Jordan, Morocco and the Sudan. We express our gratitude to the Palestinian Central Bureau of Statistics for providing micro census data for Palestine, and to national statistical offices for providing data in response to our questionnaire. iii
4 iv
5 CONTENTS Acknowledgements... iii Abbreviations and acronyms... vii Introduction... 1 Chapter I. OVERVIEW OF CENSUS-TAKING IN THE ARAB REGION... 2 A. Historical background on Arab censuses before World War II... 2 B. Censuses in Arab countries after World War II... 3 C. Census-taking methods... 4 II. DATA AND METHODS... 5 A. Description of microdata files... 5 B. Variables used in the analysis... 5 C. Methods... 8 Page III. IV. DESCRIPTIVE ANALYSIS OF AGE-SEX REPORTING AND AGE HEAPING IN RECENT POPULATION CENSUSES ANALYSIS OF AGE HEAPING AT THE SUBNATIONAL LEVEL IN RECENT POPULATION CENSUSES V. CONCLUSIONS AND RECOMMENDATIONS References LIST OF TABLES 1. Description of census samples Definitions of literacy in census files Definitions of urban areas in census files Summary statistics for predictors Pairwise correlations weighted by district counts between the Whipple and predictors Effects of district characteristics on the Whipple LIST OF FIGURES 1. Dates of censuses in 19 Arab countries Scatterplots of four predictors vs. Whipple for the 2008 census of the Sudan Population pyramids of 12 Arab countries, various years v
6 CONTENTS (continued) 4. Birth cohorts by sex from multiple censuses in eight Arab countries Sex ratio by birth cohort in 12 Arab countries, various years Country-level Whipple indices for 12 Arab countries by sex, various years Myers for 10 Arab countries, most recent census Bachi for 10 Arab countries, most recent census United Nations age-sex accuracy for 13 Arab countries, most recent census Boxplots of district-level Whipple indices Scatterplots of per cent literate vs. wealth in the 1982 census of Morocco and the 2008 census of the Sudan Scatterplots of nonlinear relationships in the 1996 and 2006 censuses of Egypt Scatterplot of per cent female vs. Whipple in the 2008 census of the Sudan ANNEXES I. National data II. Subnational data Page vi
7 ABBREVIATIONS AND ACRONYMS CAPI GIS GPS IPUMS-I ESCWA NIU PAPI PDA PES UNACI Computer assisted personal interview Geographical information systems Global positioning systems Integrated Public Use Microdata Series International Economic and Social Commission for Western Asia Not in universe Paper and pencil interview Personal digit assistant Post enumeration surveys United Nations age-sex accuracy vii
8 Introduction The first population characteristic given in census results is the age and sex distribution. Estimates of fertility, migration, morbidity and mortality rates all depend on age and sex data. Such data are also important for use in population projections, and for assessing the age- and sex-specific socioeconomic and health conditions of a population. Unfortunately, data on age and sex often suffer from reporting errors and irregularities, which are sometimes serious enough to impact the usability of the data. One of the common errors is age misstatement, which is referred to as a content (or response) error. There are a number of reasons for age misstatement, but it most commonly results from the respondent simply not knowing his or her exact age or the age of the household members for whom he or she is reporting. When a large number of ages are estimates, age distribution contains visible peaks at preferred ages. Often these are ages that end in zero or five, but they can also be other preferred digits that are of cultural significance. This pattern is known as age heaping, and can be easily measured. Age heaping causes artificial distortion of the age structure of a population, resulting in inaccurately reported population indicators, and leads to erroneous conclusions about demographic patterns in the population. It is therefore necessary to assess the reliability of age and sex data before use in any demographic analysis or projection. Indeed, an assessment of age and sex data is one of the most important steps in the evaluation of population censuses. The purpose of this report is to do the following: (1) provide an overview of census taking in the Arab region; and (2) assess the accuracy of age-sex reporting and the patterns of digit preference in recent censuses of population in selected Arab countries at the national and subnational levels. Two kinds of data are used in this study. Special tabulations of age and sex data were obtained directly from national statistical offices. In addition, the study analyses sample microdata files from population censuses in six countries: Egypt, Iraq, Jordan, Morocco, Palestine and the Sudan. The first chapter of the study presents an overview of census taking in the Arab region and the second chapter explains the data and methods used for analysis in the report. The third chapter assesses the accuracy of age-sex reporting and patterns of digit preference in recent population censuses in some Arab countries at the national level. It presents graphical analyses of age-sex structures to examine data consistency. A number of common indices are used to assess the quality of age-sex reporting, including the United Nations age-sex accuracy (UNACI) and the Whipple, Myers and Bachi indices. Due to limited availability of singleage data, this report will assess the severity of age heaping at the national level for 11 Arab countries, and at the subnational level for six Arab countries. Trends of age misstatement over time are only possible for countries where data from multiple census years are available. The fourth chapter uses national census data from selected Arab countries to provide a subnational analysis of age heaping in population censuses in the region and examines the association between age heaping and selected household characteristics. The latter is accomplished by building a linear model that uses the Whipple as the response variable and known or suspected correlates of age heaping as explanatory variables, namely age, literacy, sex, area of residence and household wealth. Since income data are not available, a wealth is constructed instead from a linear combination of asset ownership variables, closely following the procedure used by the Demographic and Health Surveys. 1 The objective of building a linear model is to quantify the amount of age heaping attributable to characteristics of the population, rather than census-taking issues, in six Arab countries. 1 Rutstein and Johnson, 2004.
9 I. OVERVIEW OF CENSUS-TAKING IN THE ARAB REGION Broadly, two principal eras of census-taking can be distinguished in the Arab region: before and after World War II. In the majority of Arab countries, the data from the first censuses of the nineteenth and early twentieth centuries are of variable quality. Counting methods were rather sketchy, which resulted in significant under-enumeration of populations. 2 A. HISTORICAL BACKGROUND ON ARAB CENSUSES BEFORE WORLD WAR II During the nineteenth century, enumerations of Arab populations were mainly undertaken by the Ottomans. During the first half of the twentieth century, censuses were generally partial or incomplete, carried out under the British, French, Spanish or Italian mandates. Egypt is one of the first countries to have conducted a census. Evidence from ancient Egypt, including papyrus manuscripts, monuments and temples confirm that in 3340 B.C., a census was carried out. More recently, the Ottomans conducted enumerations, beginning in the sixteenth century ( ), in the Fertile Crescent (modern-day Iraq, Jordan, Lebanon, Palestine and the Syrian Arab Republic). The Ottoman censuses continued up to , 3 and expanded to include Egypt. Nevertheless, these censuses were incomplete and unreliable. Censuses were also conducted under the French Mandate in Algeria throughout the nineteenth century, but these censuses, too, are considered unreliable. 4 Changing objectives of censuses: From fiscal and military to socioeconomic goals Early census enumerations were primarily done for fiscal and military reasons. For example, once the Ottoman conquered a territory, they conducted censuses to take stock of material and human resources. In Egypt, from the sixteenth century, tax and land records contained lists of households. 5 The 1848 Egyptian census was unique in that it not only served to count homes, but also to describe each individual within the household. This census marked the birth of statistical practice in Egypt, breaking with the tradition of administrative fiscal counts. In 1868, the successors of Muhammad Ali organized a second census and created a statistical office in This change would also happen in the Maghreb countries, but not until the twentieth century. However, compared to western countries, modern population censuses have had a very short history in most of the Arab region. Partial or incomplete censuses, or general enumerations, were conducted in most Arab countries during the first half of the twentieth century. Egypt conducted a census in 1907, and subsequent censuses were conducted every ten years. In other Arab countries, most censuses conducted during the first half of the twentieth century were under the mandates of Britain, France, Italy or Spain. For example, under the British Mandate, two censuses were conducted in Palestine, in 1922 and Under the French Mandate, censuses were conducted in Lebanon (1921, 1932) and the Syrian Arab Republic (1922, 1927). These censuses are considered incomplete by many researchers. Also considered incomplete are the censuses and enumerations covering parts of Morocco (the Ex-Zone Nord, Tarfaya and Ifni), conducted in 1930, 1935, 1940 and 1950 under the Spanish Mandate. No more reliable were the censuses carried out in the Ex-Zone Sud part of Morocco in 1921, 1926, 1931, 1936 and 1951/52 under the French Mandate. In Algeria eight administrative censuses were taken from 1901 to 1948; in Libya censuses were taken in 1931 and 1936; and in Mauritania one census was taken in In Tunisia general enumerations were carried out in 1906, 1911, 1921, 1926, 1931 and Courbage and Fargues, The censuses of 1897, 1906 and 1914 concerned only some wilayat. See Courbage and Fargues, 1996, p Ibid., p Beginning in 1851, the French conducted population count approximately every five years (23 counts). 5 Alleaume and Fargues,
10 B. CENSUSES IN ARAB COUNTRIES AFTER WORLD WAR II All Arab countries except Lebanon have carried out one or more modern censuses from the 1950s until 2013 (figure 1). Qatar and Yemen did not undertake a modern census until the 1970s, and Oman conducted its first census in the 1990s. Algeria, Bahrain, Egypt, Iraq, Kuwait, Libya, the Syrian Arab Republic, Tunisia and the United Arab Emirates have carried out at least six modern censuses. Jordan, Mauritania, Morocco and Qatar have carried out five modern censuses. The Sudan and Yemen have carried out four modern censuses, while Oman, Palestine, and Saudi Arabia have carried out less than four modern censuses. The 1967 census in the West Bank and Gaza Strip was supervised by the Israeli Central Bureau of Statistics, but was conducted by the Israeli military. Figure 1. Dates of censuses in 19 Arab countries Source: Annex table AI.1. Note: Some censuses were incomplete or covered only part of the present day population of the country. Some censuses have been omitted from the figure. Prior to the 1960s, and for some countries even up to the 1970s, population censuses suffered from many limitations, which led to inaccurate counts and irregularities in age and sex data. For example, nomadic and seminomadic populations were often markedly underreported. Other segments of the population, such as young children and especially young girls, were also likely to be underreported. In addition to these coverage errors, there were problems in age reporting. Age misreporting caused noticeable distortions in the age-sex distributions of many populations in the region. For low-income countries in particular, ages of respondents were often unknown. Even in the most recent censuses, systematic errors of age declaration are still found in the age-sex distributions of many Arab countries: ages that end in 0 or 5 are often overreported, especially among women. This difference between males and females is typically wider in rural areas than it is in urban areas. 3
11 C. CENSUS-TAKING METHODS A brief questionnaire on census-taking methodologies and the quality of the most recent census was sent by the Economic and Social Commission for Western Asia (ESCWA) to each of its member countries. 6 Eleven countries answered the questionnaire. This section gives a brief summary of the responses, in order to shed some light on the technical aspects of data collection that relate to the quality of census data on population characteristics. 7 The methodology used for the most recent census in all respondent countries was a classical enumeration, with direct interviews by a census enumerator and generally one questionnaire. Some countries used more than one questionnaire, depending on the type of the enumerated population: Qatar (seven questionnaires); Jordan (four questionnaires); Morocco (three questionnaires: one for the nomad population; one for parts of the population such as military persons; and one for ordinary households), and Yemen (two short questionnaires). The period of enumeration is highly variable, from one day in Iraq to 40 days in Kuwait and 53 days in Egypt. The traditional paper and pencil interview (PAPI) is the most frequently used method of data collection. A new data collection method, however, has been used in Oman and the United Arab Emirates: the computer assisted personal interview (CAPI), which is carried out with a pocket or handheld computer known as a personal digit assistant (PDA). Kuwait, Oman and Qatar have used the Internet as a supplemental tool in data collection. During the preparation stage, most countries made use of global positioning systems (GPS) to help locate addresses within the enumeration areas (with the exception of Jordan, Morocco and Palestine). Countries that used GPS also used geographical information systems (GIS), not only during the preparation stage, but also during the enumeration stage itself (Kuwait, Oman, Qatar and Yemen). Six countries used GIS for publishing census results: Egypt, Iraq, Oman, Qatar, the United Arab Emirates and Yemen. Only Egypt, Iraq, Jordan, Morocco and Palestine reported that they carried out post enumeration surveys (PES) to evaluate coverage errors. However, according to reports by the national statistical offices, several Arab countries used demographic analysis to evaluate their last census (Egypt, Iraq, Oman, Palestine, Qatar, the Syrian Arab Republic and Yemen). Kuwait, Oman, Palestine, Qatar and the United Arab Emirates used administrative records to check census coverage. Not all countries publish their census coverage rate. Of those that do, undercoverage rates range from around 3 per cent in Palestine to 8 per cent in Egypt. 8 Only two countries, Kuwait and the United Arab Emirates, reported non-response rate (or refusal rate), although both countries reported this rate as 0 per cent. 6 The member countries of ESCWA are Bahrain, Egypt, Iraq, Jordan, Kuwait, Lebanon, Libya, Morocco, Oman, Palestine, Qatar, Saudi Arabia, the Sudan, the Syrian Arab Republic, Tunisia, the United Arab Emirates and Yemen. 7 Details are available in annex I tables AI.3-AI.6. 8 The undercoverage rate for the 2004 census of Tunisia was reported as 1 per cent by Mrabet,
12 II. DATA AND METHODS Two sets of data are used in this report. The first is special tabulations on age-sex distributions obtained mainly from the national statistical offices of the 11 member countries that responded to the questionnaire. The second set of data comes from sample microdata files readily available from IPUMS-I, a project of the Minnesota Population Center in the United States. A. DESCRIPTION OF MICRODATA FILES Ten census microdata files from six countries are used in the regression analysis in this report: Egypt (1996, 2006), Iraq (1997), Jordan (2004), Morocco (1982, 1994, 2004), Palestine (1997, 2007) and the Sudan (2008). All files except those from Palestine were provided by IPUMS-I. The Palestine census files were obtained directly from the Palestine Central Bureau of Statistics. All census files are samples, ranging from 5 to 15 per cent of the full census populations. Four of the census files make use of sample weights and the other six do not (table 1). TABLE 1. DESCRIPTION OF CENSUS SAMPLES Country Year Fraction (Percentage) Weighted Number of areas Yes 278 Egypt No 316 Iraq No 44 Jordan No No No 60 Morocco No Yes 62 Palestine Yes 76 Sudan Yes 202 The unit of analysis in the second part of this report is the designated subdistrict (governorate, region) available in the data files. In the Palestine census files, two area units are available: governorate and locality. Neither can be used as the unit of analysis on its own: there are too few governorates and many of the localities are too small. Instead, localities whose populations are greater than 10,000 are treated as separate observations, and the remaining localities in each governorate are pooled. In other words, the 62 observations in the Palestine 1997 file represent 46 populous localities, plus the 16 Palestine governorates. B. VARIABLES USED IN THE ANALYSIS The analysis uses a few known or suspected correlates of age heaping as explanatory variables: age, literacy, sex, area of residence and household wealth. A brief explanation of relevant variables used in the analysis follows. Age Two approaches are used to collect age data in censuses and surveys, expressed in completed solar years: completed age (age at the individual s last birthday), and/or the date of birth (year, month and day), which is the preferred approach. Demographers point to many sources of age reporting errors, including the following: Misunderstanding of the meaning of age, whether the most recent, the next or the nearest birthday. In particular, children under 1 year may be reported as 1 year of age; Rounding to attractive ages, particularly those ending in 0 or 5 (age heaping); Use of different calendars in the same country: Western, Islamic or lunar. 5
13 In the Egypt 1996 census, age data were collected by first asking for the date of birth, and if unknown, asking for the age in years. In Morocco, either age in years or date of birth was accepted, and in Palestine, both age in years and date of birth were asked. For the census in Egypt 2006, Jordan 2004 and the Sudan 2008, only age in years was asked. For the census in Iraq 1997, only date of birth was asked. For the regression model, median age is chosen over mean age, in part because of the skewness of the age distribution, but also because many of the census files top-code ages over 98 or 99. This top-coding does not affect the median age, but biases the mean age downward slightly. It should be noted that weighted censuses sometimes result in district-level median ages that are neither integers nor end in 5. Literacy Literacy is reported for the population aged 15 years or over. The definitions used in the various censuses are fairly similar (table 2). The computation of this variable from the data files is straightforward, except for the censuses of Iraq 1997 and Jordan The literacy variables in those censuses contain many missing values and not in universe (NIU) observations. Of the age 15+ population, these values make up close to 10 per cent in Iraq and 17 per cent in Jordan. In Iraq, literacy was only asked of individuals who do not hold an education certificate. In Jordan, literacy was only asked of individuals who have not completed elementary education and who are not currently enrolled in school. The literacy variable is recoded to literate, then, if an individual has either completed primary school or is currently enrolled in school. After these observations are recoded, literacy information is only missing from 1 per cent of the observations in the files of Iraq and Jordan. These observations are dropped when calculating district-level literacy rates. TABLE 2. DEFINITIONS OF LITERACY IN CENSUS FILES Country Egypt Iraq Jordan Morocco Palestine Sudan Definition The 1996 census does not define literacy; it is constructed from individuals who answered they can read and write or that they have an education certificate. Literacy is derived from the education attainment question in 2006, and implies ability to read and write. Asked of individuals without an education certificate. Ability to read and ability to write are asked separately; only those who can both read and write are considered literate. Ability to read and write. Asked of individuals who have not completed elementary education and who are not currently enrolled in school. Ability to read and write a simple paragraph. Implies ability to read and write. Asked as part of education level question. Ability to read and write a simple sentence. Source: IPUMS-I literacy variable documentation, comparability_section. Wealth In the absence of income data, a modified version of the wealth procedure used by the Demographic and Health Surveys is calculated at the household level. 9 The procedure uses principal components analysis to construct a linear combination of asset ownership variables from the first component, known as the Filmer-Pritchett method. 10 This report deviates from the Filmer-Prichett method in its treatment of ordinal asset variables with more than two levels (such as no kitchen, shared kitchen and private 9 Rutstein and Johnson, Filmer and Pritchett,
14 kitchen). Instead of creating dummy variables for each ordinal variable level, the levels are simply recoded as consecutive integers, starting at 1 for the level associated with the lowest wealth. Although this assumes equal distance between levels, it has been shown to be an improvement over using dummy variables, in part because it incorporates knowledge about the order of the levels. 11 In cases where the order of asset variable levels is unclear, ambiguous levels are combined. For instance, the variable for sewage disposal sometimes includes levels for septic tank and public sewage network. Since it is not obvious which of the two is associated with higher wealth, the levels are combined, and the variable becomes a binary indicator of connection to any sewage disposal system. In addition to asset variables, a crowding variable is included, equal to the negative of the number of persons over the number of rooms in the household. The negative is used so larger values correspond to higher levels of wealth. If a household reports unknown/missing for an asset, it is assumed the household does not own the asset. Generally, missing values make up a relatively small portion of the asset variable (< 1 per cent). It should be noted that, since the wealth is centred at 0 for each census and based on different asset variables for different countries, only within-census comparisons of wealth may be meaningful. urban The definition of urban areas varies from country to country, but is generally related to population size, socioeconomic conditions and/or administrative considerations (such as municipal boundaries) (table 3). In Palestine, refugee camps are considered neither urban nor rural. In this report, per cent urban, per cent rural and per cent in camps all add to 100 (rather than per cent urban and per cent rural adding to 100). urban and per cent in camps are therefore negatively correlated by design, but this avoids creating missing values for the per cent urban variable in areas that are exclusively made up of refugee camps. TABLE 3. DEFINITIONS OF URBAN AREAS IN CENSUS FILES Country Egypt Iraq Jordan Morocco Palestine Sudan Definition Administratively defined at the village level. Villages within the governorates of Cairo, Alexandria, Port- Said and Suez are exclusively urban. Villages within the capital districts of other governorates are defined as urban, as are the capital villages of most of the non-capital districts. Administratively determined. Urban areas are located inside the boundaries of municipality councils (Al-Majlis Al-Baldei) or within the boundaries of the City of Baghdad. Other areas are considered rural. Localities that had populations of 5,000 or more in the 1994 census. Urban/rural is not available for Morocco. Any locality whose population amounts to 10,000 persons or more is considered urban, as well as all governorates/district centres regardless of their size. Localities whose populations range from 4,000 to 9,999 persons and having at least four of the following services are also included as urban: public electricity network, public water network, post office, health centre with a full-time physician, and a school offering a general secondary education certificate. Refugee camps are neither classified as urban nor rural. Localities of administrative and/or commercial importance or with 5,000 or more inhabitants. The nomad population is included in rural. Source: IPUMS-I urban variable documentation, comparability_section. 11 Kolenikov and Angeles,
15 C. METHODS 1. Assessing the quality of age and sex data There are several approaches for assessing the quality of age and sex data in censuses. Graphical techniques, such as age-sex pyramids, permit one to perform a qualitative assessment by visually identifying response errors. Several indices that allow one to quantify the magnitude of particular patterns of age errors are also available, which operate under the assumption of a rectangular digit distribution. Software programs such as SINGAGE in the Population Analysis System (PAS), developed by the International Programs Center (IPC) of the United States Bureaus of the Census, can be used to calculate many of these indices. 12 Using census data provided by member countries, data available in publications and data tabulated from microdata files (obtained from IPUMS-I), graphical representations of age-sex data will be provided and age accuracy indices (Whipple, Myers, Bachi and UNACI) will be calculated to assess age reporting errors that result from digit preference. Population pyramids The population distribution by age and sex takes the shape of a pyramid, unless mortality and fertility levels are irregular, or the population in question has experienced important levels of migration. When the population is displayed by single years of age, it may also show age misstatement, if the pyramid displays peaks at certain ages, most frequently ages ending with 0 and 5. Graphical cohort analysis Comparing data from two or more censuses shows if the age pattern of the population at two or more census dates is consistent. Assuming no significant international migration, the size of each cohort should decline in successive censuses, due to mortality. In addition, the curve of age structure for censuses should follow the same pattern, in the absence of census errors. Sex ratios The sex ratio measures the number of males per 100 females. At birth, this ratio should be between 102 and 107, because male births tend to slightly outnumber female births. The sex ratio is then expected to decline gradually with age, due to lower female mortality rates. Major deviations from a smooth declining pattern can be attributed to the following: Fluctuations in demographic characteristics, such as mortality and migration rates; Fluctuations in sex ratio at birth; Misreporting of ages; Different enumeration rates for males and females at different ages. Whipple The Whipple was developed to measure preference for or avoidance of terminal digits 0 and 5. The is calculated as the number of individuals between the ages of 23 and 62 whose reported age ends in 0 or 5, over the expected number of individuals whose ages should end in 0 or 5 in the age group, multiplied by 100: 12 Arriaga,
16 Where P k stands for the number of individuals whose reported age is k. It follows that a Whipple score close to 100 indicates little or no age heaping in the data, and higher values indicate more severe heaping. Whipple scores can be grouped in the following categories: Highly accurate data Less than 105 Fairly accurate data Approximate data Rough data Very rough data 175 and more In practice, when data at the individual level are available, it is convenient to generate a dummy variable as follows: Where a i is the age of individual i. The interpretation of this dummy variable is the Whipple calculated for each individual. This allows one to compute Whipple indices for different area units by simply cross tabulating the mean of the Whipple variable (ignoring missing values) by the area unit of interest. Myers The Myers is conceptually similar to the Whipple, except that it can detect heaping at ages ending in each digit from 0 to 9. The theoretical range of the Myers is from 0 to 90, where 0 indicates no age heaping and 90 indicates the extreme case where all recorded ages end in the same digit. Terminal digits with positive values are overreported, while digits with negative scores are underreported, compared to expected digit frequencies. Bachi The Bachi, as an indicator of the general extent of heaping, is similar to the Myers. It involves applying the Whipple method repeatedly to determine the extent of preference for each terminal digit. Like the Myers, the Bachi is equal to the sum of the positive deviations from 10 per cent. It considers the population between 23 and 72 years. The theoretical range of the Bachi is 0 to 180, where 0 indicates no age heaping, and 180 indicates that a single terminal digit was reported for all ages. For each terminal digit, positive values represent a preference, while negative values represent avoidance. United Nations age-sex accuracy (UNACI) UNACI is based on sex ratios and age ratios, both of which are calculated in five-year age groups for populations below age 70. The sex ratio refers to the number of males per 100 females in each age group. It is calculated by first summing up successive differences (regardless of sign) in sex ratios and then taking their mean. The age ratio is calculated as 100 times the number of persons in a given age group divided by 9
17 the averages of the two adjacent age groups. It is calculated by first summing up deviations of the ratios from 100 for each age group. Then, mean deviation is computed. The final UNACI score is obtained by weighting the sex ratio score by 3 and the age ratio score by 1. Scores obtained from UNACI are interpreted as follows: Less than 20 Reasonably reliable data Between 20 and 40 Fairly unreliable data Over 40 Quite unreliable data It should be noted, however, that the does not take into consideration the normal decline of sex ratios by age, and distortions in the age structure due to large labour migration or forced migration caused by wars or natural disasters. This is especially important to keep in mind when using this for the heavily labour importing countries in the Gulf. 2. Building a model A separate linear statistical model is constructed for each census. Each model regresses the Whipple in each subnational area (e.g., district) on known or suspected correlates of age heaping, and is weighted by the estimated population of the area. For most census files, the unit of analysis for the model is the smallest available geographical distinction for each country, typically the district. The covariates considered are per cent female, per cent literate, per cent of the population in urban areas, median age, wealth and per cent in camps (Palestine only). The form of the model is: Where Y is the Whipple, indicates regression coefficients, X indicates predictors, k is the number of predictors considered for the census and is the error term, which is assumed to have constant variance. It is possible to combine the data and construct a single multilevel model, with districts nested within censuses (or even districts nested within years nested within countries), but there would only be a small number of units at each level above the district. In cases where the number of two- or three-level units is small, the separate model approach is justifiable. 13 Furthermore, the variables common to all censuses would be limited, and the methods of calculation differ for some variables. Only per cent literate, per cent female and median age could reasonably be included as predictors in a combined model. To address possible issues with multiple testing, after a model is built for each census, p-values from all models are pooled and adjusted using Holm s method. Holm s method is chosen because it controls for the familywise error rate and does not assume independence of the p-values. 14 Data from South Sudan are considerably different from data from the rest of the Sudan (figure 2). The most recent census, taken in 2008, was divided into the Sudan and South Sudan, and the data are modelled separately. Likewise, IPUMS-I has recently split off data for South Sudan from the 2008 file, and data for both countries are available separately on its website. 13 Goldstein Aickin and Gensler,
18 Figure 2. Scatterplots of four predictors vs. Whipple for the 2008 census of the Sudan Note: Blue points are counties in the Sudan and grey points are counties in South Sudan. 11
19 III. DESCRIPTIVE ANALYSIS OF AGE-SEX REPORTING AND AGE HEAPING IN RECENT POPULATION CENSUSES The basic objectives of this chapter are to do the following: Examine the accuracy of age-sex data in selected Arab countries; Examine, when data are available, trends over time in the accuracy of age-sex data. The analysis makes use of population pyramids and other graphical depictions of the data show areas where errors may be present. In addition, the data will be analysed using the Whipple, Myers, Bachi and UNACI indices. Population pyramids Single year population pyramids for selected Arab countries are shown in figure 3. These pyramids show data from the most recent censuses, and use the national populations when data are disaggregated by nationality/citizenship. Data from Egypt, the Sudan and Yemen are clearly affected by age heaping. Data from Morocco and the Syrian Arab Republic are also affected by heaping, albeit to a lesser extent. In the rest of the countries, age misreporting appears to be minor and concentrated at older ages. Of course, abnormal pyramids of Gulf countries, showing large numbers of working-age individuals, are a result of international labour migration. Age heaping appears to be more severe for women than for men, and appears to be more extreme in older cohorts than in younger cohorts. Age heaping noticeably decreases over time in Morocco, but improvement is not as obvious in Egypt. Figure 3. Population pyramids of 12 Arab countries, various years 12
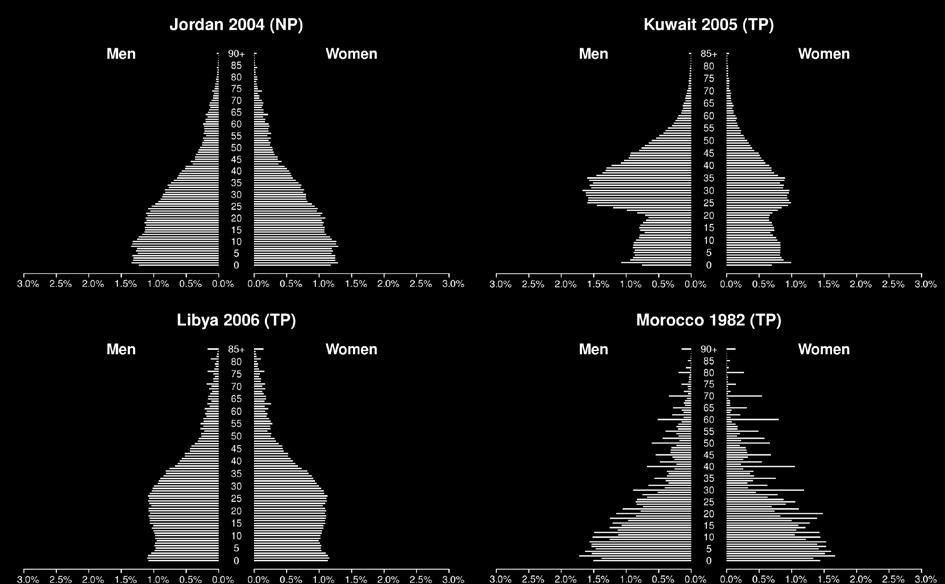
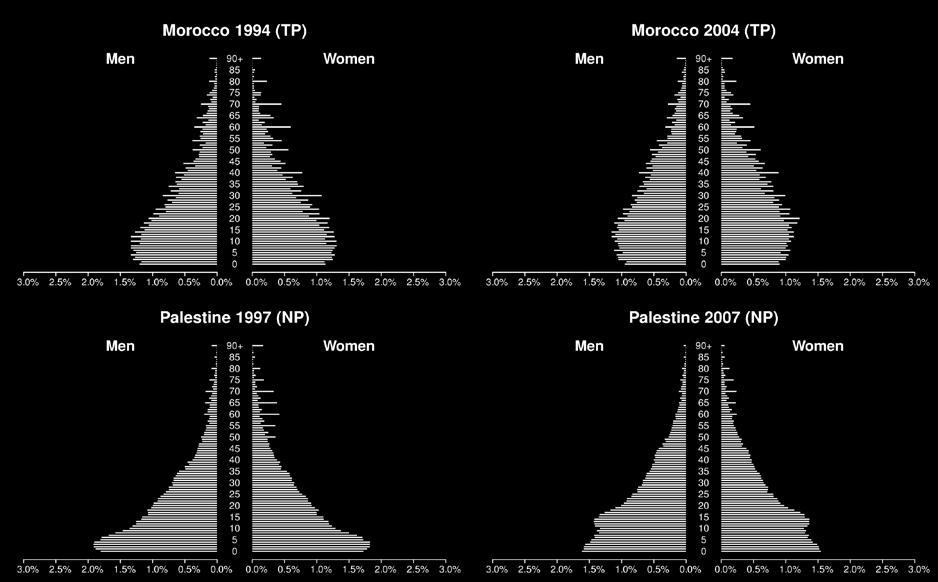
20 Figure 3 (continued) 13


21 Figure 3 (continued) Note: (NP) indicates national population; (TP) indicates total population. Graphical cohort analysis Figure 4 shows birth cohorts separately for each sex in Arab countries for which data from multiple census years are available. Use of total population in Kuwait and Qatar highlights the distorting effect of immigration when we follow five-year cohorts over time. For the national population of Egypt, it is likely that children were under-enumerated in the 1996 census, as the cohorts, individuals who were under 10 years of age at the time of the 1996 census, are significantly larger in the 2006 census. There could also have been an under-enumeration of children born between 1980 and 1990 based on the 1995 census of the national population of the United Arab Emirates compared to the size of that cohort as reported in the 2005 census. The size of the cohort in Morocco and Palestine appears to be fairly consistent between censuses. Figure 4. Birth cohorts by sex from multiple censuses in eight Arab countries 14
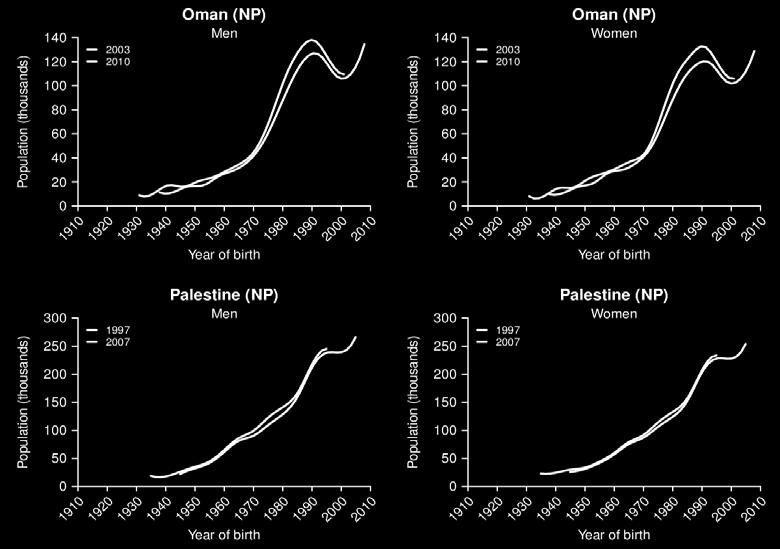
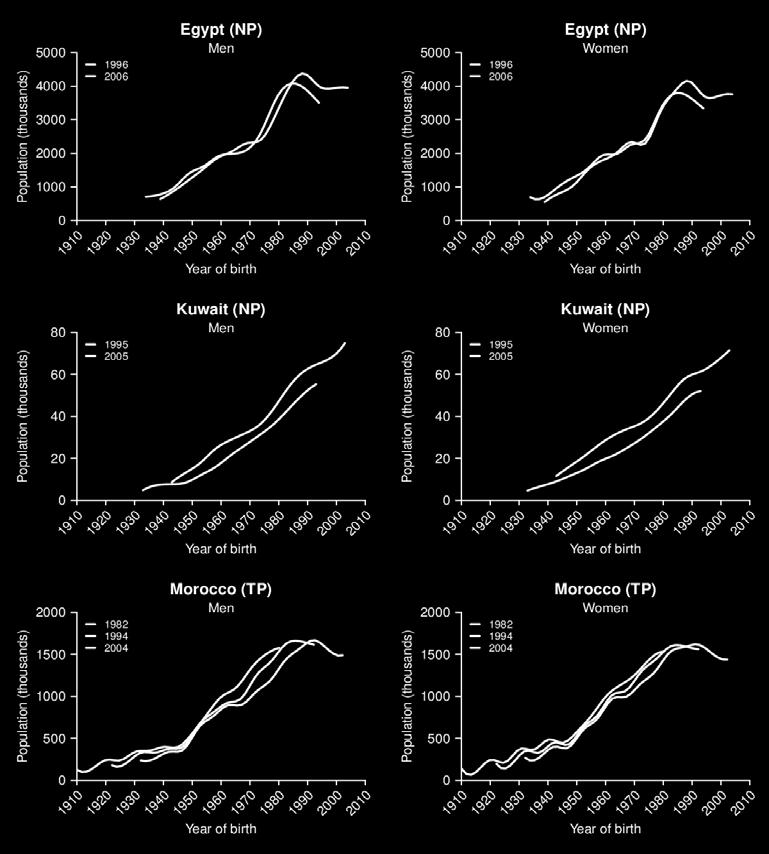
22 Figure 4 (continued) 15
 is not seen in every country.")

23 Figure 4 (continued) Note: (NP) indicates national population; (TP) indicates total population. Pattern of sex ratio by five age groups Sex ratios by birth cohort are shown in figure 5. A smoothly increasing sex ratio by year of birth (the same as a smoothly decreasing sex ratio by age) is not seen in every country. Instead, sex ratios are higher than expected in older cohorts in some countries, suggesting possible under-enumeration of women or misreporting of their ages. In Egypt, for example, the sex ratio is close to 120 for those born before 1950, according to the 2006 census. The sex ratio is also greater than 100 in Yemen for those born before 1950, according to the 2004 census. It should be noted that international migration does not account for the high sex ratios of Bahrain and the United Arab Emirates for certain birth cohorts, since the graphs show national populations. For Qatar, however, total population is displayed, so international migration does explain the high sex ratios. In Libya, data from the 2006 census show slightly lower sex ratios than expected at young ages and increasing ratios thereafter. Volatile sex ratios at older ages in Libya suggest sex-selective age misreporting or coverage errors or both. Figure 5. Sex ratio by birth cohort in 12 Arab countries, various years 16
 indicates total")
24 Figure 5 (continued) Note: (NP) indicates national population; (TP) indicates total population. 17
25 Whipple Figure 6 shows country-level Whipple indices for 12 Arab countries by sex. There appears to be little age heaping at terminal digits 0 and 5 in the most recent censuses of Jordan, Kuwait, Libya, Palestine, Qatar and the Syrian Arab Republic, since the is close to 100. Data from multiple censuses are available for Egypt, Morocco and Palestine, and all show improvements in age data over time. Severe age heaping is present in the censuses of Egypt, the Sudan and Yemen, and also in the 1982 census of Morocco. Heaping at 0 and 5 is more extreme for women than it is for men in many censuses. Figure 6. Country-level Whipple indices for 12 Arab countries by sex, various years Myers Note: (NP) indicates national population; (TP) indicates total population. Figure 7 shows the Myers for 10 Arab countries, according to the most recent census. A Myers score of less than 10 suggests little or no heaping. Jordan, Kuwait, Palestine, Qatar and the Syrian Arab Republic all scored less than 10. Higher scores suggest the age data are of poor quality. Egypt, the Sudan and Yemen each have a score greater than 30 on the Myers. In all countries, ages ending in 1, 3, 6, 7, 8 and 9 are underreported to some extent. Scores for digits 0 and 5 are highest in Egypt, the Sudan and Yemen, in agreement with the Whipple, which is also highest for those countries. 18
26 Figure 7. Myers for 10 Arab countries, most recent census Bachi Note: See annex table AI.8 for disaggregation by sex. Like the other indices, the Bachi suggests that the age data from Egypt, the Sudan and Yemen are of poor quality, and that age misreporting is minimal in Jordan, Kuwait, Morocco, Palestine, Qatar and the Syrian Arab Republic (figure 8). In all countries, there is at least some repulsion from ages ending in 1, 2, 3, 6, 7, 8 and 9. Accordingly, the attraction to ages ending with 0 or 5 is apparent (though slight) in 19
27 Jordan, Kuwait, Palestine, Qatar and the Syrian Arab Republic, and severe in Egypt, the Sudan and Yemen. When disaggregated by sex, both the Myers and Bachi indices reveal less distortion in the reporting of men s ages than women s for all countries (see annex table AI.9 for Bachi results disaggregated by sex). Figure 8. Bachi for 10 Arab countries, most recent census 20

28 United Nations age-sex accuracy (UNACI). The UNACI score is less than 20 for Jordan, Kuwait, Palestine and the Syrian Arab Republic, suggesting that grouped age data are of good quality (figure 9). Grouped data from Bahrain, Egypt, Morocco, Oman, Saudi Arabia, the United Arab Emirates and Yemen are of relatively good quality. However, data from the Sudan appear to be of poor quality, with a UNACI score over 40. Figure 9. United Nations age-sex accuracy for 13 Arab countries, most recent census Note: (NP) indicates national population; (TP) indicates total population. See annex table AI.10 for the exact UNACI values. 21
29 IV. ANALYSIS OF AGE HEAPING AT THE SUBNATIONAL LEVEL IN RECENT POPULATION CENSUSES The spread of district-level Whipple indices varies considerably across censuses. 15 Whipple indices from censuses in which severe age heaping exists tend to have much wider spreads than countries whose overall Whipple is closer to 100. Censuses can be put into two groups: those with high, variable Whipple indices and with Whipple indices that stay within a narrow range close to 100 (figure 10). The censuses of Egypt (1996 and 2006), Morocco (1982), the Sudan (2008) and South Sudan (2008) belong to the former group. The censuses of Iraq (1997), Jordan (2004), Morocco (1994 and 2004) and Palestine (1997 and 2007) belong to the latter group. A dramatic decrease in age heaping is seen between the 1982 and 1994 censuses of Morocco. Figure 10. Boxplots of district-level Whipple indices Summary statistics for predictors also vary considerably from country to country (table 4). According to the 2004 census of Jordan, 90.5 per cent of the population was literate. The 2007 census of Palestine reported 93.5 per cent literacy, while the 2008 census of South Sudan reported only 26 per cent literacy. In general, higher literacy rates also have smaller standard deviations. urban varies considerably among districts, as one might expect. Since the urban/rural determination is made at the district level in some of the census files, many districts are either 0 per cent urban or 100 per cent urban by construction. female varies very little, and ranges from 48.8 per cent in Jordan (2004) to 51.0 per cent in South Sudan (2008). female is considerably more variable in the 2008 censuses of both the Sudan and South Sudan than it is in any of the other census files (both have a standard deviation of 3 per cent or higher, while the next largest standard deviation is 1.2 per cent). The 2008 census of South Sudan records the lowest median age at 15 years old, while Morocco (2004) has the highest at 24 years old. Standard deviations of median age are fairly consistent across censuses (generally close to two years). 15 Subnational census data for Egypt, Iraq, Jordan, Morocco, Palestine and the Sudan are provided in annex II. 22
30 Country Egypt 1996 Egypt 2006 Iraq 1997 Jordan 2004 Morocco 1982 Morocco 1994 Morocco 2004 Palestine 1997 Palestine 2007 Sudan 2008 South Sudan 2008 TABLE 4. SUMMARY STATISTICS FOR PREDICTORS literate 55.6 (16.0) 66.2 (12.8) 73.8 (9.9) 90.5 (3.9) 30.4 (14.3) 42.1 (15.0) 52.4 (13.4) 86.3 (3.4) 93.5 (2.2) 56.7 (20.3) 26.0 (18.8) urban female (41.4) (0.9) (41.2) (0.9) (24.8) (0.5) (27.5) (0.6) (1.1) (1.2) (1.2) (46.3) (0.9) (36.3) (0.7) (33.1) (3.0) (25.3) (3.3) Median age 20 (2.8) 22 (2.6) 17 (1.7) 20 (1.8) 18 (1.5) 20 (2.3) 24 (2.4) 16 (2.0) 17 (2.4) 18 (2.7) 15 (2.0) in camps (32.6) 9.9 (26.3) - Note: A hyphen (-) indicates that the item is not applicable. Two dots (..) indicate that data are not available. Standard deviations (weighted by district counts) are shown in parentheses. Where severe age heaping is present, it appears to be highly correlated with predictor variables, with the exception of South Sudan (2008) (table 5). A look at pairwise correlations between the Whipple and each of the predictors reveals that literacy is most strongly correlated with age heaping in most censuses. Wealth also appears to be strongly correlated with heaping. The correlation coefficients between literacy and the Whipple are curiously positive, though small, in Jordan (2004), Palestine (2007) and South Sudan (2008), meaning there are weak associations between increased literacy and poorer quality age data at the district level in these censuses. TABLE 5. PAIRWISE CORRELATIONS WEIGHTED BY DISTRICT COUNTS BETWEEN THE WHIPPLE INDEX AND PREDICTORS Country literate Wealth urban female Median age in camps Egypt Egypt Iraq Jordan Morocco Morocco Morocco Palestine Palestine Sudan South Sudan Note: A hyphen (-) indicates that the item is not applicable. Two dots (..) indicate that data are not available. - 23
31 The sign of the correlation coefficients between the Whipple and median age is also unexpected for most censuses. Although older individuals are more likely to misreport their ages than younger individuals, at the district level, older-age areas are more likely to have better quality age data than youngerage areas. Interestingly, correlation coefficients between the Whipple and five of the six explanatory variables are the same to two decimal places for data from the censuses of Egypt of 1996 and Many of the predictors considered for the models are correlated with each other, which causes issues with collinearity for a few of the models. In particular, literacy and wealth tend to be strongly, positively correlated with each other. In the models of the 1982 census of Morocco and the 2008 census of the Sudan, wealth is removed, because it complicates the interpretation of coefficients and inflates their standard errors. In both of these censuses, there is a greater correlation between wealth and literacy than there is between either wealth or literacy and the Whipple. Figure 11 illustrates the strong correlation between wealth and literacy in the data. Thus, either wealth or literacy can be used. This study has chosen literacy simply because it does a better job of explaining the variation in the Whipple. Figure 11. Scatterplots of per cent literate vs. wealth in the 1982 census of Morocco and the 2008 census of the Sudan In most of the models, the predictors that are significant appear to have linear relationships with the response variable. Only a small number of potentially nonlinear relationships surfaced, all in the Egypt censuses (figure 12). In the 1996 census of Egypt, median age appears to have a nonlinear relationship with the Whipple. In the 2006 census of Egypt, both median age and wealth appear to have nonlinear relationships with the Whipple. Adding squared terms in the models for each of these predictors does increase the significance of the variables, but does not greatly improve the overall fit of the model. The squared terms are therefore left out of the final models. 24
32 Figure 12. Scatterplots of nonlinear relationships in the 1996 and 2006 censuses of Egypt Note: The outliner in the Egypt 1996 plot indicating a median age of 38, represents a group of districts in the Cairo governorate with populations under 20,000. Models for the censuses of Egypt (1996 and 2006), Morocco (1982) and the Sudan (2008) explain variation in Whipple quite well; adjusted R 2 values for each of these models is greater than 0.7 (table 6). Morocco (1994) also deserves mention, with an adjusted R 2 of The models for Iraq (1997), Jordan (2004), Palestine (2007) and South Sudan (2008) all fail to adequately explain changes in Whipple. It is not surprising that Whipple indices that are close to 100 are difficult to model, but the 2008 census of South Sudan stands alone as the only census whose age distribution is characterized by severe age heaping that does not lend itself to being properly modelled here. TABLE 6. EFFECTS OF DISTRICT CHARACTERISTICS ON THE WHIPPLE INDEX Egypt 1996 Egypt 2006 Morocco 1982 Morocco 1994 Morocco 2004 Palestine 1997 Sudan 2008 Intercept * (66.73) * (46.49) (104.20) * (47.64) * (31.67) * (74.36) * (39.94) literate * (0.20) * (0.14) * (0.24) (0.21) (0.18) (0.53) * (0.15) * Wealth (4.55) (3.53) (6.71) (5.12) (4.25) urban (0.04) (0.03) (0.03) 0.00 (0.07) female (1.35) 1.80 (0.94) 0.15 (1.92) (0.84) (0.61) (1.08) 3.18 * (0.65) Median age (0.76) (0.61) (2.25) 0.13 (0.92) (0.56) (0.57) (1.05) in camps (0.04) Adjusted R Note: A hyphen (-) indicates that the item is not applicable. Two dots (..) indicate that data are not available. An asterisks (*) denotes effects that are significant at the 0.05 level after p-values have been adjusted to correct for multiple testing. literate is significant in all of the best-performing models. Wealth is only significant for Egypt (1996), despite being strongly correlated with the Whipple in many of the censuses. Even in the Egypt (1996) model, the coefficient for wealth is positive, which is counterintuitive, and likely a result of collinearity. 25
Collection and dissemination of national census data through the United Nations Demographic Yearbook *
 UNITED NATIONS SECRETARIAT ESA/STAT/AC.98/4 Department of Economic and Social Affairs 08 September 2004 Statistics Division English only United Nations Expert Group Meeting to Review Critical Issues Relevant
REGIONAL WORKSHOP ON THE USE OF TECHNOLOGY IN POPULATION AND HOUSING CENSUSES IN ARAB COUNTRIES
 REGIONAL WORKSHOP ON THE USE OF TECHNOLOGY IN POPULATION AND HOUSING CENSUSES IN ARAB COUNTRIES Cairo, Egypt 29-31 January 2018 INFORMATION NOTE 1 Information Note Regional Workshop on the Use of Technology
Digit preference in Nigerian censuses data
 Digit preference in Nigerian censuses data of 1991 and 2006 Tukur Dahiru (1), Hussaini G. Dikko (2) Background: censuses in developing countries are prone to errors of age misreporting due to ignorance,
Demographic Trends in OIC Is harmonisation of data needed?
 Demographic Trends in OIC Is harmonisation of data needed? Seminar on Population and Housing Census Practices of OIC Member Countries 6-8 March 2013 Ankara, Turkey STATISTICAL, ECONOMIC AND SOCIAL RESEARCH
The Demographic situation of the Traveller Community 1 in April 1996
 Statistical Bulletin, December 1998 237 Demography The Demographic situation of the Traveller Community 1 in April 1996 Age Structure of the Traveller Community, 1996 Age group Travellers Total Population
Coverage evaluation of South Africa s last census
 Coverage evaluation of South Africa s last census *Jeremy Gumbo RMPRU, Chris Hani Baragwaneth Hospital, Johannesburg, South Africa Clifford Odimegwu Demography and Population Studies; Wits Schools of Public
United Nations, Department of Economic and Social Affairs Statistics Division, Demographic and Social Statistics Branch
 ESA/STAT/2009/9 30 March 2009 English Only United Nations, Department of Economic and Social Affairs Statistics Division, Demographic and Social Statistics Branch Technical Report on the Status of Civil
DRAFT Producing Gender Statistics through Population Censuses in the ESCWA region
 GLOBAL FORUM ON GENDER STATISTICS ESA/STAT/AC.140/7.4 10-12 DECEMBER 2007 ENGLISH ONLY ROME, ITALY DRAFT Producing Gender Statistics through Population Censuses in the ESCWA region Prepared by Ms. Neda
Department of Economic and Social Affairs 12 August 2005
 UNITED NATIONS SECRETARIAT ESA/STAT/AC.104/7 Department of Economic and Social Affairs 12 August 2005 Statistics Division English only United Nations Expert Group Meeting on the 2010 World Programme on
Digit preference in Iranian age data
 Digit preference in Iranian age data Aida Yazdanparast 1, Mohamad Amin Pourhoseingholi 2, Aliraza Abadi 3 BACKGROUND: Data on age in developing countries are subject to errors, particularly in circumstances
Some Indicators of Sample Representativeness and Attrition Bias for BHPS and Understanding Society
 Working Paper Series No. 2018-01 Some Indicators of Sample Representativeness and Attrition Bias for and Peter Lynn & Magda Borkowska Institute for Social and Economic Research, University of Essex Some
Aboriginal Demographics. Planning, Research and Statistics Branch
 Aboriginal Demographics From the 2011 National Household Survey Planning, Research and Statistics Branch Aboriginal Demographics Overview 1) Aboriginal Peoples Size Age Structure Geographic Distribution
1) Analysis of spatial differences in patterns of cohabitation from IECM census samples - French and Spanish regions
 Analysis of spatial differences in patterns of cohabitation from IECM census samples - French and Spanish regions") 1 The heterogeneity of family forms in France and Spain using censuses Béatrice Valdes IEDUB (University of Bordeaux) The deep demographic changes experienced by Europe in recent decades have resulted
1 The heterogeneity of family forms in France and Spain using censuses Béatrice Valdes IEDUB (University of Bordeaux) The deep demographic changes experienced by Europe in recent decades have resulted
An Assessment of the Age Reporting in the IPUMS-I Microdata
 An Assessment of the Age Reporting in the IPUMS-I Microdata Johanna Fajardo-González, Laura Attanasio 2, and Jasmine Trang Ha 3 Minnesota Population Center University of Minnesota Paper submitted for presentation
ANALYSIS ON THE QUALITY OF AGE AND SEX DATA COLLECTED IN THE TWO POPULATION AND HOUSING CENSUSES OF ETHIOPIA
 SINET: Ethiop. J. Sci., 29(2):123 132, 2006 Faculty of Science, Addis Ababa University, 2006 ISSN: 0379 2897 ANALYSIS ON THE QUALITY OF AGE AND SEX DATA COLLECTED IN THE TWO POPULATION AND HOUSING CENSUSES
United Nations expert group meeting on strengthening the demographic evidence base for the post-2015 development agenda, 5-6 October 2015, New York
 United Nations expert group meeting on strengthening the demographic evidence base for the post-15 development agenda, 5-6 October 15, New York Demographic Evidence from Civil Registration Systems Adriana
Supplementary questionnaire on the 2011 Population and Housing Census SWITZERLAND
 Supplementary questionnaire on the 2011 Population and Housing Census SWITZERLAND Supplementary questionnaire on the 2011 Population and Housing Census Fields marked with are mandatory. INTRODUCTION As
Understanding and Using the U.S. Census Bureau s American Community Survey
 Understanding and Using the US Census Bureau s American Community Survey The American Community Survey (ACS) is a nationwide continuous survey that is designed to provide communities with reliable and
Sunday, 19 October Day 1: Revision 3 of Principles and Recommendations for Population and Housing Censuses
 Sunday, 19 October 2014 Day 1: Revision 3 of Principles and Recommendations for Population and Housing Censuses 9:00 9:30 Registration of participants 9:30 10:00 Welcome/opening remarks AITRS, ESCWA and
Overview of the Course Population Size
 Overview of the Course Population Size CDC 103 Lecture 1 February 5, 2012 Course Description: This course focuses on the basic measures of population size, distribution, and composition and the measures
1 NOTE: This paper reports the results of research and analysis
 Race and Hispanic Origin Data: A Comparison of Results From the Census 2000 Supplementary Survey and Census 2000 Claudette E. Bennett and Deborah H. Griffin, U. S. Census Bureau Claudette E. Bennett, U.S.
Workshop on Census Data Evaluation for English Speaking African countries
 Workshop on Census Data Evaluation for English Speaking African countries Organised by United Nations Statistics Division (UNSD), in collaboration with the Uganda Bureau of Statistics Kampala, Uganda,
American Community Survey 5-Year Estimates
 DP02 SELECTED SOCIAL CHARACTERISTICS IN THE UNITED STATES 2012-2016 American Community Survey 5-Year Estimates Supporting documentation on code lists, subject definitions, data accuracy, and statistical
American Community Survey 5-Year Estimates
 DP02 SELECTED SOCIAL CHARACTERISTICS IN THE UNITED STATES 2011-2015 American Community Survey 5-Year Estimates Supporting documentation on code lists, subject definitions, data accuracy, and statistical
; ECONOMIC AND SOCIAL COUNCIL
 Distr.: GENERAL ECA/DISD/STAT/RPHC.WS/ 2/99/Doc 1.4 2 November 1999 UNITED NATIONS ; ECONOMIC AND SOCIAL COUNCIL Original: ENGLISH ECONOMIC AND SOCIAL COUNCIL Training workshop for national census personnel
Measuring Multiple-Race Births in the United States
 Measuring Multiple-Race Births in the United States By Jennifer M. Ortman 1 Frederick W. Hollmann 2 Christine E. Guarneri 1 Presented at the Annual Meetings of the Population Association of America, San
Zambia - Demographic and Health Survey 2007
 Microdata Library Zambia - Demographic and Health Survey 2007 Central Statistical Office (CSO) Report generated on: June 16, 2017 Visit our data catalog at: http://microdata.worldbank.org 1 2 Sampling
INTEGRATED COVERAGE MEASUREMENT SAMPLE DESIGN FOR CENSUS 2000 DRESS REHEARSAL
 INTEGRATED COVERAGE MEASUREMENT SAMPLE DESIGN FOR CENSUS 2000 DRESS REHEARSAL David McGrath, Robert Sands, U.S. Bureau of the Census David McGrath, Room 2121, Bldg 2, Bureau of the Census, Washington,
COMPONENTS OF POPULATION GROWTH IN SEOUL: * Eui Young Y u. California State College, Los Angeles
 COMPONENTS OF POPULATION GROWTH IN SEOUL: 1960-1966* Eui Young Y u California State College, Los Angeles A total of 2, 445, 000 persons were counted within the boundary of Seoul at the time of the 1960
Meeting on a Core Set of Census Topics for ESCWA Countries
 United Nations Statistics Division ESCWA Central Agency for Public Mobilization and Statistics (CAPMAS) Meeting on a Core Set of Census Topics for ESCWA Countries Cairo 8-12 June 2002 Report 1 1. Introduction
1981 CENSUS COVERAGE OF THE NATIVE POPULATION IN MANITOBA AND SASKATCHEWAN
 RESEARCH NOTES 1981 CENSUS COVERAGE OF THE NATIVE POPULATION IN MANITOBA AND SASKATCHEWAN JEREMY HULL, WMC Research Associates Ltd., 607-259 Portage Avenue, Winnipeg, Manitoba, Canada, R3B 2A9. There have
Economic and Social Council
 United Nations Economic and Social Council ECE/CES/GE.41/2013/3 Distr.: General 15 August 2013 Original: English Economic Commission for Europe Conference of European Statisticians Group of Experts on
Methods and Techniques Used for Statistical Investigation
 Methods and Techniques Used for Statistical Investigation Podaşcă Raluca Petroleum-Gas University of Ploieşti raluca.podasca@yahoo.com Abstract Statistical investigation methods are used to study the concrete
A Country paper on Population and Housing census of Nepal and Consideration for Electronic data capture
 Regional Workshop on the Use of Electronic Data Collection Technologies in Population and Housing Censuses 24-26 January, 2018 Bangkok, Thailand A Country paper on Population and Housing census of Nepal
East -West Population Institute. Accuracy of Age Data
 ON ESTIMATING ANNUAL BIRTH RATES FROM CENSUS DATA ON CHILDREN Lee -Jay Cho, East -West Population Institute and University of Hawaii I. INTRODUCTION For the majority of the world's population, the registration
RE: Land at Boundary Hall, Aldermaston Road, Tadley. INSPECTORATE REF: APP/H1705/V/10/
 APPLICATION BY: Cala Homes RE: Land at Boundary Hall, Aldermaston Road, Tadley. INSPECTORATE REF: APP/H1705/V/10/2124548 LOCAL AUTHORITY REF: BDB/67609 Prepared by: Mr Geoff Gosling Intelligence Officer,
Supplementary questionnaire on the 2011 Population and Housing Census FRANCE
 Supplementary questionnaire on the 2011 Population and Housing Census FRANCE Supplementary questionnaire on the 2011 Population and Housing Census Fields marked with are mandatory. INTRODUCTION As agreed
Sierra Leone - Multiple Indicator Cluster Survey 2017
 Microdata Library Sierra Leone - Multiple Indicator Cluster Survey 2017 Statistics Sierra Leone, United Nations Children s Fund Report generated on: September 27, 2018 Visit our data catalog at: http://microdata.worldbank.org
2016 Census of Population: Age and sex release
 Catalogue no. 98-501-X2016002 ISBN 978-0-660-07150-3 Release and Concepts Overview 2016 Census of Population: Age and sex release Release date: March 15, 2017 Please note that this Release and Concepts
Prepared by. Deputy Census Manager Zambia
 Intergrated Public Use Microdata Series-International ti (IPUMS) Country Report Census Micro Data Conference Prepared by Nchimunya Nkombo Deputy Census Manager Zambia History of Census Taking in Zambia
CCG 360 o Stakeholder Survey
 July 2017 CCG 360 o Stakeholder Survey National report NHS England Publications Gateway Reference: 06878 Ipsos 16-072895-01 Version 1 Internal Use Only MORI This Terms work was and carried Conditions out
Economic and Social Council
 United Nations Economic and Social Council Distr.: General 18 December 2017 Original: English Statistical Commission Forty-ninth session 6 9 March 2018 Item 4 (a) of the provisional agenda* Items for information:
Poverty in the United Way Service Area
 Poverty in the United Way Service Area Year 2 Update 2012 The Institute for Urban Policy Research At The University of Texas at Dallas Poverty in the United Way Service Area Year 2 Update 2012 Introduction
Italian Americans by the Numbers: Definitions, Methods & Raw Data
 Tom Verso (January 07, 2010) The US Census Bureau collects scientific survey data on Italian Americans and other ethnic groups. This article is the eighth in the i-italy series Italian Americans by the
CONTRIBUTIONS OF THE INTERNATIONAL METROPOLIS PROJECT TO THE GLOBAL DISCUSSIONS ON THE RELATIONS BETWEEN MIGRATION AND DEVELOPMENT 1.
 UN/POP/MIG-16CM/2018/11 12 February 2018 SIXTEENTH COORDINATION MEETING ON INTERNATIONAL MIGRATION Population Division Department of Economic and Social Affairs United Nations Secretariat New York, 15-16
SELECTED SOCIAL CHARACTERISTICS IN THE UNITED STATES American Community Survey 5-Year Estimates
 DP02 SELECTED SOCIAL CHARACTERISTICS IN THE UNITED STATES 2010-2014 American Community Survey 5-Year Estimates Supporting documentation on code lists, subject definitions, data accuracy, and statistical
PREPARATIONS FOR THE PILOT CENSUS. Supporting paper submitted by the Central Statistical Office of Poland
 Distr. GENERAL CES/SEM.40/22 15 September 1998 ENGLISH ONLY STATISTICAL COMMISSION and ECONOMIC COMMISSION FOR EUROPE STATISTICAL OFFICE OF THE EUROPEAN COMMUNITIES (EUROSTAT) CONFERENCE OF EUROPEAN STATISTICIANS
REPORT ON THE EUROSTAT 2017 USER SATISFACTION SURVEY
 EUROPEAN COMMISSION EUROSTAT Directorate A: Cooperation in the European Statistical System; international cooperation; resources Unit A2: Strategy and Planning REPORT ON THE EUROSTAT 2017 USER SATISFACTION
Demographic and Social Statistics in the United Nations Demographic Yearbook*
 UNITED NATIONS SECRETARIAT Background document Department of Economic and Social Affairs September 2008 Statistics Division English only United Nations Expert Group Meeting on the Scope and Content of
IM M IG RAN TS AN D TH E IR CHILDREN, ^
 232 The Milbank Memorial Fund Quarterly proportion of the time, sampling fluctuations will yield samples in which the relationships between a control factor and the independent and dependent variables
SURVEY ON USE OF INFORMATION AND COMMUNICATION TECHNOLOGY (ICT)
") 1. Contact SURVEY ON USE OF INFORMATION AND COMMUNICATION TECHNOLOGY (ICT) 1.1. Contact organization: Kosovo Agency of Statistics KAS 1.2. Contact organization unit: Social Department Living Standard Sector
1. Contact SURVEY ON USE OF INFORMATION AND COMMUNICATION TECHNOLOGY (ICT) 1.1. Contact organization: Kosovo Agency of Statistics KAS 1.2. Contact organization unit: Social Department Living Standard Sector
Chapter 1 Population, households and families
 The World s Women 2005: Progress in Statistics 7 Chapter 1 Population, households and families gender inequities have significant influences on, and are in turn influenced by, demographic parameters such
Population Censuses and Migration Statistics. Keiko Osaki Tomita, Ph.D.
 Population Censuses and Migration Statistics Keiko Osaki Tomita, Ph.D. Global Compact for Safe, Orderly and Regular Migration Objective 1: Collect and utilize accurate and disaggregated data as a basis
MATRIX SAMPLING DESIGNS FOR THE YEAR2000 CENSUS. Alfredo Navarro and Richard A. Griffin l Alfredo Navarro, Bureau of the Census, Washington DC 20233
 MATRIX SAMPLING DESIGNS FOR THE YEAR2000 CENSUS Alfredo Navarro and Richard A. Griffin l Alfredo Navarro, Bureau of the Census, Washington DC 20233 I. Introduction and Background Over the past fifty years,
Adjusting for linkage errors to analyse coverage of the Integrated Data Infrastructure (IDI) and the administrative population (IDI-ERP)
 and the administrative population (IDI-ERP)") Adjusting for linkage errors to analyse coverage of the Integrated Data Infrastructure (IDI) and the administrative population (IDI-ERP) Hochang Choi, Statistical Analyst, Stats NZ Paper prepared for the
Adjusting for linkage errors to analyse coverage of the Integrated Data Infrastructure (IDI) and the administrative population (IDI-ERP) Hochang Choi, Statistical Analyst, Stats NZ Paper prepared for the
Evaluation of the Completeness of Birth Registration in China Using Analytical Methods and Multiple Sources of Data (Preliminary draft)
") United Nations Expert Group Meeting on "Methodology and lessons learned to evaluate the completeness and quality of vital statistics data from civil registration" New York, 3-4 November 2016 Evaluation
United Nations Expert Group Meeting on "Methodology and lessons learned to evaluate the completeness and quality of vital statistics data from civil registration" New York, 3-4 November 2016 Evaluation
The Population Estimation Survey (PESS)
") Population Estimation Survey The Population Estimation Survey (PESS) December, 2013 update Appreciation Note The PESS became a reality due to generous contributions, tangible support and commitment of
Population Estimation Survey The Population Estimation Survey (PESS) December, 2013 update Appreciation Note The PESS became a reality due to generous contributions, tangible support and commitment of
Chapter 12: Sampling
 Chapter 12: Sampling In all of the discussions so far, the data were given. Little mention was made of how the data were collected. This and the next chapter discuss data collection techniques. These methods
Female population and number of live-born children in Montenegro
 MONTENEGRO STATISTICAL OFFICE RELEASE Number 77 Podgorica, 17 April 2012 Name the source when using the data Female population and number of live-born children in Montenegro Census of Population, Households
Monday, 1 December 2014
 Monday, 1 December 2014 9:30 10:00 Welcome/opening remarks Introduction of the participants 10:00-11:00 Introduction to evaluation of census data Objectives of evaluation of census data, types and sources
Lessons learned from a mixed-mode census for the future of social statistics
 Lessons learned from a mixed-mode census for the future of social statistics Dr. Sabine BECHTOLD Head of Department Population, Finance and Taxes, Federal Statistical Office Germany Abstract. This paper
Identifying inter-censal drift between 1991 and 2007 in population estimates for England and Wales
 Identifying inter-censal drift between 1991 and 2007 in population estimates for England and Wales Sofie De Broe, Nicola Tromans, Steve Smallwood, Julie Jefferies Note: this paper is work in progress and
Overview of available data and data sources on birth registration. Claudia Cappa Data & Analytics Section, UNICEF
 Overview of available data and data sources on birth registration Claudia Cappa Data & Analytics Section, UNICEF Outline Overview of available data and data sources on birth registration Presentation of
Using Administrative Records for Imputation in the Decennial Census 1
 Using Administrative Records for Imputation in the Decennial Census 1 James Farber, Deborah Wagner, and Dean Resnick U.S. Census Bureau James Farber, U.S. Census Bureau, Washington, DC 20233-9200 Keywords:
Socio-Economic Status and Names: Relationships in 1880 Male Census Data
 1 Socio-Economic Status and Names: Relationships in 1880 Male Census Data Rebecca Vick, University of Minnesota Record linkage is the process of connecting records for the same individual from two or more
Produced by the BPDA Research Division:
 Produced by the BPDA Research Division: Alvaro Lima Director Jonathan Lee Deputy Director Christina Kim Research Manager Phillip Granberry Senior Researcher/Demographer Matthew Resseger Senior Researcher/Economist
Proceedings of the Annual Meeting of the American Statistical Association, August 5-9, 2001
 Proceedings of the Annual Meeting of the American Statistical Association, August 5-9, 2001 COVERAGE MEASUREMENT RESULTS FROM THE CENSUS 2000 ACCURACY AND COVERAGE EVALUATION SURVEY Dawn E. Haines and
Estimation of the number of Welsh speakers in England
 Estimation of the number of ers in England Introduction The number of ers in England is a topic of interest as they must represent the major part of the -ing diaspora. Their numbers have been the matter
Lesson Learned from the 2010 Indonesia Population and Housing Census Dudy S. Sulaiman, BPS-Statistics Indonesia
 Lesson Learned from the 2010 Indonesia Population and Housing Census Dudy S. Sulaiman, BPS-Statistics Indonesia I. Introduction As widely known that census has been a world heritage of the civilized nation.
Indonesia - Demographic and Health Survey 2007
 Microdata Library Indonesia - Demographic and Health Survey 2007 Central Bureau of Statistics (Badan Pusat Statistik (BPS)) Report generated on: June 16, 2017 Visit our data catalog at: http://microdata.worldbank.org
population and housing censuses in Viet Nam: experiences of 1999 census and main ideas for the next census Paper prepared for the 22 nd
 population and housing censuses in Viet Nam: experiences of 1999 census and main ideas for the next census Paper prepared for the 22 nd Population Census Conference Seattle, Washington, USA, 7 9 March
Estimation Methodology and General Results for the Census 2000 A.C.E. Revision II Richard Griffin U.S. Census Bureau, Washington, DC 20233
 Estimation Methodology and General Results for the Census 2000 A.C.E. Revision II Richard Griffin U.S. Census Bureau, Washington, DC 20233 1. Introduction 1 The Accuracy and Coverage Evaluation (A.C.E.)
1996 CENSUS: ABORIGINAL DATA 2 HIGHLIGHTS
 Catalogue 11-001E (Français 11-001F) ISSN 0827-0465 Tuesday, January 13, 1998 For release at 8:30 a.m. CENSUS: ABORIGINAL DATA 2 HIGHLIGHTS In the Census, nearly 800,000 people reported that they were
Census 2000 and its implementation in Thailand: Lessons learnt for 2010 Census *
 UNITED NATIONS SECRETARIAT ESA/STAT/AC.97/9 Department of Economic and Social Affairs 08 September 2004 Statistics Division English only United Nations Symposium on Population and Housing Censuses 13-14
Section 2: Preparing the Sample Overview
 Overview Introduction This section covers the principles, methods, and tasks needed to prepare, design, and select the sample for your STEPS survey. Intended audience This section is primarily designed
Turkmenistan - Multiple Indicator Cluster Survey
 Microdata Library Turkmenistan - Multiple Indicator Cluster Survey 2015-2016 United Nations Children s Fund, State Committee of Statistics of Turkmenistan Report generated on: February 22, 2017 Visit our
Department for International Economic and Social Information and Policy Analysis
 St/ESA/STAT/SER.F/54(Part IV) Department for International Economic and Social Information and Policy Analysis Statistics Division Studies in Methods Series F No. 54 (Part IV) Handbook of Population and
0-4 years: 8% 7% 5-14 years: 13% 12% years: 6% 6% years: 65% 66% 65+ years: 8% 10%
 The City of Community Profiles Community Profile: The City of Community Profiles are composed of two parts. This document, Part A Demographics, contains demographic information from the 2014 Civic Census
Montenegro - Multiple Indicator Cluster Survey Roma Settlements
 Microdata Library Montenegro - Multiple Indicator Cluster Survey 2013 - Roma Settlements United Nations Children s Fund, Statistical Office of Montenegro Report generated on: October 15, 2015 Visit our
Tabling of Stewart Clatworthy s Report: An Assessment of the Population Impacts of Select Hypothetical Amendments to Section 6 of the Indian Act
 Tabling of Stewart Clatworthy s Report: An Assessment of the Population Impacts of Select Hypothetical Amendments to Section 6 of the Indian Act In summer 2017, Mr. Clatworthy was contracted by the Government
Overview of Demographic Data
 Overview of Demographic Data Michael Ratcliffe Geography Division US Census Bureau Mapping Sciences Committee October 20, 2014 Sources of Demographic Data Censuses Full enumeration, or counting, of the
Ghana - Ghana Living Standards Survey
 Microdata Library Ghana - Ghana Living Standards Survey 5+ 2008 Institute of Statistical, Social and Economic Research - University of Ghana Report generated on: June 11, 2015 Visit our data catalog at:
Guyana - Multiple Indicator Cluster Survey 2014
 Microdata Library Guyana - Multiple Indicator Cluster Survey 2014 United Nations Children s Fund, Guyana Bureau of Statistics, Guyana Ministry of Public Health Report generated on: December 1, 2016 Visit
2011 National Household Survey (NHS): design and quality
: design and quality") 2011 National Household Survey (NHS): design and quality Margaret Michalowski 2014 National Conference Canadian Research Data Center Network (CRDCN) Winnipeg, Manitoba, October 29-31, 2014 Outline of the
2011 National Household Survey (NHS): design and quality Margaret Michalowski 2014 National Conference Canadian Research Data Center Network (CRDCN) Winnipeg, Manitoba, October 29-31, 2014 Outline of the
Technical Papers Number 33 October 1988
 Technical Papers Number 33 October 1988 --------_._---------------_.._-- o ORGANIZATION AND STATUS OF CIVIL REGISTRATION AND VITAL STATISTICS IN THE ARAB COUNTRIES Cllnternational Institute for Vital Registration
Replicating an International Survey on User Experience: Challenges, Successes and Limitations
 Replicating an International Survey on User Experience: Challenges, Successes and Limitations Carine Lallemand Public Research Centre Henri Tudor 29 avenue John F. Kennedy L-1855 Luxembourg Carine.Lallemand@tudor.lu
A QUALITY ASSURANCE STRATEGY IN MALAYSIA 2020 POPULATION AND HOUSING CENSUS
 United Nations Regional Workshop on The 2020 World Programme on Population and Housing Censuses: International Standards and Contemporary Technologies SESSION 6: A QUALITY ASSURANCE IN POPULATION AND HOUSING
Economic and Social Council
 UNITED NATIONS E Economic and Social Council Distr. GENERAL ECE/CES/2006/24 29 March 2006 ENGLISH Original: FRENCH ECONOMIC COMMISSION FOR EUROPE STATISTICAL COMMISSION CONFERENCE OF EUROPEAN STATISTICIANS
MODERN CENSUS IN POLAND
 United Nations International Seminar on Population and Housing Censuses: Beyond the 2010 Round 27-29 November 2012 Seoul, Republic of Korea SESSION 7: Use of modern technologies for censuses MODERN CENSUS
The 2006 Minnesota Internet Study Broadband enters the mainstream
 CENTER for RURAL POLICY and DEVELOPMENT April 2007 The 2006 Minnesota Study enters the mainstream A PDF of this report can be downloaded from the Center s web site at www.ruralmn.org. 2007 Center for Policy
Blow Up: Expanding a Complex Random Sample Travel Survey
 10 TRANSPORTATION RESEARCH RECORD 1412 Blow Up: Expanding a Complex Random Sample Travel Survey PETER R. STOPHER AND CHERYL STECHER In April 1991 the Southern California Association of Governments contracted
Country Paper : Macao SAR, China
 Macao China Fifth Management Seminar for the Heads of National Statistical Offices in Asia and the Pacific 18 20 September 2006 Daejeon, Republic of Korea Country Paper : Macao SAR, China Government of
Recall Bias on Reporting a Move and Move Date
 Recall Bias on Reporting a Move and Move Date Travis Pape, Kyra Linse, Lora Rosenberger, Graciela Contreras U.S. Census Bureau 1 Abstract The goal of the Census Coverage Measurement (CCM) for the 2010
Strategies for the 2010 Population Census of Japan
 The 12th East Asian Statistical Conference (13-15 November) Topic: Population Census and Household Surveys Strategies for the 2010 Population Census of Japan Masato CHINO Director Population Census Division
Notes on the 2014 ACS 5-Year Estimates
 Notes on the 2014 ACS 5-Year Estimates Eric Guthrie, Michigan s State Demographer December 3, 2015 The U.S. Census Bureau has released the 2014 American Community Survey (ACS) 5-year estimates. The 5-year
Table 5 Population changes in Enfield, CT from 1950 to Population Estimate Total
 This chapter provides an analysis of current and projected populations within the Town of Enfield, Connecticut. A review of current population trends is invaluable to understanding how the community is
The American Community Survey Motivation, History, and Design. Workshop on the American Community Survey Havana, Cuba November 16, 2010
 The American Community Survey Motivation, History, and Design Workshop on the American Community Survey Havana, Cuba November 16, 2010 1 Outline What is the ACS? Motivation and design goals Key ACS historical
Monitoring the SDGs by means of the census
 RESEARCH BRIEF Monitoring the SDGs by means of the census RESEARCH LEAD: TOM A MOULTRIE, UNIVERSITY OF CAPE TOWN - CENTRE FOR ACTUARIAL RESEARCH 1 CONCEPT DEFINING IDEAS Population-related elements are
ELECTRONIC RESOURCES FOR LOCAL POPULATION STUDIES DEMOGRAPHIC PROCESSES IN ENGLAND AND WALES, : DATA AND MODEL ESTIMATES
 ELECTRONIC RESOURCES FOR LOCAL POPULATION STUDIES DEMOGRAPHIC PROCESSES IN ENGLAND AND WALES, 1851 1911: DATA AND MODEL ESTIMATES Dov Friedlander and Barbara S. Okun 1 Dov Friedlander is Professor Emeritus
Dual circulation period in Slovakia
 Flash Eurobarometer 255 The Gallup Organization Analytical Report Flash Eurobarometer European Commission Dual circulation period in Slovakia Analytical report Fieldwork: uary 2009 Report: March 2009 This