TOPOGRAPHIC MAPS A NEW WAY TO VIEW THE WORLD!
|
|
|
- Estella Stanley
- 6 years ago
- Views:
Transcription
1 TOPOGRAPHIC MAPS A NEW WAY TO VIEW THE WORLD!

2 A topographic map, simply put, is a two-dimensional representation of a portion of the threedimensional surface of the earth. Figure 1


3 Topography is the shape of the land surface. Figure 2 Topographic maps exist to represent the land surface.
4 What are topographic maps used for? Topographic maps usually portray (show) both natural and man-made features. They show and name features including mountains, valleys, plains, lakes, rivers and vegetation.
5 What are topographic maps used for? Topographic maps are used for engineering, energy exploration, natural resource conservation, environmental management, public works design, commercial and residential planning, and outdoor activities like hiking, camping, and fishing.
6 Tools of the Trade Map Scale: Maps come in a variety of scales, covering areas ranging from the entire earth to a city block (or less).
7 Overhead View Profile View Figure 3
8 Contour Lines: Contour lines are used to determine elevations. If you walk along a contour line you neither gain or lose elevation. Figure 4
9 Figure 5 Picture walking along a beach exactly where the water meets the land The water surface marks an elevation we call sea level, or zero. As you walk along the shore your elevation will remain the same, you will be following a contour line.
 is below sea level.")
10 If you stray from the shoreline and start walking down into the ocean, the elevation of the ground (in this case the seafloor) is below sea level. If you stray the other direction and walk up the beach your elevation will be above sea level.
11 Topographic Map RULES Contour lines do not cross each other. In fact, contour lines can never touch each other. Contours that are spaced close together represent steep slopes. Contour lines that are spaced far apart represent gentle slopes.
12 Profile and Aerial Views Draw a picture in the left box that represents a side or profile view.
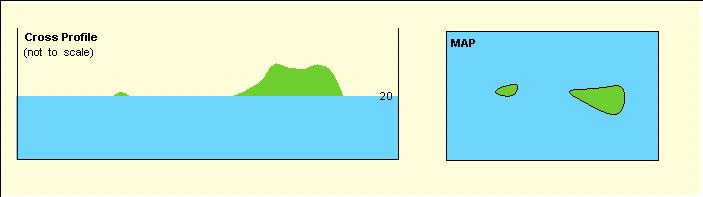
13 Contour lines are useful because they allow us to show the shape of the land surface (topography) on a map. The two diagrams below illustrate the same island. The diagram on the left is a view from the side (cross profile view) such as you would see from a ship offshore. The diagram at right is a view from above (map view) such as you would see from an airplane flying over the island. Figure 6

14 Compare these two topographic maps
15 The lines on a map are the contour lines The numbers on the line represent different elevations. These are called intervals.
16 PROFILE AERIAL intervals Contour lines Label the intervals and contour lines Label the profile and aerial views

17 So how do you read a topographic map? Follow along as we discuss Points A-E on this map.
18 Point A = 0 ft Point A sits right on the 0 ft contour line. Since all points on this line have an elevation of 0 ft, the elevation of point A is zero.
19 Point B = 10 ft. Point B sits right on the 10 ft contour line. Since all points on this line have an elevation of 10 ft, the elevation of point B is 10 ft.
20 Point C ~?ft. Point C does not sit directly on a contour line so we can not determine the elevation precisely. We do know that point C is between the 10 ft and 20 ft contour lines so its elevation must be greater than 10 ft and less than 20 ft.
21 WHAT IS THE ELEVATION OF POINT C? 15 ft
22 Point D ~? ft. We are even less sure of the elevation of point D than point C. Point D is inside the 20 ft. contour line indicating its elevation is above 20 ft. Its elevation has to be less than 30 ft. because there is no 30 ft. contour line shown. But how much less?
23 There is no way to tell. The elevation could be 21 ft, or it could be 29 ft. There is no way to tell from the map. Point D = 25 ft.
24 Point E ~? ft Just as with point C above, we need to estimate the elevation of point E somewhere between the 0 ft and 10 ft contour lines it lies in between. Because this point is closer to the 10 ft line than the 0 ft. line we estimate an elevation closer to 10. In this case 8 ft. seems reasonable.
25 Point E ~ 8 ft

26 Topographic map examples Sometimes topographic maps show islands

27 Sometimes topographic maps show canyons

28 Sometimes they show mountains.

29 Sometimes they are simple Sometimes they are complicated

30 Sometimes they show many landforms over a large region. Sometimes they show a single landform in detail.
31 Credits Page Figure 1: Figure 2: Figure 3 Figure 4: %20Delineate%20Watersheds1.pdf 20Watersheds1.pdf Figure 5:
Module 2: Mapping Topic 3 Content: Topographic Maps Presentation Notes. Topographic Maps
 Topographic Maps 1 Take a few moments to study the map shown here of Isolation Peak, Colorado. What land features do you notice? Do you thinking hiking through this area would be easy? Did you see the
Lab #4 Topographic Maps and Aerial Photographs
 Lab #4 Topographic Maps and Aerial Photographs Purpose To familiarize you with using topographic maps. Visualizing the shape of landforms from topographic maps is an essential skill in geology. Proficiency
Lab #8: Topographic Map Lab
 NAME: LAB TIME: TA NAME: Lab #8: Topographic Map Lab Topography is the shape of the land. Topographic maps are used to aid in the visualization of the shape of the land. Topographic maps include the accurate
ENVI.2030L Topographic Maps and Profiles
 Name ENVI.2030L Topographic Maps and Profiles I. Introduction A map is a miniature representation of a portion of the earth's surface as it appears from above. The environmental scientist uses maps as
PRE-LAB for: Introduction to Aerial Photographs and Topographic maps (Ch. 3)
") GEOLOGY 306 Laboratory Instructor: TERRY J. BOROUGHS NAME: PRE-LAB for: Introduction to Aerial Photographs and Topographic maps (Ch. 3) For this assignment you will require: a calculator and metric ruler.
GEOLOGY 306 Laboratory Instructor: TERRY J. BOROUGHS NAME: PRE-LAB for: Introduction to Aerial Photographs and Topographic maps (Ch. 3) For this assignment you will require: a calculator and metric ruler.
BACKGROUND INFORMATION
 Build an Island INTRODUCTION For this assignment, you will be creating a topographic map and three-dimensional model of a fictional island that you have designed. You will start by exploring some basic
Introduction to Aerial Photographs and Topographic maps (Chapter 3)
") GEOLOGY 306 Laboratory Instructor: TERRY J. BOROUGHS NAME: Introduction to Aerial Photographs and Topographic maps (Chapter 3) For this assignment you will require: a calculator and metric ruler. Objectives:
GEOLOGY 306 Laboratory Instructor: TERRY J. BOROUGHS NAME: Introduction to Aerial Photographs and Topographic maps (Chapter 3) For this assignment you will require: a calculator and metric ruler. Objectives:
Topographic Maps. Contour Lines
 Topographic Maps Our first task today will consist of locating ourselves with the help of a topographic map. GPS units that can tell you the location of any Dunkin' Donuts within a five mile radius. Paper
Introduction to Aerial Photographs and Topographic maps (Chapter 7, 9 th edition) or (chapter 3, 8 th edition)
 or (chapter 3, 8 th edition)") GEOLOGY 306 Laboratory Instructor: TERRY J. BOROUGHS NAME: Introduction to Aerial Photographs and Topographic maps (Chapter 7, 9 th edition) or (chapter 3, 8 th edition) For this assignment you will require:
GEOLOGY 306 Laboratory Instructor: TERRY J. BOROUGHS NAME: Introduction to Aerial Photographs and Topographic maps (Chapter 7, 9 th edition) or (chapter 3, 8 th edition) For this assignment you will require:
Name: Topographic Profiles Multiple Choice
 1. Base your answer to the following question on the topographic map below. Points A and B represent locations on the map. Elevations are shown in meters. Which diagram best represents the topographic
NAME: PERIOD: DATE: LAB PARTNERS: LAB #6 DRAWING A CONTOUR MAP FROM A THREE DIMENSIONAL MODEL
 NAME: PERIOD: DATE: LAB PARTNERS: LAB #6 DRAWING A CONTOUR MAP FROM A THREE DIMENSIONAL MODEL INTRODUCTION Since land distances and elevations on the earth's surface can be very great it is necessary to
Shoe Box Activity Constructing a Topographic Map
 Shoe Box Activity Constructing a Topographic Map Background Information All maps are models of some feature of the real world. The kind of map oen used by scientists is called a contour or topographic
Ch. 1.3: Topographic Maps
 Ch. 1.3: Topographic Maps StudentS will be able to Explain what are topographic maps Read a topographic map Create a topographic map "Geologists don't dislike classical music, they just prefer rock." Topographic
Surveying & Measurement. Detail Survey Topographic Surveying
 Surveying & Measurement Detail Survey Topographic Surveying Introduction Mapping surveys are made to determine the relief of the earth s surface and locate critical points on it. to determine the locations
COPYRIGHTED MATERIAL. Contours and Form DEFINITION
 1 DEFINITION A clear understanding of what a contour represents is fundamental to the grading process. Technically defined, a contour is an imaginary line that connects all points of equal elevation above
1. The topographic map below shows a depression contour line on Earth's surface.
 1. The topographic map below shows a depression contour line on Earth's surface. Points A, B, C, and D represent surface locations. Contour line elevations are in feet. Which profile best shows the topography
AutoCAD 2016 for Civil Engineering Applications
 Introduction to AutoCAD 2016 for Civil Engineering Applications Learning to use AutoCAD for Civil Engineering Projects Nighat Yasmin Ph.D. SDC P U B L I C AT I O N S Better Textbooks. Lower Prices. www.sdcpublications.com
Earth Sciences 089G Short Practical Assignment #4 Working in Three Dimensions
 Earth Sciences 089G Short Practical Assignment #4 Working in Three Dimensions Introduction Maps are 2-D representations of 3-D features, the developers of topographic maps needed to devise a method for
MAKE A CO NTO U R MAP
 Your web browser (Safari 7) is out of date. For more security, comfort and the best experience on this site: Update your browser Ignore Activitydevelop Student Version MAKE A CO NTO U R MAP How does a
A contour line is a line that passes through points having the same elevation.* Definition
 Contour Lines A contour line is a line that passes through points having the same elevation.* Definition Eleven (11) characteristics of contour lines 1. Contour lines are continuous. 2. Contour lines are
Topography and Contouring Teaching Assistant Guide
 Topography and Contouring Teaching Assistant Guide Learning Objectives: At the end of the exercise the students will be able to read a contour map contour data draw a topographic profiles Getting Started
Maps and map interpretation An introduction for geoscientists
 Maps and map interpretation An introduction for geoscientists Produced by the University of Derby in conjunction with UKOGL Aims This teaching package provides an introduction to maps and how to identify
Title: How steep are those hills? Engineering Grade: Estimated Time: 3 hours (2 days) Groups: 3 to 4 students
 Groups: 3 to 4 students") Title: How steep are those hills? Engineering Grade: 10-12 Estimated Time: 3 hours (2 days) Groups: 3 to 4 students Synopsis: Students will be able to understand the concept of surveying and mapping ground
Title: How steep are those hills? Engineering Grade: 10-12 Estimated Time: 3 hours (2 days) Groups: 3 to 4 students Synopsis: Students will be able to understand the concept of surveying and mapping ground
AIM. What is-a contour map? 23-
 .. '; AIM 23- What is-a contour map?.,,.,, I. There are many different kinds of maps. The maps we use most often are surface maps. A surface map is a drawing. It shows all or part of the earth's surface.
Gradient and Rate of Change
 Name: 1. Base your answer(s) to the following question(s) on the topographic map shown below. Letters A, B, C, and D represent locations on Earth s surface. The symbol marks the highest elevation on Patty
Land Navigation / Map Reading
 Land Navigation / Map Reading What is the Field Manual for map reading and land navigation? FM 3-25.26 What are the basic colors of a map, and what does each color represent? Black - Indicates cultural
31, The following isoline map shows the variations in the relative strength of Earth's magnetic field from 1 (strong) to 11 (weak).
 to 11 (weak).") 31, The following isoline map shows the variations in the relative strength of Earth's magnetic field from 1 (strong) to 11 (weak). 33. The following four temperature field maps represent the same region
31, The following isoline map shows the variations in the relative strength of Earth's magnetic field from 1 (strong) to 11 (weak). 33. The following four temperature field maps represent the same region
CONTOURS SURVEYING 1 CE 215 CHAPTER -3- Ishik University / Sulaimani Civil Engineering Department 12/7/2017. Ishik University / Sulaimani
 Civil Engineering Department SURVEYING 1 CE 215 CHAPTER -3- CONTOURS 1 2 1 3 4 2 PURPOSE OF CONTOURING Contour survey is carried out at the starting of any engineering project such as a road, a railway,
CHAPTER 3-LAB 1: A TOPOGRAPHIC MAP IN THREE DIMENSIONS
 Name Teacher Period Date CHAPTER 3-LAB 1: A TOPOGRAPHIC MAP IN THREE DIMENSIONS Introduction A topographic map shows the shape ofthe land surface with contour lines. On page 29 you will find Figure 3-6,
Slope analysis & Grading. Earth shape and earthwork Topographic map Slope form Slope analysis Grading
 6 Slope analysis & Grading Earth shape and earthwork Topographic map Slope form Slope analysis Grading 81 Topographic Map Topographic Contour map Topographic contour map are composed of a series of line
Watershed Topography
 Watershed Topography Adapted from: An original Creek Connections activity. Creek Connections, Allegheny College, Meadville, Pennsylvania, 16335 Topography in Watersheds Grade Level: Basic to intermediate.
14.1 Functions of Several Variables
 14 Partial Derivatives 14.1 Functions of Several Variables Copyright Cengage Learning. All rights reserved. 1 Copyright Cengage Learning. All rights reserved. Functions of Several Variables In this section
TABLE OF CONTENTS. Executive Summary 1 Acknowledgements 3 Introduction 3 Storm Recovery and Beach Project Effectiveness 3
 TABLE OF CONTENTS Executive Summary 1 Acknowledgements 3 Introduction 3 Storm Recovery and Beach Project Effectiveness 3 Monmouth County 4 Figures 1a-1d. Monmouth County Station Locations 5 Site Descriptions
East Bay Municipal Utility District. Study Guide for Survey Technician I
 East Bay Municipal Utility District Study Guide for Survey Technician I Summer 2018 TABLE OF CONTENTS PAGE Introduction... 1 Scoring... 1 Visual Perception... 2 Sample Questions 1-2... 2 Reading and Interpreting
Following are the geometrical elements of the aerial photographs:
 Geometrical elements/characteristics of aerial photograph: An aerial photograph is a central or perspective projection, where the bundles of perspective rays meet at a point of origin called perspective
Markville Secondary School Geography Department
 Markville Secondary School Geography Department CGC1D1 Geography of Canada PERFORMANCE TASK - UNITS 1 AND 2 February 2012 DUE DATE: Parent Signature: CONTOUR MAP AND MODEL The performance task for the
Geo-Conservation and Geo-Tourism
 UNIVERSITY OF CANTERBURY & FRONTIERS ABROAD APPENDIX Geo-Conservation and Geo-Tourism Panama Rock Banks Peninsula Ailan Hurley, Natalie Smith, Olivia Watkins, Sam Davidson 10/13/2014 1 Appendix A: Photos
UNITED STATES MARINE CORPS FIELD MEDICAL TRAINING BATTALION Camp Lejeune, NC
 UNITED STATES MARINE CORPS FIELD MEDICAL TRAINING BATTALION Camp Lejeune, NC 28542-0042 FMST 206 Land Navigation TERMINAL LEARNING OBJECTIVE 1. Given a military topographic map, protractor, and objective,
CHAPTER 3 MARGINAL INFORMATION AND SYMBOLS
 CHAPTER 3 MARGINAL INFORMATION AND SYMBOLS A map could be compared to any piece of equipment, in that before it is placed into operation the user must read the instructions. It is important that you, as
GRADE 5 Science INSTRUCTIONAL PACING GUIDE
 mathematical thinking necessary to conduct a controlled scientific FIRST NINE WEEKS Standard 5-5: Forces and Motion The student will demonstrate an understanding of the nature of force and motion. (Physical
Legal Description & Site Plan Requirements and Layouts
 Legal Description & Site Plan Requirements and Layouts Plot Plan * A plot plan shows the location of a house from an aerial view. * The site plan, also known as a plot or lot plan includes: 1. Site plan
Alliance Created State Giant Traveling Map Lesson
 Title: Simon Says Recommended Grades: 3 rd grade, 4 th grade Time Needed: 30 minutes Objectives: Students will: Explore the features and key locations on the map. Materials: Colored lanyards Simon Says
CHAPTER 144. Interpretation of Shoreline Position from Aerial Photographs John S. Fisher 1 Margery F. Overton 2
 CHAPTER 144 Interpretation of Shoreline Position from Aerial Photographs John S. Fisher 1 Margery F. Overton 2 Abstract A review of some of the potential sources of error associated with the use of aerial
EEB 4260 Ornithology. Lecture Notes: Migration
 EEB 4260 Ornithology Lecture Notes: Migration Class Business Reading for this lecture Required. Gill: Chapter 10 (pgs. 273-295) Optional. Proctor and Lynch: pages 266-273 1. Introduction A) EARLY IDEAS
Markville Secondary School Geography Department
 Markville Secondary School Geography Department CGC1D1 Geography of Canada PERFORMANCE TASK - UNIT 1 AND 2 DUE DATE: SEPTEMBER 2011 Parent Signature: CONTOUR MAP AND MODEL The performance task for Geography
Engineering Surveying -1 CE212 Contouring Lectures. Lecture 2016, November 29 th Muhammad Noman
 Engineering Surveying -1 CE212 Contouring Lectures Lecture 2016, November 29 th Muhammad Noman Contour An Imaginary line on the ground surface joining the points of equal elevation is known as contour.
MAPPING YOUR STREAM. TIME REQUIRED 50 minutes in Field 50 minutes in Classroom 50 minutes Homework
 OUR MAPPING YOUR STREAM STREAM ACTIVITY SUMMARY Students will draft a cross-sectional profile of the stream and measure the velocity of the current. They will use both of these to calculate the discharge
The Basics. HECRAS Basis Input. Geometry Data - the basics. Geometry Data. Flow Data. Perform Hydraulic Computations. Viewing the Output
 The Basics HECRAS Basis Input Geometry Data. Flow Data. Perform Hydraulic Computations by G. Parodi WRS ITC The Netherlands Viewing the Output ITC Faculty of Geo-Information Science and Earth Observation
Active and Passive Microwave Remote Sensing
 Active and Passive Microwave Remote Sensing Passive remote sensing system record EMR that was reflected (e.g., blue, green, red, and near IR) or emitted (e.g., thermal IR) from the surface of the Earth.
Terrain Modeling with ArcView GIS
 What You Will Need: A Pentium class PC with 32 MB of RAM (minimum) and 100 MB of free hard drive space, ArcView GIS 3.1 or higher and WinZip or an equivalent program, and an Internet connection. Data and/or
PHOTOGRAMMETRY STEREOSCOPY FLIGHT PLANNING PHOTOGRAMMETRIC DEFINITIONS GROUND CONTROL INTRODUCTION
 PHOTOGRAMMETRY STEREOSCOPY FLIGHT PLANNING PHOTOGRAMMETRIC DEFINITIONS GROUND CONTROL INTRODUCTION Before aerial photography and photogrammetry became a reliable mapping tool, planimetric and topographic
ASTER GDEM Version 2 Validation Report
 ASTER GDEM Version 2 Validation Report Japan s Validation Report August 12th, 2011 Tetsushi Tachikawa (ERSDAC) Manabu Kaku (Mitsubishi Material Techno Corp.) Akira Iwasaki (University of Tokyo) ---------------------------------------------------------------------------------------
370 ACRES (304 Developable) Douglas Lake Newport, TN Huff Hollow $5,995,000
 Douglas Lake Newport, TN Huff Hollow $5,995,000") 370 ACRES (304 Developable) Douglas Lake Newport, TN Huff Hollow $5,995,000 EXCLUSIVELY OFFERED BY: DIXON GREENWOOD, CCIM BALL REALTY & AUCTION, INC. PACKAGE CONTENTS Property Highlights Area Maps Aerial
370 ACRES (304 Developable) Douglas Lake Newport, TN Huff Hollow $5,995,000 EXCLUSIVELY OFFERED BY: DIXON GREENWOOD, CCIM BALL REALTY & AUCTION, INC. PACKAGE CONTENTS Property Highlights Area Maps Aerial
9/13/2011. Training Course Remote Sensing Basic Theory & Image Processing Methods September 2011
 Training Course Remote Sensing Basic Theory & Image Processing Methods 19 23 September 2011 DIGITAL TERRAIN MODELS Introduction Michiel Damen (April 2011) damen@itc.nl 1 Digital Elevation and Terrain Models
GUIDELINES FOR MEASURING BUILDING HEIGHT
 GUIDELINES FOR MEASURING BUILDING HEIGHT THE CITY S POLICIES ON BUILDING HEIGHT In 1994, the City adopted a new General Plan that sets direction for development within Brisbane. Among its policies affecting
Leveling. Double-Rodded Leveling. Illustrative Problem. Double-Rodded Leveling 8/17/2014
 Double-Rodded Leveling Double-Rodded Leveling A method of determining the differences in elevation between points by employing two level routes simultaneously Two turning points are established such that
Beach monitoring with GPS William F Price Department of Civil Engineering, University of Brighton, BRIGHTON, BN1 4GJ, UK
 Beach monitoring with GPS William F Price Department of Civil Engineering, University of Brighton, BRIGHTON, BN1 4GJ, UK Abstract In common with many other countries that have an extended coastline, sea
(Presented by Jeppesen) Summary
 Summary") International Civil Aviation Organization SAM/IG/6-IP/06 South American Regional Office 24/09/10 Sixth Workshop/Meeting of the SAM Implementation Group (SAM/IG/6) - Regional Project RLA/06/901 Lima, Peru,
International Civil Aviation Organization SAM/IG/6-IP/06 South American Regional Office 24/09/10 Sixth Workshop/Meeting of the SAM Implementation Group (SAM/IG/6) - Regional Project RLA/06/901 Lima, Peru,
The Hudson River Illusion: How the Optical Illusions behind Anti-Gravity Hills Affects the River that Flows Two Ways
 The Hudson River Illusion: How the Optical Illusions behind Anti-Gravity Hills Affects the River that Flows Two Ways by, David J. Jackowe, MD The Hudson River looks tilted. Stand on top of Main Street
8/17/2014. Process of directly or indirectly measuring vertical distances to determine the elevation of points or their differences in elevation
 Process of directly or indirectly measuring vertical distances to determine the elevation of points or their differences in elevation Leveling results are used: To design highways, railroads, canals, sewers,
Reality in Maps. Solutions for Innovative Destination Marketing
 Reality in Maps Solutions for Innovative Destination Marketing Better planning. Optimal orientation. Enhanced experiences. Digitization of the customer journey Digitization of the landscape The future
Volunteer Programme July 2006
 Volunteer Programme 23-28 July 2006 Report compiled by Robin Ballard Edward Barlow Tom Cherry Geraldine Creaven Claire Foot Malcolm Wallis Nina Ezra Natutal History Institute report overview by Dr. Thorleifur
AST101: Our Corner of the Universe Lab 4: Parallax Prelab
 AST101: Our Corner of the Universe Lab 4: Parallax Prelab Name: Student number (SUID): Lab section: Group Members: 1 Introduction Recall that one of the issues that lead to the development of the celestial
Development of the Technology of Utilization of Airborne Synthetic Aperture Radar (SAR)
") Development of the Technology of Utilization of Airborne Synthetic Aperture Radar (SAR) Mamoru Koarai, Kouichi Moteki, Nobuyuki Watanabe, Takaki Okatani,Youko Yamada and Kaoru Matsuo Geographical Survey
Development of the Technology of Utilization of Airborne Synthetic Aperture Radar (SAR) Mamoru Koarai, Kouichi Moteki, Nobuyuki Watanabe, Takaki Okatani,Youko Yamada and Kaoru Matsuo Geographical Survey
Chapter 1 Overview of imaging GIS
 Chapter 1 Overview of imaging GIS Imaging GIS, a term used in the medical imaging community (Wang 2012), is adopted here to describe a geographic information system (GIS) that displays, enhances, and facilitates
SONAR At Sea. Sonar Exhibit: Historic Ship Nautilus and the Submarine Force Museum, Groton, Connecticut
 SONAR At Sea Ted Allen, Science Teacher, Ledyard Middle School, Ledyard CT Submarine Force Museum & Historic Ship Nautilus STEM Fellowship Submarine Force Library and Museum Association Fellow Sonar Exhibit:
McKay Creek National Wildlife Refuge BCS number: 48-19
 Oregon Coordinated Aquatic Bird Monitoring: Description of Important Aquatic Bird Site McKay Creek National Wildlife Refuge BCS number: 48-19 Site description author(s) Howard Browers, Supervisory Wildlife
BRASELTON WATER AND WASTEWATER DEPARTMENT CONSTRUCTION PLAN REVIEW CHECKLIST May 2006
 Project Name: BRASELTON WATER AND WASTEWATER DEPARTMENT CONSTRUCTION PLAN REVIEW CHECKLIST May 2006 Phase: Unit: # Lots: Development Type (residential, commercial, industrial, etc.) Braselton Project No.
Dr. Heather Petcovic TECHNOLOGY FOR TEACHING: HANDHELD GPS AND EARTHCACHING
 TECHNOLOGY FOR TEACHING: HANDHELD GPS AND EARTHCACHING Dr. Heather Petcovic Department of Geosciences and the Mallinson Institute for Science Education TECHNOLOGY FOR TEACHING: HANDHELD GPS AND EARTHCACHING
Active and Passive Microwave Remote Sensing
 Active and Passive Microwave Remote Sensing Passive remote sensing system record EMR that was reflected (e.g., blue, green, red, and near IR) or emitted (e.g., thermal IR) from the surface of the Earth.
Exploring the Earth with Remote Sensing: Tucson
 Exploring the Earth with Remote Sensing: Tucson Project ASTRO Chile March 2006 1. Introduction In this laboratory you will explore Tucson and its surroundings with remote sensing. Remote sensing is the
1 : 5,000 1cm to 100m
 4.1.1 Scales and Converting Scales In Hong Kong maps, there are 2 types of scales: 1. 1:5000 (Black and white with no color) 2. 1:20000 (With color) If there is no unit in a representative fraction scale,
Fall 2001 Whooping Crane Migrational Survey Protocol Implementation Report
 Fall 2001 Whooping Crane Migrational Survey Protocol Implementation Report Prepared by Executive Director s Office For Committee s of the Platte River Cooperative Agreement June 5, 2002 I. Introduction
THE ELECTRONIC CHART DISPLAY AND INFORMATION SYSTEM (ECDIS) IN CHINA
 IN CHINA") International Hydrographic 'Review, Monaco, LXIX(2), September 1992 THE ELECTRONIC CHART DISPLAY AND INFORMATION SYSTEM (ECDIS) IN CHINA by The Research Group on ECDIS 1 Abstract This paper presents a
International Hydrographic 'Review, Monaco, LXIX(2), September 1992 THE ELECTRONIC CHART DISPLAY AND INFORMATION SYSTEM (ECDIS) IN CHINA by The Research Group on ECDIS 1 Abstract This paper presents a
Watching for Whoopers in Wisconsin Wetlands
 Summary Students make maps of their communities to explore whooping crane habitat close to their neighborhoods. Objectives: Students will be able to: Use a variety of geographic representations, such as
Investigate Slope. 1. By observation, A B arrange the lines shown in order of steepness, from least steep to steepest. Explain your. reasoning.
 6.5 Slope Focus on determining the slope of a line using slope to draw lines understanding slope as a rate of change solving problems involving slope The national, provincial, and territorial parks of
Fractals Using the Koch Snowflake
 Fractals Using the Koch Snowflae Grade level: 8 th Time needed: One class period *May be incorporated with a geometry unit. Objectives Recognize and construct similar figures Find perimeter and area of
Important Questions. Surveying Unit-II. Surveying & Leveling. Syllabus
 Surveying Unit-II Important Questions Define Surveying and Leveling Differentiate between Surveying and Leveling. Explain fundamental Principles of Surveying. Explain Plain and Diagonal Scale. What is
Name. Part 2. Part 2 Swimming 55 minutes
 Name Swimming 55 minutes 1. Moby Dick...................... 15. Islands (Nurikabe).................. 0. Hashiwokakero (Bridges).............. 15 4. Coral Finder..................... 5 5. Sea Serpent......................
Essential Skills: Reading and Interpreting Maps and Plans
 Essential Skills: Reading and Interpreting Maps and Plans Prepared for: NEW YORK STATE PLANNING FEDERATION April 14, 2015 Prepared by: BME ASSOCIATES Peter G. Vars, P.E. Stages of Plan Review Concept /
Fordingbridge Infant School KS1 Curriculum Map: Autumn Term
 Fordingbridge Infant School KS1 Curriculum Map: Autumn Term 2018-2019 Learning Value Hook/ Immersion Autumn A Motivation 7 weeks Around the World Year 1 Pirates Motivation - Earning a pirate party Study
47 CFR Ch. I ( Edition)
") 73.684 should decrease more rapidly with distance beyond the horizon than for Channels 2 6, and modification of the curves for Channels 14 69 may be expected as a result of measurements to be made at a
73.684 should decrease more rapidly with distance beyond the horizon than for Channels 2 6, and modification of the curves for Channels 14 69 may be expected as a result of measurements to be made at a
Fordingbridge Infant School KS1 Curriculum Map: Summer Term
 Fordingbridge Infant School KS1 Curriculum Map: Summer Term 2018-2019 Learning Value Hook/ Immersion Summer A Teamwork 6 weeks Let s get moving Year 1 Healthy Heroes Teamwork working together to achieve
Species: Birds (seabirds, shorebirds, waterfowl, raptors, passerines) and marine mammals
 and marine mammals") Circumnavigation surveys Wildlife Inventory Plan Alaska Maritime National Wildlife Refuge Protocol #22 Version 1.2 Parameter: Populations (and occasionally boom-or-bust productivity) Species: Birds (seabirds,
Circumnavigation surveys Wildlife Inventory Plan Alaska Maritime National Wildlife Refuge Protocol #22 Version 1.2 Parameter: Populations (and occasionally boom-or-bust productivity) Species: Birds (seabirds,
SUMMIT COUNTY PLANNING AND ENGINEERING DEPARTMENT
 SUMMIT COUNTY PLANNING AND ENGINEERING DEPARTMENT SINGLE-FAMILY SITE PLAN INFORMATION PACKET GENERAL INFORMATION This information packet explains how your application for a single-family site plan will
First Exam. Geographers Tools: Gathering Information. Photographs and Imagery. SPIN 2 Image of Downtown Atlanta, GA 1995 REMOTE SENSING 9/19/2016
 First Exam Geographers Tools: Gathering Information Prof. Anthony Grande Hunter College Geography Lecture design, content and presentation AFG 0616. Individual images and illustrations may be subject to
2018 Beaver Computing Challenge (Grade 7 & 8) Questions
 Questions") 2018 Beaver Computing Challenge (Grade 7 & 8) s Part A 2 Roped Trees Joni Beaver uses rope to mark groups of trees. The rope forms a very tight loop so that each tree either touches the rope or is entirely
2018 Beaver Computing Challenge (Grade 7 & 8) s Part A 2 Roped Trees Joni Beaver uses rope to mark groups of trees. The rope forms a very tight loop so that each tree either touches the rope or is entirely
Chapter Four AIRPORT LAYOUT PLAN SET COMPONENTS
 The purpose of this chapter is to present the graphic representation of the items addressed and recommended in Chapter Three Demand Capacity Analysis and Facility Requirements (page 3-1). The Airport Layout
Project Planning and Cost Estimating
 CHAPTER 17 Project Planning and Cost Estimating 17.1 INTRODUCTION Previous chapters have outlined and detailed technical aspects of photogrammetry. The basic tasks and equipment required to create various
18.2 Geometric Probability
 Name Class Date 18.2 Geometric Probability Essential Question: What is geometric probability? Explore G.13.B Determine probabilities based on area to solve contextual problems. Using Geometric Probability
MONITORING RUBBLE-MOUND COASTAL STRUCTURES WITH PHOTOGRAMMETRY
 ,. CETN-III-21 2/84 MONITORING RUBBLE-MOUND COASTAL STRUCTURES WITH PHOTOGRAMMETRY INTRODUCTION: Monitoring coastal projects usually involves repeated surveys of coastal structures and/or beach profiles.
IAN HUMBY TEACHING. List of Hand-Outs. Levelling
 IAN HUMBY TEACHING List of Hand-Outs Levelling 6-1 Equipment List (Levelling) 11-1 to 11-3 Introduction to Levelling 11-4 Levelling Terminology 12-1 to 12-2 Measuring Height Change by Basic Methods 13-1
OVER-HEIGHT FENCE/RETAINING WALL CERTIFICATION APPLICATION
 OVER-HEIGHT FENCE/RETAINING WALL CERTIFICATION APPLICATION Application information below to be completed by Applicant/Agent//Owner APN PROPERTY ADDRESS PROPERTY LOCATION (if no address) APPLICANT S NAME
VDatum and SBET to Improve Accuracy of NOAA s High-Resolution Bathymetry
 VDatum and SBET to Improve Accuracy of NOAA s High-Resolution Bathymetry US HYDRO 2007 Extended Abstract Author: Crescent H. Moegling CoAuthor: Steve Brodet Moegling HYDRO 2007 1 Introduction NOAA s Hydrographic
Cape Romain National Wildlife Refuge Climate Change Impacts
 Climate Change Impacts How will the Refuge be Affected by Climate Change? Salt marsh fragmentation by rapidly eroding tidal creeks Salt marsh submergence during high tide events leading to habitat conversion
Taking Better Photographs on the Water
 OCTOBER 14, 2018 BEGINNER Taking Better Photographs on the Water Featuring LINDSAY SILVERMAN Lindsay Silverman This lake and trees with its reflection make for a great photograph. It is also an example
Name: Date: Block: Mid-Unit 4 Test Review All work must be shown for full credit.
 Name: Date: Block: Mid-Unit 4 Test Review All work must be shown for full credit. 1) How do you have to walk so the motion detector graphs a straight line? Explain as clearly as you can. 2) What determines
S"-')3. 6 t 2to c_ c 0 14 (17/) sin I (.,) i t 2-s. ri9,14s' e 3. c> i ka. 2,c. s'a. Sine Law and Cosine Law Practice Questions Page 1
3. 6 t 2to c_ c 0 14 (17/) sin I (.,) i t 2-s. ri9,14s' e 3. c> i ka. 2,c. s'a. Sine Law and Cosine Law Practice Questions Page 1") Sine Law and Cosine Law Practice Questions Page 1 1. Mike needs to calculate the height of a tree that he will be removing from a construction site. The tree is leaning at an angle of 85 with the ground.
Sine Law and Cosine Law Practice Questions Page 1 1. Mike needs to calculate the height of a tree that he will be removing from a construction site. The tree is leaning at an angle of 85 with the ground.
Results of 2013 Radar Surveys on Hispaniola
 Results of 2013 Radar Surveys on Hispaniola Adam C Brown, Senior Biologist. Environmental Protection in the Caribbean. 200 Dr. MLK Jr. Blvd. Riviera Beach, Florida 33404 USA **Report for ABC Cooperative
Curriculum Connections. Connecting the Art of Hokusai and Henri Rivière to Local Landscapes
 Curriculum Connections Connecting the Art of Hokusai and Henri Rivière to Local Landscapes Curricular Themes: History and Social Science (Geography of the World, California, and the United States) Science