Algebra 2 P49 Pre 10 1 Measures of Central Tendency Box and Whisker Plots Variation and Outliers
|
|
|
- Ambrose Leonard
- 5 years ago
- Views:
Transcription
1 Algebra 2 P49 Pre 10 1 Measures of Central Tendency Box and Whisker Plots Variation and Outliers 10 1 Sample Spaces and Probability Mean Average = 40/8 = 5 Measures of Central Tendency 2,3,3,4,5,6,8,9 Median Order Numbers (Number in the Middle or Mean of two Middle Numbers) = = 9 9/2 = 4.5 Mode Most Frequent 3 is the mode BiModal Data with 2 different Modes Range: Highest Lowest
2
3

")
")
 (Med.")
4 Lower Extreme Lower Quartile Q1 Median Q2 Upper Quartile Q3 Upper Extreme (Max) 2,3,3,4,5,6,8,9 Box and Whisker Plots (Min) (Med. of Lower Half) (Med.) (Med. of Upper Half) Graphing Calculator

5 Measures of Variation 3,4,5,6,7,7,8,9,9,10,11,12,14,16,18 Outlier An outlier is an item that is substantially different from the rest of the items in the data would be the outlier because it has a difference that is very large
6 Calculating an Outlier...= 1.5xIQR Real Calculation LQ and UQ+ Sample Space Sample Space The set of all possible outcomes Three coins are flipped. List the possible outcomes in the sample space of the experiment.
7 Probability What are the chances that some event will occur? Probability (Event) = Favorable Outcomes Total Outcomes Example: Rolling an Even Number on a Die Experimental Probability What does happen when you do the experiment. (If you toss the coin 100 times, you might get 60 heads and 40 tails.) Flipping a Coin (Results = H, T, H, T, H) Rolling a Die (Result = 1,3,4,5,5,5,5,6)


8 Theoretical Probability What should happen if the experiment is done over and over again. Tossing a coin. (Should be 50% Heads and 50% Tails) Each section of the spinner shown has the same area. The spinner was spun 20 times. The table shows the results. For which color is the experimental probability of stopping on the color the same as the theoretical probability?


9 In the United States, a survey of 2184 adults ages 18 and over found that 1328 of them have at least one pet. The types of pets these adults have are shown in the figure. What is the probability that a pet owning adult chosen at random has a dog? When two six sided dice are rolled, there are 36 possible outcomes, as shown. Find the probability of each event. The sum is not 6. The sum is less than or equal to 9.

10 Geometric Probability Geometric Probability Uses Areas/Lengths/Time to find Probability P(Landing on the Circle) You throw a dart at the board shown. Your dart is equally likely to hit any point inside the square board. Are you more likely to get 10 points or 0 points?
11 HW58 Pre10 1 and 10 1 WS Please put your name and class period at the top of the homework. Also include the homework number. Stem and Leaf Plot Used to Organize Data so that you can see every number. The numbers have to be put in order first. The stems are on the Left and the leaves are on the Right 13, 8, 21, 14, 32, 7, 3, 18, 33, 20, 32, 15

12 Two Sided Stem and Leaf Plot Percentiles A percentile is a number from 0 to 100 that tells you how much of a data set is less than or equal to X. Find the 30th and 60th Percentile of the following data 3,4,5,6,7,7,8,9,9,10,11,12,14,16,18,20,21,21,22,24 1. Put the numbers in order 2. Count the number of numbers and multiply by.3 and.6 20 x.3 = 6 since 8 is greater than 6 values it is the 30th Perct. 20 x.6 = 12 since 14 is greater than 12 values it is the 60th Perct.
Name Date. Sample Spaces and Probability For use with Exploration 12.1
 . Sample Spaces and Probability For use with Exploration. Essential Question How can you list the possible outcomes in the sample space of an experiment? The sample space of an experiment is the set of
Algebra I Notes Unit One: Real Number System
 Syllabus Objectives: 1.1 The student will organize statistical data through the use of matrices (with and without technology). 1.2 The student will perform addition, subtraction, and scalar multiplication
Name. Is the game fair or not? Prove your answer with math. If the game is fair, play it 36 times and record the results.
 Homework 5.1C You must complete table. Use math to decide if the game is fair or not. If Period the game is not fair, change the point system to make it fair. Game 1 Circle one: Fair or Not 2 six sided
Essential Question How can you list the possible outcomes in the sample space of an experiment?
 . TEXAS ESSENTIAL KNOWLEDGE AND SKILLS G..B Sample Spaces and Probability Essential Question How can you list the possible outcomes in the sample space of an experiment? The sample space of an experiment
12.1 The Fundamental Counting Principle and Permutations
 12.1 The Fundamental Counting Principle and Permutations The Fundamental Counting Principle Two Events: If one event can occur in ways and another event can occur in ways then the number of ways both events
Intro to Algebra Guided Notes (Unit 11)
") Intro to Algebra Guided Notes (Unit 11) PA 12-1, 12-2, 12-3, 12-7 Alg 12-2, 12-3, 12-4 NAME 12-1 Stem-and-Leaf Plots Stem-and-Leaf Plot: numerical data are listed in ascending or descending order. The
Intro to Algebra Guided Notes (Unit 11) PA 12-1, 12-2, 12-3, 12-7 Alg 12-2, 12-3, 12-4 NAME 12-1 Stem-and-Leaf Plots Stem-and-Leaf Plot: numerical data are listed in ascending or descending order. The
10-7 Simulations. Do 20 trials and record the results in a frequency table. Divide the frequency by 20 to get the probabilities.
 1. GRADES Clara got an A on 80% of her first semester Biology quizzes. Design and conduct a simulation using a geometric model to estimate the probability that she will get an A on a second semester Biology
TJP TOP TIPS FOR IGCSE STATS & PROBABILITY
 TJP TOP TIPS FOR IGCSE STATS & PROBABILITY Dr T J Price, 2011 First, some important words; know what they mean (get someone to test you): Mean the sum of the data values divided by the number of items.
She concludes that the dice is biased because she expected to get only one 6. Do you agree with June's conclusion? Briefly justify your answer.
 PROBABILITY & STATISTICS TEST Name: 1. June suspects that a dice may be biased. To test her suspicions, she rolls the dice 6 times and rolls 6, 6, 4, 2, 6, 6. She concludes that the dice is biased because
Bellwork Write each fraction as a percent Evaluate P P C C 6
 Bellwork 2-19-15 Write each fraction as a percent. 1. 2. 3. 4. Evaluate. 5. 6 P 3 6. 5 P 2 7. 7 C 4 8. 8 C 6 1 Objectives Find the theoretical probability of an event. Find the experimental probability
green, green, green, green, green The favorable outcomes of the event are blue and red.
 5 Chapter Review Review Key Vocabulary experiment, p. 6 outcomes, p. 6 event, p. 6 favorable outcomes, p. 6 probability, p. 60 relative frequency, p. 6 Review Examples and Exercises experimental probability,
Lesson 3: Chance Experiments with Equally Likely Outcomes
 Lesson : Chance Experiments with Equally Likely Outcomes Classwork Example 1 Jamal, a 7 th grader, wants to design a game that involves tossing paper cups. Jamal tosses a paper cup five times and records
Section 7.1 Experiments, Sample Spaces, and Events
 Section 7.1 Experiments, Sample Spaces, and Events Experiments An experiment is an activity with observable results. 1. Which of the follow are experiments? (a) Going into a room and turning on a light.
* How many total outcomes are there if you are rolling two dice? (this is assuming that the dice are different, i.e. 1, 6 isn t the same as a 6, 1)
") Compound probability and predictions Objective: Student will learn counting techniques * Go over HW -Review counting tree -All possible outcomes is called a sample space Go through Problem on P. 12, #2
Compound probability and predictions Objective: Student will learn counting techniques * Go over HW -Review counting tree -All possible outcomes is called a sample space Go through Problem on P. 12, #2
Grade 8 Math Assignment: Probability
 Grade 8 Math Assignment: Probability Part 1: Rock, Paper, Scissors - The Study of Chance Purpose An introduction of the basic information on probability and statistics Materials: Two sets of hands Paper
Bell Work. Warm-Up Exercises. Two six-sided dice are rolled. Find the probability of each sum or 7
 Warm-Up Exercises Two six-sided dice are rolled. Find the probability of each sum. 1. 7 Bell Work 2. 5 or 7 3. You toss a coin 3 times. What is the probability of getting 3 heads? Warm-Up Notes Exercises
Independence Is The Word
 Problem 1 Simulating Independent Events Describe two different events that are independent. Describe two different events that are not independent. The probability of obtaining a tail with a coin toss
Chapter 0: Preparing for Advanced Algebra
 Lesson 0-1: Representing Functions Date: Example 1: Locate Coordinates Name the quadrant in which the point is located. Example 2: Identify Domain and Range State the domain and range of each relation.
Georgia Department of Education Georgia Standards of Excellence Framework GSE Geometry Unit 6
 How Odd? Standards Addressed in this Task MGSE9-12.S.CP.1 Describe categories of events as subsets of a sample space using unions, intersections, or complements of other events (or, and, not). MGSE9-12.S.CP.7
Unit 7 Central Tendency and Probability
 Name: Block: 7.1 Central Tendency 7.2 Introduction to Probability 7.3 Independent Events 7.4 Dependent Events 7.1 Central Tendency A central tendency is a central or value in a data set. We will look at
Math. Integrated. Trimester 3 Revision Grade 7. Zayed Al Thani School. ministry of education.
 ministry of education Department of Education and Knowledge Zayed Al Thani School www.z2school.com Integrated Math Grade 7 2017-2018 Trimester 3 Revision الوزارة كتاب عن تغني ال المراجعة هذه 0 Ministry
Basic Probability Ideas. Experiment - a situation involving chance or probability that leads to results called outcomes.
 Basic Probability Ideas Experiment - a situation involving chance or probability that leads to results called outcomes. Random Experiment the process of observing the outcome of a chance event Simulation
Ch Probability Outcomes & Trials
 Learning Intentions: Ch. 10.2 Probability Outcomes & Trials Define the basic terms & concepts of probability. Find experimental probabilities. Calculate theoretical probabilities. Vocabulary: Trial: real-world
SHORT ANSWER. Write the word or phrase that best completes each statement or answers the question.
 Math 1332 Review Test 4 Name SHORT ANSWER. Write the word or phrase that best completes each statement or answers the question. Solve the problem by applying the Fundamental Counting Principle with two
Part 1: I can express probability as a fraction, decimal, and percent
 Name: Pattern: Part 1: I can express probability as a fraction, decimal, and percent For #1 to #4, state the probability of each outcome. Write each answer as a) a fraction b) a decimal c) a percent Example:
Ace of diamonds. Graphing worksheet
 Ace of diamonds Produce a screen displaying a the Ace of diamonds. 2006 Open University A silver-level, graphing challenge. Reference number SG1 Graphing worksheet Choose one of the following topics and
Review. Natural Numbers: Whole Numbers: Integers: Rational Numbers: Outline Sec Comparing Rational Numbers
 FOUNDATIONS Outline Sec. 3-1 Gallo Name: Date: Review Natural Numbers: Whole Numbers: Integers: Rational Numbers: Comparing Rational Numbers Fractions: A way of representing a division of a whole into
Probability, Continued
 Probability, Continued 12 February 2014 Probability II 12 February 2014 1/21 Last time we conducted several probability experiments. We ll do one more before starting to look at how to compute theoretical
Tail. Tail. Head. Tail. Head. Head. Tree diagrams (foundation) 2 nd throw. 1 st throw. P (tail and tail) = P (head and tail) or a tail.
 2 nd throw. 1 st throw. P (tail and tail) = P (head and tail) or a tail.") When you flip a coin, you might either get a head or a tail. The probability of getting a tail is one chance out of the two possible outcomes. So P (tail) = Complete the tree diagram showing the coin being
When you flip a coin, you might either get a head or a tail. The probability of getting a tail is one chance out of the two possible outcomes. So P (tail) = Complete the tree diagram showing the coin being
Please Turn Over Page 1 of 7
 . Page 1 of 7 ANSWER ALL QUESTIONS Question 1: (25 Marks) A random sample of 35 homeowners was taken from the village Penville and their ages were recorded. 25 31 40 50 62 70 99 75 65 50 41 31 25 26 31
CH 13. Probability and Data Analysis
 11.1: Find Probabilities and Odds 11.2: Find Probabilities Using Permutations 11.3: Find Probabilities Using Combinations 11.4: Find Probabilities of Compound Events 11.5: Analyze Surveys and Samples 11.6:
3.6 Theoretical and Experimental Coin Tosses
 wwwck12org Chapter 3 Introduction to Discrete Random Variables 36 Theoretical and Experimental Coin Tosses Here you ll simulate coin tosses using technology to calculate experimental probability Then you
(Notice that the mean doesn t have to be a whole number and isn t normally part of the original set of data.)
") One-Variable Statistics Descriptive statistics that analyze one characteristic of one sample Where s the middle? How spread out is it? Where do different pieces of data compare? To find 1-variable statistics
One-Variable Statistics Descriptive statistics that analyze one characteristic of one sample Where s the middle? How spread out is it? Where do different pieces of data compare? To find 1-variable statistics
Common Core Math Tutorial and Practice
 Common Core Math Tutorial and Practice TABLE OF CONTENTS Chapter One Number and Numerical Operations Number Sense...4 Ratios, Proportions, and Percents...12 Comparing and Ordering...19 Equivalent Numbers,
MULTIPLE CHOICE. Choose the one alternative that best completes the statement or answers the question.
 6.1 Practice Problems Name MULTIPLE CHOICE. Choose the one alternative that best completes the statement or answers the question. Answer the question. 1) The probability of rolling an even number on a
FAVORITE MEALS NUMBER OF PEOPLE Hamburger and French fries 17 Spaghetti 8 Chili 12 Vegetarian delight 3
 Probability 1. Destiny surveyed customers in a restaurant to find out their favorite meal. The results of the survey are shown in the table. One person in the restaurant will be picked at random. Based
Compound Events: Making an Organized List
 136 8 7.SP.6 7.SP.8a 7.SP.8b Objective Common Core State Standards Compound Events: Making an Organized List Experience with experiments helps students build on their intuitive sense about probability.
A B C. 142 D. 96
 Data Displays and Analysis 1. stem leaf 900 3 3 4 5 7 9 901 1 1 1 2 4 5 6 7 8 8 8 9 9 902 1 3 3 3 4 6 8 9 9 903 1 2 2 3 3 3 4 7 8 9 904 1 1 2 4 5 6 8 8 What is the range of the data shown in the stem-and-leaf
Probability. March 06, J. Boulton MDM 4U1. P(A) = n(a) n(s) Introductory Probability
 = n(a) n(s) Introductory Probability") Most people think they understand odds and probability. Do you? Decision 1: Pick a card Decision 2: Switch or don't Outcomes: Make a tree diagram Do you think you understand probability? Probability Write
Most people think they understand odds and probability. Do you? Decision 1: Pick a card Decision 2: Switch or don't Outcomes: Make a tree diagram Do you think you understand probability? Probability Write
Probability. Sometimes we know that an event cannot happen, for example, we cannot fly to the sun. We say the event is impossible
 Probability Sometimes we know that an event cannot happen, for example, we cannot fly to the sun. We say the event is impossible Impossible In summer, it doesn t rain much in Cape Town, so on a chosen
Sections Descriptive Statistics for Numerical Variables
 Math 243 Sections 2.1.2-2.2.5 Descriptive Statistics for Numerical Variables A framework to describe quantitative data: Describe the Shape, Center and Spread, and Unusual Features Shape How is the data
2 Event is equally likely to occur or not occur. When all outcomes are equally likely, the theoretical probability that an event A will occur is:
 10.3 TEKS a.1, a.4 Define and Use Probability Before You determined the number of ways an event could occur. Now You will find the likelihood that an event will occur. Why? So you can find real-life geometric
10-7 Simulations. 5. VIDEO GAMES Ian works at a video game store. Last year he sold 95% of the new-release video games.
 1. GRADES Clara got an A on 80% of her first semester Biology quizzes. Design and conduct a simulation using a geometric model to estimate the probability that she will get an A on a second semester Biology
Name Class Date. Introducing Probability Distributions
 Name Class Date Binomial Distributions Extension: Distributions Essential question: What is a probability distribution and how is it displayed? 8-6 CC.9 2.S.MD.5(+) ENGAGE Introducing Distributions Video
What Do You Expect? Concepts
 Important Concepts What Do You Expect? Concepts Examples Probability A number from 0 to 1 that describes the likelihood that an event will occur. Theoretical Probability A probability obtained by analyzing
Contemporary Mathematics Math 1030 Sample Exam I Chapters Time Limit: 90 Minutes No Scratch Paper Calculator Allowed: Scientific
 Contemporary Mathematics Math 1030 Sample Exam I Chapters 13-15 Time Limit: 90 Minutes No Scratch Paper Calculator Allowed: Scientific Name: The point value of each problem is in the left-hand margin.
Math 1313 Section 6.2 Definition of Probability
 Math 1313 Section 6.2 Definition of Probability Probability is a measure of the likelihood that an event occurs. For example, if there is a 20% chance of rain tomorrow, that means that the probability
Junior Circle Meeting 5 Probability. May 2, ii. In an actual experiment, can one get a different number of heads when flipping a coin 100 times?
 Junior Circle Meeting 5 Probability May 2, 2010 1. We have a standard coin with one side that we call heads (H) and one side that we call tails (T). a. Let s say that we flip this coin 100 times. i. How
Data Analysis. (1) Page #16 34 Column, Column (Skip part B), and #57 (A S/S)
 Page #16 34 Column, Column (Skip part B), and #57 (A S/S)") H Algebra 2/Trig Unit 9 Notes Packet Name: Period: # Data Analysis (1) Page 663 664 #16 34 Column, 45 54 Column (Skip part B), and #57 (A S/S) (2) Page 663 664 #17 32 Column, 46 56 Column (Skip part B),
H Algebra 2/Trig Unit 9 Notes Packet Name: Period: # Data Analysis (1) Page 663 664 #16 34 Column, 45 54 Column (Skip part B), and #57 (A S/S) (2) Page 663 664 #17 32 Column, 46 56 Column (Skip part B),
Mini-Unit. Data & Statistics. Investigation 1: Correlations and Probability in Data
 Mini-Unit Data & Statistics Investigation 1: Correlations and Probability in Data I can Measure Variation in Data and Strength of Association in Two-Variable Data Lesson 3: Probability Probability is a
0-5 Adding Probabilities. 1. CARNIVAL GAMES A spinner has sections of equal size. The table shows the results of several spins.
 1. CARNIVAL GAMES A spinner has sections of equal size. The table shows the results of several spins. d. a. Copy the table and add a column to show the experimental probability of the spinner landing on
Section Theoretical and Experimental Probability...Wks 3
 Name: Class: Date: Section 6.8......Theoretical and Experimental Probability...Wks 3. Eight balls numbered from to 8 are placed in a basket. One ball is selected at random. Find the probability that it
Theoretical or Experimental Probability? Are the following situations examples of theoretical or experimental probability?
 Name:Date:_/_/ Theoretical or Experimental Probability? Are the following situations examples of theoretical or experimental probability? 1. Finding the probability that Jeffrey will get an odd number
CoEA Module 1 Case Study 1 Snakes and Ladders
 CoEA Module 1 Case Study 1 Snakes and Ladders The resources for this Case Study consist of Teacher Notes Case Study Resource Sheet CR1 Snakes and Ladders (1) " " " " CR2 Snakes and Ladders (2) " " " "
2 C. 1 D. 2 4 D. 5 3 C. 25 D. 2
 Discrete Math Exam Review Name:. A bag contains oranges, grapefruits, and tangerine. A piece of fruit is chosen from the bag at random. What is the probability that a grapefruit will be chosen from the
A. 15 B. 24 C. 45 D. 54
 A spinner is divided into 8 equal sections. Lara spins the spinner 120 times. It lands on purple 30 times. How many more times does Lara need to spin the spinner and have it land on purple for the relative
10-8 Probability of Compound Events
 Use any method to find the total number of outcomes in each situation. 6. Nathan has 4 t-shirts, 4 pairs of shorts, and 2 pairs of flip-flops. Use the Fundamental Counting Principle to find the number
Compound Events. Identify events as simple or compound.
 11.1 Compound Events Lesson Objectives Understand compound events. Represent compound events. Vocabulary compound event possibility diagram simple event tree diagram Understand Compound Events. A compound
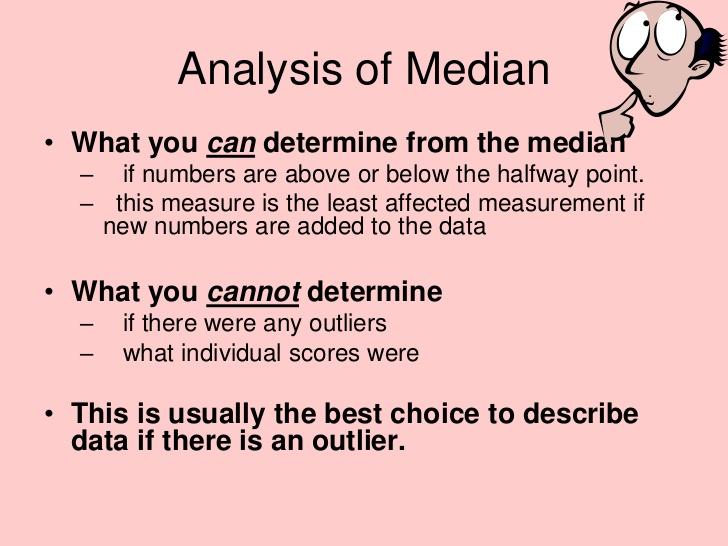
2. The value of the middle term in a ranked data set is called: A) the mean B) the standard deviation C) the mode D) the median
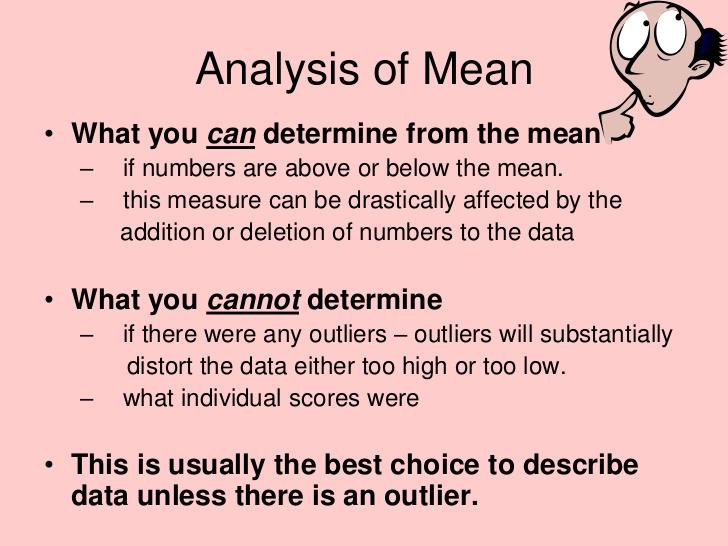
 the mean B) the standard deviation C) the mode D) the median") 1. An outlier is a value that is: A) very small or very large relative to the majority of the values in a data set B) either 100 units smaller or 100 units larger relative to the majority of the values
1. An outlier is a value that is: A) very small or very large relative to the majority of the values in a data set B) either 100 units smaller or 100 units larger relative to the majority of the values
Probability Rules. 2) The probability, P, of any event ranges from which of the following?
 The probability, P, of any event ranges from which of the following?") Name: WORKSHEET : Date: Answer the following questions. 1) Probability of event E occurring is... P(E) = Number of ways to get E/Total number of outcomes possible in S, the sample space....if. 2) The probability,
Name: WORKSHEET : Date: Answer the following questions. 1) Probability of event E occurring is... P(E) = Number of ways to get E/Total number of outcomes possible in S, the sample space....if. 2) The probability,
2. How many different three-member teams can be formed from six students?
 KCATM 2011 Probability & Statistics 1. A fair coin is thrown in the air four times. If the coin lands with the head up on the first three tosses, what is the probability that the coin will land with the
Chapter 1: Stats Starts Here Chapter 2: Data
 Chapter 1: Stats Starts Here Chapter 2: Data Statistics data, datum variation individual respondent subject participant experimental unit observation variable categorical quantitative Calculator Skills:
Math 146 Statistics for the Health Sciences Additional Exercises on Chapter 3
 Math 46 Statistics for the Health Sciences Additional Exercises on Chapter 3 Student Name: Find the indicated probability. ) If you flip a coin three times, the possible outcomes are HHH HHT HTH HTT THH
Independent Events B R Y
 . Independent Events Lesson Objectives Understand independent events. Use the multiplication rule and the addition rule of probability to solve problems with independent events. Vocabulary independent
Use this information to answer the following questions.
 1 Lisa drew a token out of the bag, recorded the result, and then put the token back into the bag. She did this 30 times and recorded the results in a bar graph. Use this information to answer the following
Find the probability of an event by using the definition of probability
 LESSON 10-1 Probability Lesson Objectives Find the probability of an event by using the definition of probability Vocabulary experiment (p. 522) trial (p. 522) outcome (p. 522) sample space (p. 522) event
MULTIPLE CHOICE. Choose the one alternative that best completes the statement or answers the question.
 Practice for Final Exam Name Identify the following variable as either qualitative or quantitative and explain why. 1) The number of people on a jury A) Qualitative because it is not a measurement or a
THOMAS WHITHAM SIXTH FORM
 THOMAS WHITHAM SIXTH FORM Handling Data Levels 6 8 S. J. Cooper Probability Tree diagrams & Sample spaces Statistical Graphs Scatter diagrams Mean, Mode & Median Year 9 B U R N L E Y C A M P U S, B U R
Algebra 2 Notes Section 10.1: Apply the Counting Principle and Permutations
 Algebra 2 Notes Section 10.1: Apply the Counting Principle and Permutations Objective(s): Vocabulary: I. Fundamental Counting Principle: Two Events: Three or more Events: II. Permutation: (top of p. 684)
\\\v?i. EXERCISES Activity a. Determine the complement of event A in the roll-a-die experiment.
 ACTIVITY 6.2 CHOICES 719 11. a. Determine the complement of event A in the roll-a-die experiment. b. Describe what portion of the Venn diagram above represents the complement of A. SUMMARY Activity 6.2
Probability. Ms. Weinstein Probability & Statistics
 Probability Ms. Weinstein Probability & Statistics Definitions Sample Space The sample space, S, of a random phenomenon is the set of all possible outcomes. Event An event is a set of outcomes of a random
NAME DATE PERIOD. Study Guide and Intervention
 9-1 Section Title The probability of a simple event is a ratio that compares the number of favorable outcomes to the number of possible outcomes. Outcomes occur at random if each outcome occurs by chance.
Section 6.1 #16. Question: What is the probability that a five-card poker hand contains a flush, that is, five cards of the same suit?
 Section 6.1 #16 What is the probability that a five-card poker hand contains a flush, that is, five cards of the same suit? page 1 Section 6.1 #38 Two events E 1 and E 2 are called independent if p(e 1
Chapter Test Form A. mean median mode. 187 Holt Algebra 1. Name Date Class. Select the best answer.
 Select the best answer. 1. Use this bar graph to identify how many more candies are blue than red. A 3 B 6 C 9 D 15 Form A 2. Which type of graph would be best for displaying this data? Board Members Opinions
FSA 7 th Grade Math. MAFS.7.SP.1.1 & MAFS.7.SP.1.2 Level 2. MAFS.7.SP.1.1 & MAFS.7.SP.1.2 Level 2. MAFS.7.SP.1.1 & MAFS.7.SP.1.
 FSA 7 th Grade Math Statistics and Probability Two students are taking surveys to find out if people will vote to fund the building of a new city park on election day. Levonia asks 20 parents of her friends.
Key Concepts. Theoretical Probability. Terminology. Lesson 11-1
 Key Concepts Theoretical Probability Lesson - Objective Teach students the terminology used in probability theory, and how to make calculations pertaining to experiments where all outcomes are equally
If a regular six-sided die is rolled, the possible outcomes can be listed as {1, 2, 3, 4, 5, 6} there are 6 outcomes.
 Section 11.1: The Counting Principle 1. Combinatorics is the study of counting the different outcomes of some task. For example If a coin is flipped, the side facing upward will be a head or a tail the
Unit 8, Activity 1, Vocabulary Self-Awareness Chart
 Unit 8, Activity 1, Vocabulary Self-Awareness Chart Vocabulary Self-Awareness Chart WORD +? EXAMPLE DEFINITION Central Tendency Mean Median Mode Range Quartile Interquartile Range Standard deviation Stem
Chapter 8: Probability: The Mathematics of Chance
 Chapter 8: Probability: The Mathematics of Chance Free-Response 1. A spinner with regions numbered 1 to 4 is spun and a coin is tossed. Both the number spun and whether the coin lands heads or tails is
Data 1 Assessment Calculator allowed for all questions
 Foundation Higher Data Assessment Calculator allowed for all questions MATHSWATCH All questions Time for the test: 45 minutes Name: MATHSWATCH ANSWERS Grade Title of clip Marks Score Percentage Clip 4
Intro to Probability
 Intro to Probability Random Experiment A experiment is random if: 1) the outcome depends on chance. In other words, the outcome cannot be predicted with certainty (can t know 100%). 2) the set of all possible
Toss two coins 60 times. Record the number of heads in each trial, in a table.
 Coin Experiment When we toss a coin in the air, we expect it to finish on a head or tail with equal likelihood. What to do: Toss one coin 40 times. ecord the number of heads in each trial, in a table:
STATISTICS and PROBABILITY GRADE 6
 Kansas City Area Teachers of Mathematics 2016 KCATM Math Competition STATISTICS and PROBABILITY GRADE 6 INSTRUCTIONS Do not open this booklet until instructed to do so. Time limit: 20 minutes You may use
Section A Calculating Probabilities & Listing Outcomes Grade F D
 Name: Teacher Assessment Section A Calculating Probabilities & Listing Outcomes Grade F D 1. A fair ordinary six-sided dice is thrown once. The boxes show some of the possible outcomes. Draw a line from
Applications of Independent Events
 pplications of Independent Events Focus on fter this lesson, you will be able to φ use tree diagrams, tables, and other graphic organizers to solve probability problems In the game of Sit and Save, you
Measure of Central Tendency
 1 of 5 9/30/009 5:14 PM Measure of Central Tendency Topic Index Algebra Index Regents Exam Prep Center The term "measures of central tendency" refers to finding the mean, median and mode. Mean: Median:
Multiplication and Probability
 Problem Solving: Multiplication and Probability Problem Solving: Multiplication and Probability What is an efficient way to figure out probability? In the last lesson, we used a table to show the probability
Probability WS 1 Counting , , , a)625 b)1050c) a)20358,520 b) 1716 c) 55,770
625 b)1050c) a)20358,520 b) 1716 c) 55,770") Probability WS 1 Counting 1.28 2.13,800 3.5832 4.30 5.. 15 7.72 8.33, 5 11. 15,504 12. a)25 b)1050c)2275 13. a)20358,520 b) 171 c) 55,770 d) 12,271,512e) 1128 f) 17 14. 438 15. 2,000 1. 11,700 17. 220,
Probability WS 1 Counting 1.28 2.13,800 3.5832 4.30 5.. 15 7.72 8.33, 5 11. 15,504 12. a)25 b)1050c)2275 13. a)20358,520 b) 171 c) 55,770 d) 12,271,512e) 1128 f) 17 14. 438 15. 2,000 1. 11,700 17. 220,
Toss two coins 10 times. Record the number of heads in each trial, in a table.
 Coin Experiment When we toss a coin in the air, we expect it to finish on a head or tail with equal likelihood. What to do: Toss one coin 20 times. ecord the number of heads in each trial, in a table:
Collecting, Displaying, and Analyzing Data
 Collecting, Displaying, and Analyzing Data Solutions Key Are You Ready? 1. 3 1 5 1 4 1 7 4 5 19 4 5 4 3 4 5 4.75 3.. 1 1.7 1 1.8 5 5.7 3 3 5 1.9 5. 87, 10, 103, 104, 105, 118 6. 19, 4, 33, 56, 65, 76,
#2. A coin is tossed 40 times and lands on heads 21 times. What is the experimental probability of the coin landing on tails?
 1 Pre-AP Geometry Chapter 14 Test Review Standards/Goals: A.1.f.: I can find the probability of a simple event. F.1.c.: I can use area to solve problems involving geometric probability. S.CP.1: I can define
Mathematicsisliketravellingona rollercoaster.sometimesyouron. Mathematics. ahighothertimesyouronalow.ma keuseofmathsroomswhenyouro
 Mathematicsisliketravellingona rollercoaster.sometimesyouron Mathematics ahighothertimesyouronalow.ma keuseofmathsroomswhenyouro Stage 6 nalowandshareyourpracticewit Handling Data hotherswhenonahigh.successwi
Def: The intersection of A and B is the set of all elements common to both set A and set B
 Def: Sample Space the set of all possible outcomes Def: Element an item in the set Ex: The number "3" is an element of the "rolling a die" sample space Main concept write in Interactive Notebook Intersection:
Data Analysis and Numerical Occurrence
 Data Analysis and Numerical Occurrence Directions This game is for two players. Each player receives twelve counters to be placed on the game board. The arrangement of the counters is completely up to
Most of the time we deal with theoretical probability. Experimental probability uses actual data that has been collected.
 AFM Unit 7 Day 3 Notes Theoretical vs. Experimental Probability Name Date Definitions: Experiment: process that gives a definite result Outcomes: results Sample space: set of all possible outcomes Event:
3. A box contains three blue cards and four white cards. Two cards are drawn one at a time.
 MATH 310 FINAL EXAM PRACTICE QUESTIONS solutions 09/2009 A. PROBABILITY The solutions given are not the only method of solving each question. 1. A fair coin was flipped 5 times and landed heads five times.
MATH STUDENT BOOK. 7th Grade Unit 6
 MATH STUDENT BOOK 7th Grade Unit 6 Unit 6 Probability and Graphing Math 706 Probability and Graphing Introduction 3 1. Probability 5 Theoretical Probability 5 Experimental Probability 13 Sample Space 20
PRE TEST. Math in a Cultural Context*
 P grade PRE TEST Salmon Fishing: Investigations into A 6P th module in the Math in a Cultural Context* UNIVERSITY OF ALASKA FAIRBANKS Student Name: Grade: Teacher: School: Location of School: Date: *This
Lesson 8: The Difference Between Theoretical Probabilities and Estimated Probabilities
 Lesson 8: The Difference Between Theoretical Probabilities and Estimated Probabilities Did you ever watch the beginning of a Super Bowl game? After the traditional handshakes, a coin is tossed to determine
Chapter Start Thinking! For use before Activity ; 4; Warm Up. For use before Activity Start Thinking!
 . This cylindrical bucket has a smaller diameter than the cylindrical bucket from Exercise. This cylindrical bucket is holding 6 cubic inches of water because that is the volume of the cube bucket. If