By the Numbers. Obtaining and Using Data in Your Communication Efforts
|
|
|
- Barnaby Miller
- 5 years ago
- Views:
Transcription
1 By the Numbers Obtaining and Using Data in Your Communication Efforts NABE-COMM 2013 Sep 27, 2013
2 By the Numbers Conor Jensen TexasBarBooks Kerstin Firmin The Bar Association of San Francisco Anna Zanolli Oregon State Bar Moderator: Barry Kolar Tennessee State Bar NABE-COMM 2013 Sep 27, 2013
3 What is the data? Conor Jensen TexasBarBooks NABE-COMM 2013 Sep 27, 2013


4 THE TRUTH Conor Jensen Web Content Specialist
5 GOOGLE ANALYTICS IS A PLACE WHERE YOU CAN SEE WHAT WEBSITE VISITORS DO. YOU CAN DEFINE YOUR OWN UNITS OF MEASUREMENT TO JUDGE WHAT VISITORS DO. YOU CAN IMPROVE THE CHANCES FOR VISITORS TO DO WHAT YOU WANT THEM TO.


6 THOUGHT STYLE The INTUITIVE likes some data to use for construction. The RATIONAL likes all data to use for deduction. WHAT S THE CONNECTION?


7 APPLICATION Whether by bits of information, or a large amount of controlled data, a need exists to fit the puzzle pieces together. Consider the activity performed and apply consistent thinking methods. Insight should follow.
8 CASE STUDY: MARKETING MEETING THE SCENARIO: The TexasBarBooks Free Residential Lease Form in relation to the sales of our Real Estate Form Manual. THE OBJECTIVE: Is the free form helping sales of the product? How do I communicate the results internally?
9 INTERNAL COMMUNICATION Let numbers speak over your opinions. Decision makers love making decisions. AND HERE S HOW:
10 DEFINE VALUE, SET UP GOAL GO TO: Admin Tab Create Goal (Populate the Boxes) Save Don t put the whole url in! Example: /free-form. Goals can be combined or separated. You get 20 per account. Learn the parameters. Example: The difference between visitors/unique/pages.

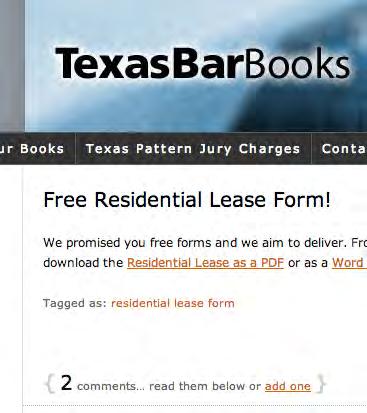
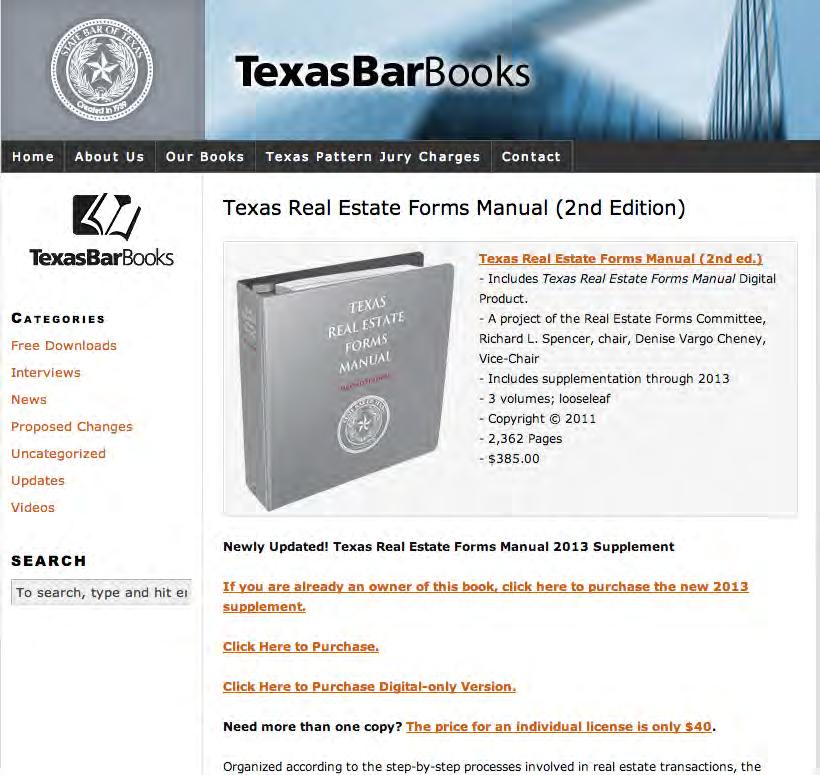
11 FROM HERE TO HERE /free-residential-lease-form/ /books/texas-real-estate-forms-manual/


12 VERIFY AND SAVE
13 ONE WEEK LATER


14 GO TO: TRAFFIC SOURCES REFERRALS CREATE CUSTOM REPORT ADD A FILTER WITH A CONTENT LABEL FOR THE URL

15 LOOKING DEEPER LET S LOOK AT THE OVERALL TRAFFIC SOURCES TOO:
16 INEVITABLE TAKEAWAYS Free forms draw visitors! Non lawyers are just as apt to find free forms because they enter the search words Free Form. Non lawyers don t buy our Real Estate Forms Manual. What s actionable? Offer free forms, choose ones lawyers want.
17 The truth is what works. William James
18 How to get the data Kerstin Firmin The Bar Association of San Francisco NABE-COMM 2013 Sep 27, 2013

19 Down and Dirty with Data How to set up Google Analytics and get data you can use K Firmin The Bar Association of San Francisco

20 WHAT GOOGLE ANALYTICS CAN DO FOR YOU Visits/ visitors Traffic sources/ timing Content/ navigation Website optimization Content planning Timing K Firmin The Bar Association of San Francisco

21 K Firmin The Bar Association of San Francisco THE TRACKING CODE

22 K Firmin The Bar Association of San Francisco THE TRACKING CODE Set-up on a traditional website


23 K Firmin The Bar Association of San Francisco THE TRACKING CODE Set-up on a WordPress site

24 DATA & VISITOR FLOW What were the top three articles last month? Last year? How many of our visitors use ipads? Do mobile visitors stay as long as desktop users? Where should we invest online marketing dollars? How are people finding us, and what keywords are they using? What browsers are people using to view our website? How do people navigate our site? K Firmin The Bar Association of San Francisco


25 OTHER DATA SOURCES Power point presentations Reports Grant proposals Donor cultivation materials Annual reports Spreadsheets Staff meeting reports s Pew Research Census City Data News Reports and studies Government databases Google and you shall find K Firmin The Bar Association of San Francisco
26 Creative with Data How to engage with data K Firmin The Bar Association of San Francisco

27 WHY INFOGRAPHICS? People aren't reading - they're content 'snacking' K Firmin The Bar Association of San Francisco


28 K Firmin The Bar Association of San Francisco INFO-SNACKS

29 DIY INFOGRAPHICS Difficulty: very easy Visualize Me: Turn a resume into an infographic in minutes Ideas for use: Make website bios more interesting Share mediator, speaker bios K Firmin The Bar Association of San Francisco


30 DIY INFOGRAPHICS Difficulty: easy TimelineJS: Create an interactive timeline Ideas for use: Replace static historic timeline with interactive timeline that includes video, pictures, other interactive content Create a timeline for a project or program K Firmin The Bar Association of San Francisco

31 DIY INFOGRAPHICS Difficulty: advanced Make it from scratch: K Firmin The Bar Association of San Francisco Restrict your color palette Use sans-serif fonts Restrict white space and direct the eye Add graphics that support or illustrate your points List sources at the bottom Let people know it s ok to share the graphic Add embed code
32 How to display the data Anna Zanolli Oregon State Bar NABE-COMM 2013 Sep 27, 2013


33 You re using WHAT font? Infographics I m so glad we agreed on a sans serif! How to stop good data from looking bad

34 Infographic From Wikipedia, the free encyclopedia Information graphics or infographics are graphic visual representations of information, data or knowledge intended to present complex information quickly and clearly. They can improve cognition by utilizing graphics to enhance the human visual system s ability to see patterns and trends. Source:

35 Infographic 1869 Charles Minard s chart showing the number of men in Napoleon s 1812 Russian campaign army, their movements, as well as the temperature they encountered on the return path. Image source:

36 Infographic 2013 Designer Unknown Visualizing the Microsoft-Nokia Deal: This infographic takes charts previously published by Nielsen, and uses them to provide context to the news story of Microsoft acquiring Nokia s handset devices unit for $7.2 Billion. Source: and newswire/2013/whos-winning-the-u-s-smartphone-market-.html
37 Graphical elegance is often found in simplicity of design and complexity of data. Edward R. Tufte The Visual Display of Quantitative Information


38 Simple Design + No data Love Too much? Too little? Heart: s1600/all_you_need_is_love.jpg Scrabble pieces:


39 Complex design + Complex data All you need is love but a bank account couldn t hurt. Too much? Source: via visual.ly/all-you-need-love


40 Simple design + Complex data All you need is love The right balance? Hierarchy of needs: Things you Need:
41 Data graphics visually display measured quantities by means of the combined use of points, lines, a coordinate system, numbers, symbols, words, shading, and color. Edward R. Tufte The Visual Display of Quantitative Information
42 Know the rules before you break them.
43 Design Guidelines Edward R. Tufte The Visual Display of Quantitative Information Attractive displays of statistical information have a properly chosen format and design use words, numbers, and drawing together reflect a balance, a proportion, a sense of relevant scale display an accessible complexity of detail often have a narrative quality, a story to tell about the data are drawn in a professional manner, with the technical details of production done with care avoid content-free decoration, including chart junk.
44 Friendly Data Graphics Edward R. Tufte The Visual Display of Quantitative Information Spell out your words abbreviations abound in unfriendly data graphics Run them from left to right not vertically or in several directions Use little messages to help explain data don t require references to scattered text Place labels on the graphic make a legend unnecessary Provoke curiosity with your graphic don t fill it with chartjunk Be sensitive to color-deficient viewers; favor blues don t use red and green for essential contrasts Use clear and precise type don t be overbearing with your type choice Type is upper-and-lower case, with serifs don t use all caps
45 More design C.R.A.P Robin Williams The Non-Designer s Design Book Contrast If two items are not exactly the same, then make them different. REALLY different. If everything is red, it might as well be black. If everything is red, it might as well be black. Repetition Repeat some aspect of the design throughout the entire piece. Alignment Nothing should be placed on the page arbitrarily. Every item should have a visual connection with something else on the page. Proximity Group related items together so related items are seen as one cohesive group.


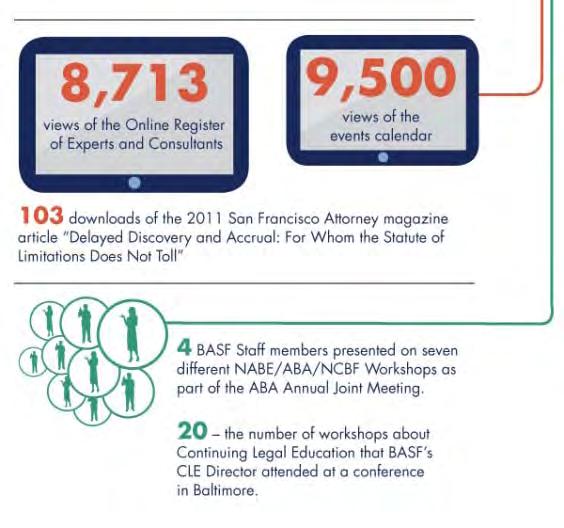
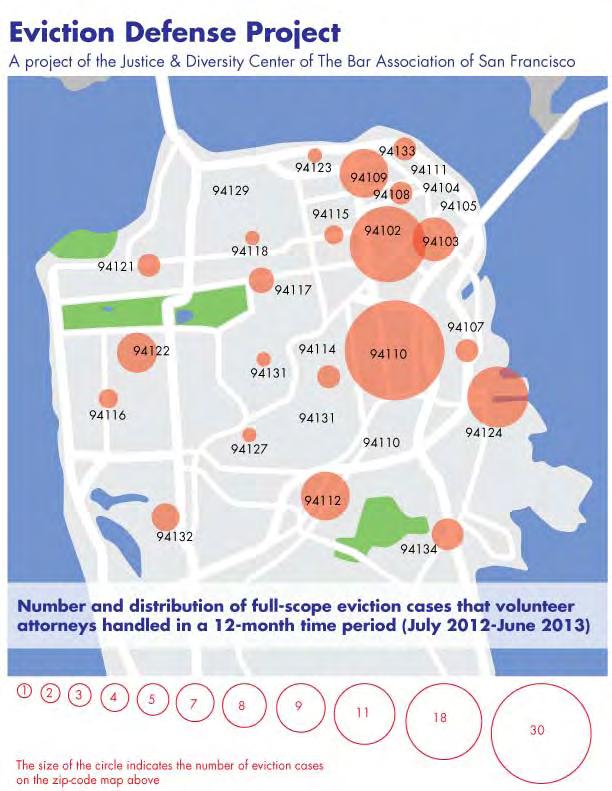
46 A Week at BASF An infographic by Kerstin Firmin BASF

47 A Week at BASF The data behind the infographic No much to report for the CLE department this week because of the ABA annual, so this area wasn t included in the infographic.
48 By the Numbers Conor Jensen TexasBarBooks Kerstin Firmin The Bar Association of San Francisco Anna Zanolli Oregon State Bar Moderator: Barry Kolar Tennessee State Bar NABE-COMM 2013 Sep 27, 2013
Scientific Communication and visual reasoning. presentation for Institute for Leadership in Technology and Management July 5, 1999 Dan Little
 Scientific Communication and visual reasoning presentation for Institute for Leadership in Technology and Management July 5, 1999 Dan Little Edward Tufte, theorist of scientific graphics A political scientist
Tables: Tables present numbers for comparison with other numbers. Data presented in tables should NEVER be duplicated in figures, and vice versa
 Tables and Figures Both tables and figures are used to: support conclusions illustrate concepts Tables: Tables present numbers for comparison with other numbers Figures: Reveal trends or delineate selected
HIGHWAY SAFETY RESEARCH GROUP
 1. Why use data visualization? 2. Why we perceive data visualizations better than tabular data? 3. How do we choose the proper visualization to display our data? 4. What are the Dos and Don ts of creating
Lecture Topic Projects 1 Intro, schedule, and logistics 2 Applications of visual analytics, data types 3 Basic tasks Project 1 out 4 Data preparation
 Lecture Topic Projects 1 Intro, schedule, and logistics 2 Applications of visual analytics, data types 3 Basic tasks Project 1 out 4 Data preparation and representation 5 Data reduction, notion of similarity
The Four P s to Create Websites that Attract Clients
 that Attract Clients Nearly 40% of all law firms don t have websites. Only one third are optimized for mobile traffic as well. And only 35% have been updated in the past three years. And yet most consumers
digital marketing launch process
 digital marketing launch process RUN YOUR OWN DIGITAL MARKETING CAMPAIGN The number of moving parts in a fully functioning digital marketing campaign can be overwhelming. USE THIS CHECKLIST TO MAKE SURE
Presentation Design Principles. Grouping Contrast Proportion
 Presentation Design Principles Grouping Contrast Proportion Usability Presentation Design Framework Navigation Properties color, size, intensity, metaphor, shape, Object Text Object Object Object Object
Visualizing Data. Telling a story with information
 Visualizing Data Telling a story with information There were 5 Exabytes of information created between the dawn of civilization through 2003, but that much information is now created every two days. (Kind
Addendum COLOR PALETTES
 Addendum Followup Material from Best Practices in Graphical Data Presentation Workshop 2010 Library Assessment Conference Baltimore, MD, October 25-27, 2010 COLOR PALETTES Two slides from the workshop
Presentation Design Principles. Grouping Contrast Proportion R.I.T. S. Ludi/R. Kuehl p. 1 R I T. Software Engineering
 Presentation Design Principles Grouping Contrast Proportion S. Ludi/R. Kuehl p. 1 Usability Presentation Design Framework Navigation Object Text Properties color, size, intensity, metaphor, shape, Object
Infographic: Google Search Prevalence by State
 Chitika Insights Infographic: Google Search Prevalence by State August 13, 2013 A publication of 1 Introduction While Google has long been the most-used search engine domestically, Chitika Insights latest
The Art and Science of Communicating Data
 The Art and Science of Communicating Data Information Design + Data Visualization Trends and Resources for Institutional Researchers Presented by Holly Goodson USG-IRP Spring Meeting March 17, 2011 What
Infographics at CDC for a nonscientific audience
 Infographics at CDC for a nonscientific audience A Standards Guide for creating successful infographics Centers for Disease Control and Prevention Office of the Associate Director for Communication 03/14/2012;
SlideShare Traffic Rush
 If you re wondering how you can possibly use a slide-hosting website like SlideShare (https://www.slideshare.net) to your advantage, then you re reading the correct article. SlideShare may seem like an
Graphical Excellence Sandra Murray Jonathan Merrell
 These presenters have nothing to disclose Graphical Excellence Sandra Murray Jonathan Merrell April 24, 2013 Why Graphical Displays of Data? 1. Almost all the potential learning from data is available
Voice Recorder Recording/Playing Voice
 Dictionary... -2 Using Dictionaries... -2 Search...-4 Searching Text... -4 Document Viewer...-5 Opening PC Documents... -5 Notepad...-6 Saving Text... -6 Scratch Pad... -7 ASCII Art...-8 Using ASCII Art...
Analysis, Molli McGrath Web Site
 Analysis, Molli McGrath Web Site Client: Molli McGrath (not actual person) Site: mollimcgrath.com (not actual site) Overall Look & Design This is what I would call a typical-looking artist s site from
Why Should We Care? More importantly, it is easy to lie or deceive people with bad plots
 Elementary Plots Why Should We Care? Everyone uses plotting But most people ignore or are unaware of simple principles Default plotting tools (or default settings) are not always the best More importantly,
How to Blog to the Vanguard Website
 How to Blog to the Vanguard Website Guidance and Rules for Blogging on the Vanguard Website Version 1.01 March 2018 Step 1. Get an account The bristol vanguard website, like much of the internet these
Tell your Public Data Stories
 Welcome # T C 1 8 Tell your Public Data Stories Jonni Walker Senior Data Artist Email: jwalker@tableau.com Twitter: @jonni_walker Florian Ramseger Senior Product Specialist, Tableau Public EMEA Email:
We encourage you to print this booklet for easy reading. Blogging for Beginners 1
 We have strived to be as accurate and complete as possible in this report. Due to the rapidly changing nature of the Internet the contents are not warranted to be accurate. While all attempts have been
Building a Chart Using Trick or Treat Data a step by step guide By Jeffrey A. Shaffer
 Building a Chart Using Trick or Treat Data a step by step guide By Jeffrey A. Shaffer Each year my home is bombarded on Halloween with an incredible amount of Trick or Treaters. So what else would an analytics
Website Design & Development Project Scope Questionnaire
 Project Scope Questionnaire Accella put together this resource to help our clients define the scope of work for their web design & development projects. Please be aware that you do not need to answer every
Information and Communication Technologies (ICT)
") Information and Communication Technologies (ICT) Curriculum Framework Grades 1-12 Litchfield School District Approved 2/2016 1 Philosophy of ICT Education The importance of preparing students for college
Information and Communication Technologies (ICT) Curriculum Framework Grades 1-12 Litchfield School District Approved 2/2016 1 Philosophy of ICT Education The importance of preparing students for college
Principles of Graphical Excellence Best Paper: ALAIR April 5 6, 2001 AIR: June 2-5, 2002, Toronto Focus-IR, February 21, 2003
 Anna T. Waggener, Ph.D. Institutional Assessment United States Army War College Principles of Graphical Excellence Best Paper: ALAIR April 5 6, 2001 AIR: June 2-5, 2002, Toronto Focus-IR, February 21,
13 WAYS TO TURN YOUR WEBSITE INTO A MONEY MACHINE
 13 WAYS TO TURN YOUR WEBSITE INTO A MONEY MACHINE 13 WAYS TO TURN YOUR WEBSITE INTO A MONEY MACHINE TABLE OF CONTENTS #13: Thought Leadership Oriented Blog #12: Referral Program Page #11: Industries Served
Senior Portfolio Instructions & Requirements Fall 2018
 Senior Portfolio Instructions & Requirements Fall 2018 The purpose of the portfolio is to demonstrate to a jury of faculty and industry professionals what you have learned during your time here, and whether
Shareaholic Editorial Guidelines
 Shareaholic Editorial Guidelines October 2012 Thanks for your interest in writing for the Shareaholic blog! We have high standards for content, which is probably why you d like to post with us. This could
To Easily Navigate this Presentation See that the Full Page is Showing and then Use Page Up and Page Down Keys or Right and Left Keyboard Arrow Keys
 Top Left Top Right To Easily Navigate this Presentation See that the Full Page is Showing and then Use Page Up and Page Down Keys or Right and Left Keyboard Arrow Keys Bottom Left Bottom Right Unite with
10/2/2015. Presenter Disclosure. Objectives
 A Picture is Worth A Thousand Words The Use of Infographics in School Nursing Kim Ragan, RN, BSN, NCSN 32 Annual NC School Nurse Conference October 15 16, 2015 Presenter Disclosure I disclose the absence
Persuasive. How to Write Persuasive. SEO Proposals
 Persuasive SEO Proposals How to Write Persuasive SEO Proposals How to Write Persuasive SEO Proposals! You may love SEO, but you didn t get into it because you love writing and submitting proposals. You
Speaker Website Checklist: Branding
 Speaker Website Checklist: Branding You can create a single page on your existing website OR a whole website dedicated to your speaking. The first part of this checklist is for adding simply one page to
THE LOGO 4 COLOR PALETTE 6 LOGO USAGE 7 THE TYPEFACE 8 GENERAL GUIDELINES 10 TYPOGRAPHY USAGE 11 SUPPLEMENTAL ICONS 12
 BRAND GUIDELINES THE LOGO 4 Clear Area Alternate Logo Versions COLOR PALETTE 6 Color Options LOGO USAGE 7 THE TYPEFACE 8 Suggested Uses GENERAL GUIDELINES 10 TYPOGRAPHY USAGE 11 SUPPLEMENTAL ICONS 12
Korean Wave (Hallyu) of Knowledge through Content Curation, Infographics, and Digital Storytelling
 of Knowledge through Content Curation, Infographics, and Digital Storytelling") , pp.6-10 http://dx.doi.org/10.14257/astl.2017.143.02 Korean Wave (Hallyu) of Knowledge through Content Curation, Infographics, and Digital Storytelling Seong Hui Park 1, Kyoung Hee Kim 2 1, 2 Graduate
, pp.6-10 http://dx.doi.org/10.14257/astl.2017.143.02 Korean Wave (Hallyu) of Knowledge through Content Curation, Infographics, and Digital Storytelling Seong Hui Park 1, Kyoung Hee Kim 2 1, 2 Graduate
Traffic Tsunami. Your Ultimate Source For GUARANTEED FREE VIRAL Traffic PRICE: $49.95
 1 Traffic Tsunami Your Ultimate Source For GUARANTEED FREE VIRAL Traffic PRICE: $49.95 UNNANOUNCED SPECIAL BONUS! Brand *NEW* Video Reveals Secret: How To Make Up To $25,857 EVERY Month! EXTRA BONUS! Important:
10 WAYS TO REACH BOOMERS ON FACEBOOK
 10 WAYS TO REACH BOOMERS ON FACEBOOK 10 Ways to Reach Boomers on Facebook According to DMN3 s January 2015 online survey of 1,000 Boomers, 83% of them spend at least one hour per week on Facebook, and
Cricut Design Space App for ipad User Manual
 Cricut Design Space App for ipad User Manual Cricut Explore design-and-cut system From inspiration to creation in just a few taps! Cricut Design Space App for ipad 1. ipad Setup A. Setting up the app B.
BRANDING 101 FOR SHAKLEE DISTRIBUTORS - Learn the basics of blogging BLOGGING. Copyright 2016 Virtual Wonders Web Solutions
 BLOGGING Why blogging? A blog is a powerful tool to help you attract traffic and capture leads for your Shaklee business. Every time you create a blog post, search engines will index your post and you
This project is an opportunity to create a unique logo for a
 Logo Design For A Performing Arts Center Dr. Paula DiMarco paula.j.dimarco@csun.edu This project is an opportunity to create a unique logo for a performing arts center. Objective: To create a logo for
background research word count Title SUBMISSION GUIDELINES FOR PUBLISHING SCIENCE FAIR WRITTEN WORK
 Name and number January 26 Science Fair background research word count Title SUBMISSION GUIDELINES FOR PUBLISHING SCIENCE FAIR WRITTEN WORK Open a single Word document for your Science Fair project. That
Your Guide to Profitable Niche Market Research
 Your Guide to Profitable Niche Market Research Brought To You By Free-Ebooks-Canada.com You may give away this report. It may not be sold or modified on any manner. Disclaimer Reasonable care has been
Foundation Skills. Digital Citizenship. Communication & Collaboration. Research & Information Fluency
 Information and Technology Literacy Grade K-1 Benchmark Checklist Digital Citizenship Students will understand: o The terms internet and digital community o Rules on the playground equal rules on the internet
Chitika Insights The Value of Google Result Positioning
 Chitika Insights The Value of Google Result Positioning June 7, 2013 A publication of 1 Introduction Being the top Google result for a key word or phrase is often seen as a tremendous achievement for a
Introduction to: Microsoft Photo Story 3. for Windows. Brevard County, Florida
 Introduction to: Microsoft Photo Story 3 for Windows Brevard County, Florida 1 Table of Contents Introduction... 3 Downloading Photo Story 3... 4 Adding Pictures to Your PC... 7 Launching Photo Story 3...
Map Direct Lite. Contents. Quick Start Guide: Drawing 11/05/2015
 Map Direct Lite Quick Start Guide: Drawing 11/05/2015 Contents Quick Start Guide: Drawing... 1 Drawing, Measuring and Analyzing in Map Direct Lite.... 2 Measure Distance and Area.... 3 Place the Map Marker
DIGITAL MARKETING CHECKLIST. for. Home Remodelers & Builders
 DIGITAL MARKETING CHECKLIST for Home Remodelers & Builders As a leading web and digital marketing agency for home remodelers and builders, we ve identified the key areas you should focus on to take your
Website Planning Questionnaire
 Website Planning Questionnaire Learn about their business. Find a problem. Develop a solution. Below we have compiled a very long list of questions that you may want to ask yourself - or your clients -
EFFECTIVE WEBSITES WHAT IS AN EFFECTIVE WEBSITE?
 Support: 800-669-2509 Sales: 843-413-8146 www.extendplatform.com extend@acstechnologies.com EFFECTIVE WEBSITES WHAT IS AN? Creating an online presence can be a powerful way to grow your church. An effective
OOo Switch: 501 Things You Wanted to Know About Switching to OpenOffice.org from Microsoft Office
 OOo Switch: 501 Things You Wanted to Know About Switching to OpenOffice.org from Microsoft Office Tamar E. Granor Hentzenwerke Publishing ii Table of Contents Our Contract with You, The Reader Acknowledgements
Graphics. [2,499 text words]
![Graphics. [2,499 text words]](/thumbs/77/75111419.jpg "Graphics. [2,499 text words]") Graphics [2,499 text words] Graphics, also referred to as infographics, are visual elements used to explain information in a story in a way that text, photos or video alone would not be able to do. Graphics
Graphics [2,499 text words] Graphics, also referred to as infographics, are visual elements used to explain information in a story in a way that text, photos or video alone would not be able to do. Graphics
GETTING STARTED. Deciding What Tasks To Delegate To Your 123Employee Agent
 GETTING STARTED Deciding What Tasks To Delegate To Your 123Employee Agent This guide is NOT written exclusively for outsourcing to 123Employee, you can use this guide to help you create a delegation blueprint
INTEGRATING DESIGN AND ENGINEERING, II: PRODUCT ARCHITECTURE AND PRODUCT DESIGN
 INTERNATIONAL CONFERENCE ON ENGINEERING AND PRODUCT DESIGN EDUCATION 13-14 SEPTEMBER 2007, NORTHUMBRIA UNIVERSITY, NEWCASTLE UPON TYNE, UNITED KINGDOM INTEGRATING DESIGN AND ENGINEERING, II: PRODUCT ARCHITECTURE
Why Google Result Positioning Matters
 Why Google Result Positioning Matters A publication of Introduction 1 Research Methodology 2 Results + Report Findings 3 Traffic Distribution by Position 4 Traffic Distribution by Page 5 The Verdict +
Minute Marketing Ideas. Website/Blog. Writing
 101+ 5-Minute Marketing Ideas Website/Blog Pretend you are a first time visitor to your website and write down what you notice Update one page on your website Make sure any dates listed on your website
 By Mazarine Treyz, Social Media & Fundraising Trainer, Author, The Wild Woman's Guide to Fundraising, (2010) 3-D Reputation Engine (2011) Contact: info@wildwomanfundraising.com 512-763-5161 To start, you
Would You Like To Earn $1000 s With The Click Of A Button?
 Would You Like To Earn $1000 s With The Click Of A Button? (Follow these easy step by step instructions and you will) - 100% Support and all questions answered! - Make financial stress a thing of the past!
Videos get people excited, they get people educated and of course, they build trust that words on a page cannot do alone.
 Time and time again, people buy from those they TRUST. In today s world, videos are one of the most guaranteed ways to build trust within minutes, if not seconds and get a total stranger to enter their
THE PRINCIPLES OF GRAPHIC DESIGN How to arrange elements to effectively communicate with the viewer
 THE PRINCIPLES OF GRAPHIC DESIGN How to arrange elements to effectively communicate with the viewer Aims: 1. To understand the visual design principles of graphic design. 2. To understand how visual design
Infographics: Display Data for Easy Interpretation
 Infographics: Display Data for Easy Interpretation Course objectives: Create new infographics Customise layouts Edit content using text, images, media, charts and maps Publish, Present and Print Student
In this tutorial you will use Photo Story 3, a free software program from Microsoft, to create digital stories using text, graphics and music.
 In this tutorial you will use Photo Story 3, a free software program from Microsoft, to create digital stories using text, graphics and music. What you will learn: o System Requirements and Recommendations
The Soulful Storytellers' Blog-Building Playbook
 The Soulful Storytellers' Blog-Building Playbook Before we begin... Self-hosted (Wordpress.org) versus Wordpress.com Wordpress.com is easy to set up, but lacks important functions, even if you buy your
A Beginner s Guide to Website Traffic
 A Beginner s Guide to Website Traffic When you first start your website, it can be a daunting thought that you re starting from zero and must get your traffic up so that you can start making an impact.
Telling the Public Health Story using InfoGraphics
 Telling the Public Health Story using InfoGraphics Issac Evans September 16, 2014 Office of the Associate Director for Communication Division for Communication Services DATA VISUALIZATION Data Visualization
No Cost Online Marketing
 No Cost Online Marketing No matter what type of Internet business you have, you need to be promoting it at all times. If you don t make the effort to tell the right people about it (i.e. those people who
Experiment G: Introduction to Graphical Representation of Data & the Use of Excel
 Experiment G: Introduction to Graphical Representation of Data & the Use of Excel Scientists answer posed questions by performing experiments which provide information about a given problem. After collecting
Copyright 2015 Silicon Valley Digital Marketing Institute, All Rights Reserved
 If your business is hoping to expand their business reach with some new opportunities, then Tumblr is the tool you should be thinking about incorporating into your social media marketing strategy. If you
Betha Gutsche November 6, 2012
 The Power of Image Betha Gutsche November 6, 2012 The POW POWer! Image of The Infant Brain recognizes the visual pattern that makes up the human face differentiates a realistic image of a face from an
METRO TILES (SHAREPOINT ADD-IN)
") METRO TILES (SHAREPOINT ADD-IN) November 2017 Version 2.6 Copyright Beyond Intranet 2017. All Rights Reserved i Notice. This is a controlled document. Unauthorized access, copying, replication or usage
METRO TILES (SHAREPOINT ADD-IN) November 2017 Version 2.6 Copyright Beyond Intranet 2017. All Rights Reserved i Notice. This is a controlled document. Unauthorized access, copying, replication or usage
How To Make Money With CPALead
 By (melek.taus@yahoo.com) This free ebook has been downloaded from: http://easy-cpalead-money.blogspot.com/p/download.html If you already registered to CPALead please take the time to complete a two minutes
The Joy of SVGs CUT ABOVE. pre training series 2. svg design Course. Jennifer Maker. CUT ABOVE SVG Design Course by Jennifer Maker
 CUT ABOVE svg design Course pre training series 2 The Joy of SVGs by award-winning graphic designer and bestselling author Jennifer Maker Copyright Jennifer Maker page 1 please Do not copy or share Session
The Basics of Hand Lettering with Adam Vicarel
 1 ADAMVICAREL.COM/GOODTYPE @adamvicarel adamvicarel.com @goodtype goodtype.us 2 Our Expectations This class is about developing an understanding, re-establishing a perspective, and learning processes and
Get Started Building Your Website Part One: Planning. Get started building your website. Part One: Planning
 Get started building your website Part One: Planning Introduction Planning Your Website Branding and Messaging Your Audience Planning a Site that Attracts Visitors Table of Contents Make It Flow Writing
Using Google Analytics to Make Better Decisions
 Using Google Analytics to Make Better Decisions This transcript was lightly edited for clarity. Hello everybody, I'm back at ACPLS 20 17, and now I'm talking with Jon Meck from LunaMetrics. Jon, welcome
Church Site Project, an integrated, webcontent-management
 An essay on poverty in nigeria. If you wonder is there someway to make sure the long distance communications like telephone calls would not cost a fortune, I must tell you - there is a way to significantly
4 Don ts of Medical Practice Marketing
 Transcript Details This is a transcript of an educational program accessible on the ReachMD network. Details about the program and additional media formats for the program are accessible by visiting: https://reachmd.com/programs/optimize-business-finances-outreach/4-donts-medical-practicemarketing/10022/
UC Santa Barbara CSISS Classics
 UC Santa Barbara CSISS Classics Title Edward Tufte, The Visual Display of Quantitative Information, 1983. CSISS Classics Permalink https://escholarship.org/uc/item/9mn2v1f7 Author Corbett, John Publication
How to Start a Blog & Use It To Squash Writer s Block
 How to Start a Blog & Use It To Squash Writer s Block by Robert Lee Brewer In these days of publishing and media change, writers have to build platforms and learn how to connect to audiences if they want
Robin Fay, Best practices for designs: tips and tools you can use
 Robin Fay, 2016 Best practices for designs: tips and tools you can use AGENDA What is design? Design elements Color theory basics Space and layout The web vs. print Photography tips WHAT IS DESIGN Design
Contents. Introduction 3. About Festyvent 3. Document Purpose 3. App Icon Custom and Enterprise 5. Splash Screen Custom and Enterprise 5
 FESTYVENT IMAGE MAP Contents Introduction 3 About Festyvent 3 Document Purpose 3 App Icon Custom and Enterprise 5 Splash Screen Custom and Enterprise 5 Welcome Screens 6 Navigation Icons 7 Top Level Images
Statistics. Graphing Statistics & Data. What is Data?. Data is organized information. It can be numbers, words, measurements,
 Statistics Graphing Statistics & Data What is Data?. Data is organized information. It can be numbers, words, measurements, observations or even just descriptions of things. Qualitative vs Quantitative.
What is Tableau and Why Should I Care? Karen Rahmeier and Melissa Perry, Codecinella Madison WI, June 26, 2018
 What is Tableau and Why Should I Care? Karen Rahmeier and Melissa Perry, Codecinella Madison WI, June 26, 2018 About me Karen Rahmeier Software developer since 1998 Team Lead of software developers, Wisconsin
And that s what this short report is all about. I ll walk you through the process and to make it easy to follow along- in just 9 simple steps.
 Table of Contents Introduction... 3 Step 1 - Look At Your Stats... 4 Step 2 - Pick Your Blog Posts... 5 Step 3 - Update The Content... 6 Step 4 - Monetize... 7 Step 5 - Make it Pretty... 9 Step 6 - Is
Why Should We Care? Everyone uses plotting But most people ignore or are unaware of simple principles Default plotting tools are not always the best
 Elementary Plots Why Should We Care? Everyone uses plotting But most people ignore or are unaware of simple principles Default plotting tools are not always the best More importantly, it is easy to lie
Creating Your Own Ballad of an Eagle Scout Using the Ballad Template. Produced by Scoutworks.weebly.com All Rights Reserved
 Creating Your Own Ballad of an Eagle Scout Using the Ballad Template Produced by Scoutworks.weebly.com All Rights Reserved Please take NOTE: This tutorial has been designed to show you how you can create
Quick Profits Machine
 Quick Profits Machine By- Abir Bhadra Raju Introduction: Welcome to Quick Profits Machine Let us start off by saying thank you for your decision to invest in yourself and in this powerful training. You
DOWNLOADABLE MARKETING PLAN SPREAD YOUR MUSIC
 DOWNLOADABLE MARKETING PLAN SPREAD YOUR MUSIC For the DIY creative. OVERALL MISSION The first thing you ll need to do is discover your what is the ultimate objective you have with this plan. Why do you
Don t Even Think About Starting a Website or Blog Until You Read This Report...
 Don t Even Think About Starting a Website or Blog Until You Read This Report... Traditional, static websites have been the backbone of the internet for years... As someone who has setup many, many HUNDREDS
Standard Assessment Project
 Standard Assessment Project Standard -Expansion, Innovation, and Reform, 1801-1861 -The student will understand how explosive growth (economic, demographic, geographic)and technological innovation transformed
INTRODUCTION. Overview.
 2017 MEDIA KIT INTRODUCTION Overview In 2001, a group was started for Information Technology professionals who wanted to network the right way. 6500+ members, 200+ events and over 2000 people finding new
Graphing with Excel. Data Table
 Graphing with Excel Copyright L. S. Quimby There are many spreadsheet programs and graphing programs that you can use to produce very nice graphs for your laboratory reports and homework papers, but Excel
What is exhibition design?
 What is exhibition design? good exhibit design creates rich experiences in real time utilizing space, movement and memory to facilitate multi-layered communication. visual and spatial forms should make
Internet Marketing for Immigration Practitioners. Presented by: Michael Niren. Immigration Lawyer Network (ILN) Montreal, May 2013
 Montreal, May 2013") Internet Marketing for Immigration Practitioners Presented by: Michael Niren (ILN) Montreal, May 2013 www.immigrationlawyer.com/marketing 2 Bloor Street East, Suite 3500 Toronto, ON, M4W 1A8 Canada Toll-Free:
Internet Marketing for Immigration Practitioners Presented by: Michael Niren (ILN) Montreal, May 2013 www.immigrationlawyer.com/marketing 2 Bloor Street East, Suite 3500 Toronto, ON, M4W 1A8 Canada Toll-Free:
Lancer Legend Thousand Oaks High School, Thousand Oaks, Calif.
 Students at Thousand Oaks High School drew on their backpacks, on their shoes, on notebook paper and even on themselves. Editor-in-chief Brandie Warr recognized this trend and suggested the theme Scratch
A FACEBOOK GUIDE FOR SALONS
 A FACEBOOK GUIDE FOR SALONS A DIGITAL MARKETING GUIDE FOR SALONS Set Up Time 3/5 Fairly straightforward to set up, but you shouldn t rush through the process. Leave yourself plenty of time to get it right.
Online Marketing Analysis Prepared For:
 Online Marketing Analysis Prepared For: Date: September 05, 2017 Prepared By: Chris Pistorius Overview This analysis goes through and details your current online marketing campaign. Each section details
Fundamentals of ModelBuilder
 Fundamentals of ModelBuilder Agenda An Overview of Geoprocessing Framework Introduction to ModelBuilder Basics of ArcToolbox Using ModelBuilder Documenting Models Sharing Models with Others Q & A Geoprocessing
How do i write a number sentence >>>CLICK HERE<<<
 How do i write a number sentence >>>CLICK HERE
Grades 6 8 Innoventure Components That Meet Common Core Mathematics Standards
 Grades 6 8 Innoventure Components That Meet Common Core Mathematics Standards Strand Ratios and Relationships The Number System Expressions and Equations Anchor Standard Understand ratio concepts and use
Accessibility for ExploreLearning Gizmos
 December 11, 2003 Accessibility for ExploreLearning Gizmos Raman Pfaff, ExploreLearning The power of the Web is in its universality. Access by everyone regardless of disability is an essential aspect.
Hanging Your Own Shingle? Put Your Best Foot Forward on Day One
 DALLAS HOUSTON Hanging Your Own Shingle? Put Your Best Foot Forward on Day One Hanging Your Own Shingle? Put Your Best Foot Forward on Day One By Scott Parks Androvett Legal Media & Marketing If you re