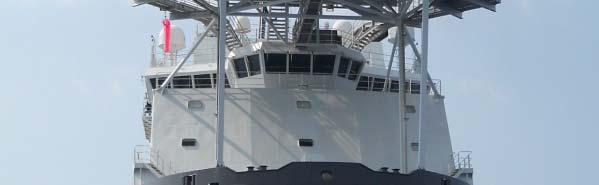
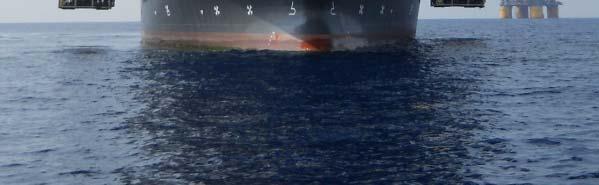
Global provider of diversified services and products in all phases of the offshore oilfield life cycle
|
|
|
- Randell Robbins
- 5 years ago
- Views:
Transcription


1 Investor Presentation January 2017


2 Forward-Looking Statements Statements we make in this presentation that express a belief, expectation, or intention are forward looking. Forward-looking statements are generally accompanied by words such as estimate, project, predict, believe, expect, anticipate, plan, forecast, budget, goal, or other words that convey the uncertainly of future events or outcomes. These forward-looking statements are based on our current information and expectations that involve a number of risks, uncertainties, and assumptions. Among the factors that could cause the actual results to differ materially from those indicated in the forward-looking statements are: industry conditions, prices of crude oil and natural gas, our ability to obtain and the timing of new projects, and changes in competitive factors. Should one or more of these risks or uncertainties materialize, or should the assumptions underlying the forward-looking statements prove incorrect, actual outcomes could vary materially from those indicated. For additional information regarding these and other factors, see our periodic filings with the Securities and Exchange Commission, including our most recent Reports on Forms 10-K and 10-Q. 2
3 Why Oceaneering? Global provider of diversified services and products in all phases of the offshore oilfield life cycle Strong market positions Solid balance sheet and cash flow Return of capital to our shareholders Leveraged to deepwater - longer term, deepwater is still critical to reserve replenishment 3
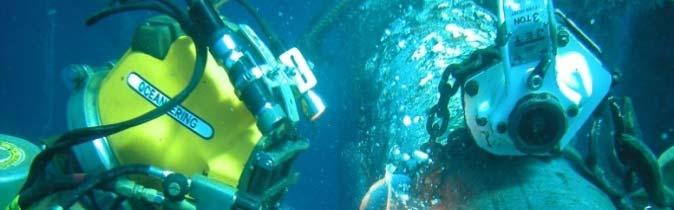
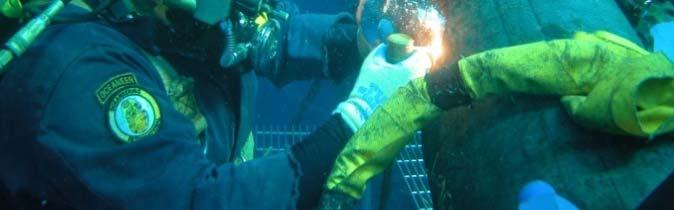
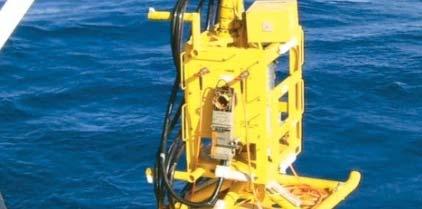
4 5 Operating Segments 1. Remotely Operated Vehicles ( ROVs ) ROVs) 2. Subsea Products 3. Subsea Projects 4. Asset Integrity 5. Advanced Technologies 4


 IWOCS Installation & Workover")
 Vessel-based Installation")
 IWOCS (SSP) Subsea Hardware")
 IWOCS (SSP) ROV =")

5 In All Phases of the Offshore Oilfield Life Cycle PHASE EXPLORATION DEVELOPMENT PRODUCTION DECOMMISSIONING % OII Revenue 10% 50% 35% 5% #1 Market # of Operating # of Subsea Tree # of Subsea Trees # of Field Driver Floating Drilling Rigs Installations In Service Abandonments Business Segment Product and Service Revenue Streams ROV Survey (SP) Tooling (SSP) ROV Survey (SP) Tooling (SSP) IWOCS Installation & Workover Control Systems (SSP) Subsea Hardware (SSP) Umbilicals (SSP) Vessel-based Installation Services (SP) Inspection Services (AI) ROV Tooling (SSP) IWOCS (SSP) Subsea Hardware (SSP) Vessel-based Inspection, Maintenance & Repair Services (SP) Inspection Services (AI) ROV Tooling (SSP) IWOCS (SSP) ROV = Remotely Operated Vehicles SSP = Subsea Products SP = Subsea Projects AI = Asset Integrity 5
6 Largest Exposure is in Field Development Oilfield Revenue Mix 5% 10% 35% 50% Source: OII Estimates: 2015 Exploration Development Production Decommissioning 6
7 Revenue by Business Segment First 9 Months 2016* 14% 7% 29% 12% 10% 27% 12% 13% 23% 16% 34% 20% 31% 21% 31% $3.7 Billion $3.1 Billion $1.8 Billion ROV Subsea Products Subsea Projects Asset Integrity Advanced Technologies * Nine Months Ended September 30,
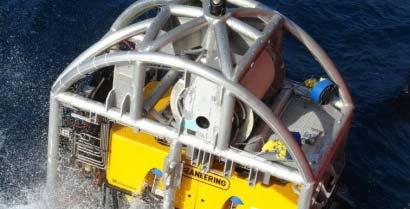
8 Remotely Operated Vehicles 23% Revenue Contribution First Nine Months, 2016 Flagship of the Oceaneering Franchise 8
9 Oceaneering ROV Fleet Size 279 ROVs as of September 30, Veh hicle Count at Period End Q Q Q3* * Retired 39 ROVs in the third quarter of
10 Floating Rig Demand History Oceaneering 56% Market Share as of September 30, 2016 Floaters Contracted % with OII ROVs % Contracted Floating Rig gs at Period End Q Q Q Q Q Q Q Q Q Q Q3 75% 50% 25% 0% I ROVs % with OI Source: IHS-Petrodata, September 30,
11 Oceaneering ROV Utilization Mix 100% Drill Support ROV Utilization Vessel Based ROV Utilization Average ROV Func ction Utilizat tion 75% 50% 25% 0% * At September 30 11

12 Oceaneering ROV Pricing and Fleet Utilization 52% Fleet Utilization as of September 30, 2016 Revenue / Day on Hire Fleet Utilization $11, % $10,000 90% $9,000 80% Re evenue / Da ay on Hire $8,000 $7,000 $6,000 $5,000 $4,000 $3,000 $2,000 70% 60% 50% 40% 30% 20% ilization Fleet Ut $1,000 10% $ * 0% * YTD September


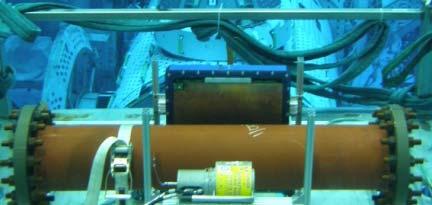
13 Subsea Products 31% Manufactured Products Production Control Umbilicals Supply electric and hydraulic power to subsea trees and inject chemicals into reservoirs and well streams. Revenue Contribution First Nine Months, 2016 Specialty Subsea Hardware Field development hardware used to connect production trees to umbilicals and flow lines. Also includes connectors and valves. Service and Rental Tooling & Subsea Work Systems Support drilling, construction, field maintenance, and plugging and abandonment activities. Installation and Workover Control Systems (IWOCS) Support drilling, construction, field maintenance, and plugging and abandonment activities. 13
14 Subsea Hardware Capex Forecast Backlog at September 30, 2016, in $ millions Subsea Capex, Quest August 2016 SS Products Backlog $1,000 $9,000 O II SS Produ ucts Backlog $800 $600 $400 $200 $7,200 $5,400 $3,600 $1,800 Su bsea Hardw ware Capex $ * 2017F 2018F 2019F 2020F $0 * At September 30, 2016 Source: Quest Offshore, August 2016; Capex: hardware costs for subsea trees/control systems, manifolds, and production umbilicals 14


15 Subsea Installations Forecast 500 Tree Installations SSProducts Revenue $1,500 Tree Insta allations $1,200 $900 $600 $300 enue, in $ Millions OII SSPro oducts Rev F 2017F 2018F 2019F 2020F $0 Source: Quest Offshore, August


16 Subsea Projects 21% Revenue Contribution First Nine Months, 2016 Change out photo and replace with AUV Consist of Project Management, Survey, Subsea Installation and IMR Services 16
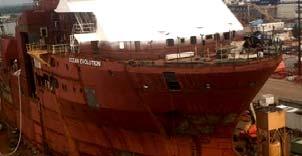
17 Subsea Projects Overview Assets Available for this Market Deepwater Multi-Purpose Supply Vessels Spot or Contract Location Charter End 3 Owned Ocean Intervention Ocean Intervention II Ocean Evolution (available late 2Q 2017) Spot Spot N/A GOM GOM N/A N/A N/A 4 Chartered with Term Normand Flower Ocean Alliance Ocean Intervention III Island Pride Diving Support Vessels Survey/AUV Services Global Data Solutions Spot Contract, Shell Contract, BP Contract GOM GOM W. Africa India Dec 16 Mar 18 Apr 17 Nov 17 17
18 Strong Balance Sheet and Liquidity Capital Sources and Allocations Liquidity (at end of third quarter 2016) o $442 million of cash, $300 million in the U.S. o $500 million undrawn revolving credit facility, expiring October 2021 o First debt maturities $30 million in October 2018 Organic capital expenditures o Expect to range from $110 million to $125 million in 2016 Acquisitions o Continue to consider investments that augment our service or product offerings Dividends o Lowered to a more sustainable level Consider share repurchases 18
19 Leveraged to Deepwater Projects take years to develop Largely oil reservoirs o With high production flow rates Well capitalized customer base o ~50% revenue from E&P majors in prior 3 years Investment based on long-term commodity price expectations 19
20 Long Term: Offshore is Essential Deepwater Remains Significant Incremental Bbls Existing Fields Bbls Source of Additional ~29.3Mm B/D Liquids Production Tota al Liquids MMB/D % 29% Offshore Onshore 40 Source: Morgan Stanley Research, Wood Mackenzie, Rystad Energy, and Company Data October
21 Expect Extended Declines from Producing Fields New Production from New Fields Decline from Aging Fields lion Barrels Per Day Mil Inverting Balance presented by Bloomberg; Source data from Rystad 21
22 2016 Fourth Quarter and FY 2017 Outlook Challenging market continues Aligning our operations with anticipated level of activity Forecasting 4Q declines from each of our oilfield segments o ROV: fewer working days and lower average revenue per day o Subsea Products: lower throughput and low single digit margins o Subsea Projects: seasonal decrease in GOM diving activities and drydocking of Ocean Patriot o Asset Integrity: seasonal decrease in global demand and competitive pricing 2017 marginally profitable at the operating income level 22
23 Conclusion Longer term, deepwater is still critical to reserve replenishment Global provider in all phases of offshore oilfield life cycle, with a deepwater focus Further differentiate with integrated solutions Strong liquidity and cash flow Maintain or grow our market positions Emerge from the current cycle ready for the upturn 23
24
25 EBITDA Reconciliation to Net Income (USD in millions) Earnings before interest, taxes, depreciation and amortization (EBITDA) is a non-gaap financial measurement. Oceaneering s management uses EBITDA because we believe that this measurement is a widely accepted financial indicator used by investors and analysts to analyze and compare companies on the basis of operating performance, and that t this measurement may be used by some investors and others to make informed investment decisions. You should not consider EBITDA in isolation from or as a substitute for net income or cash flow measures prepared in accordance with generally accepted accounting principles or as a measure of profitability or liquidity. EBITDA calculations by one company may not be comparable to EBITDA calculations made by another company. The following table provides a reconciliation between net income (a GAAP financial measure) and EBITDA (a non-gaap financial measure) for Oceaneering s historical and projected results on a consolidated basis for the periods indicated: Period Ended T9M 2015 T9M 2016 Net Income $ $ $ $ $ $ $ 35.6 Depreciation & Amortization Subtotal Interest Expense/Income, Net Income Tax Expense EBITDA $ $ $ $ $ $ $
26 Free Cash Flow (Through the Cycle) (USD in millions, except for Earnings per Share amounts) Free Cash Flow (FCF) is a non-gaap financial measurement. FCF represents cash flow provided by operating activities less organic capital expenditures (i.e., purchases of property and equipment other than those in business acquisitions. Management believes that this is an important measure because it represents funds available to reduce debt and pursue opportunities that enhance shareholder value, such as making acquisitions and returning cash to shareholders through dividends or share repurchases T9M 2015 T9M 2016 Earnings Per Share $ 2.16 $ 2.66 $ 3.42 $ 4.00 $ 2.34 $ 2.06 $ 0.36 Net Income $ $ $ $ $ $ $ 35.6 Depreciation & Amortization Other Changes in Cash Provided by Operating Activities (98.3) (27.7) (42.3) ( 13.9) 33.2 Cash Provided by Operating Activities Purchases of Property & Equipment (235.0) (300.6) ( 382.5) (386.9) (200.0) (139.2) ( 83.4) Free Cash Flow $ 53.5 $ $ $ $ $ $
27 Oceaneering ROV Leading Market Position Remotely Operated Vehicles Ownership Drill Support Market Share Worldwide Fleet 1027 Vehicles* % 91 56% OII Subsea 7 Fugro DOF Subsea C-Innovations Helix Saipem TMT Technip IKM Group Other 162 Floating Rigs Contracted** Source: *OII Estimates - December 2015; **IHS Petrodata and OII Estimates September 30,
28 Oceaneering ROV Fleet 279 ROVs Geographic Profile September 30, 2016 RO OVs GOM Africa Norway Brazil Asia/Pac Other Other includes Canada, Mexico, United Kingdom, and the Middle East. 28
29 Oceaneering ROVs on Vessels 94 ROVs Geographic Profile September 30, Vs RO GOM Africa Norway Other Approximately 60% of Oceaneering s vessel-base customers are contractors, and 40% are operators Other includes Canada, Mexico, United Kingdom, Middle East, Asia, and Brazil. 29


30 Investor Relations Contact Suzanne Spera Director, Investor Relations
Investor Presentation
 Connecting What s Needed with What s Next Investor Presentation September 2017 Forward-Looking Statements Statements we make in this presentation that express a belief, expectation, or intention are forward
Rod Larson President & CEO
 Connecting What s Needed with What s Next Rod Larson President & CEO J.P. Morgan Energy Equity Conference June 27, 2017 New York, NY Forward-Looking Statements Statements we make in this presentation that
Alan R. Curtis Chief Financial Officer
 Connecting What s Needed with What s Next Alan R. Curtis Chief Financial Officer Jefferies Energy Conference November 28, 2017 Houston, TX Forward-Looking Statements Statements we make in this presentation
Marvin J. Migura. Oceaneering International, Inc. Executive Vice President. Safe Harbor Statement
 July 1, 2015 - Houston, TX Marvin J. Migura Executive Vice President Oceaneering International, Inc. Safe Harbor Statement Statements we make in this presentation that express a belief, expectation, or
Capital One Securities, Inc.
 Capital One Securities, Inc. 10 th Annual Energy Conference December 9, 2015 New Orleans, LA Alan R. Curtis SVP and Chief Financial Officer Oceaneering International, Inc. Safe Harbor Statement Statements
M. Kevin McEvoy. Oceaneering International, Inc. President & CEO. December 2, 2014 New York, NY. Safe Harbor Statement
 December 2, 2014 New York, NY M. Kevin McEvoy President & CEO Oceaneering International, Inc. Safe Harbor Statement Statements we make in this presentation that express a belief, expectation, or intention
M. Kevin McEvoy. Oceaneering International, Inc. Chief Executive Officer 2015 GLOBAL ENERGY AND POWER EXECUTIVE CONFERENCE JUNE 2, 2015 NEW YORK, NY
 2015 GLOBAL ENERGY AND POWER EXECUTIVE CONFERENCE JUNE 2, 2015 NEW YORK, NY M. Kevin McEvoy Chief Executive Officer Oceaneering International, Inc. Safe Harbor Statement Statements we make in this presentation
Marvin J. Migura. Oceaneering International, Inc. Executive Vice President. September 30, 2014 New Orleans, LA. Safe Harbor Statement
 September 30, 2014 New Orleans, LA Marvin J. Migura Executive Vice President Oceaneering International, Inc. Safe Harbor Statement Statements we make in this presentation that express a belief, expectation,
Marvin J. Migura. Oceaneering International, Inc. Global Hunter Securities 100 Energy Conference June 24, 2014 Chicago, IL. Safe Harbor Statement
 Global Hunter Securities 100 Energy Conference June 24, 2014 Chicago, IL Marvin J. Migura Executive Vice President Oceaneering International, Inc. Safe Harbor Statement Statements we make in this presentation
Marvin J. Migura Sr. Vice President & CFO Oceaneering International, Inc.
 2009 Energy, Utilities & Power Conference May 27, 2009 Marvin J. Migura Sr. Vice President & CFO Oceaneering International, Inc. Safe Harbor Statement Statements we make in this presentation that express
T. Jay Collins. President & CEO Oceaneering International, Inc Energy Conference December 7, 2010 New Orleans, LA. Safe Harbor Statement
 2010 Energy Conference December 7, 2010 New Orleans, LA T. Jay Collins President & CEO Oceaneering International, Inc. Safe Harbor Statement Statements we make in this presentation that express a belief,
FMC Technologies Overview Fourth Quarter Director, Investor Relations Matt Seinsheimer
 FMC Overview Fourth Quarter 2016 Director, Investor Relations Matt Seinsheimer +1 281.260.3665 matthew.seinsheimer@fmcti.com This presentation contains forward-looking statements intended to qualify for
Morgan Stanley Houston Energy Summit
 Morgan Stanley Houston Energy Summit February 25, 2014 Forward-Looking Statements This presentation contains forward-looking statements that involve risks, uncertainties and assumptions that could cause
Analyst Day Real change starts here. Doug Pferdehirt, Chief Executive Officer
 2017 Real change starts here Doug Pferdehirt, Chief Executive Officer Disclaimer Forward-looking statements We would like to caution you with respect to any forward-looking statements made in this commentary
Results Briefing Fourth Financial Quarter, 2012* Analyst & Investor Update 20 th December 2012
 Results Briefing Fourth Financial Quarter, 2012* Analyst & Investor Update 20 th December 2012 *Financial Quarter ending 30 September 2012 Disclaimer This Analyst Presentation has been prepared by Mermaid
Sanford Bernstein Strategic Decisions Conference. May 2014
 Sanford Bernstein Strategic Decisions Conference May 2014 1 Forward-Looking Statements Statements made today that are not historical facts are forward-looking statements within the meaning of Section 27A
Goldman Sachs Global Energy Conference. January 2014
 Goldman Sachs Global Energy Conference January 2014 1 Forward-Looking Statements Statements made today that are not historical facts are forward-looking statements within the meaning of Section 27A of
Noble Corporation. Don Jacobsen Senior Vice President Industry & Government Relations Marine/Offshore Industry Conference 29 March 2012
 Noble Corporation Don Jacobsen Senior Vice President Industry & Government Relations 20 Marine/Offshore Industry Conference 29 March 202 Forward Looking Statement These presentations contain forward-looking
SOLSTAD OFFSHORE ASA
 SOLSTAD OFFSHORE ASA SOLSTAD OFFSHORE ASA 1Q 2012 1. Solstad Offshore in brief 2. Highlights YTD 3. Financials 4. Vessels and markets 5. Outlook SOLSTAD OFFSHORE IN BRIEF Founded in 1964. Head-office in
BOURBON Investor Presentation May 2014 BUILDING TOGETHER A SEA OF TRUST
 BOURBON Investor Presentation BUILDING TOGETHER A SEA OF TRUST DISCLAIMER This document may contain information other than historical information, which constitutes estimated, provisional data concerning
1Q 2016 Results. Mermaid Maritime Plc. May 23, 2016
 Mermaid Maritime Plc 1Q 2016 Results May 23, 2016 Disclaimer: The information contained in this document is intended only for use during the presentation and should not be disseminated or distributed to
Pareto s Annual Oil & Offshore Conference
 Pareto s Annual Oil & Offshore Conference Daniel W. Rabun Chairman, President & CEO 31 August 2011 1 Forward-Looking Statements Statements contained in this presentation that are not historical facts are
Sanford Bernstein Strategic Decisions Conference. May 2013
 Sanford Bernstein Strategic Decisions Conference May 2013 1 Forward-Looking Statements Statements made today that are not historical facts are forward-looking statements within the meaning of Section 27A
2Q 2016 Results. Mermaid Maritime Plc. August 2016
 Mermaid Maritime Plc 2Q 2016 Results August 2016 Disclaimer: The information contained in this document is intended only for use during the presentation and should not be disseminated or distributed to
Presenter: John T. Gremp President and Chief Operating Officer. February 2011
 Presenter: John T. Gremp President and Chief Operating Officer February 2011 Director, Investor Relations Robert K. Cherry +1 281 591 4560 rob.cherry@fmcti.com These slides and the accompanying presentation
Simmons & Company International European Energy Conference 2013
 Simmons & Company International European Energy Conference 2013 September 27, 2013 Forward-Looking Statements This presentation contains forward-looking statements within the meaning of Section 27A of
Q Presentation. DOF Subsea Group
 Q4 2015 Presentation DOF Subsea Group DOF Subsea Group DOF Subsea Group In brief Fleet One of the largest subsea vessel owners in the world Owns and operates a fleet of 21 vessels, plus 4 newbuilds on
Transition PPT Template. J.P. Morgan. June 2015 V 3.0. Energy Equity Conference June 27, 2017
 Transition PPT Template J.P. Morgan June 2015 V 3.0 Energy Equity Conference 2017 June 27, 2017 Forward-Looking Statements This presentation contains forward-looking statements, including, in particular,
Pareto Securities 20 th Annual Oil & Offshore Conference. Dan Rabun, Chairman & CEO. 4 September 2013
 Pareto Securities 20 th Annual Oil & Offshore Conference Dan Rabun, Chairman & CEO 4 September 2013 1 Forward-Looking Statements Statements made today that are not historical facts are forward-looking
2Q 2017 Results. 11 Aug 2017 MERMAID MARITIME PUBLIC COMPANY LIMITED
 MERMAID MARITIME PUBLIC COMPANY LIMITED 2Q 2017 Results 11 Aug 2017 1 Disclaimer: The information contained in this document is intended only for use during the presentation and should not be disseminated
Microequities 10th Microcap Conference
 Microequities 10th Microcap Conference MATRIX COMPOSITES & ENGINEERING Aaron Begley Chief Executive Officer 5 July 2016 Agenda Company overview Business operations Strategy & outlook 2 What we do Matrix
Mid-Atlantic Investor Meetings. February 2013
 Mid-Atlantic Investor Meetings February 2013 1 Forward-Looking Statements Statements made today that are not historical facts are forward-looking statements within the meaning of Section 27A of the Securities
Investor Relations Presentation April 30, 2013
 Investor Relations Presentation April 30, 2013 FORWARD LOOKING STATEMENTS In addition to the historical data contained herein, this document may include forward-looking statements regarding the future
3Q 2016 Results. Mermaid Maritime Plc. 14 November 2016
 Mermaid Maritime Plc 3Q 2016 Results 14 November 2016 Disclaimer: The information contained in this document is intended only for use during the presentation and should not be disseminated or distributed
Quarterly presentation Q DOF Subsea Group
 Quarterly presentation Q1 2016 DOF Subsea Group DOF Subsea Group DOF Subsea Group in brief Fleet One of the largest subsea vessel owners in the world Owns and operates a fleet of 21 vessels, plus 4 newbuilds
Wells Fargo Securities 2 nd Annual West Coast Energy Conference. June 2017
 Wells Fargo Securities 2 nd Annual West Coast Energy Conference June 2017 1 Forward-Looking Statements Statements contained in this investor presentation that are not historical facts are forward-looking
Textron Reports First Quarter 2016 Income from Continuing Operations of $0.55 per Share, up 19.6%; Reaffirms 2016 Financial Outlook
 Textron Reports First Quarter 2016 Income Continuing Operations of $0.55 per Share, up 19.6%; Reaffirms 2016 Financial Outlook April 20, 2016 06:30 AM Eastern Daylight Time PROVIDENCE, R.I.--(BUSINESS
B O U R B O N - R o a d s h o w A p r i l
 BOURBON - Roadshow A p r i l 2 0 1 4 BUILDING TOGETHER A SEA OF TRUST DISCLAIMER This document may contain information other than historical information, which constitutes estimated, provisional data concerning
DNB's 9th Annual Oil, Offshore & Shipping Conference Kristian Siem Chairman Subsea 7
 DNB's 9th Annual Oil, Offshore & Shipping Conference Kristian Siem Chairman Subsea 7 1 Forward-looking statements Certain statements made in this announcement may include forward-looking statements. These
Q3 Financial Presentation 2017 DOF ASA
 Q3 Financial Presentation 2017 DOF ASA Highlights Group 2 Highlights Operational EBITDA Q3 MNOK 607 (excl hedge accounting) Average utilization fleet 73% in Q3 Low utilization in Subsea IRM Projects in
Howard Weil Energy Conference
 Howard Weil Energy Conference Dan Rabun Chairman, President and CEO 27 March 2012 1 Forward-Looking Statements Statements contained in this press release that are not historical facts are forward-looking
The New Energy at Global Industries
 34 th Annual Marine/Offshore Industry Outlook Conference Offshore Construction Jim Osborn Chief Marketing Officer Global Industries 24 March 2011 1 The New Energy at Global Industries 2500 people 11 offices
Pareto Oil & Offshore Conference 6 September 2006 CEO Terje Sørensen
 Pareto Oil & Offshore Conference 6 September 2006 CEO Terje Sørensen Strategy To grow the company within offshore support vessels Seek to combine with other operators in the same field, in order to achieve
Preferred partner. Aker Solutions. Nordic Energy Summit 2013, 21 March Leif Borge CFO
 Aker Solutions Nordic Energy Summit 213, 21 March Leif Borge CFO 212 Aker Solutions Slide 1 This is Aker Solutions Employees: 19 5 Contract staff: 5 5 Revenues: 45 bn EBITDA: 4.7 bn Market Cap: 32. bn
Acquisition of GEODynamics. December 13, 2017
 Acquisition of GEODynamics December 13, 2017 Forward-looking Statements We include the following cautionary statement to take advantage of the "safe harbor" provisions of the Private Securities Litigation
GC RIEBER SHIPPING ASA. /FOURTH QUARTER 2012 PRESENTATION Fourth quarter 2012 Bergen, 22 February Bergen, 25 February 2013
 /FOURTH QUARTER 2012 PRESENTATION Fourth quarter 2012 Bergen, 22 February 2013 Bergen, 25 February 2013 Agenda Highlights Q4 2012 Operational review Financial review Summary Outlook / 2 Highlights Fourth
Investor Presentation. February 2018
 Investor Presentation February 208 Forward-Looking Statements Statements contained in this investor presentation that are not historical facts are forward-looking statements within the meaning of Section
September 12,
 September 12, 2013 www.deepwater.com The statements described in this presentation that are not historical facts are forward looking statements within the meaning of Section 27A of the Securities Act of
ATP Oil & Gas Corporation. Advanced Asset Acquisition and Divestiture in Oil & Gas. April 26-27, Gerald W. Schlief, Senior Vice President
 ATP Oil & Gas Corporation Advanced Asset Acquisition and Divestiture in Oil & Gas April 26-27, 2006 Gerald W. Schlief, Senior Vice President Forward Looking Statement Certain statements included in this
Investor Presentation. July 2016
 Investor Presentation July 2016 1 Forward-Looking Statements Statements contained in this press release that are not historical facts are forward-looking statements within the meaning of Section 27A of
Hunting Manufactures and distributes products that enable the extraction of oil and gas
 Hunting Manufactures and distributes products that enable the extraction of oil and gas Hunting PLC Global Footprint 2 2009 Corporate Highlights Completed three acquisitions 47.3m Sale of Hunting Energy
2009 Half Year Results Summary
 Rig Activity - 2 - 2009 Half Year Results Summary 2009 m 2008 m Change % Revenue 219.8 201.2 +9% EBITDA 30.7 32.1-4% Profit from operations 23.0 24.0-4% Finance income (expense) 3.3 (2.9) Profit before
FMC Technologies Overview Third Quarter Supervisor, Investor Relations James Davis
 FMC Technologies Overview Third Quarter 2015 Supervisor, Investor Relations James Davis +1 281.260.3665 james.davis@fmcti.com This presentation contains forward-looking statements intended to qualify for
Acquisition of HR Textron
 TM Acquisition of HR Textron Investor Conference Call March 3, 2009 CONTROLLING the power of ENERGY Cautionary Statement Information in this presentation contains forward-looking statements within the
Confirms 2013 Financial Guidance
 Confirms 2013 Financial Guidance PROVIDENCE, R.I.--(BUSINESS WIRE)--Jul. 17, 2013-- Textron Inc. (NYSE: TXT) today reported second quarter 2013 income from continuing operations of $0.40 per share, compared
Investor Presentation. April 2018
 Investor Presentation April 208 Forward-Looking Statements Statements contained in this investor presentation that are not historical facts are forward-looking statements within the meaning of Section
Fourth Quarter 2013 Results. February 6, 2014
 Fourth Quarter 2013 Results February 6, 2014 Safe Harbor Disclosure Please review our SEC filings on Form 10-K and Form 10-Q The statements contained in this presentation that are not historical facts
Q4 Financial Presentation 2017 DOF ASA
 Q4 Financial Presentation 2017 DOF ASA Highlights Group 2 Highlights EBITDA Q4 MNOK 649 (excl hedge accounting) Refinancing completed in DOF and DOF Subsea: Private Placement and repair issue NOK 700 million
First Quarter 2014 Results
 First Quarter 04 Results May 6, 04 Safe Harbor Disclosure Please review our SEC filings on Form 0-K and Form 0-Q The statements contained in this presentation that are not historical facts are forward-looking
National Oilwell Varco
 National Oilwell Varco Cowen & Co 5 th Annual Ultimate Energy Conference Jose Bayardo Senior Vice President and Chief Financial Officer December 2, 2015 Statements made in the course of this presentation
Jefferies 2014 Global Energy Conference. Maryann Seaman Executive Vice President and Chief Financial Officer
 Jefferies 14 Global Energy Conference Maryann Seaman Executive Vice President and Chief Financial Officer This presentation contains forward-looking statements intended to qualify for the safe harbors
KKR & Co. Inc. Goldman Sachs U.S. Financial Services Conference December 4, 2018
 KKR & Co. Inc. Goldman Sachs U.S. Financial Services Conference December 4, 2018 KKR Today Private Markets Public Markets Capital Markets Principal Activities $104bn AUM $91bn AUM Global Franchise $19bn
Credit Suisse Energy Summit Transocean Ltd.
 Credit Suisse Energy Summit Transocean Ltd. February 7, 2012 1 Legal Disclaimer The statements described in this presentation that are not historical facts are forward-looking statements within the meaning
4 th Quarter Earnings Conference Call
 4 th Quarter Earnings Conference Call KKR & Co. Inc. Investor Update February 1, 2019 Key Metrics Assets Under Management Management Fees ($ in billions) ($ in millions) $195 $1,069 $168 $905 $100 $107
Patrick Schorn Executive Vice President, New Ventures. Cowen & Company 7 th Annual Energy & Natural Resources Conference
 Patrick Schorn Executive Vice President, New Ventures Cowen & Company 7 th Annual Energy & Natural Resources Conference New York, December 4, 2017 This presentation contains forward-looking statements
Textron Reports Third Quarter 2014 Income from Continuing Operations of $0.57 per Share, up 62.9%; Revenues up 18.1%
 Textron Reports Third Quarter Income from Continuing Operations of $0.57 per Share, up 62.9%; Revenues up 18.1% 10/17/ PROVIDENCE, R.I.--(BUSINESS WIRE)-- Textron Inc. (NYSE: TXT) today reported third
Pareto Oil & Offshore Conference
 Pareto Oil & Offshore Conference Hallvard Hasselknippe, President, Subsea September 12, 2018 Disclaimer Forward-looking statements We would like to caution you with respect to any forward-looking statements
Matrix Composites & Engineering Ltd
 Matrix Composites & Engineering Ltd Euroz 2015 Industrials Tour 10 June 2015 Overview Introduction to Matrix Business Operations and Outlook Plant Tour 2 Introduction to Matrix WHO WE ARE AND WHAT WE DO
Textron Reports Second Quarter 2014 Income from Continuing Operations of $0.51 per Share, up 27.5%; Revenues up 23.5%
 Textron Reports Second Quarter 2014 Income from Continuing Operations of $0.51 per Share, up 27.5%; Revenues up 23.5% 07/16/2014 PROVIDENCE, R.I.--(BUSINESS WIRE)-- Textron Inc. (NYSE: TXT) today reported
Investor Presentation. October 2018
 Investor Presentation October 208 Forward-Looking Statements Statements contained in this investor presentation that are not historical facts are forward-looking statements within the meaning of Section
Textron Reports Third Quarter 2018 Results; Narrows Full-Year EPS and Cash Guidance
 Corporate Communications Department NEWS Release Textron Reports Third Quarter 2018 Results; Narrows Full-Year EPS and Cash Guidance $468 million returned to shareholders through share repurchases Completed
Hunting PLC Annual Results 2010
 Hunting PLC Annual Results 2010 2010 Highlights Completed acquisition of Innova-Extel - 80.3m New facilities in US (Casper, Conroe and Latrobe) and China (Wuxi) add over 800,000 sq ft of manufacturing
GE Oil & Gas. William Blair Growth Stock Conference June 14, Imagination at work
 GE Oil & Gas William Blair Growth Stock Conference June 14, 2016 Caution Concerning Forward-Looking Statements: This document contains "forward-looking statements" that is, statements related to future
4 th Quarter Earnings Conference Call
 4 th Quarter Earnings Conference Call KKR & Co. L.P. Investor Update February 11, 2016 Gross Returns $1B+ Carry Paying Funds Q4 and 2015 Performance Market Indices Private Equity Real Assets Alternative
Thinking outside the North Sea. When is global domination not global domination? February 2011
 Thinking outside the North Sea When is global domination not global domination? February 2011 ODS-Petrodata is recognised as the leading provider of market intelligence to the global oil and gas industry
Quarterly Presentation Q DOF Subsea Group
 Quarterly Presentation Q4 2016 DOF Subsea Group DOF Subsea Group DOF Subsea Group in Brief DOF ASA (51%) First Reserve Corporation (49%) DOF Subsea Holding (100%) DOF Subsea 2005 Established 20 526 NOK
Investor Presentation. November 2018
 Investor Presentation November 2018 KKR Today Private Markets Public Markets Capital Markets Principal Activities $104bn AUM $91bn AUM Global Franchise $19bn of Assets $81bn Private Equity, Growth Equity
Q Presentation. DOF Subsea Group
 Q3 2013 Presentation DOF Subsea Group Agenda In brief Recent events Group overview Contract status Financials Outlook Appendix DOF Subsea DOF Subsea Group In brief Fleet One of the largest subsea vessel
Swiber Holdings Limited 1Q FY08 Results Briefing
 Swiber Holdings Limited 1Q FY08 Results Briefing 15 May 2008 Page 1 Financial Highlights 1Q 2008 Page 2 Key highlights a record quarter Revenue (US$ m) Net Profit (US$ m) 160 1Q Y-O-Y: 266.9% 1Q Y-O-Y:
Scotia Howard Weil Energy Conference. 27 March 2018
 Scotia Howard Weil Energy Conference 27 March 2018 1 Forward-Looking Statements Statements contained in this investor presentation that are not historical facts are forward-looking statements within the
Second Quarter 2014 Results
 Second Quarter 2014 Results August 5, 2014 Safe Harbor Disclosure Please review our SEC filings on Form 10-K and Form 10-Q The statements contained in this presentation that are not historical facts are
4 th Quarter Earnings Conference Call
 4 th Quarter Earnings Conference Call KKR & Co. L.P. Investor Update February 8, 2018 4Q17 Reflections Fundamentals Are Strong (Dollars in millions, except per unit amounts and unless otherwise stated)
Astrup Fearnley Shipping & Offshore Conference. 10 January 2019
 Astrup Fearnley Shipping & Offshore Conference 0 January 209 Forward-Looking Statements Statements contained in this investor presentation that are not historical facts are forward-looking statements within
Q1 Financial Presentation 2018 DOF ASA
 Q1 Financial Presentation 2018 DOF ASA Highlights Group 2 Highlights EBITDA Q1 MNOK 520 (excl hedge accounting) Average utilisation Group fleet 72% in Q1 Improved markets and signs of higher activity in
Second Quarter 2013 Results August 1, 2013
 Second Quarter 203 Results August, 203 2 Safe Harbor Disclosure Please review our SEC filings on Form 0-K and Form 0-Q The statements contained in this presentation that are not historical facts are forward-looking
Second Quarter CY 2012 Results. August 2, 2012
 Second Quarter CY 2012 Results August 2, 2012 1 Safe Harbor Disclosure Please review our SEC filings on Form 10-K and Form 10-Q The statements contained in this presentation that are not historical facts
Q Q Q Q Q % % 46.8% 61.0% 35.6% 57.5% 52.1% 60.5% 44.6% 63.3% 15,267 15,081 15,260 15,265 16,299
 Press release Paris, May 4, 2017 BOURBON 1 st quarter 2017 financial information Adjusted revenues amounted to 225.5 million ( 204.9 million in consolidated revenues) in the 1 st quarter of 2017, down
Q Presentation Preliminary Results FY 2011
 Presentation Preliminary Results FY Düsseldorf, February 6, 2012 GEA Group Disclaimer All figures for are preliminary and have therefore not yet been audited. The yearend financial statements for the GEA
DNB s oil and offshore conference. Idar Eikrem, CFO
 DNB s oil and offshore conference Idar Eikrem, CFO Well positioned for future market opportunities 1) Leading contractor within proven track record 2) Competitive position strengthened a) Delivering projects
Baker Hughes, a GE company Investor Book
 Baker Hughes, a GE company Investor Book March 2019 www.bhge.com NYSE: BHGE investor.relations@bhge.com +1 (281) 809-9088 Disclaimer Forward-looking statements This presentation (and oral statements made
2016 Quest Offshore Resources Inc.
 1 Forward-Looking Statements Statements in this presentation regarding Quest Offshore Resources or its management's intentions, beliefs or expectations, or that otherwise speak to future events, are "forward-looking
BRAZIL ENERGY AND POWER CONFERENCE. Americo Oliveira McDermott Brazil General Manager September 20, 2015
 BRAZIL ENERGY AND POWER CONFERENCE Americo Oliveira McDermott Brazil General Manager September 20, 2015 Forward-Looking Statement In accordance with the Safe Harbor provisions of the Private Securities
ACTIVISION BLIZZARD ANNOUNCES BETTER-THAN-EXPECTED SECOND QUARTER 2011 FINANCIAL RESULTS
 Contacts: Kristin Southey SVP, Investor Relations (310) 255-2635 ksouthey@activision.com Maryanne Lataif SVP, Corporate Communications (310) 255-2704 mlataif@activision.com FOR IMMEDIATE RELEASE ACTIVISION
Forward-Looking Statement
 1 Forward-Looking Statement The statements described in this presentation that are not historical facts are forward-looking statements within the meaning of Section 27A of the Securities Act of 1933 and
Excellence in Deepwater through Innovation Paul H. Hillegeist President & COO Quest Offshore Resources, Inc.
 Excellence in Deepwater through Innovation Paul H. Hillegeist President & COO Quest Offshore Resources, Inc. Paul.Hillegeist@questoffshore.com Image courtesy of: EMAS AMC 1 Table of Contents A Few Examples
First Quarter 2013 Results May 8, 2013
 First Quarter 2013 Results May 8, 2013 Safe Harbor Disclosure Please review our SEC filings on Form 10-K and Form 10-Q The statements contained in this presentation that are not historical facts are forward-looking
Head of Strategy & Relations - Michael Harboe-Jørgensen. 16 June 2014, Lindø Industrial Park, Denmark
 Company presentation Head of Strategy & Relations - Michael Harboe-Jørgensen Mærsk Gallant site visit 16 June 2014, Lindø Industrial Park, Denmark page 2 Legal notice This presentation contains certain
QUARTERLY UPDATE. Summary
 QUARTERLY UPDATE Q1 FY14 Summary Production levels consistent with designed plant capacity Current order backlog of US$86 million which will support full production until the beginning of Q4 FY14 Strong
Executive Summary and Table of Contents
 UK UPSTREAM OIL & GAS SECTOR REPORT 2012/13 Executive Summary and Table of Contents Focused, cutting edge information on the UK Upstream oil and gas industry. Providing detailed and robust analysis of
In the quarter, Textron returned $344 million to shareholders through share repurchases, compared to $186 million in the first quarter of 2017.
 Corporate Communications Department NEWS Release Textron Reports First Quarter 2018 Income from Continuing Operations of $0.72 per Share; Signs Agreement to Sell Tools & Test Business for $810 Million