Departure and Promotion of U.S. Patent Examiners: Do Patent Characteristics Matter?
|
|
|
- Ralf Byrd
- 5 years ago
- Views:
Transcription
1 Departure and Promotion of U.S. Patent Examiners: Do Patent Characteristics Matter? Abstract Using data from patent examiners at the U.S. Patent and Trademark Offi ce, we ask whether, and if so how, examiners career outcomes relate to aspects of the patent review process. Exploiting longitudinal information about all the patents granted by a group of examiners between 1976 and 2006 and their yearly mobility outcomes (departure and promotion) between 1992 and 2006, we find consistent evidence from static, dynamic and duration models of the importance of granting experience in specific technological fields, repeated interactions with the same inventor and self-citations in predicting an examiner s departure or promotion. Keywords:Patent Examiners, Promotion, Attrition JEL classification: J60, O34 1
2 1 Introduction Over the last few decades, the U.S. Patent and Trademark Offi ce (PTO) has witnessed an increase in the turnover rate of patent examiners. 1 This high attrition rate combined with critics of poor patent quality, has led the PTO to propose changes in the examiners work and the examination process. 2 Despite these changes, criticisms of the internal functioning of the patent offi ce have been surfacing and the PTO business model has been the subject of internal investigations. 3 Patent examiners have a key role to play in society: by granting patents to innovators, they allow firms temporary monopoly power. Poor examination quality lowers competition (imposes costs on society) and leads to high legal costs in case of litigation which may reduce innovation. Hence, it is important to have a better understanding of the functioning of the patent system, of the patent granting behavior of examiners, and of how their work incentives and their career progression at the PTO interact with patent prosecution. While failures of the patent system have been widely acknowledged in the patent literature (Lemley, 2001; Jaffe and Lerner, 2004; Lemley, et al., 2005; Farrell and Shapiro, 2008; Bessen and Meurer, 2008), there is still much to learn about the inner functioning of patent offi ces (Eckert and Langinier, 2014). Cockburn et al. (2003) provide the earliest empirical evidence that there exists heterogeneity among examiners in the examination process. 4 Since then, several empirical contributions have studied the behavior of patent examiners and it is now well-documented that there exists an examiner-specific effect in granting decisions. 5 1 In 2000, the attrition rate was at its highest at 14%, before slightly decreasing at 9% in 2004 (U.S. Government Accountability Offi ce (GAO) reports, 2005). 2 USPTO strategic plan In 2013, an internal report revealed telework fraud allegations which led the PTO to admit the lack of control that supervisors have over time and attendance fraud among examiners (Washington Post articles in August 2014 and August 2015). In addition, Frakes and Wasserman (2016) find empirical evidence of procrastination by examiners. 4 See also King (2003) and Popp et al. (2004) for surveys of the US patent offi ce and Frieber et al. (2006) for the patent offi ce in Europe 5 See Sampat (2005), Alcacer and Gittelman (2006), Alcacer, et al. (2009) and Mann (2013). Particular studies have confirmed the presence of examiner heterogeneity in granting rates (Lemley and Sampat, 2010; Tu, 2012), and in citations made (Alcacer et al., 2009; Lemley and Sampat, 2012). Moreover, Lemley and Sampat (2012) find that more experienced examiners are more likely to issue patents faster, and that junior examiners are more likely to reject applications. They show that the longer examiners stay at the PTO, the less they search for information and they provide less citations. Recently, Frakes and Wasserman (2017) find an inverted U-shape relationship between years of examiner experience and granting rate. Righi and Simcoe (2017) find that patent 2
3 In this paper, we contribute to the above literature by emphasizing the importance of a different channel by which examiner heterogeneity affects the patent review system: examiners mobility. We analyze whether, and if so how, the characteristics of the patents that examiners grant relate to their career progression or their departure from the institution. For instance, is an examiner in biotechnology more likely to leave (or be promoted at) the PTO than an examiner who grants patents in mechanics? Can promotion or leaving be linked to an examiner s average number of claims (scope of patent protection) or backward citations? To address these questions, we have collected information from a random sample of 623 examiners who worked at the PTO in 1995 and retrieved information about all the utility patents they have granted. 6 We follow these examiners over time considering different measures of their productivity in terms of granting experience and accumulated years of tenure at the PTO. We present an empirical analysis of examiner mobility (leaving the PTO or receiving a promotion), and the extent to which these career events are linked to examiner granting outcomes such as the number and characteristics of granted patents and granting related behavior. In particular, we constructed two measures of examiner granting related behavior: examiner self-citations proportion of citations (made) of the patents she has granted in the past over the total citations made over her career and repeated interactions with the same inventor maximum number of repeated interactions with the same inventor over the total number of granted patents. The percentage of examiner self-citations has direct implications on her productivity within the PTO, 7 and repeated interactions with an inventor likely reflect inventor-specific knowledge. Through their implications on examiner productivity and knowledge specificity, these two measures are expected to impact mobility outcomes. Our empirical analysis uses fixed- and random-effect logistic estimations as well as parametric survival estimation models to document the importance of granting related variables in relation to examiner mobility outcomes controlling for examiners accumulated years of tenure and their granting experience as well as Art Unit effects. In particular, our econometric specifications allow us to find out whether two examiners with similar tenure and granting experience and examiners tend to specialize in particular technologies. 6 Among the three types of patents (utility, design and plant), utility patents represent the majority of patents. 7 Citations are made by both the inventor and the examiner. Until 2000, it was not possible to distinguish the two. Since the time period in our data covers mostly the years prior to 2001, we cannot use this information. Studies that have compared inventor and examiner citations find that a large share of citations is added by the examiner, and these citations are those used to decide whether to grant a patent (Alcacer et al., 2009; Lemley and Sampat, 2010; Cotropia et al., 2010). 3
4 working in the same Art Unit experience different mobility outcomes (one is predicted to leave and the other one to be promoted) based on the difference in the characteristics of the patents they have granted (e.g., more citations or more patents with the same inventor). We find that controlling for examiner granting experience and tenure at the PTO and for Art Unit effects, examiners who leave and those who receive a promotion are significantly different in terms of their pattern of self-citations, repeated interactions with inventors and in terms of some of the characteristics of the patents they grant. Our results provide the first evidence of significant interactions between outcomes of the patent review process and examiners departure and promotion outcomes. The presence of a systematic link between the characteristics of the patents granted by an examiner and her career outcome calls for a better alignment between the functioning of the patent review system and the incentive structure implemented by human resource policies at the PTO. While our analysis is partial because our examiner-granted patent dataset does not provide information on granting rates, the interactions we find using post-granting information are likely indicative of examiners pre-granting heterogeneity in granting rates generated by differences in career expectations and outcomes. Our results suggest that the evidence of differential granting rates within a technological field found in the literature (Lemley and Sampat, 2012) is likely partly driven by examiners mobility. An implication of our results is that examiner-specific heterogeneity in granting rates (controlling for granting year and technological field of the patent) does not only reflect examiner-specific traits (such as being lenient versus strict when granting patents) but also job or task-specific factors related to examiners career opportunities (e.g., self-citations or repeated interactions with inventors). We believe our results are important in further informing both academic and practitioners interested in the links between worker mobility and innovation. Overall, the results help shed light on examiners behavior in relation to the patent review system, which could provide insights to the PTO human resource policies about (i) the importance and implications of the nonrandom sorting of examiners across the different technological fields; (ii) citation behavior; (iii) the matching of examiners to inventors. These three points are all significantly linked to departure and promotion outcomes within the PTO. Our results also offer empirical evidence motivating the need to incorporate career related decisions in the design and modelling of an effi cient patent review system. Our paper also contributes to the mobility literature analyzing the labor market of scientists 4
5 and researchers in academia, workers with similar training as examiners and in jobs with related characteristics (Zucker et al., 2002; Coupé et al., 2006; Giuri et al., 2007). 8 Examiners are educated individuals in highly technical fields with valuable alternative options in the private sector. 9 The common finding in that literature is that promotion and mobility within academia or to a job in the industry strongly depend on measures of the worker quality and productivity. For economists, the sensitivity of promotion and mobility to past production diminishes with experience indicating the presence of learning about worker quality (Coupé et al., 2006). More particularly, among scientists, evidence of fast-tracking, with star scientists being more likely to move out of a research institution to a private sector firm, depends on the worker s field of expertise as well as on measures of market competition in the worker s industry and city (Zucker et al., 2002). Preliminary comparisons of the jobs of U.S. patent examiners and engineers and scientists suggest stronger turnover rates among the former than the later. 10 Our analysis and results provide additional evidence of the importance of worker productivity (past and current) in driving current mobility outcomes for U.S. patent examiners and the extent to which granting behavior directly relates to promotion and/or departure to go for private sector jobs. From the perspective of the literature on worker mobility, the results emphasize the importance of work-related behavior in predicting mobility outcomes after controlling for productivityrelated factors. While tenure and granting experience significantly relate to departure and promotion decisions, examiners self-citations as well as the intensity of their interactions with inventors, and the resulting networking opportunities created, are also strong and robust predictors of examiners mobility outcomes. The paper is organized as follows. In section 2 we present an overview of the PTO, the examination process and the career path of patent examiners. Section 3 describes the dataset and variables. In section 4, we present the empirical analysis and results. Section 5 concludes. 8 The basic qualification for the job of patent examiner (as defined on the PTO web site or on job advertisement web sites) is a bachelor s degree in engineering or in science. In the PTO strategic plan for , qualification requirements have changed to include the possibility to have a lower degree than a BA if it is combined with technical experience. 9 Going back in time, the most famous case of alternative and more attractive opportunities taken by a former patent examiner is Albert Einstein who worked at the Swiss Patent Offi ce for 7 years, produced and published his most famous work (outside of his 8 hour work day at the offi ce) before leaving for a job of Professor at the University of Zurich. 10 See Figures 1a-1c in Appendix A: "Examiners and Other Engineers/Scientists" of the present paper. 5
6 2 Patent Examination Process and Career Path of Examiners In 2016, the PTO received 607,753 patent applications and granted 304,568 utility patents. Applications received each year in combination with pending applications from previous years create an important backlog. In response to the growing backlog, the PTO has been launching a major hiring program over the last decades. Despite these hires, the rate of attrition has been relatively high. For instance, between 2002 and 2006, even though 3,672 patent examiners have been hired, the patent examination workforce has only increased by 1, The attrition rate seems particularly high among new examiners. 12 This early attrition has a significant impact on the patenting process as it takes three to five years to attain proficiency (NAPA, 2005). Patent examiners, who are technological specialists employed by the PTO, review patent applications for compliance with the Patent Act, and determine whether innovations satisfy the patent requirements. They are organized into one of the eight broad technological centers, each technological center is subdivided into Art Units. An Art Unit is a group of 10 to 20 examiners with technology expertise in closely related areas. 13 The patent examination process is relatively standard. Applications arrive at a central offi ce and must pass basic checks to qualify for a filing date. A complete application (fees have been paid, all documents comply with the PTO rules) contains the claims, a description of the innovation, prior art information (provided by the applicant) and is assigned a U.S. patent classification. Based on that classification, it is sent to a technology center, where it is directed to an Art Unit. Within each Art Unit a Supervisory Patent Examiner (SPE), who is a senior examiner with administrative responsibilities (possibly the director of the Art Unit) assigns the application to an examiner who is responsible for it until it is disposed of (rejected, allowed or discontinued), and who interacts with the applicant. At any given time, an examiner has to deal with current applications (at different stages in the patenting process) and new applications. The examiner reviews the claims, and searches for prior art information to determine whether the innovation is novel enough to be granted a patent. 14,15 In general, the prior art procedure 11 During the same period, 1,643 examiners left the PTO and the remaining 385 examiners were either transferred or promoted out of the position of patent examiner (GAO, 2007). 12 The median examiner has been at the PTO for just over 3 years (Lemley and Sampat, 2012). 13 In 2015, examiners are spread over 307 different Art Units. 14 It is probably in the prior art search procedure that there is the most heterogeneity among patent examiners (Cockburn et al., 2003). 15 Different Art Units have different approaches to search for prior art: some are more team-oriented whether others are more individual-oriented (Popp et al., 2004). 6
7 begins with a review of existing U.S. patents in relevant technology classes either through computerized tools or by hand examination. The examiner then reviews the material provided by the applicant and decides to grant a patent or not. She writes a first letter to the applicant in which she accepts or rejects the claims. In his response, the applicant must narrow the claims or explain changes made to the original application. The examiner then analyzes the answer and writes another letter. Most applications are allowed on the second or third letter. 16 To complete each patent examination, examiners are allocated fixed amount of time. However, they can average these time allotments over their caseload and, thus, can spend more time on some more diffi cult applications and less time on easier ones. The quality of patent examination, and, therefore, the quality of patent examiners, is very diffi cult to assess. One measure used by the PTO to evaluate patent examiners is to rely on production quotas. Examiners have a bi-weekly production quota, and they receive counts for the disposal of an application or the examination of a new application once approved by a SPE. 17 At the beginning of their career, examiners have to examine only a few cases, and their caseload increases as they become more experienced. Examiners are initially assistant examiners, and then they becomes primary examiners. Production goals depend on both the technological field and the experience as measured by the examiner s position in the general schedule (GS) pay scale. 18 For instance, in most technology centers the production goal is about 17 hours per disposal (adjusted for experience), while it is 31.6 hours in computers (or biotechnology) as applications require more examination time in this area. Also, for the same application, an examiner at the level GS 7 will spend 37.3 hours, whereas an examiner at the level GS 12 will spend 27.5 hours, and one at the level GS 14 will spend 20.4 hours (NAPA, 2005). When an examiner meets all the deadlines on time with a few errors, she advances to the next GS level based on the recommendation of the SPE. 19 The highest level on the GS chart 16 According to NAPA (2005), patent prosecution process is divided into four tasks: i) search (read application, prior art search, claims); ii) examination (compare prior art with the innovation, prepare and submit first action letter); iii) amendment review (if it exists, additional search, second action letter); iv) post examination (depending on whether the patent is issued or not). 17 An examiner receives two counts per application: 1.25 count for the first action and 0.75 for its final disposal. Until February 2010, it was one count for the first action and one for its final disposal. This count system, from 1976, had been severely criticized, as it seemed relatively out of date (NAPA, 2005). In response to these critics, in 2010, the PTO changed it. 18 New hires are in general at level GS 7 or inferior, whereas experienced examiners are GS 9 or above. 19 Assistant examiners need to get the authorization of primary examiners before sending the first action letter. Hence, their work is closely monitored. Furthermore, the PTO randomly reviews about two to three percent of 7
8 corresponds to the level of a SPE who manages an Art Unit and is the direct supervisor to approximately 15 examiners. This is the first and main promotion opportunity for examiners. Further promotions can take place afterwards to positions involved in the administration of the patent review system and other legal matters applying to the management of the institution. 3 Data and Variables The data comes from three sources: the USPTO website, the NBER Patent Database of patent characteristics (Hall et al., 2001) updated to include patent information up to 2006, and the PTO employee directories over the period used in Lemley and Sampat (2012). We constructed two dataset exploiting different measures of mobility outcomes. The first dataset considers the yearly variations in patent characteristics for our sample of examiners over the period and exploits a static measure of examiner mobility where mobility is defined as an outcome which took place some time between 1992 and 2006 and remains fixed for the entire time period. Examiners are categorized either as having experienced no job changes, a promotion or as having left some time between 1995 and The second dataset exploits the longitudinal information of yearly mobility outcomes and therefore restricts the sample to the period over which yearly mobility (no change, promotion or leave) can be observed. Details of the data collection process are provided in Appendix A. The dataset reflect variations at two levels: the examiner level with a sample of 652 examiners who were granting patents on a random day in 1995, and the patent level with a sample of patents that corresponds to all the patents each examiner granted during the period. 20 At the patent level, we consider the typical patent characteristics found in the NBER Patent Database: year of application, granted year, number of claims, pendency time, citation, 21 etc... We also exploit a timing dimension by sorting patents by year of patent granted. This gives us a three dimensional link defined as examiner-id/ patent-id/year-patent-granted. After dropping patent or examiner observations with missing information, we obtain a random sample of 623 examiners granted patents. In 2004, the error rate was 5.3% (NAPA, 2005), and about 300 applications have been reopened. This is another way to monitor examiners errors. 20 The lack of patent information prior to 1976 for examiners who already had several years of experience implies that the dataset is left-censored. 21 We cannot consider the 2001 change in the reporting of citations (by examiners or inventors) as we use the citations measures provided in the NBER patent database which do not make the distinction after
9 who have granted about 1,300,000 patents. 22 Our sample of patents is by definition a subsample of the population of patents provided in the NBER Patent Database. During the year 1995, our sample of 623 examiners granted 74,665 patents, which corresponds to 73% of the granted patents during the year according to the NBER Patent Database (101,413 patents granted in 1995). We view this large percentage as indicative of the large representativity of our sample of examiners in the total population of examiners in Patent and Examiner Characteristics Summary statistics of the main patent characteristics for our subsample of patents and comparison with the NBER Patent Database are presented in Appendix A Table A1. The patent characteristics used are: pendency time (defined as the difference between the year of the patent application and the year the patent was granted), number of claims, whether the country s inventor is U.S., backward citations, indices of originality and generality (Trajtenberg et al., 1997) and the 6 technological categories (Chemical, Computers and Communications, Drugs and Medical, Electrical and Electronics, Mechanical, and Others). Over the period of 1976 to 2006, average patent characteristics from the NBER Patent Database and from our examiner-patent dataset show notable differences. Our sample of patents exhibits smaller average pendency time, smaller average number of claims and average percentage of U.S. patents, and a relatively greater proportion of patents in the mechanical field but smaller proportion in the field of computers and communication. These observed differences are in fact not surprising. While our sample of examiner-patent is random on the day of December 19th, 1995, the sample becomes less representative of the entire population of examiners and patents granted the years following This is because our sample follows examiners who stay at the PTO (either remaining examiners or changing job levels through an administrative promotion), therefore it loses examiners who leave and excludes newly hired examiners. As a result, for any other year than the collection year of 1995, our sample of examiner-patents is not random. We are interested in exploiting the non-randomness of that sample and, in particular, in 22 To check the validity of our data gathering process, we compared the number of patents retrieved from the USPTO website on December 19th, 1995, with the number of patents in the NBER Patent Database reported to be granted on that particular day. The NBER Patent Database reports 1717 patents while our sample gives 1663 patents, a loss of 74 patents, mainly due to duplicate in the NBER database, which we view as reasonably small. 9
10 analyzing whether and how the endogeneity created in who stays, who leaves and who gets promoted is correlated with examiner granting and patent characteristics. Our objective is to exploit the endogenous variations in the characteristics of our sample of examiners (tenure accumulated, number of patents granted by technological field, gender, etc.) and in the average characteristics of the patents they granted over the years to provide empirical evidence about who stays, who leaves and who gets promoted and demonstrate empirically how this information interacts with patent granting outcomes. Appendix A Table A2 presents more details about examiners; 204 of our 623 examiners granted patents as early as 1976, implying that a third of our sample are examiners who in our collection year of 1995, had been granting patents for at least 20 years. Also 595 out of 623, or 95% of our sample of examiners, were working at the PTO in 1992, the year we match our data with the PTO roster to obtain yearly information on turnover and promotions at the PTO. Regarding examiner attrition after 1995, the rate is relatively constant at about 4% per year with an exception in 2001 where 7.7% of the sample left that year and gradually going back to 4% after. By 2006, 381 examiners were still working at the PTO, which corresponds to 61% of our original 1995 sample of examiners. Conversely, 39% of the 1995 sample examiners have left the PTO by 2006 as a result of retirement or job separation. We constructed gender from the examiner name information extracted from the patents. In the majority of cases, the name was clearly indicative of a female or male. In the initial examiner sample of 1995, 15% of the examiners are female. This number is in line with evidence described in the existing literature discussing the small but fast growing presence of women in the patent industry (Ding et al., 2006; Whittington and Smith-Doerr, 2008; Adams, 2008). However, given measurement errors in the name based approach for identifying gender, the derived female dummy variable is affected by measurement errors implying an attenuation bias in the female dummy estimates from the regression estimations which will be performed. We constructed two tenure variables: tenure as assistant examiner and tenure as primary examiner. We obtained this information while collecting the examiner names on the patents that indicate the name of the primary examiner and the assistant examiner (if there was one). We therefore have for each examiner, all the patents he/she granted as primary and as assistant examiner. From this information, we were able to count the number of patents granted as assistant and primary examiner. We also calculated years of tenure as assistant and primary examiner by calculating the difference in the year of the last patent granted and the year of 10
11 application of the first patent granted, for patents granted as assistant and as primary examiner. 3.2 Additional Examiner-Patent Measures We exploited two sources of information to further analyze examiner granting behavior: examiner self-citations (the percentage of citations of an examiner s own granted patents), and the frequency of interactions between the assignee and the examiner. For self-citations, we used the NBER citing-cited dataset and matched it by citing patents to the patents of our sample of examiners. For each examiner, we counted the number of times citations refer to a patent previously granted by the same examiner. 23 Our measure of self-citations corresponds to the ratio of own examiner granted patent citations out of all the examiner citations and is calculated over the examiner s career. An examiner s large proportion of self-citations can reflect the greater depth of his/her expertise and knowledge specificity but, alternatively, may be the outcome of the examiner s lack of effort in searching for prior art outside of his/her own area. We also performed additional analysis to conclude that our measure of examiner self-citations more likely proxies for low effort than knowledge specificity. 24 For building our measure of assignee interactions, we used the assignee database and considered all patents granted by our sample of examiners between 1976 and 2006 and for which assignee information is available. We then selected patents assigned to non-government organizations (U.S. or not) and government ones (we excluded patents assigned to individuals). Next, we calculated the number of repeated interactions with the same assignee for each examiner over an examiner s career. While it is quite common for an examiner to grant patents to the same assignee, we measure the intensity of these repeated interactions using the maximum number of repeated interactions with the same assignee in a given year as well as over an examiner s career. Because examiners vary in their granting experience, we divided this number by the total number of patents granted in a given year as well as calculated over the examiner s career. These measures therefore describe 23 We do not distinguish citations provided by the inventor versus by the examiner on the application. Doing so would have substantially reduced the size of the sample since the extra information is only available starting in 2001 (this would make us drop 80% of our sample). Our measure remains a reasonable approximation of examiners self-citations given previous evidence that a large share of citations are added by examiners (Alcacer et al., 2009; Sampat, 2010) and that examiner-provided citations are the ones that are most likely used in deciding whether to grant a patent (Cotropia et al., 2010). 24 See Appendix A: Interpreting Examiner Self-citations. 11
12 the ratio of an examiner s maximum number of repeated interactions, which came out of all the examiner s granted patents. A graphical illustration of how we calculated our two measures is presented in Appendix A Figures 2a and 2b. Because the maximum number of repeated interactions with a given assignee will depend on the extent of that assignee s innovative activity (assignees who regularly file patent applications in the same technological field are more likely to interact with the same examiner specialized in that field), we broke down our measure of repeated interactions by the level of an assignee s innovative activity (the number of patents granted to that assignee per year and per technological field). Doing so allows us to condition our measure of repeated interactions to the intensity of the assignee s innovative activity. Otherwise, unequal patent distribution among the various assignees mechanically generates unequal interactions with assignees. An additional rationale for breaking down repeated interactions by intensity of innovative activity of assignees relates to its implication for an examiner s decision to leave the PTO. Among non-individual assignees (private firms or governmental institutions), the extent of innovative activity may create incentives for the firm or the firm s attorney offi ce to hire the examiner to take advantage of his/her highly specialized knowledge of what it takes for an innovation to be issued a patent. This may be even more relevant for assignees with relatively lower intensity of innovative activity and who would like to expand by increasing the activity of their research and development branch. We therefore expect to find different correlations between mobility outcomes and repeated interactions with assignees depending on the level of innovative activity. To obtain a distribution of assignee innovative activity in terms of patents, we used the NBER patent-assignee database, excluding assignees who are individuals, selecting only firm or organization assignees (private or government organizations). For each assignee, we counted the number of patents in each technological field in a year (by the granting year of the patent). We thus obtained a year-specific and technological field-specific distribution of innovative activity by firm assignee. We used this information to create distributions of innovative activity by year and technological field. We define the 20 th and 80 th percentiles as the levels of low and high innovative activity (medium level being in between the two) in a year and technological field. While these cutoff levels have been arbitrarily created, 25 they are defined for the whole population of firm assignees in the NBER Patent Database. After obtaining this information, 25 We experimented with more or different cut-off levels and the results of the estimations (not shown but available upon request) were similar. 12
13 we recalculated the maximum number of repeated interactions but, this time, separately by levels of the assignee s innovative activity. It is worth mentioning as well that the year- and field-specific levels of innovative activity of the assignees were defined over the whole population of patents-assignee to avoid endogeneity created by calculating the percentiles over the nonrandom subsample of patents-assignees of our sample of examiners Mobility Measures The mobility outcomes (leave or being promoted) of an examiner have been created using the PTO employee yearly directory for , kindly provided to us by B. Sampat. The roster data contains all the employees (full name and job title) who worked at the PTO between 1992 and It also contains information about the four-digit Art Unit in which they were working each year. The roster data gives us the exact year at which the individual left between 1996 and 2006 (since 1995 is the year we collected the examiner sample, none of the examiners could have left that year) allowing us to identify leavers as examiners who left the PTO at some point during 1996 and Using this information, we can further analyze turnover information in our data by looking at average tenure of examiners the year they left. Appendix A Table A3 calculates the yearly proportion of examiners who left the PTO since 1995 by tenure level. We assume that departures with less than 15 years of tenure as primary examiner are more likely to represent a job separation while departures with more than 25 years of tenure as primary examiner are more likely to reflect retirement. In the first 5 years following 1995 (the year at which we start observing departures), none of the departures seem to be associated with a retirement and in the majority of them, examiners have less than 15 years of tenure as primary examiner. Retirements are observed later in the sample period. Overall, using tenure information at the time of departure, over the period, 32% of the departures are likely job separations (tenure as primary examiner less than 15 years) and 31% are likely retirement (tenure as primary examiner of more than 25 years). For identification of promotions within the PTO, we use the job title information provided in 26 When patents have several assignees, we split the patent count by the number of assignees on the patent. 27 The end year of 2006 which corresponds to the last year of the employee directory data creates right censoring in the dataset regarding mobility information over time as examiners who stayed until 2006 and did not get promoted by then may well be after This issue is more problematic when using a sample, which includes new hires every year which is not the case here. 13
14 the yearly roster data. The job titles include legal and quality related tasks as well as job titles implying management responsibilities such as director, chief of staff, chairman and Supervisory Patent Examiner (SPE). SPE are responsible for supervising a group of examiners in specific Art Units and their patent examining load is reduced as a result. As not all examiners are promoted to SPE, we consider the promotion to SPE as being the first promotion opportunity for an examiner. 28 We therefore identified an examiner s promotion based on the change in job titles from primary examiner to SPE as well as from SPE to any job titles, which involve greater administrative responsibilities. An examiner is identified as a promotee if at some point during the period , he/she has moved out of his/her role of examiner to SPE or from SPE into one of the more administrative positions described earlier (director, chief of staff, chairman). We also identify promotions on a yearly basis as we have information about the year the job change occurred. Note that examiners could be identified as both leaver and promotee during the time period so we also categorize promotees-stayers as those who have received a promotion and have not left the organization by Analysis The observational aspect of the data limits the possibility to exploit exogenous variations and/or test and discriminate between different theoretical predictions of worker mobility. Our objective in this section is to analyze a set of questions highlighting potential links between Average Granted Patent Characteristics (denoted AGPC) and Examiner-Patent Characteristics (denoted EPC) and mobility outcomes. 4.1 Who Leaves and/or Gets Promoted? In this subsection, we analyze the link between an examiner mobility outcome (the fact that he/she left or got promoted some time between 1995 and 2006) and the average characteristics of his/her granted patents as well as our examiner-patents measures based on self-citations and repeated interactions with assignees. We are wondering who leaves and/or gets promoted based on information on gender, tenure and patent characteristics of the examiner. 28 During their career, examiners are promoted to different GS levels, and most of them are also promoted from assistant to primary examiner. Therefore, we do not consider these regular promotions as being promotions. 14
15 We use a latent variable model with the observable mobility outcome defined by whether the examiner left the PTO or whether he/she received a promotion. We exploit the yearly variations in patent average characteristics of the dataset to see whether and how they correlate with the static mobility outcomes of our sample of examiners who are classified as either leavers, or promotees versus non job changers. We analyze leaving and promotion decisions separately although they may not be independent decisions, especially if leaving takes place after a promotion. Figure 1d presents the distribution of (assistant and primary) examiners tenure separately for examiners who left and those who received a promotion some time between 1992 and We see that whether it is for the smaller group of early leavers or for the rest of the examiners, the peak tenure year for leavers happens about a year before the one for promotees suggesting that leaving more likely happens before rather than after promotion opportunities. The results for the outcomes of leavers versus stayers are given in Table 1, and for the outcomes of promoted versus non-promoted examiners are presented in Table 2. In each case, we performed a series of hierarchical logistic estimations, starting initially with a base specification (column 1) which includes the AGPC variables (average pendency time, average number of claims, U.S. applicants, backward citations, generality, and originality) and examiner characteristics (gender, tenure as assistant examiner, tenure as primary examiner, number of patents granted as assistant examiner, and number of patents as primary assistant per technological field). We further augmented the previous specification (column 2) by adding EPC variables (self-citations and repeated assignee interactions). The next column (column 3) considers the same specification as in column 2 but regressed over the sample of examiners which excludes examiners who left after 15 years or longer (more likely to reflect retirement) considering only those who stayed or left after staying less than 15 years at the PTO. In the case of the promotion analysis, it excludes promoted examiners who left during the sample period. All the specifications include year dummies and dummies for the technological field of the last patent granted in the given year. In the last column (column 4), we replicate the estimation using the panel dataset and Art Unit fixed-effects. From the first column of each Table, we see that none of the AGPC variables are statistically significantly related to having left the PTO (Table 1), and average pendency time is positively related to having received a promotion (Table 2). This is not surprising as examiners have less time for granting patents after taking on the supervisory responsibilities of the job of SPE. Over- 15
16 all, between-examiners variations in AGPC are not significantly strong predictors of turnover and promotion likelihoods. The strongest correlations are found when considering variables related to granting experience of examiners (number of patents granted by field and tenure) and granting behavior (self-citation and repeated interactions with the same assignee). The estimates related to granting experience are presented in the lower panels of Tables 1 and 2 (column 1). Interestingly, while the number of patents granted per year as primary examiner helps explain (statistically significantly positive estimates) both leaving and promotion outcomes, the technological field in which the patents have been granted seems to make a difference for predicting turnover or promotion. That is, having more patents granted in the Chemical field is positively associated with examiners who have left, while it is the granting of patents in the Computer and Communication field and Electronic field which is positively associated with having received a promotion. The estimates in terms of odds ratio imply that with an additional patent granted per year in the Chemical field, the odds of an examiner leaving increase by 59.7% and with an additional patent granted per year in Computers and Communications, the odds of an examiner receiving a promotion increase by 106%. Among the set of examiner characteristics, gender is unrelated to mobility outcomes. Examiners who have left have spent fewer years as assistant examiner and have less patents granted as assistant and more years accumulated as primary examiners (a direct implication of retirement). Years of tenure as assistant and number of patents granted as assistant are unrelated to an examiner s promotion but examiners who have been promoted have on average less years of accumulated tenure as primary examiner. This suggests that there is a fixed window of promotion opportunities and pass the right time, promotion prospects decline. Regarding granting behavior of examiners (EPC variables), the percentage of self-citations is strongly related to mobility outcomes (column 2 of each table). Examiners who have left have a higher percentage of self-citations while those who have been promoted have a lower percentage of self-citations (each relative to examiners who stayed until 2006 and did not receive a promotion). Given our finding of the lack of evidence that self-citations reflect knowledge depth in a particular technological field (analysis summarized in Appendix A), we interpret the positive (negative) correlation between self-citations and the likelihood of leaving (being promoted) as mobility outcomes resulting from the examiner s lack of effort. For repeated interactions with the same assignee, interactions with highly innovative firms 16
17 are statistically significantly and positively related to leaving the PTO and repeated interactions with assignees with low levels of innovative activity strongly negatively correlate with promotion probabilities. The positive correlation between leaving outcomes and repeated interactions with assignee firms of high level of innovative activity confirms our initial conjecture that not all interactions are the same and that highly innovative assignees may be more likely to offer job opportunities for examiners in their R&D offi ce. The negative correlation with promotion prospect may reflect the fact that the time and information invested in maintaining assignee interactions prevent examiners from investing time in developing a career track within the PTO. The next column of Table 1 (column 3) shows results estimated over the particular group of examiners whom, if they have left before 2006, have done so after having spent less than 15 years at the PTO and for Table 2, over the group of examiners whom, if they have received a promotion before 2006, have not left the PTO by The results are slightly different when considering early movers, especially for early leavers. Backward citations are now positively correlated with leaving early and it is now patents granted in the fields of Drugs and Medical products and Mechanical products that increase the odds of leaving, by about 94 percentage point and 96 percentage point, respectively. 29 For the promoted examiners who stayed, the results are similar to those in column 2 (the statistically significant estimates are slightly different in magnitude). 30 Regarding EPC variables, the previous estimates become stronger for both the odds of leaving and receiving a promotion. In the last column (column 4) of Tables 1 and 2, we replicate the analysis with additional controls for Art Unit fixed-effects using the panel dataset. sometimes with larger estimates reflecting stronger correlations. The results hold and The correlation between mobility outcomes and repeated interactions with assignees of both high and low levels of innovative activity for early leavers may seem odd at first. However, job opportunities for examiners teaming up with low innovative assignees may also take place, to the extent that these assignees would like to increase the size of their R&D activity level. An alternative interpretation which has been brought to us is one based on the assumption that examiners are more likely to leave as a result of the inconvenience of repeatedly dealing with persistent filers (and the limited control examiners have over rejecting applications). Persistent 29 Tenure as assistant examiners is no longer significant for early departure and tenure as primary is significant but negatively associated with early departure. 30 Except for the number of granted patents in the field of Electronic products, which does not correlate anymore with promotions. 17
18 filers are more likely to be low innovative activity firms that rely on the continuation process to eventually get their patents approved. These high volume applicants are more sophisticated applicants who know what is necessary to game the patent system. It is possible that examiners first enjoy the benefits of the job at the PTO but may soon realize they cannot handle the disadvantages which come with handling persistent filers and leave the PTO as a result. We further investigated our sample of early leavers (examiners who left the PTO after spending less than 15 years) by matching their names with the LinkedIn database (26% match rate) and with the list of U.S. certified patent attorneys downloadable from the PTO website. 31 find that 43.8% of our sample of early leavers are U.S. patent attorneys or agents. We classify the remaining set of early leavers as having moved to other occupations. 32 Table 3 replicates the analysis in column 4 of Table 1 separately for the subsample of stayers and early leavers whose current affi liation is either attorneys or agents (column 1) thereby excluding early leavers who left to end up in another occupation. The second column of Table 3 analyzes stayers versus early leavers whose current affi liation is different from attorneys or agents. We are interested in analyzing whether the determinants of early departure are different by type of occupations post PTO time. The results are indeed very different. Examiners who left the PTO to work as attorneys or agents are more likely to have granted patents with longer pendency time, with more claims, and of greater originality (citing other patents that are in a wide range of technologies). The correlation with the originality of the patents granted is very strong. Originality is important for innovators as inventions that rely on patents in a wide array of technology fields might lead to original results. Therefore, examiners with strong expertise in original patents might have a deeper knowledge of the patenting process. On the other hand, number of claims is negatively related to other occupations held by examiners after they leave the PTO but we find a positive correlation with patents from U.S. inventors and a strong positive correlation of patents granted in the Drugs and Medical category. This could suggest that examiners who are leaving for a non attorney job might be employed by large pharmaceutical companies, for instance. Regarding EPC variables, the percentage of self-citations affects the likelihood of leaving the PTO for a different job than attorney or agent. Interestingly, it is repeated interactions with 31 In most cases we did not find the names in the LinkedIn database. We were more successful matching names with those from the PTO list. However, it is not perfect since the information concerns current affi liation of U.S. patent attorneys or agents. We are not able to capture the first employer of an examiner after he left the PTO. 32 Some former examiners are working in R&D companies or as program developers. We 18
19 highly innovative firms that strongly correlates with pursuing a career as a patent attorney in a law firm. The repeated interactions with low innovative firms seem to only correlate with finding another job. The next subsections further investigate the potential dynamic aspect of the previous correlations. 4.2 Does Timing of AGPC Matter? In this subsection, we perform two types of analyses exploiting the panel format of the dataset. First, we model the likelihood of leaving and receiving a promotion at time t as a function of the lags of the time-varying AGPC and EPC using random-effect logistic estimations, which control for years and Art Unit fixed effects (Table 4). 33 The use of random-effect instead of fixed-effect estimations in this dynamic context is motivated by the idea that in the dynamic mobility literature which models individual career choices (Gibbons and Waldman, 1999; 2004, Gibbons et al., 2005; Lluis, 2005), the yearly mobility outcome is driven by learning about an employee s own ability to perform on the job. The learning effects correspond to changes in individuals and employers beliefs about the employee s ability. These beliefs are part of an unobservable component in the error term which is a time-varying random variable, not a fixed-effect. Moreover, rational expectations imply that changes in beliefs between the previous and the current period, which drive next period mobility outcomes, follow a martingale and are thus uncorrelated with current period employee characteristics, the covariates in the mobility equation. Under this type of mobility framework, the likelihood of current mobility is a function of the lags of an employee s characteristics or behavior and a random time-varying error term representing changes in beliefs about the employee s ability to perform on the job. Under the assumption of rational expectations, these variables are assumed to be uncorrelated and the random-effect logistic estimator is unbiased and effi cient. Second, we look at whether AGPC and EPC variables influence the conditional probability of leaving or being promoted conditional on the time already spent at the PTO by estimating parametric hazard functions (Table 5). 33 We consider random-effect instead of fixed-effect estimations as we assume that examiner ability which affects turnover and promotion prospects is unobserved and that the likelihood of mobility at time t is influenced by (examiner and employer) learning about it. Beliefs about ability follow a random process (martingale or random walk in the case of Bayesian learning) which affects the likelihood of leaving or receiving a promotion at t but is uncorrelated with the lags of the explanatory variables in the mobility equation such as the lags of the AGPC and EPC characteristics (as a result of the martingale process for the evolution of beliefs). 19
20 We also exploit the time-varying information we have on examiners Art Unit from the roster data. During the time period, several examiners experienced multiple changes in Art Units both during and over the years. We created a variable reporting the number of Art Units an examiner was associated with (reflecting the scope of his/her knowledge) in a given year and a variable indicating whether he/she switched Art Units during the year where Art Units are categorized at the 4 digit level. Table 4 (lagged determinants) and Table 5 (Duration) report the results of the random-effect logistic estimations and the hazard estimations, respectively. The first three columns of Table 4 show the estimates of the contemporaneous and first and second lag values of the explanatory variables on the likelihood of leaving at time t and the last three columns show the results for the same explanatory variables on the likelihood of receiving a promotion at time t. 34 Similar to the static analysis in Tables 1-2, we look at the estimates associated with patent and examiner characteristics (including the different variables related to granting experience) along with the variable indicating whether the examiner experienced a change in Art Unit during the previous year (first lag) and two years prior (second lag). Examining the first three columns of Table 4 for turnover outcomes, we see that both the contemporaneous and lagged pendency time (from the first two columns) strongly relate to current period leaving decision with opposite signs but similar magnitude. In fact, the estimated coeffi cients are so similar that a hypothesis test (not shown but available upon request) cannot reject the null of equality of the coeffi cients suggesting it is the change in pendency time between t 1 and t which is correlated with leaving at t. 35 A re-estimation using the change in pendency time between t and t 1 confirms that an increase in pendency time has a statistically significant relationship with the likelihood of leaving. 36 This is not surprising, as examiners who leave during a given year would have less time to finalize the last applications they have been working on. The second lag of pendency time is unrelated to departure suggesting that pendency time is unlikely to be the source of the departure decision. Previous period average originality of an examiner s granted patents is statistically significantly related to next period departure. Interestingly, the second lag is also statistically significant but is negative and of the same magnitude (a test of equality of the two estimates cannot reject the null hypothesis). suggests that it is the increase in average originality of the patents granted between t 2 and 34 The regressions also include the first and second lags of the art unit dummies and year dummies. 35 With the βs of similar magnitude for the two X variables X t and X t 1, factoring the beta leads to β (X t X t 1) which reflects the change in X between two consecutive years. 36 Results are available upon request. This 20
21 t 1 which correlates with next period departure. A re-estimation using the change in originality between t 2 and t 1 confirms that finding. 37 This result on the positive impact of originality of the patents granted and examiners departure is consistent in every analysis presented so far (Table 1 column 4, and Table 3). As with pendency time, another direct effect of an examiner s departure decision is the negative correlation with the current period number of patents granted in any of the technological fields. Examiners who left some time during a given year automatically grant less patents during that year. The more interesting results regarding granting experience are the strongly significant correlations of the number of patents granted in Drugs and Medical products and in Mechanical products two years prior to departure. The result is consistent with Table 1 conclusions about the statistically significant link between granting patents in the field of Drugs and Medical products and the likelihood of leaving the PTO. Furthermore, the first lag of the number of granted patents in Drugs and Medical products is negatively correlated with departure next period. Together with the result on the second lag estimate (and similar to pendency time and originality), we see that it is the change in patents granted between t 2 and t 1 which correlates with next period departure. In this case, a decline in the number of patents granted in that field is associated with next period departure. Gender is not related to the dynamic decision of leaving in a given year but tenure as assistant examiner reduces the likelihood of leaving the PTO while tenure as primary examiner increases the likelihood of departure, similar to the static mobility results of Table 1. There is evidence that changing Art Units significantly decreases the likelihood of leaving two years later. The next three columns of Table 4 present the promotion dynamics. While promotions are significantly negatively correlated with average generality of the promoted examiner s patents, average generality two years prior to the promotion increases the chances of an examiner s promotion. As with departure, a change in the number of patents granted between two periods is positively associated with promotion. It is in the field of Electronic products, consistent with the results found in Table 4. Gender does not relate to the dynamics of promotions and tenure accumulated as primary examiner reduces future promotions. There is also a negative correlation between the number of patents granted as assistant and future promotions. The number of Art Units in the year an examiner is promoted significantly increases but previous period number of Art Units or Art Unit switches do not seem to help predict future promotions. 37 Results are available upon request. 21
22 In Table 5, we present the estimates for the Weibull distribution survival model. 38 While from the previous analysis we found that lagged values of AGPC are not correlated with the likelihood of current mobility outcomes, we now find that in the context of a duration model, AGPCs are correlated with the evolution of the hazards of leaving and receiving a promotion over time. Indeed, the average generality of granted patents increases (although with weak statistical significance) the hazard of leaving and the percentage of patents with U.S. inventors increases the hazard of receiving a promotion. Both estimates are statistically significant and the hazard ratios imply that a 1% increase in the generality index of examiner granted patents and in the proportion of his/her patents granted with U.S. inventors each increases the hazard of leaving by about 5 and the hazard of receiving a promotion by about 4. Furthermore, while we found that examiners who grant patents in Drugs and Medical products are more likely to leave (Table 1) and that an increase in the number of patents granted in that technological field helps predict next period leaving decision (Table 4), we find that the number of patents granted in that same field does not significantly influence the risk of leaving over time. Instead, it is the number of granted patents in the other fields (those which have been found to positively relate to promotions in Table 2) which significantly reduces the hazard of leaving (patents granted in Computers and Communication, Electronic and Mechanical products). It is not surprising to find that leaving risks decline over time in the fields which are positively correlated with the likelihood of having received a promotion. Examiners would have lower incentives to leave in fields with greater promotion probabilities. For the promotion hazard, we find that other than the percentage of U.S. patents granted, pendency time significantly reduces promotion hazards (Table 5, second column estimate which implies a hazard ratio of 0.596). A small decline in the promotion hazard is associated with an increase in the number of claims. The number of granted patents does not relate to the promotion hazard. This finding confirms our previous conclusion that there seems to be no link between the timing of a promotion (the likelihood of a promotion at time t or the time evolution of a promotion hazard) and performance achievements as measured by experience accumulated in granting patents in a given year. In other words, the PTO quota system does not seem to relate to promotion outcomes, as we define them. Also consistent with results found in Tables 1 and 2, an examiner percentage of self-citations 38 A comparison of the AIC across the different distributions (exponential, log normal and Weibull) is shown in Appendix B Table B2. Based on the AIC value, we conclude that the Weibull distribution is preferred over the others. 22
23 significantly increases the risk of leaving and reduces the promotion hazard. Regarding repeated interactions with the same assignee, the positive correlation comes out strong for the hazard of leaving and interactions with low innovative activity inventors implying that such repeated interactions do increase the risk of leaving over time. The negative correlation with the promotion hazard for low innovative activity assignees is strong but imprecisely estimated. The one determinant that was not found to be significantly related to the unconditional probability of leaving and is found to significantly increase the risk of leaving over time is being a female. Notice however that the estimated coeffi cient for female in the promotion results (Tables 2 and 4) is positive but weak and imprecisely estimated (likely the result of an attenuation bias as discussed earlier). Together these results suggest that female examiners may be more likely to leave the PTO than their male counterparts but probably not due to a glass ceiling problem. Our additional measures related to Art Unit mobility (the Art Unit switch dummy and the number of times an examiner switched Art Units) significantly increase the risks of leaving and promotions, with larger estimates in the latter case than in the former. This suggests that lateral mobility across Art Units is an important factor developing the scope of knowledge necessary to move up in administrative and supervisory responsibilities. 4.3 Summary of Main Results Finally, we highlight the results of each type of analysis to present a synthetic view of the various approaches we used in this paper. Who leaves or gets promoted? - We find that after controlling for years of accumulated tenure as primary examiner and for Art Unit fixed-effects, the technological field in which examiners accumulate granting experience has a strong and robust explanatory power in predicting mobility outcomes. Examiners who end up leaving tend to have granted patents in the field of Drug and Medical products. Examiners who end up getting promoted tend to have accumulated granting experience in the fields of Computers and Communication and Electronic products. In other words, mobility outcomes strongly interact with which technological field an examiner grants patents in. Some fields seem to be more prone to turnover and others more prone to lead to promotions. Moreover, controlling for tenure, technological field and Art Unit fixed-effects, originality of the granted patents increases the odds of leaving early and more strongly for examiners who left for an attorney job at a law firm. Also a higher (respectively, smaller) percentage of examiner 23
24 self-citations is associated with leaving (resp., promotion). Further analysis indicates a lack of evidence of differences in self-citations across technological categories (Appendix A Table A5). We interpret this finding as suggesting that the self-citations variable is more likely to proxy for examiner s low effort rather than for examiner s depth of knowledge. Finally, still controlling for examiner tenure, technological field, Art Unit fixed-effects and self-citations, early leavers experience more repeated interactions with both high- and low- innovative assignees while promotees experience less repeated interactions with low and mediuminnovative assignees. Our interpretation of these findings relies on factors that affect the nature or type of interactions. Positive interactions may generate attractive job opportunities at the assignee firm or its lawyer. Negative interactions resulting from the persistence of the applicant is more likely to lead to quitting the job of examiner. The time involved implicitly in repeated interactions with assignees is also expected to reduce examiners time investment in factors leading to a promotion. Timing related to lags - Exploiting time variations in AGPC and the dynamics of departures and promotions further highlights the importance of past period average originality of an examiner s patents for predicting next period departure and past period average generality of an examiner s patent for predicting next period promotion probabilities. Moreover, a significant predictor of next period departure is the decrease in the number of patents granted in the field of Drugs and Medical products. The likelihood of a promotion increases with the increase in the number of patents granted in Electronic products. Timing related to duration - Regarding leaving and promotion hazard rates over time, the analysis complements well the previous findings. Some AGPC do influence the hazards of leaving and promotion over time (average generality of granted patents and average percentage of patents with U.S. innovators, respectively). Self-citations and repeated interactions with lowinnovative assignees also influence leaving and promotion risks over time. The new results from this analysis is the finding of a gender effect showing a significant increase in the turnover risk for female examiners and the lateral mobility effect by which switching Art Unit significantly increases promotion hazards. 5 Conclusion The attrition rate of patent examiners over the last decades has been an issue for the PTO. Concerns have also been raised about the incentive mechanisms designed to induce examiners 24
25 to grant patents to only deserving innovations. Various criticisms have emerged about the issuance of too many questionable patents. Even though patent applicants have their share of responsibility (it is their innovation to start with, so they should provide accurate information to those who must judge their novel content), patent examiners should also be liable as they are those who, ultimately, grant temporary monopoly rights (Langinier and Marcoul, 2016). To the best of our knowledge, little attention has been devoted to the attrition rate and career outcomes of examiners. Our objective is to study and document the possible links between various aspects of the patent review process and examiners mobility outcomes. We consider mobility inside and outside of the institution. Mobility inside is defined as the change of job away from the main duties of primary examiner and towards greater supervisory and administrative duties. Mobility outside represents examiners who are leaving the institution. We use characteristics of an examiner s granted patents and two new measures of an examiner s grant related behavior: examiner self-citations and repeated interactions with the same inventor. Overall, we find consistent evidence from static, dynamic and duration models of the importance of examiners granting experience in specific technological fields (Drugs and Medical or Mechanical products for departures and Computers and Communication or Electronic products for promotions), repeated interactions with the same inventor, and percentage of self-citations in predicting examiners departure and promotion probabilities. We also find consistent evidence of the importance of patent originality in predicting leaving outcomes in both our static and dynamic analysis. The duration analysis further points to the importance of granting patents for increasing time to promotion. While we are not able to precisely identify reasons for the observed mobility outcomes, additional analysis helps us offer speculative interpretations. From further analysis of our measure of examiner self-citations, we suggest an interpretation based on low effort rather than based on knowledge depth. Poor performance from lack of effort in searching for prior art may explain increased turnover and reduced promotion opportunities. On the other hand, job opportunities might be easier or more attractive in the fields of Drugs and Medical or Mechanical products leading to greater turnover for examiners who accumulated granting experience in these fields. Another result is the importance of the originality of an examiner s granted patents in predicting future departure (but unrelated to promotions) especially as attorney in a law firm. Combined with the previous interpretation of the results in terms of differentially attractive job opportunities in specific technological fields, granting experience associated with original 25
26 patents may reflect an examiner s valuable and unique expertise in such fields. Lastly, the fact that repeated interactions with assignees increase departure and reduce promotion probabilities suggests that relationship building with inventors is an important factor to consider when analyzing the mobility implications of examiners grant related behavior. Overall, our results invite academic research, in pursuit of a more effi cient patent granting system, and human resources policy makers in pursuit of a better workplace in patent offi ces worldwide, to further think about the implications of examiners career outcomes in the functioning of the patent examination process. Closer attention needs to be devoted to the link between examiner mobility outcomes and patent characteristics and patent granting behavior (citations, self-citations and the non-random assignment of assignees to examiners). In the innovation literature, studies that exploit variations in granting rates across examiners within a technological field and granting year (Sampat and Williams, 2015) could further consider incorporating examiners granting experience measured by the repeated interactions with either high or low innovative inventors as these interactions likely correlate with the examiners leniency in granting patents (after controlling for technological fields). Finally, a comparison of the results related to turnover and promotions provides interesting insights for developing further research projects. We find that the predictors that increase the likelihood of leaving decrease the promotion probability. This result by itself suggests that explanations of mobility decisions based on incentives and outside options by which outside options increase both departure and promotion prospects (as a retention strategy) do not seem to be relevant in the labor market of patent examiners. 26
27 27
28 Table 1. Determinants of Leaving the PTO Logisitic Estimations with Clustered Standard Errors Variables Tenure 15 AU FE Patent Characteristics (AGPC) Coef. Coef. Coef. Coef. Pendency Time (0.184) (0.192) (0.389) (0.376) Number of Claims (0.032) (0.035) (0.052) (0.053) % U.S (0.726) (0.743) (1.585) (1.260) Backward Citations *** 0.055*** (0.025) (0.016) (0.019) (0.018) Generality (0.862) (0.940) (1.764) (2.027) Originality * (0.668) (0.735) (1.488) (1.587) Examiner Characteristics Number of Patents as Primary by Category Chemical (cat. 1) 0.468*** 0.640*** (0.194) (0.187) (0.450) (0.367) Computers/Comm. (cat. 2) (0.169) (0.179) (0.386) (0.319) Drugs/Med (cat. 3) *** 0.653*** (0.198) (0.171) (0.169) (0.179) Electronic (cat. 4) * (0.170) (0.169) (0.664) (0.262) Mechanical (cat. 5) *** (0.194) (0.187) (0.262) (0.342) Other (cat. 6) *** (0.167) (0.157) (0.227) (0.342) Notes-***: significant at the 1% level, **: at the 5% level, *: at the 10 % level. 28
29 Table 1. Continued. Determinants of Leaving the USPTO Logisitic Estimations with Clustered Standard Errors Variables 39 Tenure 15 AU FE Coef. Coef. Coef. Coef. Examiner Characteristics (Con d) Female (0.331) (0.344) (0.447) (0.431) Experience Variables Tenure (Years) as Assistant *** *** (0.035) (0.036) (0.068) (0.072) Tenure (Years) as Primary 0.159*** 0.131*** *** *** (0.021) (0.024) (0.046)) (0.047) Number of Patents as Assistant * * (0.108) (0.115) (0.164) (0.199) Examiner-Patent Characteristics (EPC) % Self-citations 0.103*** 0.106** 0.192*** (0.026) (0.053) (0.068) Repeat High Assignee 0.048* 0.087** 0.073* (0.030) (0.033) (0.042) Repeat Medium Assignee (0.053) (0.058) (0.069) Repeat Low Assignee *** 2.494*** (0.537) (0.566) (0.769) Log Pseudo Likelihood N Notes-***: significant at the 1% level, **: at the 5% level, *: at the 10 % level. 39 Also includes technological category of the last patent granted in the year and year dummies. 29
30 Table 2. Determinants of Promotions at the PTO Logisitic Estimations with Clustered Standard Errors Variables Stayers AU FE Patent Characteristics (AGPC) Coef. Coef. Coef. Coef. Pendency Time 0.563*** 0.727** 0.859*** 0.533** (0.180) (0.195) (0.217) (0.212) Number of Claims (0.032) (0.034) (0.037) (0.034) % U.S (0.808) (0.920) (0.988) (1.115) Backward Citations (0.026) (0.018) (0.023) (0.016) Generality (0.745) (0.832) (0.872) (0.937) Originality ** (0.795) (0.856) (0.999) (1.099) Examiner Characteristics Number of Patents as Primary by Category Chemical (cat. 1) * (0.195) (0.198) (0.266) (0.173) Computers/Comm. (cat. 2) 0.723*** 0.647*** 0.479*** 0.510*** (0.168) (0.201) (0.175) (0.195) Drugs/Med (cat. 3) 0.369** (0.163) (0.150) (0.154) (0.191) Electronic (cat. 4) 0.475*** 0.254** (0.134) (0.126) (0.133) (0.119) Mechanical (cat. 5) 0.275* (0.160) (0.174) (0.216) (0.165) Other (cat. 6) 0.389** (0.174) (0.221) (0.237) (0.183) Notes-***: significant at the 1% level, **: at the 5% level, *: at the 10 % level. 30
31 Table 2. Continued. Determinants of Promotions at the PTO Logisitic Estimations with Clustered Standard Errors Stayers Variables 40 AU FE Coef. Coef. Coef. Coef. Examiner Characteristics (Con d) Female (0.318) (0.328) (0.361) (0.368) Experience Variables Tenure (Years) as Assistant (0.027) (0.029) (0.032) (0.033) Tenure (Years) as Primary *** *** *** *** (0.021) (0.023) (0.026) (0.027) Number of Patents as Assistant (0.073) (0.082) (0.032) (0.095) Examiner-Patent Characteristics (EPC) % Self-citations *** *** *** (0.089) (0.124) (0.095) Repeat High Assignee (0.040) (0.047) (0.047) Repeat Medium Assignee ** * (0.058) (0.066) (0.058) Repeat Low Assignee ** *** ** (0.856) (0.930) (0.949) Log Pseudo Likelihood N Notes-***: significant at the 1% level, **: at the 5% level, *: at the 10 % level. 40 Also includes technological category of the last patent granted in the year and year dummies. 31
32 Table 3. Determinants of Leaving the PTO by Occupation Logisitic Estimations with Clustered Standard Errors and Art-Unit Fixed-Eff ects 1 2 Variables Attorney/Agent Other Patent Characteristics (AGPC) Coef. Coef. Pendency Time 0.915** (0.421) (0.458) Number of Claims 0.193** ** (0.085) (0.047) % U.S * (2.270) (1.268) Backward Citations (0.022) (0.046) Generality (2.737) (2.593) Originality 6.373*** (2.217) (1.653) Examiner Characteristics Number of Patents as Primary by Category Chemical (cat. 1) * (0.953) (0.416) Computers/Comm. (cat. 2) (0.302) (0.485) Drugs/Med (cat. 3) *** (1.407) (0.151) Electronic (cat. 4) (0.966) (0.275) Mechanical (cat. 5) (0.455) (0.519) Other (cat. 6) (0.785) (0.458) 32
33 Table 3. Continued. Determinants of Leaving the PTO by Occupation Logisitic Estimations with Clustered Standard Errors and Art-Unit Fixed-Eff ects 1 2 Variables 41 Attorney/Agent Other Examiner Characteristics (Con d) Coef. Coef. Female (1.022) (0.474) Experience Variables Tenure (Years) as Assistant 0.185* (0.103) (0.078) Tenure (Years) as Primary *** *** (0.099) (0.047) Number of Patents as Assistant * (0.291) (0.199) Examiner-Patent Characteristics (EPC) % Self-citations ** (0.153) (0.069) Repeat High Assignee 0.103** (0.049) (0.046) Repeat Medium Assignee (0.102) (0.061) Repeat Low Assignee *** (0.789) (0.746) Log Pseudo Likelihood N Notes-***: significant at the 1% level, **: at the 5% level, *: at the 10 % level. 41 Also includes technological category of the last patent granted in the year and year dummies. 33
34 Table 4. Lagged Determinants of Leaving/Promotion Random-Eff ect Logisitic Estimations with Clustered Standard Errors Leaving Promotion Variables Xt Xt-1 Xt-2 Xt Xt-1 Xt-2 Patent Characteristics (AGPC) Coef. Coef. Coef. Coef. Coef. Coef. Pendency Time 0.901*** ** (0.248) (0.399) (0.441) (0.300) (0.464) (0.413) Number of Claims (0.035) (0.083) (0.042) (0.037) (0.047) (0.055) % U.S (0.911) (1.025) (2.176) (0.936) (1.157) (2.010) Backward Citations (0.015) (0.042) (0.050) (0.041) (0.057) (0.043) Generality ** * (0.911) (1.237) (1.651) (0.838) (1.072) (1.609) Originality ** * (1.231) (1.576) (2.793) (1.375) (1.807) (1.783) Examiner Characteristics Number of Patents as Primary by Category Chemical (cat. 1) *** * (0.064) (0.040) (0.037) (0.043) (0.051) (0.049) Computers/Comm. (cat. 2) *** (0.042) (0.042) (0.040) (0.030) (0.068) (0.047) Drugs/Med (cat. 3) *** * 0.089*** (0.048) (0.048) (0.021) (0.022) (0.032) (0.033) Electronic (cat. 4) *** ** *** (0.036) (0.043) (0.037) (0.023) (0.031) (0.035) Mechanical (cat. 5) *** *** (0.053) (0.038) (0.025) (0.047) (0.027) (0.034) Other (cat. 6) *** 0.107** (0.059) (0.045) (0.052) (0.076) (0.080) (0.058) Notes-***: significant at the 1% level, **: at the 5% level, *: at the 10 % level. 34
35 Table 4 Continued. Lagged Determinants of Leaving/Promotion Random Eff ect Logisitic Estimations with Clustered Standard Errors Leaving Promotion Variables 42 Xt Xt-1 Xt-2 Xt Xt-1 Xt-2 Examiner Characteristics (Con d) Coef. Coef. Coef. Coeff. Coef. Coef. Female (0.286) (0.246) Experience Variables Tenure (Years) as Assistant *** (0.024) (0.022) Tenure (Years) as Primary 0.189*** *** (0.025) (0.022) Number of Patents as Assistant * ** (0.050) (0.067) (0.043) (0.108) (0.071) (0.021) Art Units Switched Art Unit (4-digit) ** (0.293) (0.332) (0.383) (0.266) Number of Art Units (0.298) (0.490) (0.387) (0.440) (0.494) (0.388) Log Pseudo Likelihood N Notes-***: significant at the 1% level, **: at the 5% level, *: at the 10 % level. 42 Also includes technological category of the last patent granted in the year and year dummies. 35
36 Table 5. Leaving/Promotion Duration Analysis Weibull Distribution Survival Estimation Model Variables Leaving Promotion Patent Characteristics (AGPC) Coef. Coef. Coef. Coef. Pendency Time * (0.245) (0.252) (0.241) (0.285) Number of Claims * * (0.032) (0.031) (0.035) (0.035) % U.S ** 1.459* (0.974) (0.958) (0.947) (0.913) Backward Citations (0.017) (0.016) (0.040) (0.035) Generality 1.794* 1.670* (1.019) (1.043) (1.055) (1.235) Originality (0.011) (0.011) (0.011) (0.013) Examiner Characteristics Number of Patents as Primary by Category Chemical (cat. 1) (0.325) (0.327) (0.177) (0.169) Computers/Comm. (cat. 2) *** *** (0.413) (0.483) (0.154) (0.152) Drugs/Med (cat. 3) (0.248) (0.249) (0.170) (0.170) Electronic (cat. 4) * * (0.425) (0.426) (0.126) (0.324) Mechanical (cat. 5) * * (0.365) (0.376) (0.335) (0.324) Other (cat. 6) (0.359) (0.370) (0.354) (0.322) Notes-***: significant at the 1% level, **: at the 5% level, *: at the 10 % level. 36
37 Table 5. Continued. Leaving/Promotion Duration Analysis Weibull Distribution Survival Estimation Model Variables 43 Leaving Promotion Coef. Coef. Coef. Coef. Examiner Characteristics (Con d) Female 0.853** 0.861** (0.347) (0.341) (0.283) (0.257) Tenure (Years) as Assistant * (0.033) (0.031) (0.026) (0.026) Tenure (Years) as Primary 0.106*** 0.108*** *** (0.022) (0.022) (0.018) (0.017) Number of Patents as Assistant (0.124) (0.115) (0.092) (0.088) Examiner-Patent Characteristics (EPC) % Self-citations 0.028** 0.028** *** *** (0.012) (0.012) (0.074) (0.074) Repeat High Assignee (0.035) (0.033) (0.038) (0.037) Repeat Medium Assignee (0.047) (0.045) (0.053) (0.050) Repeat Low Assignee 0.911*** 0.886*** (0.288) (0.283) (0.845) (0.786) Art Units Art Unit Switch Dummy 0.408* 1.978*** (0.261) (0.217) Art Unit Number 0.328** 0.512*** (0.162) (0.127) Log Pseudo Likelihood N Notes-***: significant at the 1% level, **: at the 5% level, *: at the 10 % level. 43 Also includes technological category of the last patent granted in the year and year dummies. 37
 data (choosing years that cover our study period) which provide occupation information precise enough to proxy for the job of")
38 APPENDIX A: Examiners and Other Engineers/Scientists To get a sense of how examiners compare to workers in jobs with similar educational requirements, we looked at the 5% census public use file for the year 2000 and the 2004, 2006 and 2008 Current Population Survey (CPS) data (choosing years that cover our study period) which provide occupation information precise enough to proxy for the job of examiner. The census data and the CPS data starting in January 2003 have a 4-digit level occupation variable with enough precision to locate the occupation of examiners. 44 We also selected workers who report being engineers and scientists. Along with the occupation, we pulled out information on gender, education, age, percentage U.S. born, hours worked and individual yearly earnings. The table below provides summary statistics based on the large 2000 census sample of full-time workers with yearly earnings of at least $20, Female representation among our constructed sample of examiners is larger than among engineers and scientists. Our proxied examiners are on average younger, more likely to be born in the U.S., work relatively more hours and earn relatively less on average than engineers and scientists in To obtain additional evidence of the high turnover of examiners often mentioned in the media and internal government reports during the mid-2000 period, we compared the (kernel estimated) age density of our sample of proxied examiners with the age distribution of workers reporting 44 Examiner is provided as an illustrative example for the category numbered for jobs related to providing legal support. We further narrow down examiners by selecting individuals who report holding a BA or a higher degree, are U.S. citizens, and who live in the D.C. area and neighboring states (Washington, Virginia, Maryland, district of Columbia, New-Jersey and Pennsylvania). 45 We exclude observations with missing information on earnings and further selected individuals who report working full-time with at least $20,000 of yearly earnings. 38

39 their occupation as engineers and scientists obtained from the 2000 census data. We repeated the exercise using the CPS data for 2004, 2006 and 2008 to get a sense of the trends in the age distribution. We also used the 2006 CPS supplement on job tenure to further illustrate differences in turnover profiles between examiners and engineers/scientists using job tenure information. Appendix A Figures 1a-1c show the results. The age and tenure distributions of our proxied examiners sample exhibit an earlier peak (age less than thirty and tenure less than 10 years) and greater variance than for engineers and scientists. All the graphs point to the same evidence that our proxied job of examiners is more likely occupied by younger workers who accumulate less years of tenure compared to engineers and scientists. The present graphical analysis further confirms the relatively larger turnover of patent examiners based on publicly available survey data. 39
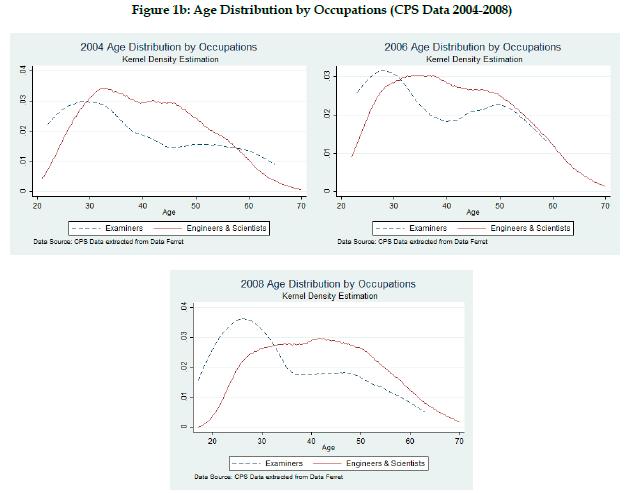
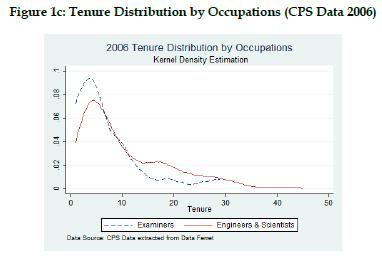
40 40
Effects of early patent disclosure on knowledge dissemination: evidence from the pre-grant publication system introduced in the United States
 Effects of early patent disclosure on knowledge dissemination: evidence from the pre-grant publication system introduced in the United States July 2015 Yoshimi Okada Institute of Innovation Research, Hitotsubashi
Mobility and Career Concerns of Patent Examiners: an. Analysis of U.S. Data
 Mobility and Career Concerns of Patent Examiners: an Analysis of U.S. Data Corinne Langinier and Stéphanie Lluis y March 2009 Preliminary Draft Abstract This paper is a contribution to the growing empirical
Examiner Characteristics and the Patent Grant Rate
 Examiner Characteristics and the Patent Grant Rate Mark Lemley Bhaven N. Sampat July 13, 2008 1 Introduction What determines whether a patent applicant can obtain a patent? In prior work, we studied patent
HOW TO READ A PATENT. To Understand a Patent, It is Essential to be able to Read a Patent. ATIP Law 2014, All Rights Reserved.
 To Understand a Patent, It is Essential to be able to Read a Patent ATIP Law 2014, All Rights Reserved. Entrepreneurs, executives, engineers, venture capital investors and others are often faced with important
UC Berkeley Law and Economics Workshop
 UC Berkeley Law and Economics Workshop Title Examiner Characteristics and the Patent Grant Rate Permalink https://escholarship.org/uc/item/44n9w3gk Author Lemley, Mark A. Publication Date 2009-01-03 escholarship.org
Standing Committee on the Law of Patents
 E ORIGINAL: ENGLISH DATE: DECEMBER 5, 2011 Standing Committee on the Law of Patents Seventeenth Session Geneva, December 5 to 9, 2011 PROPOSAL BY THE DELEGATION OF THE UNITED STATES OF AMERICA Document
Supplementary Data for
 Supplementary Data for Gender differences in obtaining and maintaining patent rights Kyle L. Jensen, Balázs Kovács, and Olav Sorenson This file includes: Materials and Methods Public Pair Patent application
Patents. What is a patent? What is the United States Patent and Trademark Office (USPTO)? What types of patents are available in the United States?
? What types of patents are available in the United States?") What is a patent? A patent is a government-granted right to exclude others from making, using, selling, or offering for sale the invention claimed in the patent. In return for that right, the patent must
What is a patent? A patent is a government-granted right to exclude others from making, using, selling, or offering for sale the invention claimed in the patent. In return for that right, the patent must
Are All Patent Examiners Equal? The Impact of Examiners on Patent Characteristics and Litigation Outcomes *
 Are All Patent Examiners Equal? The Impact of Examiners on Patent Characteristics and Litigation Outcomes * Iain Cockburn Boston University and NBER Samuel Kortum University of Minnesota and NBER Scott
Hitotsubashi University. Institute of Innovation Research. Tokyo, Japan
 Hitotsubashi University Institute of Innovation Research Institute of Innovation Research Hitotsubashi University Tokyo, Japan http://www.iir.hit-u.ac.jp An Economic Analysis of Deferred Examination System:
Research Collection. Comment on Henkel, J. and F. Jell "Alternative motives to file for patents: profiting from pendency and publication.
 Research Collection Report Comment on Henkel, J. and F. Jell "Alternative motives to file for patents: profiting from pendency and publication Author(s): Mayr, Stefan Publication Date: 2009 Permanent Link:
Where do patent measures fall short in the life sciences? Bhaven N. Sampat Columbia University and NBER July 28, 2017
 Where do patent measures fall short in the life sciences? Bhaven N. Sampat Columbia University and NBER July 28, 2017 There are well-known problems with patent statistics In most sectors patents not as
Revisiting the USPTO Concordance Between the U.S. Patent Classification and the Standard Industrial Classification Systems
 Revisiting the USPTO Concordance Between the U.S. Patent Classification and the Standard Industrial Classification Systems Jim Hirabayashi, U.S. Patent and Trademark Office The United States Patent and
Patent Mining: Use of Data/Text Mining for Supporting Patent Retrieval and Analysis
 Patent Mining: Use of Data/Text Mining for Supporting Patent Retrieval and Analysis by Chih-Ping Wei ( 魏志平 ), PhD Institute of Service Science and Institute of Technology Management National Tsing Hua
Private Equity and Long Run Investments: The Case of Innovation. Josh Lerner, Morten Sorensen, and Per Stromberg
 Private Equity and Long Run Investments: The Case of Innovation Josh Lerner, Morten Sorensen, and Per Stromberg Motivation We study changes in R&D and innovation for companies involved in buyout transactions.
Loyola University Maryland Provisional Policies and Procedures for Intellectual Property, Copyrights, and Patents
 Loyola University Maryland Provisional Policies and Procedures for Intellectual Property, Copyrights, and Patents Approved by Loyola Conference on May 2, 2006 Introduction In the course of fulfilling the
Post-Grant Patent Review Conference on Patent Reform Berkeley Center for Law and Technology April 16, 2004
 Post-Grant Patent Review Conference on Patent Reform Berkeley Center for Law and Technology April 16, 2004 Bronwyn H. Hall UC Berkeley and NBER Overview Heterogeneity More patents not necessarily better
An Empirical Look at Software Patents (Working Paper )
") An Empirical Look at Software Patents (Working Paper 2003-17) http://www.phil.frb.org/econ/homepages/hphunt.html James Bessen Research on Innovation & MIT (visiting) Robert M. Hunt* Federal Reserve Bank
An Empirical Look at Software Patents (Working Paper 2003-17) http://www.phil.frb.org/econ/homepages/hphunt.html James Bessen Research on Innovation & MIT (visiting) Robert M. Hunt* Federal Reserve Bank
Patent Statistics as an Innovation Indicator Lecture 3.1
 as an Innovation Indicator Lecture 3.1 Fabrizio Pompei Department of Economics University of Perugia Economics of Innovation (2016/2017) (II Semester, 2017) Pompei Patents Academic Year 2016/2017 1 / 27
Technological Forecasting & Social Change
 Technological Forecasting & Social Change 77 (2010) 20 33 Contents lists available at ScienceDirect Technological Forecasting & Social Change The relationship between a firm's patent quality and its market
The Complex Network of Skill and Ideas
 The Complex Network of Skill and Ideas Cokol Rzhetsky, 2007 James A. Evans U.S. Science and Technology Policy emphasizes Global Competitiveness What is a globally competitive STEM workforce? How does government
INTELLECTUAL PROPERTY
 INTELLECTUAL PROPERTY SCORECARD -6 FAST FACTS n Since there has been an almost continual increase in the percentage of patents applications in Australia, with a 6.9% increase between 5 and 6. n Trade marks
Gender Pay Report 2017
 Gender Pay Report 2017 Introduction The gender pay gap measures the difference between men and women s average earnings and is expressed as a percentage of men s pay. According to the Office of National
BOSTON UNIVERSITY SCHOOL OF LAW
 BOSTON UNIVERSITY SCHOOL OF LAW WORKING PAPER SERIES, LAW AND ECONOMICS WORKING PAPER NO. 06-46 THE VALUE OF U.S. PATENTS BY OWNER AND PATENT CHARACTERISTICS JAMES E. BESSEN The Boston University School
IXIA S PUBLIC ART SURVEY 2013 SUMMARY AND KEY FINDINGS. Published February 2014
 IXIA S PUBLIC ART SURVEY 2013 SUMMARY AND KEY FINDINGS Published February 2014 ABOUT IXIA ixia is England s public art think tank. We promote and influence the development and implementation of public
A Survey of the Economics of Patent Systems and Procedures* Andrew Eckert Department of Economics University of Alberta. and
 A Survey of the Economics of Patent Systems and Procedures* Andrew Eckert Department of Economics University of Alberta and Corinne Langinier Department of Economics University of Alberta April 2011 Abstract:
Randomized Evaluations in Practice: Opportunities and Challenges. Kyle Murphy Policy Manager, J-PAL January 30 th, 2017
 Randomized Evaluations in Practice: Opportunities and Challenges Kyle Murphy Policy Manager, J-PAL January 30 th, 2017 Overview Background What is a randomized evaluation? Why randomize? Advantages and
Web Appendix: Online Reputation Mechanisms and the Decreasing Value of Chain Affiliation
 Web Appendix: Online Reputation Mechanisms and the Decreasing Value of Chain Affiliation November 28, 2017. This appendix accompanies Online Reputation Mechanisms and the Decreasing Value of Chain Affiliation.
Who Invents IT? March 2007 Executive Summary. An Analysis of Women s Participation in Information Technology Patenting
 March 2007 Executive Summary prepared by Catherine Ashcraft, Ph.D. National Center for Women Anthony Breitzman, Ph.D. 1790 Analytics, LLC For purposes of this study, an information technology (IT) patent
As a Patent and Trademark Resource Center (PTRC), the Pennsylvania State University Libraries has a mission to support both our students and the
, the Pennsylvania State University Libraries has a mission to support both our students and the") This presentation is intended to help you understand the different types of intellectual property: Copyright, Patents, Trademarks, and Trade Secrets. Then the process and benefits of obtaining a patent
This presentation is intended to help you understand the different types of intellectual property: Copyright, Patents, Trademarks, and Trade Secrets. Then the process and benefits of obtaining a patent
The Ways We ve been Measuring Patent Scope are Wrong: How to Measure and Draw Causal Inferences with Patent Scope 1
 The Ways We ve been Measuring Patent Scope are Wrong: How to Measure and Draw Causal Inferences with Patent Scope 1 Jeffrey M. Kuhn UNC Chapel Hill Kenan-Flagler Business School Neil C. Thompson MIT Sloan
Preservation Costs Survey. Summary of Findings
 Preservation Costs Survey Summary of Findings prepared for Civil Justice Reform Group William H.J. Hubbard, J.D., Ph.D. Assistant Professor of Law University of Chicago Law School February 18, 2014 Preservation
More of the same or something different? Technological originality and novelty in public procurement-related patents
 More of the same or something different? Technological originality and novelty in public procurement-related patents EPIP Conference, September 2nd-3rd 2015 Intro In this work I aim at assessing the degree
Economics Bulletin, 2014, Vol. 34 No. 2 pp
 1. Introduction Social networks have become an important instrument people use on a daily basis for communication, information, education and entertainment. Students, often considered the most advanced
Introduction. Article 50 million: an estimate of the number of scholarly articles in existence RESEARCH ARTICLE
 Article 50 million: an estimate of the number of scholarly articles in existence Arif E. Jinha 258 Arif E. Jinha Learned Publishing, 23:258 263 doi:10.1087/20100308 Arif E. Jinha Introduction From the
Glasgow School of Art
 Glasgow School of Art Equal Pay Review April 2015 1 P a g e 1 Introduction The Glasgow School of Art (GSA) supports the principle of equal pay for work of equal value and recognises that the School should
Why do Inventors Reference Papers and Patents in their Patent Applications?
 Rowan University Rowan Digital Works Faculty Scholarship for the College of Science & Mathematics College of Science & Mathematics 2010 Why do Inventors Reference Papers and Patents in their Patent Applications?
Does Scientific Innovation Lead to Entrepreneurship? A Comparison of Academic and Industry Sectors
 Does Scientific Innovation Lead to Entrepreneurship? A Comparison of Academic and Industry Sectors Donna K. Ginther Associate Professor Department of Economics University of Kansas Lawrence, KS 66045 Email:
An Intellectual Property Whitepaper by Katy Wood of Minesoft in association with Kogan Page
 An Intellectual Property Whitepaper by Katy Wood of Minesoft in association with Kogan Page www.minesoft.com Competitive intelligence 3.3 Katy Wood at Minesoft reviews the techniques and tools for transforming
How does Basic Research Promote the Innovation for Patented Invention: a Measuring of NPC and Technology Coupling
 International Conference on Management Science and Management Innovation (MSMI 2015) How does Basic Research Promote the Innovation for Patented Invention: a Measuring of NPC and Technology Coupling Jie
Estimation Methodology and General Results for the Census 2000 A.C.E. Revision II Richard Griffin U.S. Census Bureau, Washington, DC 20233
 Estimation Methodology and General Results for the Census 2000 A.C.E. Revision II Richard Griffin U.S. Census Bureau, Washington, DC 20233 1. Introduction 1 The Accuracy and Coverage Evaluation (A.C.E.)
Empirical Research on Invalidation Request of Invention Patent Infringement Cases in Shanghai
 2nd International Conference on Management Science and Innovative Education (MSIE 2016) Empirical Research on Invalidation Request of Invention Patent Infringement Cases in Shanghai Xiaojie Jing1, a, Xianwei
Business Method Patents, Innovation, and Policy
 Business Method Patents, Innovation, and Policy Bronwyn H. Hall UC Berkeley, NBER, IFS, Scuola Sant Anna Anna, and TSP International Outline (paper, not talk) What is a business method patent? Patents
Task Specific Human Capital
 Task Specific Human Capital Christopher Taber Department of Economics University of Wisconsin-Madison March 10, 2014 Outline Poletaev and Robinson Gathmann and Schoenberg Poletaev and Robinson Human Capital
Patents: Who uses them, for what and what are they worth?
 Patents: Who uses them, for what and what are they worth? Ashish Arora Heinz School Carnegie Mellon University Major theme: conflicting evidence Value of patents Received wisdom in economics and management
Panel Study of Income Dynamics: Mortality File Documentation. Release 1. Survey Research Center
 Panel Study of Income Dynamics: 1968-2015 Mortality File Documentation Release 1 Survey Research Center Institute for Social Research The University of Michigan Ann Arbor, Michigan December, 2016 The 1968-2015
Innovation and Collaboration Patterns between Research Establishments
 RIETI Discussion Paper Series 15-E-049 Innovation and Collaboration Patterns between Research Establishments INOUE Hiroyasu University of Hyogo NAKAJIMA Kentaro Tohoku University SAITO Yukiko Umeno RIETI
ENTREPRENEURSHIP & ACCELERATION
 ENTREPRENEURSHIP & ACCELERATION Questions from the Field Intellectual Property March 2017 Photo by John-Michael Mass/Darby Communications In our work, we see that science and technology-based startups
Intellectual Property
 What is Intellectual Property? Intellectual Property Introduction to patenting and technology protection Jim Baker, Ph.D. Registered Patent Agent Director Office of Intellectual property can be defined
Business Method Patents, Innovation, and Policy. Bronwyn H. Hall UC Berkeley and NBER
 Business Method Patents, Innovation, and Policy Bronwyn H. Hall UC Berkeley and NBER Outline What is a business method patent? Patents and innovation Patent quality Survey of policy recommendations The
Social returns to direct private innovation support: the patent system
 Social returns to direct private innovation support: the patent system Bhaven N Sampat (Columbia University and NBER) 12/15/16 Senate Judiciary Study #1 (December 20, 1956) Senate Judiciary Study #1 (December
Are large firms withdrawing from investing in science?
 Are large firms withdrawing from investing in science? By Ashish Arora, 1 Sharon Belenzon, and Andrea Patacconi 2 Basic research in science and engineering is a fundamental driver of technological and
Cognitive Distances in Prior Art Search by the Triadic Patent Offices: Empirical Evidence from International Search Reports
 Cognitive Distances in Prior Art Search by the Triadic Patent Offices: Empirical Evidence from International Search Reports Tetsuo Wada tetsuo.wada@gakushuin.ac.jp Gakushuin University, Faculty of Economics,
Under the Patronage of His Highness Sayyid Faisal bin Ali Al Said Minister for National Heritage and Culture
 ORIGINAL: English DATE: February 1999 E SULTANATE OF OMAN WORLD INTELLECTUAL PROPERTY ORGANIZATION Under the Patronage of His Highness Sayyid Faisal bin Ali Al Said Minister for National Heritage and Culture
Labor Mobility of Scientists, Technological Diffusion, and the Firm's Patenting Decision*
 Labor Mobility of Scientists, Technological Diffusion, and the Firm's Patenting Decision* Jinyoung Kim University at Buffalo, State University of New York Gerald Marschke University at Albany, State University
NBER WORKING PAPER SERIES
 NBER WORKING PAPER SERIES IS THE TIME ALLOCATED TO REVIEW PATENT APPLICATIONS INDUCING EXAMINERS TO GRANT INVALID PATENTS?: EVIDENCE FROM MICRO-LEVEL APPLICATION DATA Michael D. Frakes Melissa F. Wasserman
Empirical Scholarship on the Prosecution Process at the PTO. Michael Frakes and Melissa F. Wasserman
 Empirical Scholarship on the Prosecution Process at the PTO Michael Frakes and Melissa F. Wasserman I. Introduction Recent years have seen a surge in interest in intellectual property rights, in particular
Bioengineers as Patent Attorneys: Analysis of Bioengineer Involvement in the Patent Writing Process
 Bioengineers as Patent Attorneys: Analysis of Bioengineer Involvement in the Patent Writing Process Jacob Fisher, Bioengineering, University of California, Berkeley Abstract: This research focuses on the
Information Constraint of the Patent Office and Examination Quality: Evidence from the effects of initiation lags
 RIETI Discussion Paper Series 17-E-040 Information Constraint of the Patent Office and Examination Quality: Evidence from the effects of initiation lags NAGAOKA Sadao RIETI YAMAUCHI Isamu RIETI The Research
How Does Hedge Fund Activism Reshape Corporate Innovation?
 How Does Hedge Fund Activism Reshape Corporate Innovation? Alon Brav, Duke University Wei Jiang, Columbia University Song Ma, Yale University Xuan Tian, Indiana University December 2016 What the existing
The influence of the amount of inventors on patent quality
 April 2017 The influence of the amount of inventors on patent quality Dierk-Oliver Kiehne Benjamin Krill Introduction When measuring patent quality, different indicators are taken into account. An indicator
The Impact of the Breadth of Patent Protection and the Japanese University Patents
 The Impact of the Breadth of Patent Protection and the Japanese University Patents Kallaya Tantiyaswasdikul Abstract This paper explores the impact of the breadth of patent protection on the Japanese university
Standards as a knowledge source for R&D: A first look at their characteristics based on inventor survey and patent bibliographic data
 Standards as a knowledge source for R&D: A first look at their characteristics based on inventor survey and patent bibliographic data Research Institute of Economy, Trade and Industry (RIETI) Naotoshi
Slide 15 The "social contract" implicit in the patent system
 Slide 15 The "social contract" implicit in the patent system Patents are sometimes considered as a contract between the inventor and society. The inventor is interested in benefiting (personally) from
The impact of Big Data on an Intellectual Property Literacy training program
 The impact of Big Data on an Intellectual Property Literacy training program Janis Tyhurst King Abdullah University of Science and Technology Library Thuwal, Saudi Arabia Big Data is increasingly being
Outline. Patents as indicators. Economic research on patents. What are patent citations? Two types of data. Measuring the returns to innovation (2)
") Measuring the returns to innovation (2) Prof. Bronwyn H. Hall Globelics Academy May 26/27 25 Outline This morning 1. Overview measuring the returns to innovation 2. Measuring the returns to R&D using productivity
Measuring the returns to innovation (2) Prof. Bronwyn H. Hall Globelics Academy May 26/27 25 Outline This morning 1. Overview measuring the returns to innovation 2. Measuring the returns to R&D using productivity
Chapter 3 WORLDWIDE PATENTING ACTIVITY
 Chapter 3 WORLDWIDE PATENTING ACTIVITY Patent activity is recognized throughout the world as an indicator of innovation. This chapter examines worldwide patent activities in terms of patent applications
Incentive System for Inventors
 Incentive System for Inventors Company Logo @ Hideo Owan Graduate School of International Management Aoyama Gakuin University Motivation Understanding what motivate inventors is important. Economists predict
ESP 171 Urban and Regional Planning. Demographic Report. Due Tuesday, 5/10 at noon
 ESP 171 Urban and Regional Planning Demographic Report Due Tuesday, 5/10 at noon Purpose The starting point for planning is an assessment of current conditions the answer to the question where are we now.
The Influence of Patent Rights on Academic Entrepreneurship
 The Influence of Patent Rights on Academic Entrepreneurship Andrew A. Toole Economic Research Service, USDA Coauthors: Dirk Czarnitzki, KU Leuven & ZEW Mannheim Thorsten Doherr, ZEW Mannheim Katrin Hussinger,
Patents as Indicators
 Patents as Indicators Prof. Bronwyn H. Hall University of California at Berkeley and NBER Outline Overview Measures of innovation value Measures of knowledge flows October 2004 Patents as Indicators 2
18 The Impact of Revisions of the Patent System on Innovation in the Pharmaceutical Industry (*)
") 18 The Impact of Revisions of the Patent System on Innovation in the Pharmaceutical Industry (*) Research Fellow: Kenta Kosaka In the pharmaceutical industry, the development of new drugs not only requires
18 The Impact of Revisions of the Patent System on Innovation in the Pharmaceutical Industry (*) Research Fellow: Kenta Kosaka In the pharmaceutical industry, the development of new drugs not only requires
Manager Characteristics and Firm Performance
 RIETI Discussion Paper Series 18-E-060 Manager Characteristics and Firm Performance KODAMA Naomi RIETI Huiyu LI Federal Reserve Bank of SF The Research Institute of Economy, Trade and Industry https://www.rieti.go.jp/en/
Appendix A1: Example of patent citations
 Appendix A1: Example of patent citations In this appendix we compare a citing patent application with one patent cited with a citation categorized as X (X-cited) and one patent cited with a citation categorized
Chapter 6: Finding and Working with Professionals
 Chapter 6: Finding and Working with Professionals Christopher D. Clark, Associate Professor, Department of Agricultural Economics Jane Howell Starnes, Research Associate, Department of Agricultural Economics
THE IMPLICATIONS OF THE KNOWLEDGE-BASED ECONOMY FOR FUTURE SCIENCE AND TECHNOLOGY POLICIES
 General Distribution OCDE/GD(95)136 THE IMPLICATIONS OF THE KNOWLEDGE-BASED ECONOMY FOR FUTURE SCIENCE AND TECHNOLOGY POLICIES 26411 ORGANISATION FOR ECONOMIC CO-OPERATION AND DEVELOPMENT Paris 1995 Document
Patent Examiner Specialization
 Patent Examiner Specialization Cesare Righi 1 and Timothy Simcoe 2 1 Boston University 2 Boston University and NBER September 29, 2017 Abstract We study the matching of patent applications to examiners
Standards as a Knowledge Source for R&D:
 RIETI Discussion Paper Series 11-E-018 Standards as a Knowledge Source for R&D: A first look at their incidence and impacts based on the inventor survey and patent bibliographic data TSUKADA Naotoshi Hitotsubashi
Weighted deductions for in-house R&D: Does it benefit small and medium firms more?
 No. WP/16/01 Weighted deductions for in-house R&D: Does it benefit small and medium firms more? Sunil Mani 1, Janak Nabar 2 and Madhav S. Aney 3 1 Visiting Professor, National Graduate Institute for Policy
Southern Africa Labour and Development Research Unit
 Southern Africa Labour and Development Research Unit Sampling methodology and field work changes in the october household surveys and labour force surveys by Andrew Kerr and Martin Wittenberg Working Paper
The effect of patent protection on the timing of alliance entry
 The effect of patent protection on the timing of alliance entry Simon Wakeman Assistant Professor, European School of Management & Technology Email: wakeman@esmt.org. This paper analyzes how a start-up
Patent Trends among Small and Large Innovative Firms during the Recession
 Rowan University Rowan Digital Works Faculty Scholarship for the College of Science & Mathematics College of Science & Mathematics 5-213 Patent Trends among Small and Large Innovative Firms during the
OIM Squared, Inc. - Patent Portfolio Report
 OIM Squared, Inc. - Patent Portfolio Report This report is derived from third party sources. All Bidder Due Diligence shall be done in advance of the auction and shall be the sole responsibility of the
Impact Indicators and Research Strategy: A Pilot Effort
 Impact Indicators and Research Strategy: A Pilot Effort Susan E. Cozzens OST, Paris, May 2012 Technology Policy and Assessment Center An applications-oriented presentation Small project done for client
DETERMINANTS OF STATE ECONOMIC GROWTH: COMPLEMENTARY RELATIONSHIPS BETWEEN R&D AND HUMAN CAPITAL
 DETERMINANTS OF STATE ECONOMIC GROWTH: COMPLEMENTARY RELATIONSHIPS BETWEEN R&D AND HUMAN CAPITAL Catherine Noyes, Randolph-Macon David Brat, Randolph-Macon ABSTRACT According to a recent Cleveland Federal
INTELLECTUAL PROPERTY (IP) SME SCOREBOARD 2016
 SME SCOREBOARD 2016") www.euipo.europa.eu INTELLECTUAL PROPERTY (IP) SME SCOREBOARD 2016 Executive Summary JUNE 2016 www.euipo.europa.eu INTELLECTUAL PROPERTY (IP) SME SCOREBOARD 2016 Commissioned to GfK Belgium by the European
www.euipo.europa.eu INTELLECTUAL PROPERTY (IP) SME SCOREBOARD 2016 Executive Summary JUNE 2016 www.euipo.europa.eu INTELLECTUAL PROPERTY (IP) SME SCOREBOARD 2016 Commissioned to GfK Belgium by the European
Crafting Intellectual Property Rights: Implications for Patent Assertion Entities, Litigation, and Innovation *
 Crafting Intellectual Property Rights: Implications for Patent Assertion Entities, Litigation, and Innovation * Josh Feng, Harvard University Xavier Jaravel, London School of Economics December 29, 2017
Using Administrative Records for Imputation in the Decennial Census 1
 Using Administrative Records for Imputation in the Decennial Census 1 James Farber, Deborah Wagner, and Dean Resnick U.S. Census Bureau James Farber, U.S. Census Bureau, Washington, DC 20233-9200 Keywords:
Gender Pay Gap Inquiry. The Royal Society of Edinburgh
 Gender Pay Gap Inquiry The Royal Society of Edinburgh Summary The Gender Pay Gap is a persistent factor in the Scottish economy, as it is in all major advanced economies Over the past decades there has
GENDER PAY GAP REPORT Gender Pay Report
 1 Gender Pay Report 2016-2017 2 INTRODUCTION John Hardie Chief Executive We re proud to be a diverse and inclusive place to work. We strive to be a place where all of our people can flourish, irrespective
Patent portfolio audits. Cost-effective IP management. Vashe Kanesarajah Manager, Europe & Asia Clarivate Analytics
 Patent portfolio audits Cost-effective IP management Vashe Kanesarajah Manager, Europe & Asia Clarivate Analytics Clarivate Analytics Patent portfolio audits 3 Introduction The world today is in a state
THE JOHN MARSHALL REVIEW OF INTELLECTUAL PROPERTY LAW
 THE JOHN MARSHALL REVIEW OF INTELLECTUAL PROPERTY LAW PUTTING YOURSELF IN THE SHOES OF A PATENT EXAMINER: OVERVIEW OF THE UNITED STATES PATENT AND TRADEMARK OFFICE (USPTO) PATENT EXAMINER PRODUCTION (COUNT)
Figure 1-1 The Female Presence in R&D. Response to consumption by women Boosting of innovation through greater diversity To achieve this
 No.257-1 (Apr 18, 16) Greater Female Presence Means Better Corporate Performance How Patents Reveal the Contribution of Diversity to Economic Value 1. Verifying the Relationship between Women s Participation
Gender Pay Gap Report - Overview
 GENDER PAY GAP REPORT 2018 1 Gender Pay Gap Report - Overview As an employer with more than 250 staff, Care Visions Group Limited is required to undertake Gender Pay Gap Reporting as required by the Equality
How Many Imputations are Really Needed? Some Practical Clarifications of Multiple Imputation Theory
 Prev Sci (2007) 8:206 213 DOI 10.1007/s11121-007-0070-9 How Many Imputations are Really Needed? Some Practical Clarifications of Multiple Imputation Theory John W. Graham & Allison E. Olchowski & Tamika
Patent Examiner Specialization
 Patent Examiner Specialization Cesare Righi 1 and Timothy Simcoe 2 1 Boston University 2 Boston University and NBER March 20, 2017 Abstract We study the matching of patent applications to examiners at
DO INVENTORS VALUE SECRECY IN PATENTING? EVIDENCE FROM THE AMERICAN INVENTOR S PROTECTION ACT OF 1999
 DO INVENTORS VALUE SECRECY IN PATENTING? EVIDENCE FROM THE AMERICAN INVENTOR S PROTECTION ACT OF 1999 Stuart Graham (Georgia Tech and USPTO) Deepak Hegde (New York University and USPTO) 5th annual Workshop
NBER WORKING PAPER SERIES THE MEANING OF PATENT CITATIONS: REPORT ON THE NBER/CASE-WESTERN RESERVE SURVEY OF PATENTEES
 NBER WORKING PAPER SERIES THE MEANING OF PATENT CITATIONS: REPORT ON THE NBER/CASE-WESTERN RESERVE SURVEY OF PATENTEES Adam B. Jaffe Manuel Trajtenberg Michael S. Fogarty Working Paper 7631 http://www.nber.org/papers/w7631
Discussion: Does Scientific Innovation Lead to Academic Entrepreneurship?
 Discussion: Does Scientific Innovation Lead to Academic Entrepreneurship? Andrew A. Toole Deputy Chief Economist, US Patent and Trademark Office Research Associate, ZEW, Mannheim, Germany Labor Market