Timber/Glass Adhesive Bonds
|
|
|
- Lorin Ward
- 5 years ago
- Views:
Transcription
1 Available from School of Engineering Linnæus University Louise Blyberg, Erik Serrano, Bertil Enquist and Magdalena Sterley Timber/Glass Adhesive Bonds 2010 Timber/Glass Adhesive Bonds Experimental testing and evaluation methods Louise Blyberg, Erik Serrano, Bertil Enquist and Magdalena Sterley School of Engineering Report No 2, 2010 ISBN:


2 Timber/Glass Adhesive Bonds Experimental testing and evaluation methods Louise Blyberg, Erik Serrano, Bertil Enquist and Magdalena Sterley September 2010
3
4 PREFACE The research described in this report was performed within a research project entitled Glass and Timber Innovative Building Components with Added-Value (In Swedish: Glas och trä i samverkan Innovativa byggprodukter med mervärde ). The research project is coordinated by Glafo Glass Research Institute, and is subdivided into three main work packages dealing with mechanical behaviour of glass/timber composites (partly reported here), with energy and life cycle issues of the glass/timber components and with architectural aspects on the use of glass/timber composites in load bearing structures. The research project is partly financed by European Social Funds (Regional Structural funds for Småland and islands) through the Swedish Agency for Economic and Regional Growth (Tillväxtverket). In addition, financing is provided by Linnaeus University, Glafo AB and Lund University. The support from these organisations is gratefully acknowledged.
5
6 ABSTRACT Both timber and glass are materials that have aesthetically pleasing properties. An appealing idea is to combine them to overcome the drawbacks and utilise the beneficial mechanical properties. Adhesive bonding with an appropriate adhesive could provide a uniform stress distribution at the transition between the materials. This report presents a study of three different adhesives, silicone, acrylate and polyurethane. Intentionally, adhesives with a wide range of properties were chosen. The adhesive bonds between timber and glass were tested both in tension and in shear with rather small bonds, 800 mm 2. Special fixtures were designed both for gluing and testing of the adhesive bond specimens studied. The results presented include a traditional study of strength, failure type and relative displacement measured with LVDT s, but also an extended study with a non-contact optical 3D-deformation measuring system and finite element modelling. Of the adhesives tested, the acrylate (SikaFast 5215) performed best, both in tension and shear. The mean strength obtained for this adhesive was 3.0 MPa in tension and 4.5 MPa in shear. Even if an important factor when gluing glass is the load distribution ability, the flexible silicone adhesive has too low stiffness and strength for use in structural components, where structural refers to the ability of a component to carry loads other than its own weight.
7
8 TABLE OF CONTENTS 1 Introduction Project background and previous work Aim and scope Outline Materials and Methods Specimen preparation Testing and measuring methods Modelling Results Results for the tensile specimens Results for the shear specimens Results for solid wood Modelling varying properties across annual rings Concluding Discussion Summary Possibilities and difficulties with optical measuring Further studies References A Test Details... i A.1 Tensile tests... i A.2 Shear tests... iii B All Specimens Included... iii B.1 Tensile tests...iv B.2 Shear tests...vii B.3 Solid wood tests...x C Fracture Categories...xi
9
10 1 INTRODUCTION 1.1 Project background and previous work This report is a result of work performed within a project dealing with the combination of timber and glass in structural building components. The official name of the project is Glas och trä i samverkan - innovativa byggprodukter med mervärde. It has financing from the European Union s structural fund for regional development, managed by Tillväxtverket. The idea in the project is that the main method for combining timber and glass is by gluing, thus an important part of the project is to find an adhesive that is suited for this task. There are quite a few examples where glass is used in structures even in load carrying elements. Studies where other materials are added as reinforcement and a way to build in a redundancy in the member can be found for steel (Louter, 2007), (Nielsen and Olesen, 2007) and for wood (Kreher, 2006). The number of existing studies on timber-glass composites is limited, but an important characteristic property apparent in many of the studies is the redundancy which can be built into the element, glass failure does not necessarily lead to a catastrophic failure of the entire element. Another possible concept, noted by Kreher (2006), is to use wood as load introducing material at supports and at joints between components. If the aim of the timber-glass component design is to go beyond the redundancy role of the wood and have the materials work together to carry the load, one faces the difficulty of combining two materials with a large difference in stiffness. Since glass is about 6 times stiffer than wood (parallel to grain), the load is bound to be carried mostly by the glass if not a highly imaginative design can be implemented. Traditionally, wood adhesives rely to some extent on penetration of the adhesive into the fibre structure of the wood. The adhesives studied here, except for the polyurethane adhesive are mainly for gluing materials such as glass and metals and their main focus is not the ability to penetrate wood fibres, but the ability of wetting the adherend surface, which is more easily done with metals and glass. An adhesive bond must also be able to handle moisture induced deformation in the wood without enforcing too much strain on the glass. 3
11 1.2 Aim and scope This report presents a study of adhesive bonds between wood and glass. The aim is to analyse some adhesive types which possibly could be used for gluing wood and glass in load-carrying structures. Three different adhesives were included; a deformable silicone adhesive with a thick bond line, a stiff polyurethane adhesive with a thin bond line and an acrylate adhesive with properties in between the other two. By choosing adhesives with a wide range of properties, the span of possibilities is in some sense included, although there are in principle infinitely variations and an optimised combination of properties require a lot more research. Properties that affect the load-bearing capacity of a bond-line are cohesive strength of the adhesive, adhesive strength to wood, adhesive strength to glass, deformation capacity and load distribution ability. Other important properties are resistance to UV-light and moisture and long-term capacity, but these are not considered in this study. Another purpose of the presented study was to establish appropriate test methods for testing both tension perpendicular to grain and shear. Further, appropriate methods for evaluating the tests are required. The study also includes three different methods for measuring the displacement across the adhesive bond. Measures from piston movement, LVDT sensors and noncontact optical measuring, and with that, measures at different distances from the adhesive bond are presented. Results from both tests and calculation models are included. The main purpose of the calculations is to deepen the understanding of the test results. The specimens had a bond area of mm 2 and were studied both in tension and shear. 1.3 Outline Chapter 2 gives a detailed description of the materials and methods used; including specimen preparation, testing and measuring methods and the calculation models. The results are presented in Chapter 3, where Chapter 3.1 deals with the tensile specimens and Chapter 3.2 with the shear specimens. Two additional studies are included in Chapter 3.3 and 3.4, of which the first contains some results from solid wood of the same quality as was used for the adhesive bond specimens and the latter a simplified calculation model of varying stiffness across the annual rings. Chapter 4 is the concluding discussion and the Appendix contains detailed test results (not only the mean value curve but also the curves from all specimens), a more detailed description of the fracture characterisation and a few additional details. 4
12 2 MATERIALS AND METHODS 2.1 Specimen preparation Three different adhesives were included in the study; silicone, acrylate and polyurethane. The first two adhesives were provided by Sika Sverige AB. Intentionally, adhesives with a wide range of properties were chosen. The adhesive bonds were tested both in tension and in shear. For each adhesive, 15 specimens were included for tension and shear, respectively. In each of the resulting six groups, the specimens are numbered from 01 to 15. A preliminary test with some specimens showed that the wood can be weaker than the adhesive bond in tension. Therefore, the tensile specimens were reinforced Pre-assembly treatment and materials Sikasil SG-20 is a one-component silicone sealant. The adhesive is moisturecuring and it is UV resistant. One of the main applications of this adhesive is structural glazing (Sika Schweiz AG, 2009). According to the product data sheet the tensile strength is approximately 2.2 MPa and the elongation at break approximately 450 %. SikaFast 5215 is a two-component adhesive based on ADP-technology (acrylic double performance) and cures by polymerisation. The adhesive is designed to substitute mechanical fastening techniques in structural and semi-structural bonding. According to the product data sheet (Sika Schweiz AG, 2003); the tensile strength is approximately 10 MPa, the elongation at break approximately 150 % and the glass transition temperature approximately 52 C. In the data sheet it is also noted that the mechanical properties are temperature dependent. Prefere 6000 is a one-component polyurethane adhesive approved for load-carrying timber structures, including glued laminated timber. The recommended maximum thickness of the adhesive bond is 0.3 mm. Since the nominal pressure in the gluing of the polyurethane specimens was 1 MPa, thus the bond thickness was not the decisive parameter. Float glass, according to the European standard EN-572, with a thickness of 10 mm was delivered from Pilkington Floatglas AB. The glass was glued on the air-side; the air- and tin-side were distinguished in ultraviolet light. For the silicone and acrylate adhesive, the glass was cleaned with the recommended surface preparation agent, Sika Aktivator and Sika ADPrep for the silicone and acrylate adhesive, respectively. For the polyurethane 5
13 adhesive, the glass was cleaned with ethanol. Teflon tape was used on the glass to mask off areas that should not be glued. The wood used was spruce with a mean dry-green density of ρ 0.14 = 385 kg/m 3 (ratio of mass of dry material and volume at a moisture content of 14 %). It was planed and sawn the same day as the specimens were glued. The wood was oriented so that the surface glued had its normal in the tangential direction of the annual rings. This surface is sometimes referred to as a radial surface. Since the stiffness of glass is several times higher than the one of wood, the thickness of the wood in the shear specimen was 20 mm, while that of the glass was 10 mm. To correspond to the stiffness difference, the wood should have had an even larger thickness. It was judged that the entire thickness would not be contributory anyway, i.e. a larger thickness of the wood would not have the desired effect. The dimensions of the tensile and the shear specimen are shown in Figure 2-1. Whenever a coordinate system is referred to, it is the one shown in this figure. (mm) (mm) Figure 2-1. Specimen dimensions. The thickness of the adhesive bond between glass and wood is not shown in the figures Assembling The adhesive was applied manually on the piece of wood. The wood, with the adhesive on, and the glass were then pressed together in a press. A fixture was designed for gluing the specimens studied in this report. It was made for gluing five specimens simultaneously and is modifiable, which enables gluing of both tensile and shear specimens and also controlling the different thicknesses of the different adhesives. Figure 2-2 shows a sketch of the fixture in the setup for gluing tensile specimens. The distance blocks, shown in the figure, are made in two different thicknesses to control the thickness of the silicone and acrylate adhesive bond. For polyurethane specimens, a pressure corresponding to 1 MPa across the nominal areas of the adhesive bonds was applied. 6

14 Distance blocks Figure 2-2. Fixture for specimen preparation. Since the decisive parameter for silicone and acrylate is the bond thickness, while for polyurethane it is the applied pressure, the characteristics of the gluing fixture differ between these two groups. Among the limitations of the gluing fixture is the requirement of exact measures of wood and glass pieces; if the measures are slightly larger than the nominal measure, the pieces do not fit into the fixture. Furthermore, a deviation in height of wood pieces or thickness of glass pieces affects the resulting adhesive bond thickness for silicone and acrylate specimens, while for polyurethane specimens, a height difference within the five specimens glued at the same time results in higher pressure on the larger specimens and lower pressure on the smaller specimens. For silicone and acrylate specimens, another possible drawback of the fixture is that nothing except the resistance of the non-cured adhesive prevents the glass pieces from tilting, which would result in a sloped glass and an adhesive bond that is thinner on one side Post-assembly treatment and reinforcement material The silicone, acrylate and polyurethane specimens were left in the fixture with the applied pressure for at least 20, 1 and 3 hours, respectively. No specimen was tested within a week after the gluing. During storage, the specimens were kept at a climate of approximately 20 C and 60 % RH. Excessive adhesive was removed, if possible in the fixture before the adhesive had cured, otherwise with a knife or a small saw after it had cured. For the reinforcement of the tensile specimens, glass fibre fabric with a density of 165 g/m 2 was applied with epoxy on the long sides. To minimise the effect of the reinforcement on the adhesive bond, the four millimetres closest to the bond were left untreated. The short sides were also covered by epoxy, but no fabric was applied. 7
.")


 if failure of the silicone is taken to be at the displacement where the stiffness")
15 2.2 Testing and measuring methods Testing methods The machine used was of type MTS (100 kn capacity). One testing fixture for each of the two types of tests was used (Figure 2-3). Both fixtures have hinged steel bars at the ends and these were held by the hydraulic grips of the machine. The fixture for the tensile specimens consists of one upper part where the glass is placed and a lower part which is screwed to hold on to the wood. Thus the lower part of the fixture caused some compression of the wood. For the shear specimens, the fixture also consists of an upper and a lower part, both based on the same principle, but with different measures due to the thickness difference between the wood and the glass. The position of the hinged bars can be adjusted to fit the bond thickness so that the load, at least initially, acts along the centreline of the adhesive. Thus, the undeformed setup implies that the resulting force is along the mid plane of the adhesive. This is illustrated in the free body diagram in Figure 2-4. Table 2-1 shows the loading rates that were used for the different adhesives. With these rates, the time to failure became approximately one minute for all adhesives in the tension tests (cf. Figure 3-6) if failure of the silicone is taken to be at the displacement where the stiffness has decreased significantly. The same loading rates were used for the shear tests in spite of the differences in time to failure that then appeared. Tensile test Shear test d LVDT d LVDT Figure 2-3. Setups for tensile and shear testing of glass/wood adhesive bonds.the relative displacements were measured with the LVDT s over the distance denoted dlvdt. 8
16 Figure 2-4. The principle of the shear test fixture, which implies that the resulting force, in the undeformed state, is along the mid plane of the adhesive. Table 2-1. Displacement rates used in the tests. Adhesive Rate Exception Silicone 1.00 mm/min Acrylate 0.50 mm/min Shear test, specimen 01, rate: 0.25 mm/min Polyurethane 0.25 mm/min Measuring methods As mentioned in the introduction chapter, the displacement is measured with three different methods. For all specimens, the displacement is measured with the MTS-machine as piston movement. The displacement is also measured with LVDT sensors, which measure the displacements closer to the adhesive bond and therefore include less deformation of materials outside the adhesive bond. The third displacement measuring method is by a non-contact optical 3D-deformation measuring system, Aramis. Aramis was only used on some (between three and eight) specimens for each adhesive and type of test. The results obtained from Aramis are not presented for all specimens, instead three specimens from each adhesive and type of test were chosen. The choice of specimens was based on which specimens that had a piston movement versus load curve most similar to the mean curve of all specimens at a moderate load level. The cameras require an unobstructed view, thus it is not possible to use LVDT sensors on both sides for the specimens studied with Aramis, but for the other specimens (seven to twelve per adhesive and type of test), one LVDT sensor was 9
17 placed on each side of the specimen and the mean value of the two sensors was used for the evaluations. Data from the MTS machine and LVDT sensors were sampled every second, while Aramis data was sampled every third second. This resulted in rather few data points from the tensile tests, which, in combination with a noisy load signal fed into the Aramis system, gave a poor precision of the load level for the data from Aramis. By applying amplification to the load signal, the noise appears to be reduced. To see this, compare the load oscillations in Figure B-3 and Figure B-6 to the amplification factors found in Table A-1 and Table A-2. In the tests performed here, the main amplification factor used was five. When using the Aramis system, a grey-scale random pattern is sprayed on one side of the specimen and with two cameras, a sequence of digital photographs are taken during the test. These pictures are then processed to obtain a displacement field of the specimen. The strain is computed from the displacements of k k measuring points. Here the default value k = 3 was used and the strain was thus averaged across the boundary between adherends and adhesive, except for the polyurethane specimens where the adhesive bond line was excluded from the processing. The calibration volume used for the cameras was mainly mm 3 for the tensile specimens and mm 3 for the shear specimens with a few exceptions (see Table A-1 and Table A-2). With Aramis, evaluation points can be chosen, in principle, arbitrarily close to the adhesive bond. The relative displacement from Aramis was measured between two points located at the middle of the bond length and one mm into the wood and glass, respectively, for both the tensile and the shear specimens. For the tensile specimens, the LVDT sensors were attached to the upper part of the testing fixture and measured the relative displacement to a steel plate attached to the wood, 25 mm below the glass surface. For the shear specimens, the LVDT sensors were attached to the upper part of the testing fixture and measured the relative displacement to the lower part of the testing fixture. These distances are shown in Figure 2-3 where they are denoted d LVDT. 2.3 Modelling Calculation models of the two different test methods and three different adhesive bonds are included in this study. Abaqus was used for this modelling. The purpose of the calculations was to deepen the understanding of the test results, to check how reasonable the, on beforehand, estimated material parameters for the adhesives are and find better values if the correspondence was insufficient. The models do not consider possible slip between the adherends and the adhesive, plasticity or any (other) type of material failure. Thus the models are only able to predict the specimen behaviour at moderate load lev- 10
18 els, before any of these phenomena become decisive. Further, the reinforcement used on the tensile specimens was neglected in the calculations. The material parameters used for wood in these calculations are presented in Table 2-2 and Table 2-3. For glass as well as for the polyurethane and acrylate adhesive, linear elastic material models were used. Table 2-4 lists these material parameters. The second alternative for the acrylate adhesive is based on what is found to be reasonable by (de Castro, 2005). For the silicone adhesive, based on the results obtained by (Larsson, 2008), a hyper-elastic incompressible material with a Neo-Hooke model 3 with C 10 = N/m 2 was used. This material parameter corresponds to a six times larger initial stiffness, i.e. E 0 = MPa, and since the material is incompressible, υ = Table 2-2. Material parameters used in modelling of wood in two-dimensional models. Quantity Value E l MPa E rt 400 MPa υ l, rt MPa G l,rt Table 2-3. Material parameters used in modelling of wood in three-dimensional models. Quantity Value E l MPa E r, E t 400 MPa υ r, t 0.7 υ r, l, υ t, l 1/60 G l,r, G l,t 750 MPa 75 MPa G r,t Table 2-4. Material parameters used in modelling of isotropic linear elastic materials. Material E (MPa) υ Glass Acrylate main alt Acrylate alt Polyurethane In Chapter it is described how the strain field is computed in Aramis. Note that the procedure used for extracting results from Aramis implies that for the acrylate and silicone adhesive, the strain is averaged across the boundary between adherends and adhesive. In the strain plots from the calculations (presented in Chapter 3.1 and 3.2) the strain is not averaged across this boundary. 11
19 2.3.1 Tensile specimen specifics Due to the large Poisson s ratio of the silicone adhesive and of the second alternative for the acrylate adhesive, these adhesive models have a small or no volumetric change, which results in a larger stiffness to tension perpendicular to the adhesive plane since the wood and glass restrict contraction of the adhesive. Therefore, three-dimensional models were used for the tensile specimens. Since the tensile specimen is symmetric with respect to both the x - and the z -plane, only one quarter of the geometry is modelled. The upper part of the fixture is modelled by constraining the motion of the loaded surface to a reference node, where the load is applied. The lower part of the tensile testing fixture is modelled by locking the y -displacement of the surface, thus neither compression of the wood nor any sliding between wood and the fixture is considered. For the silicone and acrylate adhesive, submodelling was used to obtain more detailed strain plots than what is possible when a uniform element size throughout the entire model is used. In the submodelling, calculations are first performed on a global model of the entire modelled geometry, then a subgeometry is chosen and a denser mesh can be applied to this submodel. The submodel is then driven by the global model. In the choices made in this study, the driving region was identified automatically from the global model. The driving variable used was displacements, i.e. the nodal displacements from the global model are interpolated onto the submodel nodes. This, so called node-based submodelling, is preferred to the alternative, surface-based modelling, when the output wanted is the displacement field rather than the stress field and the stiffnesses of the sub- and global model are comparable.(abaqus user s manual, 2008) For the silicone specimen, eight-node, linear brick elements with reduced integration and hybrid formulation were used on the global model, while the submodel had quadratic instead of linear elements. The silicone model includes the non-linear effect of large deformations. The global element size was mm 3 and the element size of the submodel was mm 3. The load was applied by prescribing the displacement of the reference node. For the acrylate specimens, eight-node, linear brick elements with reduced integration were used throughout the model. Non-linear effects were not considered. The global element size was mm 3, while in the submodel the element size was mm 3. The load was applied by prescribing the displacement of the reference node. For the polyurethane specimen, the element size was approximately mm 3 in wood and glass and mm 3 in the adhesive, thus the adhesive is modelled with one layer of elements. Eight-node, linear brick elements were used throughout the model. Reduced integration was used everywhere except for in the adhesive and in wood that is close to the 12
20 adhesive bond or close to the upper end of the lower fixture. The load was applied as a point load at the reference node Shear specimen specifics The large Poisson s ratio of the silicone and the acrylate, which enforced the use of three-dimensional models for the tensile specimen modelling, has not as large influence on the shear specimens and therefore two-dimensional models were used. The fixture for the shear specimen was modelled by rigid surfaces, whose interaction to the specimen was given a friction coefficient of 0.5 and hard contact in the normal direction. The loading was applied at reference nodes located at a distance corresponding to the hinges in the actual fixture. These reference nodes were allowed to rotate. Four-node, bilinear plane stress quadrilateral elements were used throughout all shear specimen models. Reduced integration was used everywhere except for in the adhesive and in the wood and glass that is close to the adhesive bond. For the silicone specimen, the element size in wood and glass was mm 2, but close to the adhesive the element size decreases. In the adhesive, an element size of mm 2 was used. The silicone model includes the non-linear effect of large deformations. The loading was applied as prescribed displacement. For the acrylate specimen, the element size in wood and glass was mm 2, but close to the adhesive the element size decreases. In the adhesive, an element size of mm 2 was used. Non-linear effects were not considered. The loading was applied as a point load. For the polyurethane specimen, the element size in wood and glass was mm 2, but close to the adhesive the element size decreases. On the edge of the adhesive, an element size of mm 2 was used. The elements in the adhesive had a size of mm 2, thus the adhesive was modelled with two layers of elements. The load was applied as a point load. 13
21 3 RESULTS Mainly the mean value curves of force versus displacement are presented in this report, but in Chapter B in the Appendix, all curves from the tests are presented. The mean value curves are created by the following procedure: Curves are shifted so that the initial force and displacement are zero. The maximum load and corresponding displacement are determined for each specimen. The mean values of the maximum load and the corresponding displacements are calculated. Let us denote these mean values by F max and δ max respectively. Each curve is cut at its maximum load and normalised so that its maximum load is F max and the corresponding displacement δ max By interpolation, values of the load are obtained for the same set of displacement values for all the curves. Now, a load mean value can be computed for each displacement value. Whenever strength is mentioned in this report, it refers not to an intrinsic material property, but to a mean value calculated as the maximum force divided by the adhesive bond area. This value should, due to non-uniform stress distributions, in general not be expected to correspond to the intrinsic material strength (cf. Figure 3-11 and Figure 3-20, which show the calculated stress distribution in the adhesive bonds). However, if the bond area is small or the adhesive is much more flexible than the adherends, this mean value will of course approach the intrinsic material strength value. To present the type of failure of the specimens, five basic categories were used; cohesion in wood, adhesion to wood, cohesion in adhesive, adhesion to glass and cohesion in glass. Shallow wood failure is often used to describe a failure in adhesive-bonded wood joints where the crack occurs close to the plane of the wood surface in the wood or wood interface, which can be a result of a damaged wood surface (River, 1994). With the categorisation system employed here, this failure would be a mixture of cohesion in wood and adhesion to wood. In Appendix, Chapter C, these categories are more extensively described and example pictures are presented. The categorisation was done based on notes taken during the tests and by studying the specimens afterwards. Most failures were categorised as combinations of some of the basic categories, which resulted in that nine different categories were found. 14
22 3.1 Results for the tensile specimens The obtained strengths for the three different adhesives are presented in tabulated form in Table 3-1 and in bar charts in Figure 3-1. The mean values and standard deviations are calculated from the 15 specimens that were tested for each adhesive type, except for the results set in italics, where some specimens were excluded. From the specimens with acrylate adhesive, 01, 03, 04, 05 and 11 were excluded since the wood failure was deep into the wood. 1 From the specimens with polyurethane adhesive, 11 to 15 were excluded since these had a considerably lower strength than the rest of the polyurethane specimens and all of them failed in adhesion to glass. Since these were manufactured, transported and tested separately from the other polyurethane specimens, some deviation in the handling of these specimens may have caused the lower strength. On the other hand, there is no obvious difference in the handling of these specimens, which may indicate that this type of adhesive bond is sensitive to disturbances. The results presented in Chapter 3.3 indicate that the wood quality used has a tensile strength of 2.3 MPa. Note that the strength obtained for the acrylate adhesive is higher than that of solid wood, while the strength obtained for the silicone and polyurethane bond is lower. This is in line with the failure categorisation (cf. Figure 3-3) where cohesive failure in wood is the dominating category only for the acrylate specimen. That the acrylate specimens could be loaded above the strength of solid wood can be explained by the use of reinforcement since the volume of the wood tested is small. In Figure 3-2, the mean value curves obtained from measuring displacement by piston movement are shown for the acrylate and polyurethane adhesive both for the complete and the reduced set to compare how much the excluded specimens affect the behaviour. Table 3-1. Mean strength and standard deviation for the adhesive bonds. Numbers set in italics are calculated from a reduced set of specimens. Which specimens that are excluded and why is explained in the text. Adhesive Strength (MPa) Standard deviation (MPa) Silicone Acrylate Polyurethane The failure of another three specimens is also categorised as cohesion in wood (see Figure 3-3), but then the wood failure is less than one mm from the adhesive. 15
23 Adhesive bond strength (MPa) Silicone Acrylate Polyurethane Figure 3-1. Tensile strength of adhesive bonds with silicone, acrylate and polyurethane adhesive. The grey bars represent all 15 specimens and the white one represents the reduced set of specimens. Standard deviation is presented on each bar. Acrylate Polyurethane Figure 3-2. Mean value curves with the displacement measured as piston movement from the tensile tests with acrylate and polyurethane adhesive, where a reduced set was studied. The relative displacement between wood and glass give information on the deformation capacity of the adhesives. To, as far as possible, measure the displacements over the adhesive bond and not in the wood, the displacements measured with Aramis are used. Table 3-2 presents these displacements and the standard deviation. The large standard deviation for the polyurethane specimens is due to that only three specimens are included and the displacement at maximal load of one of the specimens differs so much from the others, cf. Figure 3-5. As mentioned in the introduction of this chapter, five basic failure type categories were identified and then, when failures that were a mixture of these categories were considered, nine different categories arose. Since the behaviours of the adhesives are so different, different categories were found for different adhesive even if the same system was used for all specimens. In 16
24 Figure 3-3, the types of failure of the tensile specimens are shown. In these diagrams, only the complete sets of specimens are used, i.e. the reduced sets, where some acrylate specimens with cohesion failure in wood and some polyurethane specimens with low adhesion to glass were removed, are not presented here. From the diagrams it appears that the silicone adhesive tends to fail mainly in a mixture of adhesion to wood and cohesion in adhesive. These two failure types are present in all three categories for the tensile silicone specimens. Further, the acrylate adhesive appears to be so strong in cohesion that the failure occurs either in the wood or in adhesion to wood. Finally, no cohesive failure was observed in the polyurethane specimens, but since the polyurethane adhesive bond is so thin, it is possible that it would not be distinguishable even if there were any cohesive failure in the adhesive. Some polyurethane specimens had such a small portion of wood fibres on the adhesive that they were judged as failure in adhesion to glass. Thus, most of the polyurethane specimens have failure partly, or only, in adhesion to glass even if three specimens failed only in the wood and adhesion to wood. Table 3-2. The relative displacements at maximal load for the adhesive bonds, measured as the mean value of the three specimens studied with Aramis. Adhesive Relative displacement (mm) Standard deviation (mm) Silicone Acrylate Polyurethane Silicone 3 pcs pcs. Acrylate 7 pcs. 8 pcs. Polyurethane 9 pcs. 3 pcs. 3 pcs. Type 3; Cohesion in wood, Adhesion to wood, Cohesion in adhesive Type 7; Adhesion to wood, Cohesion in adhesive Type 8; Adhesion to wood, Cohesion in adhesive, Adhesion to glass Type 1; Cohesion in wood Type 2; Cohesion in wood, Adhesion to wood Type 2; Cohesion in wood, Adhesion to wood Type 4; Cohesion in wood, Adhesion to wood, Adhesion to glass Type 9; Adhesion to glass Figure 3-3. The different categories for specimen failure for the tensile specimens. The diagrams shown are for silicone, acrylate and polyurethane, counting from left to right. 17
25 Figure 3-4 shows the stress-strain relations for the three adhesives. Two diagrams with different scales are shown since the difference between the adhesives is so large. The strain is measured between two points located at the middle of the bond length and one mm into the wood and glass, respectively. It should be noted that this strain measure includes the strain of one millimetre of wood and one millimetre of glass, thus the stiffness obtained is a nominal stiffness of the adhesive bond that differs from the actual stiffness of the adhesives in bulk. For each adhesive, the initial stiffness of the bond is estimated from the initial slope of the curves, see Table 3-3. In Figure 3-4, the dashed lines show these initial stiffnesses. It would be expected that with perfect adhesion to the adherends at least the polyurethane bond would have a larger stiffness than solid wood with this measure since it includes one millimetre of glass and the polyurethane bond is so thin. Tests on the wood quality used (see Chapter 3.3), gave a stiffness of 530 MPa. Thus the stiffness of the polyurethane bond is not higher but lower, which may indicate low adhesion. Figure 3-4. Tensile tests, the mean value curves of the stress-strain relation obtained from Aramis for the different adhesives gathered in the same diagram. For each adhesive a dashed line shows the initial stiffness computed from these results. Table 3-3. Estimated initial stiffnesses for the adhesive bonds. 18 Adhesive Stiffness (MPa) Silicone 10 Acrylate 700 Polyurethane 200 Figure 3-5 shows the force versus displacement curve from tests and a comparison to results from calculation models. The displacement from tests is the relative displacement between wood and glass, measured between two points located at the middle of the bond length and one mm into the wood and glass, respectively. This comparison indicates a relatively good agreement for the modelled initial stiffness. Due to the large Poisson s ratio of the silicone and the acrylate, these models had to be three-dimensional.
26 The polyurethane adhesive bond has small displacements and therefore, the measurements can be sensitive to disturbances such as a rotation of the adherends out of the xy -plane. The large difference within the three studied polyurethane specimens can be due to either this or an actual large difference within the specimens. Figure A-2 in the Appendix shows further investigations on this matter. From this figure it appears to be a rotation of Polyurethane adhesive Acrylate adhesive Silicone adhesive Figure 3-5. Results from tests with the displacement measured with Aramis and from the calculation models. The mean value curve is the mean of the three specimens studied with Aramis. 19
27 adherends in the xy -plane; the relative displacement varies along the x - direction of the adhesive bond. Figure A-3 and Figure A-4 show more results that indicate rotations in the specimens. When the stiffness of the adhesive is much lower than the stiffness of the adherends (the materials that are glued together), which is the case for the silicone specimens, most of the strain occurs in the adhesive and where the Polyurethane adhesive Acrylate adhesive Silicone adhesive Figure 3-6. Mean force vs. displacement curves for silicone, acrylate and polyurethane specimens, with displacement measured with piston, LVDT s and Aramis. The dashed black line is the piston results with only the specimens studied with Aramis included. 20
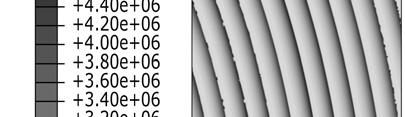
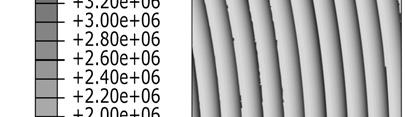
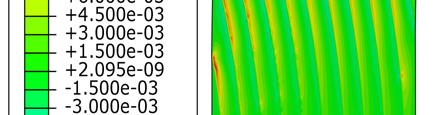
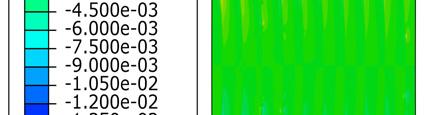
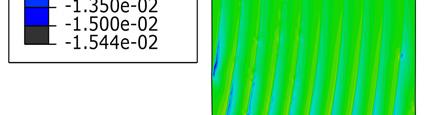
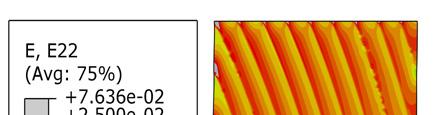
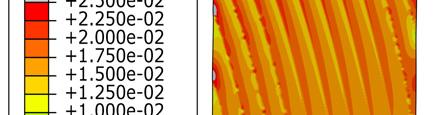
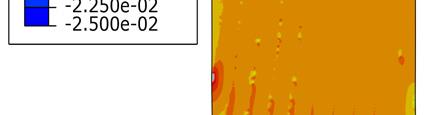
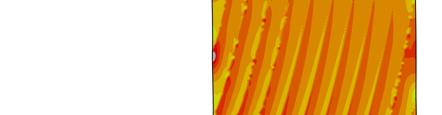
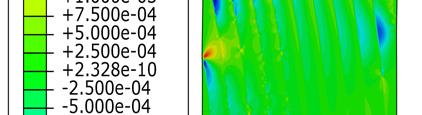
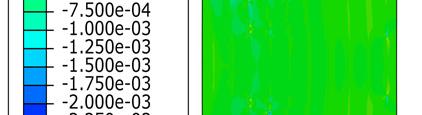
28 displacement is measured does not affect the results. This is not the case for the acrylate and polyurethane adhesives, which are rather stiff. Figure 3-6 shows a comparison between different measuring methods. As expected, the different methods give similar results for the silicone adhesive. The acrylate and polyurethane adhesive show similar differences between the measuring methods. Since these adhesives are rather stiff, some of the measured displacement is outside the adhesive bond. For the LVDT sensors, strain in the wood is measured, and for the piston movement deformations in the machine itself and in the grips are also measured. Note that different sets of specimens are used to present the different methods, which result in some differences. Figure 3-7 to Figure 3-10 show strain plots from tests and calculation models. Recall when comparing calculation results to test results that, as mentioned in Chapter and 2.3, the strain plots from Aramis are averaged across the boundary between adherends and adhesive, while the strain plots from Abaqus are not. I.e., the discontinuity of the strain field at the adhesive/adherend interface is not captured as well in the pictures from Aramis as in the pictures from Abaqus. Further, due to the noise in the load signal, mentioned in Chapter 2.2.2, the load levels in the results from Aramis are not very accurate. Therefore no effort has been made to correlate load level and scale limits from the calculations to those from the tests. From a qualitative comparison between calculation and test results for normal strain in the y -direction at the surface for the silicone and acrylate adhesive, Figure 3-7 to Figure 3-9, it appears that while the strain concentrations at the interface between adherends and adhesives are similar for the silicone adhesive, the strain concentrations at the interface between wood and acrylate adhesive from Aramis are not reflected in the calculation. This may be interpreted as a relatively low adhesion to wood, at least close to the surface where Aramis measures the displacements. Note also the phenomenon present in Figure 3-7. The large Poisson s ratio of the adhesive and the volumetric constraints imposed by the glass and wood result in both shear strains and normal strains in the x -direction. Similar, but not as distinct, results would be obtained for the acrylate adhesive with the second alternative for the material parameters. Figure 3-8 shows that the shear strain measured with Aramis in the acrylate specimens varies with the annual rings of the wood. The strains measured with Aramis for the polyurethane specimen shown in Figure 3-10 are dominated by the strain variation across the annual rings. Chapter 3.4 contains a simplified calculation model of varying stiffness across the annual rings, but this variation is not included in any specimen modelling. The strain field from calculations for the polyurethane adhesive is instead dominated by a strain concentration close the surfaces and thus different from the strain field from Aramis. 21

.")


29 Specimen 12 Calculated Calculated Normal strain, ε yy, at the surface (left and centre) and 2 mm into the specimen (right). Specimen 12 Calculated Engineering shear strain, γ xy, at the surface. Specimen 12 Calculated Normal strain, ε, at the surface. xx Figure 3-7. Strain plots from tests and calculation models of the silicone adhesive bond. 22


 and 2 mm into the")

30 Specimen 12 Normal strain, ε yy, at the surface. Specimen 15 Specimen 12 Engineering shear strain, γ xy, at the surface. Figure 3-8. Strain plots from tests of the acrylate adhesive bond. Specimen 15 Alternative 2 Main alternative Normal strain, ε yy, at the surface (left) and 2 mm into the specimen (right). Figure 3-9. Strain plots from calculations of the acrylate adhesive bond for the two different sets of material parameters. 23


31 Specimen 05 Calculated Normal strain, εyy. Specimen 05 Engineering shear strain, γxy. Figure Strain plots from tests and calculations of specimens with polyurethane adhesive. The strain plots from calculations presented in Figure 3-7 and Figure 3-9 showed that the strain at the surface differed from the strain 2 mm into the bond. In Figure 3-11, normalised stress along one path at the surface and one path in the middle of the specimen is shown. These paths are illustrated in Figure The normalisation is done such that the average tensile stress is 1 MPa. Since the calculation model for the silicone specimen includes non-linear behaviour, the normalised stress is not independent of applied load. The load level chosen for the silicone specimen was 350 N. 24


32 Polyurethane adhesive Acrylate adhesive Silicone adhesive Figure Stress distributions along a line halfway through the thickness of the adhesive, the stresses are measured along the two different paths shown in Figure

33 Figure The paths which stress distributions are measured along. 3.2 Results for the shear specimens The obtained strengths for the three different adhesives are presented in Table 3-4 and in Figure The mean values and standard deviations are calculated from the 15 specimens that were tested for each adhesive type, except for the results set in italics, where one specimen was excluded. Specimen 05 was excluded from the ones with silicone adhesive since the test of this specimen first was started, then interrupted and restarted again. Since the load and deformation capacity of this specimen turned out to be considerably lower than for the rest it cannot be ruled out that the re-starting of the test had an influence on the results. From the specimens with acrylate adhesive, specimen 01 was excluded since the rate of loading of this specimen was lower than for the rest of the specimens, see Table 2-1. The deformation capacity of this specimen turned out to be the largest recorded among the shear specimens with acrylate adhesive, cf. Figure B-6. The tests presented in Chapter 3.3 indicate that the wood quality used has a strength of 6.1 MPa. Thus all adhesive bonds show a lower strength than solid wood. This is in line with the failure categorisation (cf. Figure 3-15) where no failure is solely cohesive failure in wood. In Figure 3-14, the mean value curves obtained by measuring displacement by piston movement are shown for the silicone and acrylate adhesive both for the complete and the reduced set to compare the behaviour. Table 3-4. Mean strength and standard deviation for the adhesive bonds. Numbers set in italics are calculated from a reduced set of specimens, see the text above Adhesive Strength (MPa) Standard deviation (MPa) Silicone Acrylate Polyurethane
34 Adhesive bond strength (MPa) Silicone Acrylate Polyurethane Figure Shear strength and standard deviation of the adhesive bonds. The grey bars represent all 15 specimens and the white ones represent the reduced set of specimens. Silicone Acrylate Figure Mean value curves with the displacement measured as piston movement from the shear tests with silicone and acrylate adhesive, where a reduced set was studied. As for the tensile specimens, the relative displacement between wood and glass is measured to give information about the deformation capacity of the adhesives. To, as far as possible, measure the displacements over the adhesive bond without including deformations in the wood, the displacements measured with Aramis are used. Table 3-5 presents these displacements and the standard deviation. 27
35 Table 3-5. The relative displacements at maximal load for the adhesive bonds, measured as the mean value of the three specimens studied with Aramis. Adhesive Relative displacement (mm) Standard deviation (mm) Silicone Acrylate Polyurethane The failure types for the shear specimens are categorised with the principle described in the introduction of this chapter, the same principle as for the tensile specimens. In Figure 3-15, the types of failure of the shear specimens are shown. In these diagrams, only the complete sets of specimens are used, i.e. the reduced sets, where a silicone and an acrylate specimen were excluded, are not presented here. As for the tensile specimens, different categories were found for different adhesives. Similar to the observation for the tensile tests, the silicone adhesive tends to fail mainly in a mixture of adhesion to wood and cohesion in adhesive, but here some more specimens fail partly in adhesion to glass. Again, the acrylate adhesive appears to be very strong in cohesion, but a larger amount of specimens fail in adhesion to wood than in the tensile test. It should also be noted that cohesion failure in glass occurs in five specimens, which indicate a disadvantage of the testing setup. Some polyurethane specimens had a rather small amount of wood fibres on the adhesive but, in contradiction to the handling of the tensile specimens, cf. Chapter 2.3.1, anyway categorised as failure due to both cohesion in wood and adhesion to wood since it was not possible to distinguish any set of specimens with a significantly lower portion of wood fibres. Figure C-1 in the Appendix shows an example of this inconsistency. A smaller (but not negligible) set of polyurethane specimens fail in cohesion in wood, than in the tensile test. However, the main problem with the polyurethane specimens is adhesion to glass, which is present in all the failure categories for the polyurethane. In Figure 3-16, the stress-strain relations for the three adhesives are shown. Diagrams with different scales are shown since the difference between the adhesives is so large. The strain is measured between two points located at the middle of the bond length and one mm into the wood and glass, respectively. It should be noted that this strain measure includes the strain of one millimetre of wood and one millimetre of glass, thus the stiffness obtained is a nominal stiffness of the adhesive bond that differs from the actual stiffness of the adhesives in bulk. The initial shear stiffnesses of the adhesive bonds are estimated from the initial slope of the stress versus strain curves. The dashed lines in Figure 3-16 show the initial shear stiffnesses, which also are tabulated in Table
36 Silicone Acrylate Polyurethane 1 5 pcs. 10 pcs. 5 pcs. 10 pcs. 6 pcs. 8 pcs. Type 7; Adhesion to wood, Cohesion in adhesive Type 8; Adhesion to wood, Cohesion in adhesive, Adhesion to glass Type 2; Cohesion in wood, Adhesion to wood Type 6; Cohesion in wood, Adhesion to wood, Cohesion in glass Type 4; Cohesion in wood, Adhesion to wood, Adhesion to glass Type 5; Cohesion in wood, Adhesion to wood, Adhesion to glas, Cohesion in glass Type 9; Adhesion to glass Figure The different categories for specimen failure for the shear specimens. The diagrams shown are for silicone, acrylate and polyurethane, counting from left to right. Figure Shear test, the stress vs. strain mean value curves obtained from Aramis. For each adhesive a dashed line shows the estimated initial stiffness. Table 3-6. Estimated initial shear stiffnesses for the adhesive bonds. Adhesive Shear stiffness (MPa) Silicone 0.6 Acrylate 80 Polyurethane 600 Figure 3-17 shows the force versus displacement curve when displacement measured with Aramis, i.e. close to the adhesive bond, and a comparison to results from calculation models. The comparison indicates a relatively good agreement for the modelled initial stiffness. 29
37 Polyurethane adhesive Acrylate adhesive Silicone adhesive Figure Force vs. displacement curves. The displacement is the relative displacement between wood and glass, measured between two points located at the middle of the bond length and one mm into the wood and glass, respectively. 30
38 In Chapter 3.1, it was noted that rotations in the specimens can yield different displacement results at different points along the x -direction of the adhesive bond. Figure A-5 in the Appendix shows the same type of curves for shear specimens. The two different alternatives for material parameters in the modelling of the acrylate adhesive yield approximately the same results for the shear specimen. This is to be expected since the resistance against a volumetric change that a large Poisson s ratio implies is not as important in shear as it is in tension. Figure 3-18 shows a comparison between different measuring methods. Note that different sets of specimens are presented for the different methods since only one of the two LVDT sensors was used together with Aramis. The silicone adhesive has a relatively low stiffness compared to wood (and glass). Therefore almost all deformation is in the adhesive itself and the different measuring methods give similar results. By contrast, for the stiffer adhesives, polyurethane and acrylate, there is a significant difference between the different measuring methods. While the differences between different measuring methods were similar for the acrylate and polyurethane adhesive in tension, there are significantly larger differences for the polyurethane than for the acrylate for these shear specimens. 31
39 Polyurethane adhesive Acrylate adhesive Silicone adhesive Figure Mean force vs. displacement curves for silicone, acrylate and polyurethane, displacements measured with piston, LVDT s and Aramis. The dashed black line is the piston results with only the specimens studied with Aramis included. Figure 3-19 shows strain plots from tests and the calculation models. Recall when comparing calculation results to test results that, as mentioned in Chapter and 2.3, the strain plots from Aramis are averaged across 32


40 the boundary between adherends and adhesive, while the strain plots from Abaqus are not. That is, the discontinuity of the strain field at the adhesive/adherend interface is not captured as well in the pictures from Aramis as in the pictures from Abaqus. The load levels are chosen so that they are approximately the same for the test results and the calculation results and the scales have the same limits. The pictures of number 14 and 15 from the silicone specimens and number 14 from the acrylate specimens indicate a larger shear strain in the adhesive close to the glass than in the adhesive close to the wood, which is not reflected in the pictures from the calculations. Otherwise it appears from the colour plots that the behaviour in the tests is roughly the same as predicted by the calculations. Silicone Specimen 14, 156 N Specimen 15, 147 N Calculated, 165 N Acrylate Specimen 14, 1484 N Specimen 15, 1514 N Calculated, 1518 N Polyurethane Specimen 02, 1514 N Specimen 15, 1523 N Calculated, 1500 N Figure Shear angle/strain plots from testing of the shear specimens. 33
41 In Figure 3-20, normalised stress along a path in the middle of the adhesive bond is shown. The normalisation is done such that the average tensile stress is 1 MPa. While studying this figure, it should be kept in mind that the calculation models consider neither any slip between the adhesive and the adherends nor any plastic behaviour. Due to the difference in stiffness between wood and glass, the stress distributions cannot be expected to be symmetric about the mid plane. The shear stress at the left end is more than 1.5 times higher than the shear stress at the right end for the polyurethane adhesive. The calculations further predict a quite large stress perpendicular to the adhesive plane for the polyurethane adhesive. The same tendencies can be observed for the acrylate adhesive, but the deviations from a uniform shear stress distribution and no stress perpendicular to the adhesive plane are much smaller. In the silicone bond, the stress distributions appear to be symmetric, which can be explained by that the stiffness of glass and the stiffness of wood are of the same magnitude compared to the silicone with a much lower stiffness. Figure Stress distributions from the calculation models. The stresses are measured along a path halfway through the thickness of the adhesive, in the direction shown in Figure The stresses are normalised with the factor corresponding to a mean shear stress of ( )1 MPa. Figure The path which the stress distributions are measured along. 3.3 Results for solid wood A few solid wood specimens of the same quality as was used for the adhesive bond specimens were tested in order to get an estimation of the strength and stiffness of the wood. The tests should not be expected to be a representative characterisation of the wood, but may indicate whether the adhesive bonds have obtained a strength close to the strength of the wood. 34
42 Five solid wood specimens with a nominal rectangular cross-section of mm 2 were tested in tension in the tangential direction. The displacement was measured with an LVDT sensor over a length of 20 mm. Figure 3-22 shows the mean stress versus strain relation and Table 3-7 the obtained strength and stiffness. Two solid wood specimens were tested in shear. These were designed with the same nominal dimensions and orientation as the shear specimens with acrylate adhesive and the strain was measured with Aramis. Figure 3-23 shows the mean stress versus strain relation and Table 3-7 the obtained strength and stiffness. Figure 3-24 shows strain plots from Aramis and a calculation model. Figure Stress vs. strain relation from tensile test of wood, tension in the tangential direction. Figure Stress vs. strain relation from longitudinal shear test of wood (left). The strain was calculated as the average shear strain of the shaded area (right). 35

. Table 3-7.")
 Strain interval for secant Secant modulus (MPa) Tensile 2.")


43 Specimen 01, 996 N Specimen 02, 996 N Calculated, 1018 N Specimen 01, 4873 N Specimen 02, 3887 N Figure Shear strain plots, at a load level of approximately 1 kn (top row) and at the last picture before failure (bottom row). Table 3-7. Results from solid wood tests. Test Strength (MPa) Strain interval for secant Secant modulus (MPa) Tensile % 530 Longitudinal shear Modelling varying properties across annual rings For the two stiffer adhesives, polyurethane and acrylate, the strains in the wood measured with Aramis vary across the annual rings. In a first study of how the variation of material parameters across the annual rings can affect the strain field, a calculation with a material with a stiffness that varies across the annual rings was performed. The material was assumed to be isotropic with E varying across the annual rings and υ set to zero. In Figure 3-25, the modelled stiffness variation is shown. Figure 3-26 shows the strain distributions in a body with the same dimensions and similar annual ring density and orientation as the wooden part of the tensile specimens. 36

44 Figure Stiffness distribution. Shear strain, γ xy. Normal strain, ε yy. Normal strain, ε xx. Figure Strain distributions due to tension in the y-direction. 37
45 4 CONCLUDING DISCUSSION 4.1 Summary The adhesive with the largest strength in the tests performed here was the acrylate (SikaFast 5215), both in tension and shear. The mean strength for this acrylate adhesive was 3.0 MPa in tension and 4.5 MPa in shear. In tension, the polyurethane has less than 67 % of the strength of the acrylate (for a reduced set, where the last five specimens glued were excluded since they had substantial amount of adhesion failure to glass for lower loads than other specimens). In shear, the difference between the strength of acrylate and polyurethane is smaller; the strength of the polyurethane is 85 % of the strength of the acrylate. However, the rather large difference within the polyurethane shear specimens should be noted. The silicone is, by far, the weakest adhesive in the tests; it had about 25 % of the strength of acrylate in tension and 20 % in shear. The deformation capacity of the silicone adhesive bond was measured to about 2 mm in tension and 10 mm for shear. The silicone adhesive tends to fail mainly in a mixture of adhesion to wood and cohesion in adhesive, the acrylate adhesive appears to be so strong in cohesion that the failure occurs either in the wood or in adhesion to wood while most of the polyurethane specimens have failure partly, or only, in adhesion to glass. The fixture for manufacturing of the specimens was rather efficient since five specimens could be glued at the same time. It may, however, be best suited for adhesives where bond thickness and not gluing pressure is the important parameter. For the polyurethane specimens, a height difference within the five specimens glued at the same time results in higher pressure on the larger specimens and lower pressure on the smaller specimens. This and the brittleness of the polyurethane may contribute to the large deviation in strength that was found. For silicone and acrylate specimens, a possible drawback of the fixture is that nothing except the resistance of the noncured adhesive prevents the glass pieces from tilting, which would result in a sloped glass and an adhesive bond that is thinner on one side. A comparison of results from calculation models and tests indicates a relatively good agreement for the modelled initial stiffness, except for the polyurethane tensile specimens, but the difference within these test results differ a lot. The models should not be expected to yield accurate results for higher load levels since neither slip between the adherends and the adhesive, plasticity nor any (other) type of material failure is considered. 38
46 4.2 Possibilities and difficulties with optical measuring General comments The measuring with an optical method enables measuring without mounting extra equipment on the specimen and the need to determine the location relevant for measuring a priori is eliminated. It should, however, be kept in mind that a limitation not overcome by the visual measuring method is that only what happens on the surface is captured. The three different methods the displacement was measured with; piston movement, LVDT sensors, which measure the displacements closer to the adhesive bond, and Aramis, where points can be chosen, in principle, arbitrarily close to the adhesive bond, show the effect of measuring method. The methods give almost the same displacements for the silicone adhesive. But for the acrylate and polyurethane, which are stiffer, a significant part of the deformation occurs outside the adhesive bond and, therefore, the methods yield rather different results. The load level for the data from Aramis turned out to be imprecise. Further, Aramis data was sampled every third second, which resulted in rather few data points, especially for the tensile tests. Therefore the point where the maximum load was achieved is rather uncertain in the Aramis data. The noise in the load signal fed into the Aramis system may explain the load level impreciseness. Since the load oscillation that appears in the results from Aramis is not present in the results extracted directly from the MTS machine, it must be possible to overcome this problem either by improving the load signal transfer or change to another method for correlating load level to Aramis data. For small strains, noise in the results can be a problem, but if not the results of a specific point are required, the mean value of some area can be extracted instead which there is an example of in Chapter Rotations in the tests Figure A.2 is from the tensile tests and considers the three polyurethane specimens studied with Aramis and shows the displacement at lines at different heights of the specimen. These curves should accordingly be interpreted as follows: if the lines are coincident or close to each other there is the same displacement at different heights, thus the part of the specimen covered by the lines is not stretched. Since the glass is so stiff, the lines in the glass should be expected to coincide, but it is noted that also the lines in the wood coincide for specimen 05 and 09, but not for 07. Thus for the former two the strains in the wood are small compared to the relative displacement between wood and glass at the maximal load which will happen if the bonding starts to open, while in specimen 07 bond opening before decrease in load can be suspected 39
47 at the right end only. Finally, it is noted that the slope of the glass lines shows that the glass has rotated about the z-axis. Figure A.3 considers instead one specimen from each adhesive type and shows the relative displacement between glass and wood at different positions along the bond line, at the left end, the mid and the right end. The polyurethane specimen 05 is already studied in Figure A.2 and the rotation of the adherends relative to each other can be observed in either of the figures. From Figure A.3 it can be seen that for the silicone specimen this rotation is negligible while the acrylate specimen has the smallest relative displacement in the middle and larger at the edges, thus appears to behave similar to the polyurethane specimen 09 in Figure A.2. Another rotation, of the adherends relative to each other about the x- axis, can be seen when studying the results from the LVDT s. Figure A.4 shows the displacement measured with only one LVDT for the three polyurethane specimens studied with Aramis. It should, however, be noted that the actual rotation of the adherends is magnified by the LVDT since it is mounted at a distance from the specimen; what appears to be compression (negative displacement) is more likely only rotation. Figure A.5 is from the shear tests and considers, as Figure A.3, one specimen from each adhesive type and shows the relative displacement between glass and wood at different positions along the bond line, at the upper end, the mid and the lower end. The relative displacement is in the x- direction, i.e. perpendicular to the adhesive bond. It shows that all adhesive types are stretched in this direction as the test progresses, but this stretching appears constant along the bond line except for the studied polyurethane specimen which has a larger displacement at the upper end which may indicate tearing from the upper end of the bond line, but it evens out as the test progresses. 4.3 Further studies One important factor when gluing glass is the load distribution ability. The flexible silicone adhesive with a large deformation capacity could be preferred from this point of view, but the stiffness and strength are too low to enable any load to be carried without applying the adhesive bond over a very large area. Then the beneficial transparency of glass is lost, wherefore, of the three adhesives studied here, only the acrylate (SikaFast 5215) is considered worth further studies. A potential problem with this adhesive is identified in its thermostability. There is no need to design for extreme temperatures in normal buildings, but the low glass transition temperature of 52 C of the acrylate adhesive could result in a significant reduction in stiffness already for temperatures that can be reached in the interior climate of for example a building with a glass façade and solar radiation. This issue is in need of further investigation. 40
48 REFERENCES ABAQUS user s manual (2008). Version 6.8. de Castro, J. (2005), Experiments on Epoxy, Polyurethane and ADP adhesives, Technical report, EPFL. Kreher, K. (2006), Load introduction with timber, timber as reinforcement for glued composites (shear-walls, I-beams) structural safety a calculation model, in WCTE. Larsson, O. (2008), Shear capacity in adhesive glass-joints, Master s thesis, Structural Mechanics, LTH. Louter, P. (2007), Adhesively bonded reinforced glass beams, HERON 52, Nielsen, J. and Olesen, J. (2007), Mechanically reinforced glass beams, in A. Zingoni, ed., Recent developments in structural engineering, mechanics and computation. River, B. H. (1994), Handbook of adhesive technology, New York: Marcel Dekker, Inc., chapter 9 Fracture of Adhesive-Bonded Wood Joints, pp Sika Schweiz AG (2003), Technical Data Sheet, SikaFast Sika Schweiz AG (2009), Product Data Sheet, Sikasil SG-20. Version 1. 41
49
 of the specimen. Figure A-1. The major strain plot shows a crack in the glass. A.1 Tensile tests Table A-1.")
50 A TEST DETAILS In specimen 14 in the acrylate shear test, a crack occurred in the glass before final failure in the adhesive bond, see Figure A-1. The crack occurred at approximately 3.3 kn, while the final failure occurred at 3.8 kn, but it was not throughout the width (out-of-plane direction) of the specimen. Figure A-1. The major strain plot shows a crack in the glass. A.1 Tensile tests Table A-1. Aramis settings for the tension tests. Silicone Acrylate Polyurethane Specimefication Ampli- Volume Specimefication Ampli- Volume Specimefication Ampli- Volume i
51 lines on glass lines on wood lines on glass lines on wood lines on glass lines on wood Specimen 05 Specimen 07 Specimen 09 Figure A-2. Polyurethane adhesive bonds. Displacement in the y-direction of lines at different heights. The stage with the maximal load is chosen from Aramis. Silicone, specimen 13 Acrylate, specimen 14 Polyurethane, specimen 05 Figure A-3. Relative displacement measured close to the left end, at the middle and close to the right end of the bond for one silicone, one acrylate and one polyurethane specimen. Figure A-4. Displacement for the three polyurethane specimens studied with Aramis, measured with LVDT s on the side opposite to the side where the cameras for Aramis are located. ii
52 A.2 Shear tests Table A-2. Aramis settings for the shear tests. Silicone Acrylate Polyurethane Specimefication Ampli- Spec- Ampli- Spec- Ampli- Volume imen fication Volume imen fication Volume Silicone, specimen 13 Acrylate, specimen 15 Polyurethane, specimen 14 Figure A-5. Relative x-displacement measured close to the upper end, at the middle and close to the lower end of the bond for one silicone, one acrylate and one polyurethane specimen. B ALL SPECIMENS INCLUDED The curves are cut when the difference in force or displacement from one sampled point to the next is larger than 25 % of the values of the maximum load or the corresponding displacement, respectively. The last point of a cut curve is marked with. The curves are also shifted so that the initial force and displacement are zero. The thick black line in the diagrams is the mean value curve calculated from all specimens in the plotted set. iii
53 B.1 Tensile tests Polyurethane adhesive Acrylate adhesive Silicone adhesive Figure B-1. All force vs. displacement curves from the tension tests with the relative displacement measured as piston movement. iv
54 Polyurethane adhesive Acrylate adhesive Silicone adhesive Figure B-2. All force vs. displacement curves from the tension tests. In these curves, the displacement is measured with LVDT s. v
55 Polyurethane adhesive Acrylate adhesive Silicone adhesive Figure B-3. All force vs. displacement curves from the tension tests. The displacement, measured with Aramis, is the relative displacement between wood and glass, measured between two points located at the middle of the bond length and one mm into the wood and glass, respectively. vi
56 B.2 Shear tests Polyurethane adhesive Acrylate adhesive Silicone adhesive Figure B-4. All force vs. displacement curves from the shear tests. In these curves, the displacement is measured as piston movement. vii
57 Polyurethane adhesive Acrylate adhesive Silicone adhesive Figure B-5. All force vs. displacement curves from the shear tests. In these curves, the displacement is measured with LVDT s. viii
58 Polyurethane adhesive Acrylate adhesive Silicone adhesive Figure B-6. All force vs. displacement curves from the shear tests. The displacement, measured with Aramis, is the relative displacement between wood and glass, measured between two points located at the middle of the bond length and one mm into the wood and glass, respectively. ix
59 B.3 Solid wood tests Figure B-7. Tension test of solid wood in the tangential direction. Figure B-8. Shear test of solid wood, longitudinal shear. x
60 C FRACTURE CATEGORIES In Table C-1, the failure types of the adhesive bonds are described, and in Table C-2, example pictures of the different categories are shown. The first letter in the notations below is the adhesive, S for silicone, A for acrylate and P for polyurethane, while the second letter is the test type, T for tension and S for shear. Table C-1. Categories found in the characterisation of failure types of the adhesive bonds. Description(s) Cohesion in wood Adhesion to wood Cohesion in adhesive Adhesion to glass Cohesion in glass Type 1: Only wood is visible on both sides. 8 AT x Type 2: There are wood and/or wood fibres on the adhesive and portions of the adhesive have lost adhesion to the wood without a significant amount of wood fibres remaining on the adhesive. 7 AT, 3 PT and 10 AS x x Type 3: There is wood and/or wood fibres on the adhesive, portions of the adhesive have lost adhesion to the wood without a significant amount of wood fibres remaining on the adhesive and some pieces of adhesive remain on the wood. 11 ST Type 4: There is wood and/or wood fibres on the adhesive, portions of the adhesive have lost adhesion to the wood without a significant amount of wood fibres remaining on the adhesive and portions of the adhesive have lost adhesion to the glass. 8 PS and 3 PT Type 5: There is wood and/or wood fibres on the adhesive, portions of the adhesive have lost adhesion to the wood without a significant amount of wood fibres remaining on the adhesive and portions of the adhesive have lost adhesion to the glass. Further, crack(s) have appeared in the glass. 6 PS x x x x x x x x x x xi
61 Type 6: There is wood and/or wood fibres on the adhesive, portions of the adhesive have lost adhesion to the wood without a significant amount of wood fibres remaining on the adhesive and crack(s) have appeared in the glass. 5 AS x x x Type 7: Some adhesive remain on the wood surface, but portions of the wood are also visible. 3 ST and 10 SS x x Type 8: Some portions of the adhesive have lost adhesion to the glass and some have lost adhesion to the wood, but there is also some cohesive failure in the adhesive. 1 ST and 5 SS Type 9: The adhesive has lost adhesion to the glass. 9 PT and 1 PS x x x x xii


62 Table C-2. Example pictures of the failures. One example picture is chosen for each adhesive and each test that is found in the category. Type 1: 8 AT Type 2: 7 AT, 3 PT, 10 AS Type 3: 11 ST Type 4: 8 PS, 3 PT Type 5: 6 PS Type 6: 5 AS xiii


63 Type 7: 3 ST, 10 SS Type 8: 1 ST, 5 SS Type 9: 9 PT, 1 PS Figure C-1. A tensile specimen, where the wood fibres on the glass are neglected and the failure categorised as adhesion to glass, and a shear specimen where the wood fibres on the glass are considered and the failure categorised as a mixture of cohesion in wood, adhesion to wood and adhesion to glass. xiv
Dowel connections in laminated strand lumber
 Dowel connections in laminated strand lumber Cranswick, Chad J. 1, M c Gregor, Stuart I. 2 ABSTRACT Laminated strand lumber (LSL) is a relatively new structural composite lumber. As such, very limited
Failure of Engineering Materials & Structures. Code 34. Bolted Joint s Relaxation Behavior: A FEA Study. Muhammad Abid and Saad Hussain
 Failure of Engineering Materials & Structures Code 3 UET TAXILA MECHNICAL ENGINEERING DEPARTMENT Bolted Joint s Relaxation Behavior: A FEA Study Muhammad Abid and Saad Hussain Faculty of Mechanical Engineering,
Dowel type joints Influence of moisture changes and dowel surface smoothness. Erik Serrano and Johan Sjödin, Växjö University, Sweden
 Dowel type joints Influence of moisture changes and dowel surface smoothness Erik Serrano and Johan Sjödin, Växjö University, Sweden Background and introduction With the increased use of glulam in large-span
AMTS STANDARD WORKSHOP PRACTICE. Bond Design
 AMTS STANDARD WORKSHOP PRACTICE Reference Number: AMTS_SWP_0027_2008 Date: December 2008 Version: A 1 Contents 1 Technical Terms...3 2 Scope...3 3 Primary References...3 4 Basic...3 4.1 Typical joint types...4
PRO LIGNO Vol. 11 N pp
 FINITE ELEMENT SIMULATION OF NAILED GLULAM TIMBER JOINTS Mats EKEVAD Luleå University of Technology Division of Wood Science and Engineering SE-931 87 Skellefteå, Sweden Tel: +46 910 585377; E-mail: mats.ekevad@ltu.se
Bolts and Set Screws Are they interchangeable?
 1903191HA Bolts and Set Screws Are they interchangeable? Prof. Saman Fernando Centre for Sustainable Infrastructure SUT Introduction: This technical note discusses the definitions, standards and variations
Improved Arcan Shear Test For Wood
 Improved Arcan Shear Test For Wood Jen Y. Liu, Robert J. Ross, and Douglas R. Rammer USDA Forest Service, Forest Products Laboratory, 1 Madison, WI, USA Abstract A new shear test fixture design that uses
An Investigation of Optimal Pitch Selection to Reduce Self-Loosening of Threaded Fastener under Transverse Loading
 IJSTE - International Journal of Science Technology & Engineering Volume 3 Issue 01 July 2016 ISSN (online): 2349-784X An Investigation of Optimal Pitch Selection to Reduce Self-Loosening of Threaded Fastener
Glued laminated timber beams repair.
 Glued laminated timber beams repair. Master s Degree Extended Abstract Ricardo Cardoso Henriques da Silva Keywords: glulam, delamination, self-tapping screw, plywood, repair November 2014 1. INTRODUCTION
The Behaviour Of Round Timber Sections Notched Over The Support On The Tension Face. Justin Dewey
 The Behaviour Of Round Timber Sections Notched Over The Support On The Tension Face Justin Dewey Need for research In Queensland there are approximately 400 timber bridges still in use. Very little research
Moment-Resisting Connections In Laminated Veneer Lumber (LVL) Frames
 Frames") Moment-Resisting Connections In Laminated Veneer Lumber (LVL) Frames Andy van Houtte Product Engineer-LVL Nelson Pine Industries Nelson, NZ Andy Buchanan Professor of Civil Engineering Peter Moss Associate
Moment-Resisting Connections In Laminated Veneer Lumber (LVL) Frames Andy van Houtte Product Engineer-LVL Nelson Pine Industries Nelson, NZ Andy Buchanan Professor of Civil Engineering Peter Moss Associate
Disclaimer for FAA Research Publication
 Disclaimer for FAA Research Publication Although the FAA has sponsored this project, it neither endorses nor rejects the findings of the research. The presentation of this information is in the interest
M. Bücker*, M. Magin. Institute for Composite Materials, Erwin-Schrödinger-Straße 58, Kaiserslautern, Germany
 TESTING OF THE STRENGTH OF AN ALTERNATIVE MANUFACTURING METHOD FOR BOLTED JOINTS USED IN A GFRP-ROTOR OF AN AXIAL-FLUX ELEKTRIC MOTOR FOR SERIAL PRODUCTION IN AUTOMOTIVE M. Bücker*, M. Magin Institute
Mechanical behavior of fiberglass reinforced timber joints
 Mechanical behavior of fiberglass reinforced timber joints Chen, Chi-Jen 1 ABSTRACT The objective of this research is to investigate the mechanical performance of dowel-type timber joints reinforced by
EXPERIMENTAL INVESTIGATION OF FATIGUE BEHAVIOUR IN COMPOSITE BOLTED JOINTS
 EXPERIMENTAL INVESTIGATION OF FATIGUE BEHAVIOUR IN COMPOSITE BOLTED JOINTS Roman Starikov 1 and Joakim Schön 2 1 Department of Aeronautics, Royal Institute of Technology SE-1 44 Stockholm, Sweden 2 Structures
Anti-check bolts as means of repair for damaged split ring connections
 Anti-check bolts as means of repair for damaged split ring connections Quenneville, J.H.P. 1 and Mohammad, M. 2 ABSTRACT There are numerous large span timber hangars dating back to the Second World War.
Pull-compression tests on glued-in metric thread rods parallel to grain in different timber species and laminated veneer lumber
 COST FP1004 15-17 April 2015 Lisbon, Portugal Pull-compression tests on glued-in metric thread rods parallel to grain in different timber species and laminated veneer lumber Frank Hunger 1, Mislav Stepinac
INFLUENCE OF SOME MODIFICATIONS OF LOCAL GEOMETRY ON THE STRESS STATES IN ADHESIVE BONDED LAP JOINTS
 SISOM 2009 and Session of the Commission of Acoustics, Bucharest 28-29 May INFLUENCE OF SOME MODIFICATIONS OF LOCAL GEOMETRY ON THE STRESS STATES IN ADHESIVE BONDED LAP JOINTS Adriana SANDU *, Marin SANDU
Experimental Evaluation of Metal Composite Multi Bolt Radial Joint on Laminate Level, under uni Axial Tensile Loading
 RESEARCH ARTICLE OPEN ACCESS Experimental Evaluation of Metal Composite Multi Bolt Radial Joint on Laminate Level, under uni Axial Tensile Loading C Sharada Prabhakar *, P Rameshbabu** *Scientist, Advanced
CONCEPTUAL DESIGN OF A FRETTING FATIGUE TESTING DEVICE
 CONCEPTUAL DESIGN OF A FRETTING FATIGUE TESTING DEVICE N. Borms 1, D. De Schamphelaere 1, J. De Pauw 2, P. De Baets 2, W. De Waele 2 2 1 Ghent University, Belgium Ghent University, Laboratory Soete, Belgium
AN IMPROVED SHEAR TEST FIXTURE USING THE IOSIPESCU SPECIMEN
 AMD-VOl. 231/MD-VOl. 85 Mechanics of Cellulosic Materials 1999 ASME 1999 ABSTRACT AN IMPROVED SHEAR TEST FIXTURE USING THE IOSIPESCU SPECIMEN Jen Y. Liu, Dwight D. Flach, Robert J. Ross, and Gary J. Lichtenberg
Design of structural connections for precast concrete buildings
 BE2008 Encontro Nacional Betão Estrutural 2008 Guimarães 5, 6, 7 de Novembro de 2008 Design of structural connections for precast concrete buildings Björn Engström 1 ABSTRACT A proper design of structural
Nonlinear behavior of Reinforced Concrete Infilled Frames using ATENA 2D
 Available online at www.ijacskros.com Indian Journal of Advances in Chemical Science S1 (2016) 173-178 Nonlinear behavior of Reinforced Concrete Infilled Frames using ATENA 2D M. D. Raghavendra Prasad,
Finite Element Analysis of Multi-Fastened Bolted Joint Connecting Composite Components in Aircraft Structures
 Finite Element Analysis of Multi-Fastened Bolted Joint Connecting Composite Components in Aircraft Structures Dr. M Satyanarayana Gupta Professor & HoD, Dept. of Aeronautical Engineering MLRIT, Hyderabad.
Keywords: Bracing bracket connection, local deformation, selective pallet racks, shear stiffness, spine bracings.
 Send Orders for Reprints to reprints@benthamscience.ae The Open Construction and Building Technology Journal, 2015, 9, 1-6 1 Open Access Investigation of Shear Stiffness of Spine Bracing Systems in Selective
Tension Perpendicular to Grain Strength of Wood, Laminated Veneer Lumber (LVL), and Cross-Banded LVL (LVL-C)
, and Cross-Banded LVL (LVL-C)") Tension Perpendicular to Grain Strength of Wood, Laminated Veneer Lumber (LVL), and Cross-Banded LVL (LVL-C) M. Ardalany PhD candidate, Department of Civil and Natural Resources Engineering, University
Tension Perpendicular to Grain Strength of Wood, Laminated Veneer Lumber (LVL), and Cross-Banded LVL (LVL-C) M. Ardalany PhD candidate, Department of Civil and Natural Resources Engineering, University
Prying of a Large Span Base Plate Undergoing a Moment Load Applied by a Round Pier
 Prying of a Large Span Base Plate Undergoing a Moment Load Applied by a Round Pier by Anastasia Wickeler A thesis submitted in conformity with the requirements for the degree of Masters of Applied Science
American Institute of Timber Construction 7012 South Revere Parkway Suite 140 Centennial, CO Phone: 303/ Fax: 303/
 American Institute of Timber Construction 7012 South Revere Parkway Suite 140 Centennial, CO 80112 Phone: 303/792-9559 Fax: 303/792-0669 404.1. SCOPE STANDARD FOR RADIALLY REINFORCING CURVED GLUED LAMINATED
Effect of Bolt Layout on the Mechanical Behavior of Four Bolted Shear Joint
 Effect of Bolt Layout on the Mechanical Behavior of Four Bolted Shear Joint using Three Dimensional Finite Effect of Bolt Layout on the Mechanical Behavior of Four Bolted Shear Joint using Three Dimensional
SIMULATION AND EXPERIMENTAL WORK OF SINGLE LAP BOLTED JOINT TESTED IN BENDING
 SIMULATION AND EXPERIMENTAL WORK OF SINGLE LAP BOLTED JOINT TESTED IN BENDING Aidy Ali *, Ting Wei Yao, Nuraini Abdul Aziz, Muhammad Yunin Hassan and Barkawi Sahari Received: Jun 13, 2007; Revised: Nov
4.0 MECHANICAL TESTS. 4.2 Structural tests of cedar shingles
 4.0 MECHANICAL TESTS 4.1 Basis for the test methodology The essence of deterioration is that while it may be caused by insects, weather, fungi or bacteria, the decay is not identical. Further, no two physical
Strain Measurements with the Digital Image Correlation System Vic-2D
 CU-NEES-08-06 NEES at CU Boulder 01000110 01001000 01010100 The George E Brown, Jr. Network for Earthquake Engineering Simulation Strain Measurements with the Digital Image Correlation System Vic-2D By
LS-DYNA USED TO ANALYZE THE MANUFACTURING OF THIN WALLED CANS AUTHOR: CORRESPONDENCE: ABSTRACT
 LS-DYNA USED TO ANALYZE THE MANUFACTURING OF THIN WALLED CANS AUTHOR: Joachim Danckert Department of Production Aalborg University CORRESPONDENCE: Joachim Danckert Department of Production Fibigerstraede
Moisture measurements with time domain reflectometer (TDR)
") 10th International Symposium on District Heating and Cooling September 3-5, 2006 Tuesday, 5 September 2006 Sektion 8 a Heat distribution optimisation of existing solutions Moisture measurements with time
10th International Symposium on District Heating and Cooling September 3-5, 2006 Tuesday, 5 September 2006 Sektion 8 a Heat distribution optimisation of existing solutions Moisture measurements with time
Analysis of the multilayer woven fabric behaviour during the forming process. Focus on the loss of cohesion within the woven fibre network.
 Analysis of the multilayer woven fabric behaviour during the forming process. Focus on the loss of cohesion within the woven fibre network. Ahmad Rashed Labanieh a*, Christian Garnier a, Pierre Ouagne
Stress Analysis of Flanged Joint Using Finite Element Method
 Stress Analysis of Flanged Joint Using Finite Element Method Shivaji G. Chavan Assistant Professor, Mechanical Engineering Department, Finolex Academy of Management and Technology, Ratnagiri, Maharashtra,
FINITE ELEMENT SIMULATIONS OF THE EFFECT OF FRICTION COEFFICIENT IN FRETTING WEAR
 Proceedings of the 5 th International Conference on Fracture Fatigue and Wear, pp. 58-63, 216 FINITE ELEMENT SIMULATIONS OF THE EFFECT OF FRICTION COEFFICIENT IN FRETTING WEAR T. Yue and M. Abdel Wahab
NON-LINEAR CONNECTION MODELS IN TIMBER ENGINEERING
 NON-LINEAR CONNECTION MODELS IN TIMBER ENGINEERING Michael Dorn 1, Thomas K. Bader 2 ABSTRACT: In this contribution, a numerical model for connections in engineered timber structures, using specially designed
PRESSURE DISTRIBUTION AND SURFACE QUALITY DURING FORMING OF THERMOPLASTIC COMPOSITES WITH A COLLECTION OF RUBBER PARTICLES AS MOULD HALF
 PRESSURE DISTRIBUTION AND SURFACE QUALITY DURING FORMING OF THERMOPLASTIC COMPOSITES WITH A COLLECTION OF RUBBER PARTICLES AS MOULD HALF V.Antonelli 12, R. Carbone 3, S. Lindstedt 4, R. Marissen 5 1 Delft
Lawrence A. Soltis, M. and Robert J. Ross, M. 1
 REPAIR OF WHITE OAK GLUED-LAMINATED BEAMS Lawrence A. Soltis, M. and Robert J. Ross, M. 1 Abstract Connections between steel side plates and white oak glued-laminated beams subjected to tension perpendicular-to-grain
MECHANICAL PROPERTY OF CARBON NANOTUBE YARN REINFORCED EPOXY
 THE 19 TH INTERNATIONAL CONFERENCE ON COMPOSITE MATERIALS MECHANICAL PROPERTY OF CARBON NANOTUBE YARN REINFORCED EPOXY Y. Shimamura 1*, K. Oshima 2, M. Ishihara 2, K. Tohgo 1, T. Fujii 1 and Y. Inoue 3
Tension Perpendicular to Grain Strength of Wood, Laminated Veneer Lumber, and a Wood Plastic Composite.
 Tension Perpendicular to Grain Strength of Wood, Laminated Veneer Lumber, and a Wood Plastic Composite. Tracy Hummer, Research Assistant J. Daniel Dolan, Professor Michael Wolcott, Professor Wood Materials
Glulam Connection Details
 T E C H N I C A L N O T E Glulam Connection Details Note: This version is superseded by a more current edition. Check the current edition for updated design and application recommendations. ENGINEERED
A training course delivered at a company s facility by Matrix Engineering, an approved provider of Bolt Science Training
 A training course delivered at a company s facility by Matrix Engineering, an approved provider of Bolt Science Training Following is an outline of the material covered in the training course. Each person
EFFECT OF YARN CROSS-SECTIONAL SHAPES AND CRIMP ON THE MECHANICAL PROPERTIES OF 3D WOVEN COMPOSITES
 EFFECT OF YARN CROSS-SECTIONAL SHAPES AND CRIMP ON THE MECHANICAL PROPERTIES OF 3D WOVEN COMPOSITES S. Kari, M. Kumar, I.A. Jones, N.A. Warrior and A.C. Long Division of Materials, Mechanics & Structures,
Fastener Modeling for Joining Parts Modeled by Shell and Solid Elements
 2007-08 Fastener Modeling for Joining Parts Modeled by Shell and Solid Elements Aleander Rutman, Chris Boshers Spirit AeroSystems Larry Pearce, John Parady MSC.Software Corporation 2007 Americas Virtual
THE EFFECT OF THREAD GEOMETRY ON SCREW WITHDRAWAL STRENGTH
 THE EFFECT OF THREAD GEOMETRY ON SCREW WITHDRAWAL STRENGTH Doug Gaunt New Zealand Forest Research Institute, Rotorua, New Zealand ABSTRACT Ultimate withdrawal values for a steel 16mm diameter screw type
Development of Wooden Portal Frame Structures with Improved Columns
 Development of Wooden Portal Frame Structures with Improved Columns by Dr. Masahiro Noguchi Post Doctoral Fellow Tokyo Institute of Technology, Yokohama, Kanagawa, Japan Prof. dr. Kohei Komatsu Professor
Effect of finger length on fingerjoint strength in radiata pine
 Effect of finger length on fingerjoint strength in radiata pine Walford, G Bryan 1 SUMMARY Fingerjoints were cut in ten matched batches of dry 90x35 mm radiata pine by different manufacturers, using a
Experimental investigation of crack in aluminum cantilever beam using vibration monitoring technique
 International Journal of Computational Engineering Research Vol, 04 Issue, 4 Experimental investigation of crack in aluminum cantilever beam using vibration monitoring technique 1, Akhilesh Kumar, & 2,
EVALUATING ROLLING SHEAR STRENGTH PROPERTIES OF CROSS LAMINATED TIMBER BY TORSIONAL SHEAR TESTS AND BENDING TESTS
 EVALUATING ROLLING SHEAR STRENGTH PROPERTIES OF CROSS LAMINATED TIMBER BY TORSIONAL SHEAR TESTS AND BENDING TESTS Minghao Li 1, Frank Lam 2, and Yuan Li 3 ABSTRACT: This paper presents a study on evaluating
Title. CitationJournal of Wood Science, 58(4): Issue Date Doc URL. Rights. Type. File Information.
: Issue Date Doc URL. Rights. Type. File Information.") Title Effective lateral resistance of timber-plywood-timbe Author(s)Wanyama, Okumu Gordon; Sawata, Kei; Hirai, Takuro; K CitationJournal of Wood Science, 58(4): 315-321 Issue Date 2012-08 Doc URL http://hdl.handle.net/2115/50078
Title Effective lateral resistance of timber-plywood-timbe Author(s)Wanyama, Okumu Gordon; Sawata, Kei; Hirai, Takuro; K CitationJournal of Wood Science, 58(4): 315-321 Issue Date 2012-08 Doc URL http://hdl.handle.net/2115/50078
What happens to bolt tension in large joints?, Fasteners, Vol. 20, No. 3, 1965, Publication No. 286
 Lehigh University Lehigh Preserve Fritz Laboratory Reports Civil and Environmental Engineering 1965 What happens to bolt tension in large joints?, Fasteners, Vol. 20, No. 3, 1965, Publication No. 286 G.
A NEW MOTION COMPENSATION TECHNIQUE FOR INFRARED STRESS MEASUREMENT USING DIGITAL IMAGE CORRELATION
 A NEW MOTION COMPENSATION TECHNIQUE FOR INFRARED STRESS MEASUREMENT USING DIGITAL IMAGE CORRELATION T. Sakagami, N. Yamaguchi, S. Kubo Department of Mechanical Engineering, Graduate School of Engineering,
The predictive model for strength of inclined screws as shear connection in timber-concrete composite floor
 The predictive model for strength of inclined screws as shear connection in timber-concrete composite floor F. Moshiri, C. Gerber, H.R. Valipour, R. Shrestha & K.I. Crews Centre for built infrastructure,
ID-1223 Determination of delamination onset in composite laminates by application of acoustic emission INTRODUCTION
 ID-1223 Determination of delamination onset in composite laminates by application of acoustic emission Karol Kaczmarek ABB Corporate Research, Starowislna 13a, 31-038 Cracow, Poland SUMMARY: This paper
Simplified analysis of timber rivet connections
 Simplified analysis of timber rivet connections Stahl, Douglas C., 1 Begel, Marshall, 2 and Wolfe, Ronald W. 3 ABSTRACT Timber rivets, fasteners for glulam and heavy timber construction, have been used
STRESS DISTRIBUTION OF BOLTED JOINTS WITH DIFFERENT LAY-UP TYPES. H. Ahmad
 STRESS DISTRIBUTION OF BOLTED JOINTS WITH DIFFERENT LAY-UP TYPES H. Ahmad Faculty of Civil and Environmental Engineering, Universiti Tun Hussein Onn Malaysia, 86400 Parit Raja, Batu Pahat, Johor, Malaysia
GLUED SOLID TIMBER DUO/TRIO
 GLUED SOLID TIMBER DUO/TRIO THE DIMENSIONALLY STABLE AESTHETE. 01 AT A GLANCE AREAS OF APPLICATION Single and multiple family houses Multi-storey residential buildings Visual application with the highest
Investigations on specimen design and mounting for Split Hopkinson Tension Bar (SHTB) experiments
 experiments") EPJ Web of Conferences 94, 01049 (2015) DOI: 10.1051/epjconf/20159401049 c Owned by the authors, published by EDP Sciences, 2015 Investigations on specimen design and mounting for Split Hopkinson Tension
EPJ Web of Conferences 94, 01049 (2015) DOI: 10.1051/epjconf/20159401049 c Owned by the authors, published by EDP Sciences, 2015 Investigations on specimen design and mounting for Split Hopkinson Tension
1. Enumerate the most commonly used engineering materials and state some important properties and their engineering applications.
 Code No: R05310305 Set No. 1 III B.Tech I Semester Regular Examinations, November 2008 DESIGN OF MACHINE MEMBERS-I ( Common to Mechanical Engineering and Production Engineering) Time: 3 hours Max Marks:
ROBUST PARAMETER DESIGN AND FINITE ELEMENT ANALYSIS FOR A NON- PNEUMATIC TIRE WITH LOW VIBRATION
 Clemson University TigerPrints All Theses Theses 12-2009 ROBUST PARAMETER DESIGN AND FINITE ELEMENT ANALYSIS FOR A NON- PNEUMATIC TIRE WITH LOW VIBRATION Amarnath Proddaturi Clemson University, aprodda@clemson.edu
Comparison of behaviour of laterally loaded round and squared timber bolted joints
 Focussed on Modelling in Mechanics Comparison of behaviour of laterally loaded round and squared timber bolted joints Antonín Lokaj, Kristýna Klajmonová VŠB echnical University of Ostrava, Faculty of Civil
A Numerical Study of the Transverse Modulus of Wood as a Function of Grain Orientation and Properties
 Holzforschung, in press (6) A Numerical Study of the Transverse Modulus of Wood as a Function of Grain Orientation and Properties By J. A. Nairn 1 Wood Science & Engineering, Oregon State University, Corvallis,
Modelling of Rebar and Cable Bolt Behaviour in Tension/Shear
 University of Wollongong Research Online Coal Operators' Conference Faculty of Engineering and Information Sciences 2015 Modelling of Rebar and Cable Bolt Behaviour in Tension/Shear Xuwei Li University
(1) Brass, an alloy of copper and zinc, consists of 70% by volume of copper and 30% by volume of zinc.
 Brass, an alloy of copper and zinc, consists of 70% by volume of copper and 30% by volume of zinc.") PhysicsAndMathsTutor.com 1 Q1. (a) Define the density of a material....... (1) Brass, an alloy of copper and zinc, consists of 70% by volume of copper and 30% by volume of zinc. density of copper = 8.9
PhysicsAndMathsTutor.com 1 Q1. (a) Define the density of a material....... (1) Brass, an alloy of copper and zinc, consists of 70% by volume of copper and 30% by volume of zinc. density of copper = 8.9
Glued-in rods for timber structures An experimental study of softening behaviour
 Materials and Structures/Matériaux et Constructions, Vol. 34, May 2001, pp 228-234 SCIENTIFIC REPORTS Glued-in rods for timber structures An experimental study of softening behaviour E. Serrano Division
Bolt Material Types and Grades 1- Bolts made of carbon steel and alloy steel: 4.6, 4.8, 5.6, 5.8, 6.8, 8.8, 10.9 Nuts made of carbon steel and alloy
 Bolt Material Types and Grades 1- Bolts made of carbon steel and alloy steel: 4.6, 4.8, 5.6, 5.8, 6.8, 8.8, 10.9 Nuts made of carbon steel and alloy steel: 4, 5, 6, 8, 10, 12 2- Bolts made of stainless
Korean standards of visual grading and establishing allowable properties of softwood structural lumber
 Korean standards of visual grading and establishing allowable properties of softwood structural lumber Park, Moon-Jae 1, Shim, Kug-Bo 1 ABSTRACT Korean standards related to wood products such as "Sizes
Module 2 WAVE PROPAGATION (Lectures 7 to 9)
") Module 2 WAVE PROPAGATION (Lectures 7 to 9) Lecture 9 Topics 2.4 WAVES IN A LAYERED BODY 2.4.1 One-dimensional case: material boundary in an infinite rod 2.4.2 Three dimensional case: inclined waves 2.5
Module 2 WAVE PROPAGATION (Lectures 7 to 9) Lecture 9 Topics 2.4 WAVES IN A LAYERED BODY 2.4.1 One-dimensional case: material boundary in an infinite rod 2.4.2 Three dimensional case: inclined waves 2.5
THIN-WALLED HOLLOW BOLTS
 THIN-WALLED HOLLOW BOLTS Experimental and numerical study Teixeira, C. D. S. Department of Mechanical Engineering, Instituto Superior Técnico, Av. Rovisco Pais, 1049-001, Lisbon, Portugal, 2010 Abstract
Study of an interference fit fastener assembly
 Original Article HOME Proceedings of IDMME - Virtual Concept 2010 Bordeaux, France, October 20 22, 2010 assembly Manuel Paredes 1, Naoufel Nefissi 2, Marc Sartor 1 (1) : Université de Toulouse; INSA, UPS,
The fracture of wood under torsional loading
 J Mater Sci (2006) 41:7247 7259 DOI 10.1007/s10853-006-0913-y The fracture of wood under torsional loading Zheng Chen Æ Brian Gabbitas Æ David Hunt Received: 14 September 2005 / Accepted: 22 December 2005
EXPERIMENTAL INVESTIGATION OF ADHESIVE STRENGTHS OF ADHESIVELY BONDED JOINTS
 EXPERIMENTAL INVESTIGATION OF ADHESIVE STRENGTHS OF ADHESIVELY BONDED JOINTS Ki-Yeob Kang, Myung-Hyun Kim, Dong-Hyun Moon, Jae-Myung Lee Department of Naval Architecture and Ocean Engineering Pusan National
A novel procedure for evaluating the rotational stiffness of traditional timber joints in Taiwan
 Structural Studies, Repairs and Maintenance of Heritage Architecture IX 169 A novel procedure for evaluating the rotational stiffness of traditional timber joints in Taiwan W.-S. Chang, M.-F. Hsu & W.-C.
An experimental investigation on crack paths and fatigue behaviour of riveted lap joints in aircraft fuselage
 An experimental investigation on crack paths and fatigue behaviour of riveted lap joints in aircraft fuselage A. Skorupa 1, M. Skorupa 1, T. Machniewicz 1, A. Korbel 1 1 AGH University of Science and Technology,
1/2/2016. Lecture Slides. Screws, Fasteners, and the Design of Nonpermanent Joints. Reasons for Non-permanent Fasteners
 Lecture Slides Screws, Fasteners, and the Design of Nonpermanent Joints Reasons for Non-permanent Fasteners Field assembly Disassembly Maintenance Adjustment 1 Introduction There are two distinct uses
Monopile as Part of Aeroelastic Wind Turbine Simulation Code
 Monopile as Part of Aeroelastic Wind Turbine Simulation Code Rune Rubak and Jørgen Thirstrup Petersen Siemens Wind Power A/S Borupvej 16 DK-7330 Brande Denmark Abstract The influence on wind turbine design
Double Shear Testing of Bolts
 University of Wollongong Research Online Coal Operators' Conference Faculty of Engineering and Information Sciences 23 Double Shear Testing of Bolts N. Aziz University of Wollongong, naj@uow.edu.au D.
A training course delivered at a company s facility by Matrix Engineering, an approved provider of Bolt Science Training
 A training course delivered at a company s facility by Matrix Engineering, an approved provider of Bolt Science Training Following is an outline of the material covered in the training course. Each person
EFFECTS OF STITCH PATTERN ON THE MECHANICAL PROPERTIES OF NON-CRIMP FABRIC COMPOSITES
 EFFECTS OF STITCH PATTERN ON THE MECHANICAL PROPERTIES OF NON-CRIMP FABRIC COMPOSITES Leif E. Asp, Fredrik Edgren and Anders Sjögren SICOMP AB, P O Box 14, SE-431 22 Mölndal, Sweden ABSTRACT Mechanical
Precision Folding Technology
 Precision Folding Technology Industrial Origami, Inc. Summary Nearly every manufacturing process has experienced dramatic improvements in accuracy and productivity as well as declining cost over the last
EFFECTS OF GEOMETRY ON MECHANICAL BEHAVIOR OF DOVETAIL CONNECTION
 EFFECTS OF GEOMETRY ON MECHANICAL BEHAVIOR OF DOVETAIL CONNECTION Gi Young Jeong 1, Moon-Jae Park 2, KweonHwan Hwang 3, Joo-Saeng Park 2 ABSTRACT: The goal of this study is to analyze the effects of geometric
ENHANCEMENT OF THE TRANSMISSION LOSS OF DOUBLE PANELS BY MEANS OF ACTIVELY CONTROLLING THE CAVITY SOUND FIELD
 ENHANCEMENT OF THE TRANSMISSION LOSS OF DOUBLE PANELS BY MEANS OF ACTIVELY CONTROLLING THE CAVITY SOUND FIELD André Jakob, Michael Möser Technische Universität Berlin, Institut für Technische Akustik,
Three-dimensional finite element analysis of the Japanese traditional post-and-beam connection
 J Wood Sci (2011) 57:119 125 The Japan Wood Research Society 2010 DOI 10.1007/s10086-010-1151-0 ORIGINAL ARTICLE Jung-Pyo Hong J. David Barrett Frank Lam Three-dimensional finite element analysis of the
INFLUENCE OF PILES ON LOAD- SETTLEMENT BEHAVIOUR OF RAFT FOUNDATION
 INFLUENCE OF PILES ON LOAD- SETTLEMENT BEHAVIOUR OF RAFT FOUNDATION BALESHWAR SINGH Department of Civil Engineering Indian Institute of Technology Guwahati Guwahati 78139, India NINGOMBAM THOIBA SINGH
The University of Nottingham School of Mechanical, Materials and manufacturing Engineering
 The University of Nottingham School of Mechanical, Materials and manufacturing Engineering Project Title: Introduction of a segmented Blank Holder to press forming of Carbon Fibre composites Student: Simon
THE OPTIMISED POST-FITTED FOAM SANDWICH INSERT
 THE OPTIMISED POST-FITTED FOAM SANDWICH INSERT Håkan Johansson Ballonggatan 11, SE-169 71 Solna, Sweden e-mail: hakan@composult.se, web page: http://www.composult.se ABSTRACT One of the biggest difficulties
Studies on free vibration of FRP aircraft Instruments panel boards
 89 Studies on free vibration of FRP aircraft Instruments panel boards E. Chandrasekaran Professor in Dept. of Civil Engineering, Crescent Engineering College 648 India. e-mail: sekharan@vsnl.net and K.
Prediction Of Thrust Force And Torque In Drilling On Aluminum 6061-T6 Alloy
 Prediction Of Thrust Force And Torque In Drilling On Aluminum 6061-T6 Alloy P. Kishore Kumar 1 ; Dr. K. Kishore 2 ; Prof. P. Laxminarayana 3 ; Anurag group of Institutions Vasavi College of Engineering
Load-carrying capacity of timber frame diaphragms with unidirectional support
 Load-carrying capacity of timber frame diaphragms with unidirectional support Jørgen Munch-Andersen, Danish Timber Information, 2012-06-26 Introduction The rules for determining the load-carrying capacity
CHAPTER 5 FAULT DIAGNOSIS OF ROTATING SHAFT WITH SHAFT MISALIGNMENT
 66 CHAPTER 5 FAULT DIAGNOSIS OF ROTATING SHAFT WITH SHAFT MISALIGNMENT 5.1 INTRODUCTION The problem of misalignment encountered in rotating machinery is of great concern to designers and maintenance engineers.
Model Correlation of Dynamic Non-linear Bearing Behavior in a Generator
 Model Correlation of Dynamic Non-linear Bearing Behavior in a Generator Dean Ford, Greg Holbrook, Steve Shields and Kevin Whitacre Delphi Automotive Systems, Energy & Chassis Systems Abstract Efforts to
EFFECT OF HOLE CLEARANCE ON BOLT LOADS IN PULTRUDED GRP TENSION JOINTS
 16 TH INTERNATIONAL CONFERENCE ON COMPOSITE MATERIALS EFFECT OF HOLE CLEARANCE ON BOLT LOADS IN PULTRUDED GRP TENSION JOINTS Geoffrey J Turvey*, Pu Wang** *Lancaster University, **Schlumberger Keywords:
A STUDY ON PATTERN DAMAGE OF FINGER JOINTS IN BAMBOO LAMINATED BEAMS
 A STUDY ON PATTERN DAMAGE OF FINGER JOINTS IN BAMBOO LAMINATED BEAMS Agus Rivani * * Abstract The aim of this study was to know the pattern damage of finger joints in bamboo laminated beams. The dimension
A Numerical study on proper mode and frequency selection for riveted lap joints inspection using Lamb waves.
 More Info at Open Access Database www.ndt.net/?id=18676 A Numerical study on proper mode and frequency selection for riveted lap joints inspection using Lamb waves. Mohammad. (. SOORGEE Nondestructive
Module 10 : Improvement of rock mass responses. Content
 IMPROVEMENT OF ROCK MASS RESPONSES Content 10.1 INTRODUCTION 10.2 ROCK REINFORCEMENT Rock bolts, dowels and anchors 10.3 ROCK BOLTING MECHANICS Suspension theory Beam building theory Keying theory 10.4
Operating & Maintenance Instructions 320 Dome Blowing Unit
 Operating & Maintenance Instructions 320 Dome Blowing Unit Table of Contents 1. On Delivery... 2 2. General Information... 3 3. Dome Blowing Technique... 4 4. Other Shapes... 6 5. Machine Maintenance...
Numerical and Experimental Investigation of Paperboard Creasing and Folding
 Numerical and Experimental Investigation of Paperboard Creasing and Folding Hui Huang Licentiate Thesis No. 111, 2011 KTH School of Engineering Science Department of Solid Mechanics BiMaC Innovation Royal
Dicing Through Hard and Brittle Materials in the Micro Electronic Industry By Gideon Levinson, Dicing Tools Product Manager
 Dicing Through Hard and Brittle Materials in the Micro Electronic Industry By Gideon Levinson, Dicing Tools Product Manager A high percentage of micro electronics dicing applications require dicing completely