UConn Student Managed Fund 2017 Analyst Report. Taishi Kato and Tommy Stodolski
|
|
|
- Sandra Morton
- 6 years ago
- Views:
Transcription


1 UConn Student Managed Fund 2017 Analyst Report Taishi Kato and Tommy Stodolski
2 1 TABLE OF CONTENTS Report Highlights... 2 Business Description... 2 Business Overview: Developing into an Interactive Entertainment Company... 2 Industry and Competitive Positioning... 3 Industry Overview: An Industry that is Constantly Evolving... 3 Competitive Landscape: A Fragmented Marked Based on Brand Recognition... 3 Investment Thesis... 4 Dominant Franchise Names and Brand Leadership... 4 Expansion in Growth Markets... 4 Shifts Towards New Distribution Channels... 6 Favorable Shareholder Return Policies... 6 Financial Analysis... 6 Sales and Income... 6 Liquidity and Leverage... 6 Valuation... 7 Discounted Cash Flow Model... 7 Investment Risks... 8 Dependence on Small Number of Franchises... 8 Delivery of High-Quality Content... 8 Conclusion... 8
 Recommendation: BUY Ticker: ATVI Target Price: $58 (18% Margin of Safety) Market Capitalization: $37.")

3 2 Activision Blizzard, Inc. Sector: Technology Exchange: NASDAQ Date: 04/18/2017 Current Price: $49.09 (4/18/2017) Recommendation: BUY Ticker: ATVI Target Price: $58 (18% Margin of Safety) Market Capitalization: $37.3B Figure 1 Share Price Source: Bloomberg Figure 2 Company Breakdown Report Overview We recommend a Buy rating for Activision Blizzard, Inc. based on a target price of $58 per share. Our target price offers an 18% margin of safety from its closing price of $49.09 on April 18, Our investment thesis is primarily driven by the following factors: Dominant Franchise Names and Brand Leadership Through its Activision and Blizzard segments, the company s assets provide a strong franchise legacy, which potentially lead to more stable sales and lower costs Strong Positioning in Growth Markets Activision Blizzard is making strategic investments in ESports, mobile video games, and film and television content, which will diversify its revenue base in the future. Shift to New Distribution Channels The video game industry is experiencing a distribution transformation as customers are demanding digital format games, which are less expensive to produce, allowing Activision to increase margins. Undervalued Using a discounted cash flow model we calculated Activision Blizzard s intrinsic value to be $58 per share. Business Description Figure 3 Company Metrics Business Overview: Developing into an Interactive Entertainment Company Activision Blizzard, Inc., is a worldwide leader in the development and publishing of online, personal computer (PC), video game console, mobile, and tablet games. The company operates through three main segments: Activision Publishing, Blizzard Entertainment, and the recently acquired King Digital Entertainment as of The company has many prestigious game franchise (iterations of games and associated merchandise) between these business segments. Activision, known for franchises such as Call of Duty, develops and publishes interactive software products with a focus on the video game console. Blizzard Entertainment, publishes online subscription-based, multiplayer online role-playing games such as World of Warcraft, Hearthstone, and Overwatch. King Digital Entertainment products mobile games such as the Candy Crush series. The company sells their developed and published products through retail and digital channels with a greater emphasis on digital channels of late. In addition to these three main business segments, their Major League Gaming


4 3 Figure Sales by Technological Medium Source: Newzoo Figure 5 Market Share of Leading Video Game Software Publishers Source: IBISWorld Figure 6 Best-Selling Games of 2016 segment and Activision Blizzard Studios are recently developed segments that allows the company to expand into the ESports and film industries. Industry and Competitive Positioning Industry Overview: An industry that is constantly evolving The video game software industry develops, publishes, manufactures, distributes and sells interactive entertainment for various consoles, handheld platforms and computers. Filled with constant innovation, technological progress and originality, the market is one of the fastest growing industries with annual sales over $99.6 billion. In terms of where the sales are generated in this industry, Figure 4 depicts the breakdown by technological medium. As you can see, about 32% of video game sales come from the PC market, the largest share in the industry. The entertainment screen, which constitutes console based games that are played on television is also very important to the industry with about 29% of sales. Finally, personal screens, such as smartphones and watches take about 27% of the market. Additionally, this segment is one of the fastest growing in the industry and is expected to reach $52.6 billion in sales by 2020 according to a PWC research report. Competitive Landscape: A fragmented market based on brand recognition The software publishing market has relatively high development cost, which act as barriers to entry. Since the cost of game development is one of the highest in the entertainment industry, initial investments by smaller companies have historically had negative returns, according to a report done by the Entertainment Software Association. This serves to ward off potential entrants in Activision Blizzard s market since these companies do not have the necessary financial backing to sustain in such a hit-or-miss industry. While there are a wide variety of content providers in the industry, only a limited amount maintains the largest portion of market share. As you can see in Figure 5, Activision Blizzard leads the market with a 14% share. Although Sony Corp. and Microsoft Corp. compete heavily with Activision Blizzard, its closest competitors are Electronic Arts, Inc. and Take Two Interactive Software, Inc. An important aspect of this industry is the brand recognition of the publishing house and the portfolio of products it holds. If a game becomes successful, it often spurs sequels since the risk of failure becomes reduced due to a developed fan base. Additionally, as publishers become successful with a series system of video games, logistical economies of scale and production economies of scale generate less development costs for future games. Considering Activision Blizzard has a product portfolio filled with very reputable franchises across a diverse range of genres, we see them in a unique position to use their brand power for continued growth in the future. Source: Forbes


 game strategy, with games such as World of Warcraft, Hearthstone and most recently Overwatch.")
5 Below is a chart showing the strengths and weaknesses of Activision Blizzard s closest competitors: 4 Figure 7 Activision Franchise Figure 8 Blizzard Franchise Investment Thesis Figure 9 Blizzard Franchise Dominant Franchise Names and Brand Leadership Activision Blizzard s portfolio holds some of the strongest franchises in the video game industry. The company has two different business models that it uses with its Activision Publishing and Blizzard Entertainment segments. Activision Publishing is based on developing sequels, expansions and special editions to its highly successful assets such as Call of Duty, Skylanders and Destiny. This strategy results in very stable revenue streams because of the developed fan base these games have had historically. Blizzard Entertainment on the other hand is driven using a massively multiplayer online (MMO) game strategy, with games such as World of Warcraft, Hearthstone and most recently Overwatch. With an MMO model, players pay a monthly fee for access to the game, which is used to fund additions and server maintenance. This allows for players to pay and play for much longer periods of time than traditional single release games. This business model is relatively new, but has gained massive popularity among video game enthusiasts due to the constant stream of new content and social aspect of playing a game that is populated largely by other players. Additionally, the updates Blizzard has to develop for these games are far less labor intensive, which leads to lower costs when compared to developing a new game from the ground up allowing the company to utilize a razor blade business model with these updates. Expansion in Growth Markets ESports The market for ESports has experienced tremendous growth since 2015 and is expected to continue grow into the distant future. ESports are multiplayer video games played competitively for spectators, typically by professional gamers. In 2017,


6 5 Figure 10 ESports Estimated Sales Growth ($MM) Source: Newzoo Figure 11 ESports Estimated Audience Growth (MM) Source: Newzoo Figure 12 Estimated Mobile Sales Growth ($B) Source: Newzoo ESports revenue is expected to grow to $696 million, representing a year-over-year growth of 41.3%. Additionally, total revenues from ESports are expected to grow at a 35.6% CAGR through Brands are also expected to invest $517 million this year. The investments can be broken down into $155 million on advertising, $266 million on sponsorship, and $95 million on media rights. Brand investments are predicted to double by 2020, pushing the total market to $1.5 billion. Consumer spending in 2017 will amount to roughly $64 million on purchases of tickets and merchandise. With the growing popularity of ESports, they are becoming engrained in the DNA of successful competitive games and publishers are actively looking to grow their franchises as spectator sports, with the aim to engage their current fan base. The global ESports audience is expected to reach 385 million in 2017, which consists of 191 million enthusiasts and 194 million from occasional viewers. Audience growth is expected to continue at a 20.1% CAGR through 2020 equaling a total of roughly 589 million viewers. Based on the audience and revenue expectations for this year, the average revenue per fan this year will equal $3.64. As the industry matures, it will incorporate an increasing number of local events, leagues, and media rights deals, which would boost the average revenue per fan to an estimated $5.20 by Although this is still three factors lower than the popular National Basketball Association, it offers additional revenue streams for companies such as Activision, who invest in platforms that can take advantage of ESports. In January 2016, Activision acquired a professional ESports organization called Major League Gaming Inc. (MLG). MLG is known as the global leader in ESports and operates MLG.tv, the number one online broadcast network for professional level gaming. It also operates the MLG Pro Circuit, which is the longest-running ESports league in North America and currently has over 9 million registered users across the globe. Activision intends to leverage the purchase as part of its plan to build an ESports-focused television network. Another factor that will facilitate Activision s transition into ESports is their recently released game, Overwatch. Overwatch is one of the fastest growing video games in the world with 25 million registered users in less than a year. Activision has announced its intention to create an Overwatch League with the MLG arm of the company to garner sales from audiences and franchising fees. Mobile Gaming With the growing popularity of large screen smartphones, the mobile gaming market reached $37 billion in This represented 37% of the global games market and grew larger than PC games ($32 billion) and console games ($29 billion) for the first time. Mobile gaming is expected to grow at a 12.5% CAGR through Activision is well positioned to take advantage of this growth with its recent acquisition of King Digital Entertainment, whose Candy Crush franchise consists of 2 of the top 10 grossing mobile games in the U.S. for 13 straight quarters. Currently, the Candy Crush franchise does not contain in-game advertisements that many other free-to-play games contain. The company has announced at the end of 2016 that they are testing in-game advertisements and have received positive feedback from consumers. When the advertisements are implemented into the Candy Crush games, Activision will generate additional revenue. Additionally, the transition into the mobile gaming market diversifies Activision s revenue stream away from the traditional console and
 Source: Forbes Figure 14 5 Year Sales and Net Income ($MM) Figure 15 6 Year Current Ratio Shift Towards New Distribution Channels Through")

7 PC software. Now the company s revenues are more diversified with 39% coming from Blizzard, 36% from Activision, and 25% from King. 6 Figure 13 Video Game Sales by Distribution Channel (%) Source: Forbes Figure 14 5 Year Sales and Net Income ($MM) Figure 15 6 Year Current Ratio Shift Towards New Distribution Channels Through technological advancements in programming and data management, playing video games digitally has now become possible, just in the way it become possible to download music in the early 2000 s. While this channel of distribution is relatively new, it is constantly growing and has recently surpassed sales of physical copies in 2015, as Figure 13 shows. With expectations of digital distribution to become the industry norm for consumers, Activision Blizzard stands to benefit substantially for two reasons. Firstly, the costs for manufacturing the actual video game will become lower and intermediation between consumers will reduce, which is expected to increase the gross margins for the company. Secondly, digital distribution also means that developers can continuing working on products past official release dates. This allows Activision to have a permanent connection with consumers, developing certain add-ons or patches, increasing the company s brand reputation. Favorable Shareholder Return Policies Activision Blizzard has recently started to focus on shareholders, which will provide investors additional returns in the future. The company s dividend rate has been steadily increasing since 2010 and just recently was upped to 30 cents per share for Additionally, the Board of Directors authorized a $1 billion stock-buyback program, with an expiration date of February of Through these policies, management has shown that they constantly evaluate returning capital to shareholders. With this in mind, we believe Activision Blizzard will provide investors with additional returns in the future. Financial Analysis Sales and Income While revenue for Activision Blizzard has been growing in the past five years, income has plateaued due to the various investments the company is making in ESports and film studio development. As Figure 14 displays, revenues leveled off from 2012 to 2015 due to weakness in sales from the Call of Duty Franchise. But, with the acquisition of King Digital in 2015, revenues dramatically increased 42% from the new segment of mobile users (10% organically). With little growth in income, the margin for Activision has decreased to 15% in 2016 from constant results in the low 20% range. However, we expect income and margins to increase in the future based on the company s new growth initiatives, and also from the continuing shift of video games through digital distribution channels since it becomes significantly less expensive when compared to physical distribution. Liquidity and Leverage Activision Blizzard maintains a strong balance sheet, and we expect management to continue this trend in the coming years. With regards to liquidity, Figure 15 shows the company s current ratio, which depicts a drop from 2013 to 2015, but then steadily rises in This was due to the company s acquisitions in 2014 and 2015.


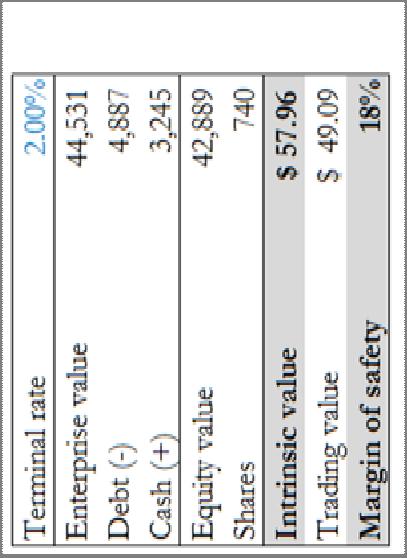
8 7 Figure 16 6 Year Debt to Equity (%) From a leverage prospective, the company has experienced large swings on account of its repurchase of shares from Vivendi in 2013 and the King Digital acquisition in Additionally, the company has a relatively high level of interest coverage with its strong cash flow generation. With management appearing confident about the company s financial position, we expect these metrics to continue to improve as the company will generate higher levels of cash flow and pay back its debt. Valuation Figure 17 DCF Sensitivity Table Source: Analyst Projections Discounted Cash Flow Model Using a discounted cash flow model, Activision Blizzard is worth approximately $58 per share, which is an 18% margin of safety from the current price. This model assumes an initial jump in sales for the first couple of years from the expansion in mobile from the King Digital acquisition and also from the company s developments in ESports. By 2019, we assume growth of sales in line with historical growth statistics. Another significant assumption we made was an increase in gross margins with increases to 69% as the company continues to shift towards digital distribution. As the company offers digitally downloadable content, which can potentially lead to higher margins, our assumption is most likely conservative. In regards to the terminal growth rate, we assume a rate of 2%, which is right in line with the United States long-term GDP growth rate. Our estimated intrinsic value assumes a discount rate of 8.3%, which was adjusted using a debt adjustment factor since we do not project the low interest rate climate will persist in the future. Finally, using a sensitivity analysis with terminal growth rates and discount rates as the variables, we calculated a price range of $54.32-$62.20 per share. Figure 18 Discounted Cash Flow Model
9 8 Competitive Advantage Insight: CEO Biography Robert Kotick has built Activision Blizzard into the largest interactive entertainment company in the world. Growing up, Kotick credits his role model Steve Jobs for dropping out of college to pursue his entrepreneurial interests in the software business. After receiving start-up capital from casino mogul Steve Wynn in 1983, Kotick started his company jointly developing games for various publishing companies including Electronic Arts. It was not until 1990 when Kotick purchased a 25% stake in Activision (then called Mediagenic) for $400,000 and started creating original and sequel products with his own development team. He has stated that the reason behind this purchase was the opportunity to remake classic Activision games, which proved to be successful once Kotick started the process for the company s old assets. By the early 2000 s, Kotick built Activision into a company with household franchise names such as Tony Hawk s Pro Skater, Call of Duty, and Guitar Hero. We see Kotick as an additional competitive advantage to the company, leading both the creative and management efforts moving forward. His ingenuity in developing video games and enterprising spirit lead us to conclude that Activision Blizzard s success should partly be contributed to Kotick s ability to develop and produce interactive entertainment products. Just like Walt Disney was seen as a pioneer in the animation industry and Kotick s hero, Steve Jobs was in the computer industry, Robert Kotick will be credited for the tremendous achievements he made in this industry in the forthcoming years. Additionally, with Kotick at 54 years old, he is expected to operate the company in the foreseeable future. Investment Risks Dependence on Small Number of Franchises Activision has faces the risk that their revenue is dependent on a small number of franchises. Call of Duty, World of Warcraft, Skylanders, and Destiny have accounted for approximately 71% of net revenues. However, Activision has actively sought to mitigate this risk. They have expanded into the mobile video game market with their acquisition of King Digital Entertainment. This provides a reliable source of cash flow from an established Candy Crush series. In 2016, King contributed greatly, making up 25% of Activision s net revenues. Additionally, the development of the game Overwatch generated over $1 billion in revenue in The success of Overwatch, coupled with the acquisition of King has resulted in a total of seven $1 billion and growing franchises across their portfolio of IP. Delivery of High-Quality Content In the video game industry, it is difficult to predict how well new content will be received. Therefore, new developments can result in less than expected sales for Activision. The company released Call of Duty: Infinite Warfare in 2016, which featured a more futuristic theme than previous games. Even though the company experienced high sales, the game was not well received by fans, however, Activision is receptive to the gaming community and has announced that the 2017 iteration of the game will go back to the franchise s roots. Conclusion To conclude, we believe Activision Blizzard, Inc. is a Buy, with a target price of $58 per share, providing an 18% margin of safety. In our eyes, the company has a powerful competitive advantage with its critically acclaimed franchise name and because of the company s CEO; Robert Kotick. Additionally, we also believe the company s expansion into growth markets such as ESports and mobile gaming will allow for larger growth in the future, with more diversified sources of sales. Finally, we believe the company will improve costs from the industry shift to digital gaming, eventually leading to growth and higher returns for shareholders. The company is transforming itself into an all-encompassing interactive entertainment company, which we believe will help the company prosper in the future.

10 Appendix 1: Income Statement 9


11 10 Appendix 2: Balance Sheet Appendix 3: Balance Sheet Contd.

12 Appendix 4: Statement of Cash Flow 11


13 12 Appendix 5: Discounted Cash Flow
14 13 Appendix 6: Net Working Capital and CAPEX Projections
ACTIVISION BLIZZARD ANNOUNCES BETTER-THAN-EXPECTED SECOND QUARTER 2011 FINANCIAL RESULTS
 Contacts: Kristin Southey SVP, Investor Relations (310) 255-2635 ksouthey@activision.com Maryanne Lataif SVP, Corporate Communications (310) 255-2704 mlataif@activision.com FOR IMMEDIATE RELEASE ACTIVISION
Electronic Arts Inc. January 18th, Michael Gude Portfolio Manager. Chase Westenfelder Quantitative Model Developer
 Electronic Arts Inc. EA January 18th, 2018 Michael Gude Portfolio Manager Chase Westenfelder Quantitative Model Developer Taylor Crawford Private Equity Analyst Table of Contents Investment Thesis Competitor
Nishant l33t Verma 33 Rachel pwn Nabatian Weiye noob Zhang
 Nishant l33t Verma 33 Rachel pwn Nabatian Weiye noob Zhang Company Overview Thesis Blizzard Synergies Solid Pipeline e 09 10 0 Competitive Advantage Risks DCF World s largest third party game publisher
The Reed Report. Company Spotlight Take Two Interactive 11/29/2016
 The Reed Report Company Spotlight Take Two Interactive 11/29/2016 Business Overview Take Two Interactive Software (Ticker: TTWO) ( Take Two ) is a leading developer, publisher and marketer of interactive
ESPORTS GLOBAL ESPORTS MARKET REPORT
 ESPORTS 2016 2016 GLOBAL ESPORTS MARKET REPORT TRENDS, REVENUES & AUDIENCE TOWARD 2019 ESPORTS 2016 CONTENTS 1. Introduction, Scope & Definitions 3 2. Global Esports Trends 11 3. Esports Events 23 4. Global
Second Quarter CY 2012 Results. August 2, 2012
 Second Quarter CY 2012 Results August 2, 2012 1 Safe Harbor Disclosure Please review our SEC filings on Form 10-K and Form 10-Q The statements contained in this presentation that are not historical facts
Third Quarter CY 2010 Results. November 04, 2010
 Third Quarter CY 2010 Results November 04, 2010 Safe Harbor Disclosure The statements contained in this presentation that are not historical facts are forward-looking statements. The company generally
Strategic Assessment of Worldwide esports Market Forecast Till 2021
 Report Information More information from: https://www.wiseguyreports.com/reports/402152-strategic-assessment-of-worldwide-esports-marketforecast-till-2021 Strategic Assessment of Worldwide esports Market
Third Quarter 2014 Results
 Third Quarter 204 Results November 4, 204 Safe Harbor Disclosure Please review our SEC filings on Form 0-K and Form 0-Q The statements contained in this presentation that are not historical facts are forward-looking
Activision Blizzard Reports December Quarter and Calendar Year 2009 Financial Results
 Activision Blizzard Reports December Quarter and Calendar Year 2009 Financial Results - Company Announces $1 Billion Share Repurchase Program - - Annual Cash Dividend of $0.15 per Common Share - - For
Rovio Entertainment Corporation Annual General Meeting April 9, 2019 CEO REVIEW Kati Levoranta
 Rovio Entertainment Corporation Annual General Meeting April 9, 2019 CEO REVIEW Kati Levoranta TRANSLATED FROM THE FINNISH ORIGINAL Translated from the Finnish original. Finnish version prevails. Contents
First Quarter 2014 Results
 First Quarter 04 Results May 6, 04 Safe Harbor Disclosure Please review our SEC filings on Form 0-K and Form 0-Q The statements contained in this presentation that are not historical facts are forward-looking
First Quarter 2013 Results May 8, 2013
 First Quarter 2013 Results May 8, 2013 Safe Harbor Disclosure Please review our SEC filings on Form 10-K and Form 10-Q The statements contained in this presentation that are not historical facts are forward-looking
Fourth Quarter 2013 Results. February 6, 2014
 Fourth Quarter 2013 Results February 6, 2014 Safe Harbor Disclosure Please review our SEC filings on Form 10-K and Form 10-Q The statements contained in this presentation that are not historical facts
ACTIVISION BLIZZARD ANNOUNCES THIRD-QUARTER 2018 FINANCIAL RESULTS. Better-Than-Expected Q3 Results
 ACTIVISION BLIZZARD ANNOUNCES THIRD-QUARTER 2018 FINANCIAL RESULTS Better-Than-Expected Q3 Results Santa Monica, CA November 8, 2018 Activision Blizzard, Inc. (Nasdaq: ATVI) today announced third-quarter
Second Quarter 2013 Results August 1, 2013
 Second Quarter 203 Results August, 203 2 Safe Harbor Disclosure Please review our SEC filings on Form 0-K and Form 0-Q The statements contained in this presentation that are not historical facts are forward-looking
Safe Harbor Disclosure
 Safe Harbor Disclosure Please review our SEC filings on Form 10-K and Form 10-Q The statements contained in this presentation that are not historical facts are forward-looking statements. The company generally
Global Esports Market: Size, Trends & Forecasts ( Edition) May 2018
 May 2018") Global Esports Market: Size, Trends & Forecasts (2018-2022 Edition) May 2018 Global Esports Market: Coverage Executive Summary and Scope Introduction/Market Overview Market Analysis Regional Analysis Competitive
Global Esports Market: Size, Trends & Forecasts (2018-2022 Edition) May 2018 Global Esports Market: Coverage Executive Summary and Scope Introduction/Market Overview Market Analysis Regional Analysis Competitive
Activision Blizzard Announces Record First Quarter Financial Results
 Activision Blizzard Announces Record First Quarter Financial Results - Q1 and EPS Ahead of Prior Year and Prior - - Q1 GAAP EPS Increased 40% and Non-GAAP EPS Up 44% Over Prior Year - - Q1 from Digital
Activision Blizzard, Inc. ATVI NASDAQ Neutral-2
 COMPANY UPDATE / ESTIMATE CHANGE / RATING CHANGE Key Metrics ATVI - NASDAQ (as of 11/7/17) $60.96 Price Target N/A 52-Week Range $35.12 - $67.03 Shares Outstanding (mil) (basic) 755 Market Cap. ($mil)
Activision Blizzard, Inc. ATVI NASDAQ Neutral-2
 COMPANY UPDATE / ESTIMATE CHANGE Key Metrics ATVI - NASDAQ (as of 2/12/18) $68.32 Price Target N/A 52-Week Range $44.47 - $74.94 Shares Outstanding (mil) (basic) 757 Market Cap. ($mil) $51,718 3-Mo. Average
Third Quarter CY 2012 Results
 Third Quarter CY 2012 Results November 7, 2012 2012 Activision Blizzard 1 Safe Harbor Disclosure Please review our SEC filings on Form 10-K and Form 10-Q The statements contained in this presentation that
Fourth Quarter 2015 Results. February 11, 2016
 Fourth Quarter 05 Results February, 06 Safe Harbor Disclosure Please review our SEC filings on Form 0-K and Form 0-Q The statements contained in this presentation that are not historical facts are forward-looking
KKR & Co. Inc. Goldman Sachs U.S. Financial Services Conference December 4, 2018
 KKR & Co. Inc. Goldman Sachs U.S. Financial Services Conference December 4, 2018 KKR Today Private Markets Public Markets Capital Markets Principal Activities $104bn AUM $91bn AUM Global Franchise $19bn
Second Quarter CY 2010 Results. August 05, 2010
 Second Quarter CY 2010 Results August 05, 2010 Safe Harbor Disclosure The statements contained in this presentation that are not historical facts are forward-looking statements. The company generally uses
First Quarter CY 2012 Results. May 9, 2012
 First Quarter CY 2012 Results May 9, 2012 2012 Activision Blizzard 1 Safe Harbor Disclosure Please review our SEC filings on Form 10-K and Form 10-Q The statements contained in this presentation that are
Capcom Co., Ltd. (Tokyo Stock Exchange, First Section, 9697) Overview of Strategies and Plans Fiscal Year ending March 31, 2019
 Overview of Strategies and Plans Fiscal Year ending March 31, 2019") Capcom Co., Ltd. (Tokyo Stock Exchange, First Section, 9697) Overview of Strategies and Plans Fiscal Year ending March 31, 2019 0 0 Forward-looking Statements Strategies, plans, outlooks and other statements
Capcom Co., Ltd. (Tokyo Stock Exchange, First Section, 9697) Overview of Strategies and Plans Fiscal Year ending March 31, 2019 0 0 Forward-looking Statements Strategies, plans, outlooks and other statements
Activision Blizzard Announces Better-Than-Expected Second Quarter 2012 Financial Results
 Activision Blizzard Announces Better-Than-Expected Second Quarter 2012 Financial Results Company Had The Top Three Best-Selling Games in North America and Europe For First Six Months of 20121 SANTA MONICA,
Activision Blizzard Announces Better-than-expected First Quarter 2012 Financial Results
 Activision Blizzard Announces Better-than-expected First Quarter 2012 Financial Results - Skylanders Spyro's Adventure was #1 Kids Video Game for First Quarter 2012 with 30+ Million Toys Sold Life to Date
Second Quarter 2015 Results
 Second Quarter 205 Results August 4, 205 Safe Harbor Disclosure Please review our SEC filings on Form 0-K and Form 0-Q The statements contained in this presentation that are not historical facts are forward-looking
Second Quarter 2014 Results
 Second Quarter 2014 Results August 5, 2014 Safe Harbor Disclosure Please review our SEC filings on Form 10-K and Form 10-Q The statements contained in this presentation that are not historical facts are
First Quarter 2017 Results. May 4, 2017
 First Quarter 207 Results May 4, 207 Safe Harbor Disclosure Please review our SEC filings on Form 0-K and Form 0-Q The statements contained herein that are not historical facts are forward-looking statements,
Take-Two Interactive Software, Inc.
 Take-Two Interactive Software, Inc. (NASDAQ: TTWO) Wedbush Technology, Media & Telecommunications Conference March 7, 2012 Forward-Looking Statements The statements contained herein which are not historical
Capcom Co., Ltd. (Tokyo Stock Exchange, First Section, 9697) 3rd Quarter Report Fiscal year ending March 31, 2019
 3rd Quarter Report Fiscal year ending March 31, 2019") Capcom Co., Ltd. (Tokyo Stock Exchange, First Section, 9697) 3rd Quarter Report Fiscal year ending March 31, 2019 0 Contents page 1. Forecasts for FY3/19 2 2. Financial Highlights 3 3. Business Segment
Capcom Co., Ltd. (Tokyo Stock Exchange, First Section, 9697) 3rd Quarter Report Fiscal year ending March 31, 2019 0 Contents page 1. Forecasts for FY3/19 2 2. Financial Highlights 3 3. Business Segment
ACTIVISION BLIZZARD ANNOUNCES AGREEMENT TO ACQUIRE KING DIGITAL ENTERTAINMENT AND BETTER-THAN-EXPECTED THIRD QUARTER 2015 FINANCIAL RESULTS
 ACTIVISION BLIZZARD ANNOUNCES AGREEMENT TO ACQUIRE KING DIGITAL ENTERTAINMENT AND BETTER-THAN-EXPECTED THIRD QUARTER 05 FINANCIAL RESULTS Company Increases CY 05 Revenues and EPS Outlook Company Delivered
Activision Blizzard Announces Better-Than-Expected Third Quarter CY 2009 Financial Results
 Activision Blizzard Announces Better-Than-Expected Third Quarter CY 2009 Financial Results - Company Calendar Year Financial Outlook Remains Unchanged - SANTA MONICA, Calif., Nov 05, 2009 /PRNewswire-FirstCall
To Our Shareholders 2 SQUARE ENIX CO., LTD.
 To Our Shareholders I am proud to present the annual report of SQUARE ENIX for fiscal 2004, ended March 31, 2005. Fiscal 2004 was the Company s second year of business since we were formed through the
Kristin Southey Senior Vice President Investor Relations and Treasury
 Kristin Southey Senior Vice President Investor Relations and Treasury Safe Harbor Disclosure The statements contained in this presentation that are not historical facts are forward-looking statements.
E-Sports: An Olympic Sized Opportunity
 E-Sports: An Olympic Sized Opportunity Early Days in a Fast Growing Phenomenon In mid-january 2018, Activision Blizzard s Overwatch League made its debut, with 12 franchises representing major cities around
ACTIVISION BLIZZARD ANNOUNCES BETTER-THAN-EXPECTED SECOND QUARTER 2015 FINANCIAL RESULTS
 FOR IMMEDIATE RELEASE ACTIVISION BLIZZARD ANNOUNCES BETTER-THAN-EXPECTED SECOND QUARTER 05 FINANCIAL RESULTS Company Increases CY 05 Revenues and EPS Outlook Once Again Company Delivered Record Q Non-GAAP
FREE VERSION 2017 GLOBAL ESPORTS TRENDS, REVENUES, AND AUDIENCE TOWARD 2020 MARKET REPORT
 FREE VERSION TRENDS, REVENUES, AND AUDIENCE TOWARD 2020 2017 GLOBAL ESPORTS MARKET REPORT ESPORTS 2017 AUDIENCE TABLE OF CONTENTS 1 INTRODUCTION 4 2 A SNAPSHOT OF 8 KEY TRENDS 3 THE GLOBAL 12 ESPORTS MARKET
Activision Blizzard Announces Better-Than-Expected First Quarter CY 2009 Financial Results
 Activision Blizzard Announces Better-Than-Expected First Quarter CY 2009 Financial Results First Quarter Net Revenues and EPS Significantly Ahead of Prior Outlook Company Increases CY 2009 Net Revenues
Activision Blizzard Announces Better-Than-Expected Second Quarter CY 2009 Financial Results
 Activision Blizzard Announces Better-Than-Expected Second Quarter CY 2009 Financial Results -Company Increases CY 2009 GAAP EPS Outlook and Reaffirms CY 2009 Non-GAAP EPS Outlook- -Board of Directors Increases
Gfinity plc ("Gfinity" or the "Company") Final Results for the Year ended 30 June 2015
 Final Results for the Year ended 30 June 2015") 2 November 2015 Gfinity plc ("Gfinity" or the "Company") Final Results for the Year ended 30 June 2015 Gfinity (AIM: GFIN), a leading esports business, is pleased to announce its full year results for
2 November 2015 Gfinity plc ("Gfinity" or the "Company") Final Results for the Year ended 30 June 2015 Gfinity (AIM: GFIN), a leading esports business, is pleased to announce its full year results for
2016 GLOBAL GAMES MARKET REPORT
 FREE 2016 GLOBAL GAMES MARKET REPORT AN OVERVIEW OF TRENDS & INSIGHTS JUNE 2016 TABLE OF CONTENTS 1. Introduction 3 2. Key Global Trends 5 3. The Global Games Market Per 9 Region, Segment & Screen 4. Regional
Third Quarter 2017 Results. November 2, 2017
 Third Quarter 207 Results November 2, 207 Safe Harbor Disclosure Please review our SEC filings on Form 0-K and Form 0-Q The statements contained herein that are not historical facts are forward-looking
Equity Research ACTIVISION, INC. (ATVI-NASDAQ)
") Equity Research May 28, 2008 Abdul Saleh www.zacks.com 111 North Canal Street, Chicago, IL 60606 ACTIVISION, INC. (ATVI-NASDAQ) ATVI: Zacks Company Report - HOLD Current Recommendation Hold Prior Recommendation
Equity Research May 28, 2008 Abdul Saleh www.zacks.com 111 North Canal Street, Chicago, IL 60606 ACTIVISION, INC. (ATVI-NASDAQ) ATVI: Zacks Company Report - HOLD Current Recommendation Hold Prior Recommendation
ACTIVISION BLIZZARD ANNOUNCES BETTER THAN EXPECTED FIRST QUARTER 2015 FINANCIAL RESULTS. Company Increases CY 2015 Revenues and EPS Outlook
 FOR IMMEDIATE RELEASE ACTIVISION BLIZZARD ANNOUNCES BETTER THAN EXPECTED FIRST QUARTER 2015 FINANCIAL RESULTS Company Increases CY 2015 Revenues and EPS Outlook Company Delivered Record Q1 Non GAAP Digital
COMPETITIVE GAMING DIVISION PETER MOORE CHIEF COMPETITION OFFICER
 COMPETITIVE GAMING DIVISION PETER MOORE CHIEF COMPETITION OFFICER SAFE HARBOR STATEMENT This presentation contains forward-looking statements that are subject to change. Statements including words such
TREND INSIGHTS MEDIA & TECH TRENDS FOR 2017
 TREND INSIGHTS MEDIA & TECH TRENDS FOR 2017 MEDIA & TECH TRENDS FOR 2017 There were several noticeable tech and video trends in 2016 that impacted consumers and marketers; they may become even more prominent
Activision Announces Second Quarter 2006 Results
 Activision Announces Second Quarter 2006 Results - Company's Q2 Results Exceed Outlook - - Company Increases FY 2006 Revenue Outlook - SANTA MONICA, Calif., Nov 02, 2005 /PRNewswire-FirstCall via COMTEX
H1 FY16 Earnings presentation November 4th, 2015
 H1 FY16 Earnings presentation November 4th, 2015 Yves Guillemot, President and Chief Executive Officer Alain Martinez, Chief Financial Officer Jean-Benoît Roquette, SVP Investor Relations D I S C L A I
Capcom Co., Ltd. (Tokyo Stock Exchange, First Section, 9697) Overview of Strategies and Plans Fiscal Year ending March 31, 2017
 Overview of Strategies and Plans Fiscal Year ending March 31, 2017") Capcom Co., Ltd. (Tokyo Stock Exchange, First Section, 9697) Overview of Strategies and Plans Fiscal Year ending March 31, 2017 0 0 Forward-looking Statements Strategies, plans, outlooks and other statements
Capcom Co., Ltd. (Tokyo Stock Exchange, First Section, 9697) Overview of Strategies and Plans Fiscal Year ending March 31, 2017 0 0 Forward-looking Statements Strategies, plans, outlooks and other statements
The Henry Fund Henry B. Tippie School of Management Luv Bhagria
 The Henry Fund Henry B. Tippie School of Management Luv Bhagria [luv-bhagria@uiowa.edu] Activision Blizzard (ATVI) October 16, 2017 Information Technology- Video-game Software and Services Stock Rating
INVESTOR DAY. February 18 th 2016
 INVESTOR DAY February 18 th 2016 DISCLAIMER This statement may contain estimated financial data, information on future projects and transactions and future business results/ performance. Such forward-looking
Sportradar esports Service. Unlocking the incredible potential of esports
 Sportradar esports Service Unlocking the incredible potential of esports esports A global mass phenomenon with a bright future! esports REVENUE GROWTH Total revenue growth 2015-2020 of 35,6 percent CAGR
G5 ENTERTAINMENT AB. Investor Presentation
 G5 ENTERTAINMENT AB Investor Presentation G5 Entertainment in Brief Developer and publisher of casual free-to-play (F2P) games for tablets and smartphones Global company operating in the global market
Bringing More to the Table
 Bringing More to the Table TM During this presentation and the Q&A session, we may be making forward-looking statements that reflect certain risks and uncertainties associated with Shuffle Master s business.
GameStop Corp. NASDAQ:GME. HOLD Price Target: $28.74 Key Statistics as of 10/13/2016. Catalysts: Company Description:
 GameStop Corp. NASDAQ:GME Analyst: Sector: Christian Henderson Services HOLD Price Target: $28.74 Key Statistics as of 10/13/2016 Catalysts: Short Term ( less than a year) any change in the distribution
Capcom Co., Ltd. (Tokyo Stock Exchange, First Section, 9697) Financial Highlights for the Fiscal Year ended March 31, 2018
 Financial Highlights for the Fiscal Year ended March 31, 2018") Capcom Co., Ltd. (Tokyo Stock Exchange, First Section, 9697) Financial Highlights for the Fiscal Year ended March 31, 2018 0 0 Forward-looking Statements Strategies, plans, outlooks and other statements
Capcom Co., Ltd. (Tokyo Stock Exchange, First Section, 9697) Financial Highlights for the Fiscal Year ended March 31, 2018 0 0 Forward-looking Statements Strategies, plans, outlooks and other statements
Global MMORPG Gaming Market: Size, Trends & Forecasts ( ) November 2017
 November 2017") Global MMORPG Gaming Market: Size, Trends & Forecasts (2017-2021) November 2017 Global MMORPG Gaming Market: Coverage Executive Summary and Scope Introduction/Market Overview Global Market Analysis Dynamics
Global MMORPG Gaming Market: Size, Trends & Forecasts (2017-2021) November 2017 Global MMORPG Gaming Market: Coverage Executive Summary and Scope Introduction/Market Overview Global Market Analysis Dynamics
LONG TERM VALUE CREATION BLAKE JORGENSEN, CFO
 LONG TERM VALUE CREATION BLAKE JORGENSEN, CFO SAFE HARBOR STATEMENT This presentation contains forward-looking statements that are subject to change. Statements including words such as anticipate, "believe,
Activision Blizzard Announces Better-Than-Expected Third Quarter CY 2009 Financial Results
 Activision Blizzard Announces Better-Than-Expected Third Quarter CY 2009 Financial Results - Company Calendar Year Financial Outlook Remains Unchanged - SANTA MONICA, Calif., Nov 05, 2009 /PRNewswire-FirstCall
The Business of Video Games Report. About DFC Intelligence s The Business of Video Games Report
 About DFC Intelligence s The Business of Video Games report consists of two pdf documents 1) a 140-slide presentation created in Microsoft PowerPoint and 2) a 180-page report created in Microsoft Word.
Cherry AB. Investing in a broad gaming portfolio. CEO Anders Holmgren GP Bullhound 6 December 2017
 Cherry AB Investing in a broad gaming portfolio CEO Anders Holmgren GP Bullhound 6 December 2017 The game is on Cherry is investing in a broad portfolio of online gaming companies Cherry s strategy is
ACTIVISION BLIZZARD, INC.
 ACTIVISION BLIZZARD, INC. FORM 8-K (Current report filing) Filed 05/06/5 for the Period Ending 05/06/5 Address 00 OCEAN PARK BLVD SANTA MONICA, CA 90405 Telephone 055000 CIK 000078877 Symbol ATVI SIC Code
INTRODUCTION MARKET OVERVIEW
 CHINESE ONLINE GAMING 216 Essex Street, Salem, MA 01970 (978) 745-9233 (800) 888-MGMT www.ecabot.com info@ecabot.com Nearly 100 million people in China are playing online games. These users spent about
4 th Quarter Earnings Conference Call
 4 th Quarter Earnings Conference Call KKR & Co. L.P. Investor Update February 8, 2018 4Q17 Reflections Fundamentals Are Strong (Dollars in millions, except per unit amounts and unless otherwise stated)
Strategic analysis by fredi fernandez This report is a basic study on Activision Blizzard s strategy, with focus on Blizzard Entertainment.
 Strategic analysis by fredi fernandez This report is a basic study on Activision Blizzard s strategy, with focus on Blizzard Entertainment. By fredi fernandez fredi@alphaorigins.com 1 Blizzard s mission
KOHLBERG CAPITAL CORPORATION. May 2007
 KOHLBERG CAPITAL CORPORATION May 2007 Safe Harbor Statement Private Securities Litigation Reform Act of 1995 Forward Looking Information This presentation may include forward-looking statements. These
INDUSTRY OVERVIEW REDACTED REDACTED Sources of Information REDACTED REDACTED The Newzoo report
 Certain information, including statistics and estimates, set forth in this section and elsewhere in this document have been derived from two industry reports, namely the Newzoo Report and the Frost & Sullivan
GAMR CASE. Investment INTRO GAMR INVESTMENT CASE
 GAMR TM Investment CASE INTRO The video game industry has come a long way from the advent of Pong in the 1970s. Consistently adapting to changing consumer preferences and product cycles, gaming companies
Results Presentation 2017 Second Quarter and Interim Results. 30 Aug, 2017
 Results Presentation 2017 Second Quarter and Interim Results 30 Aug, 2017 Disclaimer This presentation is prepared by NetDragon Websoft Holdings Limited (the Company ) solely for information purposes and
Annual results 2005/06
 Annual results 2005/06 June 28, 2006 Yves Guillemot, Chief Executive Officer Alain Martinez, Chief Finance Officer Agenda Introduction Arrival of next-generation platforms: Evolutions and potential Ubisoft's
G5 Entertainment. Investor Presentation
 G5 Entertainment Investor Presentation G5 Entertainment in Brief Developer and publisher of casual free-to-play (F2P) games for tablets and smartphones Global company operating in the global market of
CONTENTS TABLES. Table 1 - America's Top Formats in
 EXECUTIVE SUMMARY CONTENTS Executive Summary... i Introduction... 3 Capital Markets and Industry Outlook... 4 Values of Public Companies (Radio and Overall Local Media Companies)...4 Multiple Analysis...6
4 th Quarter Earnings Conference Call
 4 th Quarter Earnings Conference Call KKR & Co. Inc. Investor Update February 1, 2019 Key Metrics Assets Under Management Management Fees ($ in billions) ($ in millions) $195 $1,069 $168 $905 $100 $107
Investor Presentation. November 2018
 Investor Presentation November 2018 KKR Today Private Markets Public Markets Capital Markets Principal Activities $104bn AUM $91bn AUM Global Franchise $19bn of Assets $81bn Private Equity, Growth Equity
Global Video Game Software Market: Size, Trends & Forecasts ( ) February 2018
 February 2018") Global Video Game Software Market: Size, Trends & Forecasts (2018-2022) February 2018 Global Video Game Software Market: Coverage Executive Summary and Scope Introduction/Market Overview Global Market
Global Video Game Software Market: Size, Trends & Forecasts (2018-2022) February 2018 Global Video Game Software Market: Coverage Executive Summary and Scope Introduction/Market Overview Global Market
2016 GLOBAL ESPORTS MARKET REPORT
 FREE 2016 GLOBAL ESPORTS MARKET REPORT AN OVERVIEW OF THE ESPORTS MARKET & ITS VALUABLE AUDIENCE MARCH 2016 TABLE OF CONTENTS 1. Introduction 3 2. Overview of the Market 7 3. Live Esports Events in 2015
January June Summary
 January June 2012 - Summary Consolidated revenue for the period is 36 082 KSEK, up 89% compared to 19 142 KSEK for the same period of 2011. This is in line with the previously communicated forecast of
NEW YORK UNIVERSITY Stern School of Business
 NEW YORK UNIVERSITY Stern School of Business Spring Term 2005 Investment Banking and Private Equity in Entertainment and Media Instructors: Stephen Finkel, Credit Suisse First Boston Philip Grovit, Goldman
esports Marketing: Start with the Consumer Photo courtesy of ESL New research sheds light on enigmatic esports players and fans
 1 esports Marketing: Start with the Consumer New research sheds light on enigmatic esports players and fans 1 The numbers are incredible esports has experienced double digit growth for several years and
Transition PPT Template. J.P. Morgan. June 2015 V 3.0. Energy Equity Conference June 27, 2017
 Transition PPT Template J.P. Morgan June 2015 V 3.0 Energy Equity Conference 2017 June 27, 2017 Forward-Looking Statements This presentation contains forward-looking statements, including, in particular,
KEY GLOBAL TRENDS 2018 GLOBAL ESPORTS MARKET REPORT Newzoo GLOBAL ESPORTS MARKET REPORT 2018
 2018 GLOBAL ESPORTS MARKET REPORT 2018 Newzoo 1 KEY TAKEAWAYS KEY TAKEAWAYS 1. KEY TAKEAWAYS GLOBAL ESPORTS REVENUES UP MORE THAN 38% YEAR ON YEAR Global esports revenues will reach $906 million in 2018,
4Q February 2011
 4Q 2010 28 February 2011 2 Disclaimer forward looking statements This presentation contains forward-looking statements that involve risks and uncertainties. All statements other than statements of historical
Please see analyst certification and other important disclosures starting on page 165.
 Page 84 Exhibit 120 Third-Party Gross Margin Sensitivity Relative to Hardware Royalties and Manufacturing Costs (US$) Manufacturing Cost Royalty Cost $3.00 $4.00 $5.00 $6.00 $7.00 $8.00 $9.00 $1.00 90%
G5 Entertainment. Investor Presentation
 G5 Entertainment Investor Presentation G5 Entertainment in Brief Developer and publisher of casual free-to-play (F2P) games for tablets and smartphones Global company operating in the global market of
The Business of Video Games. Table of Contents
 The Business of Video Games Comprehensive Market Overview April 2016 Contents Table of Contents CONDITIONS OF PURCHASE... 2 ABOUT THIS REPORT... 3 TABLE OF CONTENTS... 4 INDEX OF TABLES... 7 I. OVERVIEW...
For personal use only
 ASX ANNOUNCEMENT 2013 ANNUAL GENERAL MEETING 23 OCTOBER 2013 CHAIRMAN S ADDRESS TO SHAREHOLDERS Ladies & Gentlemen I am very pleased to report that the performance of your company was exceptional in Financial
Good afternoon. I m Kazuharu Watanabe. I will be presenting an overview of the Company s financial results for 1Q FY2019/3.
 We would now like to begin the Financial Results Briefing Session of SQUARE ENIX HOLDINGS (the Company ) for the first quarter of the fiscal year ending March 31, 2019 ( 1Q FY2019/3 ). Today s presenters
Casual Gaming Market Update
 Synopsis U.S. Consumers Online Activities (2006 vs. 2007) Casual Gaming Market Update provides indepth analysis of the current dynamics and future directions of the rapidly growing casual gaming industry,
Reinforcement of the development strategy Creation of 4 operational divisions structured around strong expertise
 Reinforcement of the development strategy Creation of 4 operational divisions structured around strong expertise Paris, September 20, 2018 - The Atari Group announces the creation of 4 operational divisions:
esports BETTING UNLOCKING THE POTENTIAL
 esports BETTING UNLOCKING THE POTENTIAL 1 esports BETTING: UNDERSTANDING THE POTENTIAL esports has arrived. While still a rapidly expanding market, esports is already a huge industry with prize pools worth
The mobile gaming market. Rise of the smart phone. Dual market The year of gaming. Revenues. smartphone sales. top apps
 Tech Guide 1 Contents 02 03 04 05 06 08 09 10 12 The mobile gaming market Rise of the smart phone Dual market 2015 The year of gaming Revenues Re-entrants and new entrants smartphone sales the top 20 publishers
Sony IR Day Game & Network Services Segment. November 25, Andrew House
 Sony IR Day 2014 November 25, 2014 Andrew House President and Group CEO Sony Computer Entertainment Inc. Group Executive in Charge of Network Entertainment Business Sony Corporation Agenda 1. Business
The resulting net sales were 87,170 million yen (up 13.2% from the previous fiscal year).
.") Attachment contents 1. Operating results overview 2 (1) Operating results for the fiscal year under review. 2 (2) Financial position overview for the fiscal year under review. 4 (3) Cash flow overview
Attachment contents 1. Operating results overview 2 (1) Operating results for the fiscal year under review. 2 (2) Financial position overview for the fiscal year under review. 4 (3) Cash flow overview
Cherry AB. The most complete gaming company Partnering with entrepreneurs to explore exciting ideas
 Cherry AB The most complete gaming company Partnering with entrepreneurs to explore exciting ideas CEO Anders Holmgren & CFO Christine Rankin Copenhagen 10 January 2018 Investment case Positive outlook
Case Report: The Walt Disney Company By: Steve Bisson, Jennifer Greer, Megan McNamara, Rye Morris
 Case Report: The Walt Disney Company By: Steve Bisson, Jennifer Greer, Megan McNamara, Rye Morris History In 1923, Walt Disney and his brother began producing cartoon sketches. It quickly took off with
Prepared Remarks FISCAL 2018 Q3
 Prepared Remarks FISCAL 2018 Q3 January 30, 2018 CHRIS: Thank you. Welcome to EA s third quarter fiscal 2018 earnings call. With me on the call today are Andrew Wilson, our CEO, and Blake Jorgensen, our