Characterisation of the Montana Instruments Cryostation C2 for low temperature Magneto-Optical Kerr Effect measurements using the NanoMOKE 3
|
|
|
- James Francis Morton
- 5 years ago
- Views:
Transcription

1 Technical Report TR16711rev3 Characterisation of the Montana Instruments Cryostation C2 for low temperature Magneto-Optical Kerr Effect measurements using the NanoMOKE 3 EXECUTIVE SUMMARY This technical report summarises the results of the integration of the Montana Instruments Helium-free Cryostation C2 with the NanoMOKE 3 magnetometer from Durham Magneto Optics Ltd. Three samples were measured in this study: a continuous film with in-plane magnetisation, a patterned sample with in-plane magnetisation, and a continuous film with outof-plane magnetisation. The magnetometry study shows strong artefact-free hysteresis loops at low temperature (4 K), with a signal exceeding 2 mdeg in all the samples, making it possible to capture the magnetic reversal with singleshot measurements. The magnetic microscopy study shows clear domain images at 4 K, using both the scanning laser microscope and the CCD camera. The maximum field applied in the longitudinal configuration is over.47 T 1 and in the polar geometry is over.35 T. The system is extremely stable and the noise at low-temperature is about.6 mdeg in the longitudinal configuration 1.2 times the specified room temperature noise and about 1 mdeg in the polar configuration twice the specified room temperature noise. BACKGROUND In this study three samples were measured at low temperature using the Helium-free Cryostation C2 from Montana Instruments. They are the standard test samples that are provided to every NanoMOKE 3 customer see TR16215r1 for room temperature measurements. The samples consist of one Permalloy continuous film (2 nm in thickness) with in-plane magnetisation, one set of Permalloy microwires (25-um wide, 24-nm thick) with in-plane magnetisation, and one Ta(4 nm)/pt(1 nm)/cofeb(.6 nm)/pt(2 nm) thin film with perpendicular magnetic anisotropy. The two Permalloy samples were measured in the 1 Field, noise and temperature values presented in this report are those measured under a variety of experimental conditions using the prototype system. They should be interpreted as typical values, not guaranteed performance specifications. 1 A. Beguivin, Durham Magneto Optics Ltd.
2 longitudinal configuration at 25 incidence using the high-mag lens set; the out-of-plane sample was measured in polar geometry. Both Kerr rotation and Kerr ellipticity were measured; the loops displayed in this report show Kerr rotation as a function of applied field (measurements of the Kerr ellipticity of these samples yield similar or weaker signal strength). For each configuration of the Kerr effect, a thorough noise analysis was performed for three states of the cryopump, i.e. fully on (target temperature of 2 K), idling (target temperature of 2 K) and off. Also, the variations in temperature as a function of different field conditions were recorded. ULTRA-THIN COFEB (minimum sample temperature recorded: 4.58 K minimum platform temperature recorded: K) Figure 1 shows three hysteresis loops measured at three cryopump regimes, i.e. fully on (sample temperature of 4.5 K), idling (sample temperature of 2 K) and off (sample temperature of approximately 3 K while rising). These hysteresis loops were averaged for 6 s, and the applied field was a cosine waveform of amplitude 3 Oe and frequency 1 Hz. The loops exhibit strong magnetic signal, over 6 mdeg, and it is possible to capture the magnetic reversal with single-shot measurements, as shown in Figure 2. The coercive field of the sample at 4 K is HCLT =.231 T, as opposed to HCRT =.18 T found at room temperature. This change in coercive field is explained by the fact that domain wall nucleation is a thermally assisted process. The signal-to-noise ratio of the single-shot loops is excellent, the noise being only 5% of the total loop amplitude in the case where the cryopump is running at full strength (black curve). 2 A. Beguivin, Durham Magneto Optics Ltd.
3 Kerr rotation (mdeg) Cryo ON - target 2K -4-3, -2, -1, 1, 2, 3, Kerr rotation (mdeg) Cryo ON - target 2K -4-3, -2, -1, 1, 2, 3, Kerr rotation (mdeg) Cryo OFF -4-3, -2, -1, 1, 2, 3, Figure 1: Hysteresis loops averaged for 6 s taken in the polar configuration for three cryopump regimes; black: fully on (sample temperature of 4.5 K), red: idling (sample temperature of 2 K) and green: off (sample temperature of approximately 3 K). 3 A. Beguivin, Durham Magneto Optics Ltd.
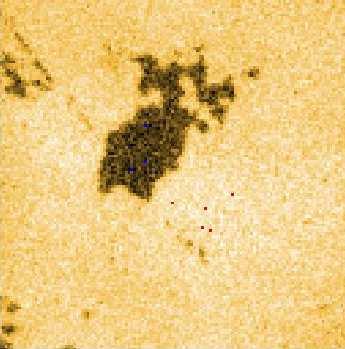
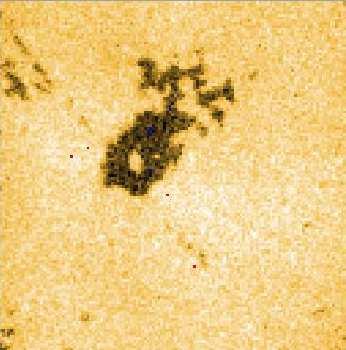
4 Kerr rotation (mdeg) Cryo ON - target 2K -4-3, -2, -1, 1, 2, 3, Kerr rotation (mdeg) Cryo ON - target 2K -4-3, -2, -1, 1, 2, 3, Kerr rotation (mdeg) Cryo OFF -4-3, -2, -1, 1, 2, 3, Figure 2: Single-shot hysteresis loops taken in the polar configuration for three cryopump regimes; black: fully on (sample temperature of 4.5 K), red: idling (sample temperature of 2 K) and green: off (sample temperature of approximately 3 K). Figure 3 shows magnetic microscopy images at a sample temperature of 4.5 K using the Scanning Laser Microscope (SLM). The top-left image shows the sample fully saturated one way, and clockwise are the images obtained as the field is ramped up, until the sample is fully saturated in the opposite direction (middle-left image). Whereas at room temperature reversal occurs via nucleation and propagation of large domains (see TR TR16215r1), numerous, smaller domains are preferred at low temperature. Microscopy images using a CCD camera are presented in Figure 4, where the same domain structure is observed. 4 A. Beguivin, Durham Magneto Optics Ltd.


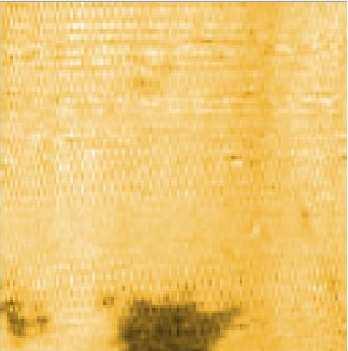

5 Figure 3: Domain images of the ultra-thin CoFeB sample acquired with the scanning laser microscope at a sample temperature of 4.5 K. 5 A. Beguivin, Durham Magneto Optics Ltd.


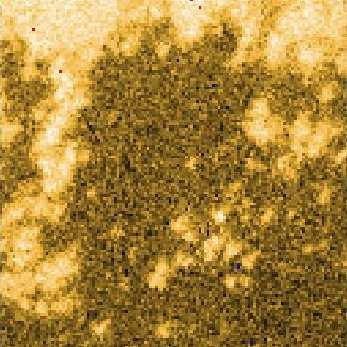
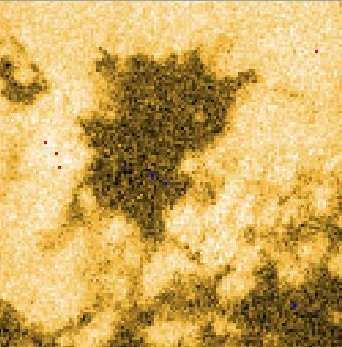
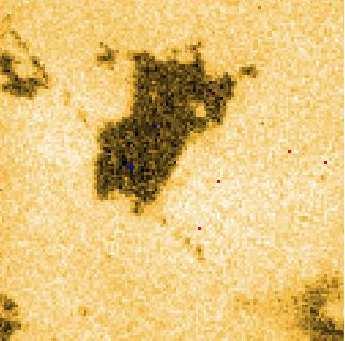
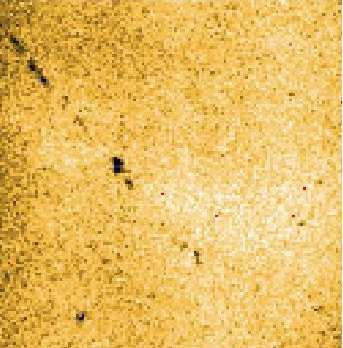
6 Figure 4: Domain images of the ultra-thin CoFeB sample acquired with the CCD camera at a sample temperature of 4.5 K. 6 A. Beguivin, Durham Magneto Optics Ltd.
7 CONTINUOUS PERMALLOY (minimum sample temperature recorded: K minimum platform temperature recorded: K) Figure 5 shows three hysteresis loops measured at three cryopump regimes, i.e. fully on (sample temperature of 5.5 K), idling (sample temperature of 2 K) and off (sample temperature of 55 K while rising). These hysteresis loops were averaged for 6 s, and the applied field was a cosine waveform of amplitude 5 Oe and frequency 1 Hz. The loops exhibit strong magnetic signal, over 2 mdeg, and it is possible to capture the magnetic reversal with single-shot measurements, as shown in Figure 6. The coercive field of the sample at 5.5 K is H CLT =.13 T, as opposed to H CRT = T found at room temperature. This change in coercive field is explained by the fact that domain wall nucleation is a thermally assisted process. The signal-to-noise ratio of all three loops is excellent and identical, the noise being only 4% of the total loop amplitude, which is evidence of the high stability of the system. Kerr rotation (mdeg) Cryo ON - target 2K Kerr rotation (mdeg) Cryo ON - target 2K Kerr rotation (mdeg) Cryo OFF Figure 5: Hysteresis loops averaged for 6 s taken in the longitudinal configuration for three cryopump regimes; black: fully on (sample temperature of 5.5 K), red: idling (sample temperature of 2 K) and green: off (sample temperature of 55 K). 7 A. Beguivin, Durham Magneto Optics Ltd.
 15 1 5-5 -1-15 Cryo OFF -4-2 2 4 Figure 6: Single-shot hysteresis loops taken in the longitudinal configuration for three")
, red: idling (sample temperature of 2 K) and green: off (sample temperature of 55 K).")


8 Kerr rotation (mdeg) Cryo ON - target 2K Kerr rotation (mdeg) Cryo ON - target 2K Kerr rotation (mdeg) Cryo OFF Figure 6: Single-shot hysteresis loops taken in the longitudinal configuration for three cryopump regimes; black: fully on (sample temperature of 5.5 K), red: idling (sample temperature of 2 K) and green: off (sample temperature of 55 K). Figure 7 shows magnetic microscopy images at a sample temperature of 5.5 K using the SLM. The image on the left shows the sample fully saturated one way, and as the field is increased/decreased, the sample switches, as shown on the 3D hysteresis loop. The switching seems to occur via coherent rotation of the magnetic moments, which explains the absence of clear domains. In fact, the Permalloy sample shows in-plane easy and hard axes; in order to see clear domains, the sample should always be loaded so the magnetic field is applied along the sample s easy axis. Figure 7: Domain images of the Permalloy film acquired with the scanning laser microscope at a sample temperature of 5.5 K. 8 A. Beguivin, Durham Magneto Optics Ltd.


9 PERMALLOY MICROWIRES Figure 8 shows hysteresis loops measured at 5.5 K sample temperature with the laser spot on a microwire (top row) and between two structures (bottom row). The applied field was a cosine waveform of amplitude.3 T and frequency 1 Hz. The middle loops were averaged for 6 s and the loop taken on a microwire exhibits strong magnetic signal, over 5 mdeg in amplitude. It is possible to capture the magnetic reversal with single-shot measurements. The loops taken between two microwires still show sign of magnetic switching, but the amplitude is reduced to 4 mdeg only. The small magnetic signal measured here is a combination of the sample s background and the tails of the Gaussian-like beam profile overlapping with the Permalloy structures. The coercive field of the sample at 5.5 K is H CLT =.12 T, as opposed to H CRT = T found at room temperature. This change in coercive field is explained by the fact that domain wall nucleation is a thermally assisted process. The signal-to-noise ratio of the on-wire single-shot loop is excellent, the noise being only 3% of the total loop amplitude. Kerr rotation Kerr rotation 4 3 Structured Py - ON wire Structured Py - OFF wire Kerr rotation Kerr rotation Structured Py - ON wire Structured Py - OFF wire Figure 8: Hysteresis loops taken in the longitudinal geometry at a sample temperature of 5.5 K, on a Permalloy microwire (top row) and between two structures (bottom row). The figure shows averaged loops (middle) and single-shot loops (right). Figure 9 shows magnetic microscopy images at a sample temperature of 5.5 K using the SLM. The top-left image shows the sample fully saturated one way, and clockwise are the images obtained as the field is ramped up, until the sample is fully saturated in the opposite direction 9 A. Beguivin, Durham Magneto Optics Ltd.


10 (middle-left image). Images show that magnetic domains are nucleating at each wire end, but also at random locations in the microstructures. Microscopy images using a CCD camera are presented in Figure 1, and switching of individual microwires is probed. Another sign of the high stability of the system is the absence of jitter in domain images, the edges of the microwires are straight and the imaging quality is identical to that of room temperature measurements. Figure 9: Domain images of the Permalloy microwires acquired with the scanning laser microscope at a sample temperature of 5.5 K. 1 A. Beguivin, Durham Magneto Optics Ltd.


11 Figure 1: Domain images of the Permalloy microwires acquired with the CCD camera at a sample temperature of 5.5 K. DIPOLE PERFORMANCE IN POLAR CONFIGURATION The maximum field applicable using the Montana Instruments dipole magnet in the polar configuration and at a sample temperature of 4 K was measured to be just over.35 T, as shown in Figure 11. The field waveform was a cosine function of frequency of.5 Hz, so that despite the slow response time of the electromagnet, the correct field was applied. 11 A. Beguivin, Durham Magneto Optics Ltd.
12 4, 3, Maximum field: 355 Oe 2, 1, -1, -2, -3, -4, 5, 1e+4 1.5e+4 2e+4 Time (ms) Figure 11: Field vs time of a cosine waveform of frequency.5 Hz, generated with the polar pole pieces. The maximum field produced in the polar configuration is 355 Oe. The next two figures quantify the temperature rise observed when applying a magnetic field, through the generation of eddy currents, for different field conditions. First, Figure 12 shows the change in platform and sample temperatures as a function of the duration of the applied field. The field, a cosine waveform of amplitude.3 T and frequency 1 Hz was run for 1, 2 and 3 minutes. The cryostation was cooled back to the base temperature between each measurement. The rise in temperature from the base sample (platform) temperature of 4.5K (3.3 K) was recorded at the end of each sequences. Figure 12 shows the temperature rise is independent of the field duration and is below 3 mk for the sample and 2 mk for the platform under these field conditions. 12 A. Beguivin, Durham Magneto Optics Ltd.
13 .3 Platform temperature Sample temperature Temperature rise (K) Field duration (minutes) Figure 12: Sample and platform temperature rise relative to the base temperature as a function of the field duration, in the polar configuration. Figure 13 shows the temperature rise relative to the base temperature, as a function of the frequency of the applied field. A.3 T cosine field set in software was applied for a minute, and the base and final temperatures were recorded. Because of the response time of the electromagnet, the cosine waveform turns into a saw-tooth function with reduced amplitude at high frequency. The floating labels next to each data point show the true amplitude as measured by the Hall sensor. Figure 13 shows that the temperature rises linearly with frequency, up to 2.5 K at 5 Hz and then plateaus at higher frequencies. The reason why the temperature rises less at 1 Hz than it does at 5 Hz is the much reduced field amplitude (.23 T at 5 Hz,.13 T at 1 Hz). Even while driving the maximum applied field for extended periods or at high frequencies, a platform temperature of <5 K could be maintained. 13 A. Beguivin, Durham Magneto Optics Ltd.
14 3.5 3 Platform temperature Sample temperature Temperature rise (K) Oe 13 Oe.5 29 Oe 29 Oe Field cycle frequency (Hz) Figure 13: Sample and platform temperature rise relative to the base temperature as a function of the frequency of the applied field, in the polar configuration. The field was set in software to be a cosine waveform of amplitude.3 T. The floating labels indicate the amplitude of the field as measured by the Hall sensor. The next figure quantifies the noise in the Kerr signal. Figure 14 shows the measured root mean square (AC) of the Kerr signal over an extended period of time (up to 17 s), for three different cryopump regimes. The black data points denotes the noise when the cryopump is working at its full strength, i.e. the target temperature is set to 2 K. The red data points show the noise when the temperature set point is 2 K, and the green data points show the noise level when the cryopump is turned off. There is little difference between the black and red curves, with a noise level around 1 mdeg, which is twice the specified room temperature noise. The higher level of noise recorded on the red curve around t= s is attributed to a sudden change in the cryopump regime as the target temperature was changed from 2 K to 2 K. When the cryopump is off, the noise level drops to below 1 mdeg. Although vibration is the main source of noise, Figure 14 highlights the high stability of the system, compared to other cooling systems. 14 A. Beguivin, Durham Magneto Optics Ltd.
15 AC Kerr rotation (mdeg) Cryo ON - target 2K Cryo ON - target 2K Cryo OFF.6 5 1, 1,5 Time (s) Figure 14: Root mean square of the Kerr signal over an extended period of time, in the polar configuration for three cryopump regimes; black: fully on (sample temperature of 4.5 K), red: idling (sample temperature of 2 K) and green: off (sample temperature of approximately 3 K). DIPOLE PERFORMANCE IN LONGITUDINAL CONFIGURATION The maximum field applicable using the Montana Instruments dipole magnet in the longitudinal configuration and at a sample temperature of 5.5 K was measured to be just over.47 T, as shown in Figure 15. The field waveform was a cosine function of frequency of.5 Hz. 15 A. Beguivin, Durham Magneto Optics Ltd.
16 6, 4, Maximum field: 477 Oe 2, -2, -4, -6, 5, 1e+4 1.5e+4 2e+4 Time (ms) Figure 15: Field vs time of a cosine waveform of frequency.5 Hz, generated with the longitudinal pole pieces. The maximum field produced in the longitudinal configuration is 477 Oe. The next two figures quantify the temperature rise observed when applying a magnetic field, through the generation of eddy currents, for different field conditions. First, Figure 16 shows the change in platform and sample temperatures as a function of applied field duration. The field, a cosine waveform of amplitude.3 T and frequency 1 Hz was run for 1, 2 and 3 minutes. The cryostation was cooled back to the base temperature between each measurement. The rise in temperature from the base sample (platform) temperature of 5.5K (3.5 K) was recorded at the end of each sequences. Figure 16 shows that the field duration has little impact on the sample temperature, with a recorded rise of 21 mk after 3 minutes, at these field conditions. 16 A. Beguivin, Durham Magneto Optics Ltd.
17 .3 Platform temperature Sample temperature Temperature rise (K) Field duration (minutes) Figure 16: Sample and platform temperature rise relative to the base temperature as a function of the field duration, in the longitudinal configuration. Figure 17 shows the temperature rise relative to the base temperature, as a function of the frequency of the applied field. A.3 T cosine field set in software was applied for a minute, and the base and final temperatures were recorded. Because of the response time of the electromagnet, the cosine waveform turns into a saw-tooth function with reduced amplitude at high frequency. The floating labels next to each data point show the true amplitude as measured by the Hall sensor. Figure 17 shows that the temperature rises linearly with frequency, up to 1.1 K at 5 Hz and then goes down at higher frequencies. The reason why the temperature rises less at 1 Hz than it does at 5 Hz is the much reduced field amplitude (.3 T at 5 Hz,.19 T at 1 Hz). Even while driving the maximum applied field for extended periods or at high frequencies, a platform temperature of <5 K could be maintained. 17 A. Beguivin, Durham Magneto Optics Ltd.
18 1.5 Platform temperature Sample temperature Temperature rise (K) Oe 3 Oe 19 Oe 3 Oe Field cycle frequency (Hz) Figure 17: Sample and platform temperature rise relative to the base temperature as a function of the frequency of the applied field, in the longitudinal configuration. The field was set in software to be a cosine waveform of amplitude.3 T. The floating labels indicate the amplitude of the field as measured by the Hall sensor. The next figure quantifies the noise in the Kerr signal. Figure 18 shows the measured root mean square (AC) of the Kerr signal over an extended period of time (up to 15 s), for three different cryopump regimes. The black data points denotes the noise when the cryopump is working at its full strength, i.e. the target temperature is set to 2 K. The red data points show the noise when the temperature set point is 2 K, and the green data points show the noise level when the cryopump is turned off. There is little difference between the three traces, indicating that the system is extremely stable. This is in agreement with the single-shot loops displayed in Figure 6, where for all three loops the amplitude of the noise is only 4% of the total loop amplitude. The level of noise is in average equal to.5 mdeg, which is as good as the performance at room temperature. This last result shows how stable the system can be and how well vibrations within the cooling unit are dampened. 18 A. Beguivin, Durham Magneto Optics Ltd.
19 AC Kerr rotation (mdeg) Cryo ON - target 2K Cryo ON - target 2K Cryo OFF , 1,2 1,4 1,6 Time (s) Figure 18: Root mean square of the Kerr signal over an extended period of time, in the longitudinal configuration for three cryopump regimes; black: fully on (sample temperature of 5.5 K), red: idling (sample temperature of 2 K) and green: off (sample temperature of 55 K). The next figure quantifies the noise in the Kerr signal with the laser spot sitting on top of a Permalloy microwire. Figure 19 shows the measured root mean square (AC) of the Kerr signal over an extended period of time (just under 5 s), with the cryopump running full strength, i.e. the target temperature set to 2 K. The noise level is excellent,.54 mdeg in average, which is in agreement with the findings in the continuous Permalloy film. This value of.54 mdeg is just over the specified noise at room temperature for longitudinal measurement. Throughout this 8-min long measurement, the laser spot remained in the same position and no drift was observed. 19 A. Beguivin, Durham Magneto Optics Ltd.
20 .65 Cryo ON - target 2K AC Kerr rotation (mdeg) Time (s) Figure 19: Root mean square of the Kerr signal over an extended period of time in longitudinal configuration, with the cryopump running at full strength (sample temperature of 5.5 K) and the laser spot sitting on top of a Permalloy microwire. 2 A. Beguivin, Durham Magneto Optics Ltd.
Development of a Surface Magneto-Optic Kerr Effect Magnetometer. Susan Stoffer Sorensen
 Development of a Surface Magneto-Optic Kerr Effect Magnetometer Susan Stoffer Sorensen A senior thesis submitted to the faculty of Brigham Young University In partial fulfillment of the requirements for
INDIAN INSTITUTE OF TECHNOLOGY BOMBAY
 IIT Bombay requests quotations for a high frequency conducting-atomic Force Microscope (c-afm) instrument to be set up as a Central Facility for a wide range of experimental requirements. The instrument
THICK-FILM LASER TRIMMING PRINCIPLES, TECHNIQUES
 Electrocomponent Science and Technology, 1981, Vol. 9, pp. 9-14 0305,3091/81/0901-0009 $06.50/0 (C) 1981 Gordon and Breach Science Publishers, Inc. Printed in Great Britain THICK-FILM LASER TRIMMING PRINCIPLES,
EDDY CURRENT INSPECTION FOR DEEP CRACK DETECTION AROUND FASTENER HOLES IN AIRPLANE MULTI-LAYERED STRUCTURES
 EDDY CURRENT INSPECTION FOR DEEP CRACK DETECTION AROUND FASTENER HOLES IN AIRPLANE MULTI-LAYERED STRUCTURES Teodor Dogaru Albany Instruments Inc., Charlotte, NC tdogaru@hotmail.com Stuart T. Smith Center
Laser Speckle Reducer LSR-3000 Series
 Datasheet: LSR-3000 Series Update: 06.08.2012 Copyright 2012 Optotune Laser Speckle Reducer LSR-3000 Series Speckle noise from a laser-based system is reduced by dynamically diffusing the laser beam. A
Experiment 1: Fraunhofer Diffraction of Light by a Single Slit
 Experiment 1: Fraunhofer Diffraction of Light by a Single Slit Purpose 1. To understand the theory of Fraunhofer diffraction of light at a single slit and at a circular aperture; 2. To learn how to measure
Long-distance propagation of short-wavelength spin waves. Liu et al.
 Long-distance propagation of short-wavelength spin waves Liu et al. Supplementary Note 1. Characterization of the YIG thin film Supplementary fig. 1 shows the characterization of the 20-nm-thick YIG film
Ultra-stable flashlamp-pumped laser *
 SLAC-PUB-10290 September 2002 Ultra-stable flashlamp-pumped laser * A. Brachmann, J. Clendenin, T.Galetto, T. Maruyama, J.Sodja, J. Turner, M. Woods Stanford Linear Accelerator Center, 2575 Sand Hill Rd.,
attocfm I for Surface Quality Inspection NANOSCOPY APPLICATION NOTE M01 RELATED PRODUCTS G
 APPLICATION NOTE M01 attocfm I for Surface Quality Inspection Confocal microscopes work by scanning a tiny light spot on a sample and by measuring the scattered light in the illuminated volume. First,
State of the Art Room Temperature Scanning Hall Probe Microscopy using High Performance micro-hall Probes
 State of the Art Room Temperature Scanning Hall Probe Microscopy using High Performance micro-hall Probes A. Sandhu 1, 4, H. Masuda 2, A. Yamada 1, M. Konagai 3, A. Oral 5, S.J Bending 6 RCQEE, Tokyo Inst.
FRAUNHOFER AND FRESNEL DIFFRACTION IN ONE DIMENSION
 FRAUNHOFER AND FRESNEL DIFFRACTION IN ONE DIMENSION Revised November 15, 2017 INTRODUCTION The simplest and most commonly described examples of diffraction and interference from two-dimensional apertures
SUPPLEMENTARY INFORMATION
 SUPPLEMENTARY INFORMATION DOI: 10.1038/NNANO.2015.137 Controlled steering of Cherenkov surface plasmon wakes with a one-dimensional metamaterial Patrice Genevet *, Daniel Wintz *, Antonio Ambrosio *, Alan
R. J. Jones Optical Sciences OPTI 511L Fall 2017
 R. J. Jones Optical Sciences OPTI 511L Fall 2017 Semiconductor Lasers (2 weeks) Semiconductor (diode) lasers are by far the most widely used lasers today. Their small size and properties of the light output
Electro-Optical Measurements at the Swiss Light Source (SLS) Linac at the PSI. First Results
 Linac at the PSI. First Results") Electro-Optical Measurements at the Swiss Light Source (SLS) Linac at the PSI First Results Overview motivation electro-optical sampling general remarks experimental setup synchronisation between TiSa-laser
Electro-Optical Measurements at the Swiss Light Source (SLS) Linac at the PSI First Results Overview motivation electro-optical sampling general remarks experimental setup synchronisation between TiSa-laser
1.6 Beam Wander vs. Image Jitter
 8 Chapter 1 1.6 Beam Wander vs. Image Jitter It is common at this point to look at beam wander and image jitter and ask what differentiates them. Consider a cooperative optical communication system that
New High Density Recording Technology: Energy Assisted Recording Media
 New High Density Recording Technology: Energy Assisted Recording Yuki Inaba Hitoshi Nakata Daisuke Inoue A B S T R A C T Energy assisted recording, is a next-generation high-density recording technology.
photolithographic techniques (1). Molybdenum electrodes (50 nm thick) are deposited by
. Molybdenum electrodes (50 nm thick) are deposited by") Supporting online material Materials and Methods Single-walled carbon nanotube (SWNT) devices are fabricated using standard photolithographic techniques (1). Molybdenum electrodes (50 nm thick) are deposited
Supporting online material Materials and Methods Single-walled carbon nanotube (SWNT) devices are fabricated using standard photolithographic techniques (1). Molybdenum electrodes (50 nm thick) are deposited
Investigate in magnetic micro and nano structures by Magnetic Force Microscopy (MFM)
") Investigate in magnetic micro and nano 5.3.85- Related Topics Magnetic Forces, Magnetic Force Microscopy (MFM), phase contrast imaging, vibration amplitude, resonance shift, force Principle Caution! -
Investigate in magnetic micro and nano 5.3.85- Related Topics Magnetic Forces, Magnetic Force Microscopy (MFM), phase contrast imaging, vibration amplitude, resonance shift, force Principle Caution! -
Technical Explanation for Displacement Sensors and Measurement Sensors
 Technical Explanation for Sensors and Measurement Sensors CSM_e_LineWidth_TG_E_2_1 Introduction What Is a Sensor? A Sensor is a device that measures the distance between the sensor and an object by detecting
CHAPTER 5 CONCEPTS OF ALTERNATING CURRENT
 CHAPTER 5 CONCEPTS OF ALTERNATING CURRENT INTRODUCTION Thus far this text has dealt with direct current (DC); that is, current that does not change direction. However, a coil rotating in a magnetic field
Three-Axis Magnetic Sensor HMC1043L
 Three-Axis Magnetic Sensor HMC1043L The Honeywell HMC1043L is a miniature three-axis surface mount sensor array designed for low field magnetic sensing. By adding the HMC1043L with supporting signal processing,
The 34th International Physics Olympiad
 The 34th International Physics Olympiad Taipei, Taiwan Experimental Competition Wednesday, August 6, 2003 Time Available : 5 hours Please Read This First: 1. Use only the pen provided. 2. Use only the
NanoFocus Inc. Next Generation Scanning Probe Technology. Tel : Fax:
 NanoFocus Inc. Next Generation Scanning Probe Technology www.nanofocus.kr Tel : 82-2-864-3955 Fax: 82-2-864-3956 Albatross SPM is Multi functional research grade system Flexure scanner and closed-loop
SUPPLEMENTARY INFORMATION
 Induction of coherent magnetization switching in a few atomic layers of FeCo using voltage pulses Yoichi Shiota 1, Takayuki Nozaki 1, 2,, Frédéric Bonell 1, Shinichi Murakami 1,2, Teruya Shinjo 1, and
System Options. Magnetic Property Measurement System. AC Susceptibility. AC Susceptibility Specifications
 System Options AC Susceptibility Magnetic Property Measurement System Many materials display dissipative mechanisms when exposed to an oscillating magnetic field, and their susceptibility is described
Polarization Experiments Using Jones Calculus
 Polarization Experiments Using Jones Calculus Reference http://chaos.swarthmore.edu/courses/physics50_2008/p50_optics/04_polariz_matrices.pdf Theory In Jones calculus, the polarization state of light is
Instructions for the Experiment
 Instructions for the Experiment Excitonic States in Atomically Thin Semiconductors 1. Introduction Alongside with electrical measurements, optical measurements are an indispensable tool for the study of
Microwave assisted magnetization reversal in single domain nanoelements 1
 Microwave assisted magnetization reversal in single domain nanoelements 1 H. T. Nembach 1, H. Bauer 1, J. M. Shaw 1, M. L. Schneider 2 and T.J. Silva 1 1. Electromagnetics Division, National Institute
Introduction of New Products
 Field Emission Electron Microscope JEM-3100F For evaluation of materials in the fields of nanoscience and nanomaterials science, TEM is required to provide resolution and analytical capabilities that can
APPLICATION NOTE
 THE PHYSICS BEHIND TAG OPTICS TECHNOLOGY AND THE MECHANISM OF ACTION OF APPLICATION NOTE 12-001 USING SOUND TO SHAPE LIGHT Page 1 of 6 Tutorial on How the TAG Lens Works This brief tutorial explains the
P H Y S I C A L P R O P E R T Y M E A S U R E M E N T S Y S T E M. Quantum Design
 P H Y S I C A L P R O P E R T Y M E A S U R E M E N T S Y S T E M Quantum Design S Y S T E M F E A T U R E S THE QUANTUM DESIGN PHYSICAL PROPERTY EASE OF USE MEASUREMENT SYSTEM (PPMS) REPRESENTS A UNIQUE
Physics 319 Laboratory: Optics
 1 Physics 319 Laboratory: Optics Birefringence II Objective: Previously, we have been concerned with the effect of linear polarizers on unpolarized and linearly polarized light. In this lab, we will explore
attocube systems Probe Stations for Extreme Environments CRYOGENIC PROBE STATION fundamentals principles of cryogenic probe stations
 PAGE 88 & 2008 2007 PRODUCT CATALOG CRYOGENIC PROBE STATION fundamentals...................... 90 principles of cryogenic probe stations attocps I.......................... 92 ultra stable cryogenic probe
plasmonic nanoblock pair
 Nanostructured potential of optical trapping using a plasmonic nanoblock pair Yoshito Tanaka, Shogo Kaneda and Keiji Sasaki* Research Institute for Electronic Science, Hokkaido University, Sapporo 1-2,
Real-Time Scanning Goniometric Radiometer for Rapid Characterization of Laser Diodes and VCSELs
 Real-Time Scanning Goniometric Radiometer for Rapid Characterization of Laser Diodes and VCSELs Jeffrey L. Guttman, John M. Fleischer, and Allen M. Cary Photon, Inc. 6860 Santa Teresa Blvd., San Jose,
Goals. Introduction. To understand the use of root mean square (rms) voltages and currents.
 voltages and currents.") Lab 10. AC Circuits Goals To show that AC voltages cannot generally be added without accounting for their phase relationships. That is, one must account for how they vary in time with respect to one another.
Lab 10. AC Circuits Goals To show that AC voltages cannot generally be added without accounting for their phase relationships. That is, one must account for how they vary in time with respect to one another.
z t h l g 2009 John Wiley & Sons, Inc. Published 2009 by John Wiley & Sons, Inc.
 x w z t h l g Figure 10.1 Photoconductive switch in microstrip transmission-line geometry: (a) top view; (b) side view. Adapted from [579]. Copyright 1983, IEEE. I g G t C g V g V i V r t x u V t Z 0 Z
Pre-Lab 10. Which plan or plans would work? Explain. Which plan is most efficient in regard to light power with the correct polarization? Explain.
 Pre-Lab 10 1. A laser beam is vertically, linearly polarized. For a particular application horizontal, linear polarization is needed. Two different students come up with different plans as to how to accomplish
DEEP FLAW DETECTION WITH GIANT MAGNETORESISTIVE (GMR) BASED SELF-NULLING PROBE
 BASED SELF-NULLING PROBE") DEEP FLAW DETECTION WITH GIANT MAGNETORESISTIVE (GMR) BASED SELF-NULLING PROBE Buzz Wincheski and Min Namkung NASA Langley Research Center Hampton, VA 23681 INTRODUCTION The use of giant magnetoresistive
DEEP FLAW DETECTION WITH GIANT MAGNETORESISTIVE (GMR) BASED SELF-NULLING PROBE Buzz Wincheski and Min Namkung NASA Langley Research Center Hampton, VA 23681 INTRODUCTION The use of giant magnetoresistive
Nanonics Systems are the Only SPMs that Allow for On-line Integration with Standard MicroRaman Geometries
 Nanonics Systems are the Only SPMs that Allow for On-line Integration with Standard MicroRaman Geometries 2002 Photonics Circle of Excellence Award PLC Ltd, England, a premier provider of Raman microspectral
queensgate a brand of Elektron Technology
 NanoSensors NX/NZ NanoSensor The NanoSensor is a non-contact position measuring system based on the principle of capacitance micrometry. Two sensor plates, a Target and a Probe, form a parallel plate capacitor.
CHAPTER 5 FINE-TUNING OF AN ECDL WITH AN INTRACAVITY LIQUID CRYSTAL ELEMENT
 CHAPTER 5 FINE-TUNING OF AN ECDL WITH AN INTRACAVITY LIQUID CRYSTAL ELEMENT In this chapter, the experimental results for fine-tuning of the laser wavelength with an intracavity liquid crystal element
III III 0 IIOI DID IIO 1101 I II 0II II 100 III IID II DI II
 (19) United States III III 0 IIOI DID IIO 1101 I0 1101 0II 0II II 100 III IID II DI II US 200902 19549A1 (12) Patent Application Publication (10) Pub. No.: US 2009/0219549 Al Nishizaka et al. (43) Pub.
3. are adherent cells (ie. cells in suspension are too far away from the coverslip)
") Before you begin, make sure your sample... 1. is seeded on #1.5 coverglass (thickness = 0.17) 2. is an aqueous solution (ie. fixed samples mounted on a slide will not work - not enough difference in refractive
Before you begin, make sure your sample... 1. is seeded on #1.5 coverglass (thickness = 0.17) 2. is an aqueous solution (ie. fixed samples mounted on a slide will not work - not enough difference in refractive
Power. Warranty. 30 <1.5 <3% Near TEM ~4.0 one year. 50 <1.5 <5% Near TEM ~4.0 one year
 DL CW Blue Violet Laser, 405nm 405 nm Operating longitudinal mode Several Applications: DNA Sequencing Spectrum analysis Optical Instrument Flow Cytometry Interference Measurements Laser lighting show
6 Electromagnetic Field Distribution Measurements using an Optically Scanning Probe System
 6 Electromagnetic Field Distribution Measurements using an Optically Scanning Probe System TAKAHASHI Masanori, OTA Hiroyasu, and ARAI Ken Ichi An optically scanning electromagnetic field probe system consisting
S600X SQUID M AGNETOMETER. S600X - For better magnetic measurements. The Better Choice. AC and DC measurements.
 S600X SQUID M AGNETOMETER S600X - For better magnetic measurements AC and DC measurements. lo -8 EMU sensitivity for total moment. Oscillator and extraction mode. MilliTesla field resolution and setting.
Figure for the aim4np Report
 Figure for the aim4np Report This file contains the figures to which reference is made in the text submitted to SESAM. There is one page per figure. At the beginning of the document, there is the front-page
Physics 1520, Spring 2013 Quiz 2, Form: A
 Physics 1520, Spring 2013 Quiz 2, Form: A Name: Date: Section 1. Exercises 1. The index of refraction of a certain type of glass for red light is 1.52. For violet light, it is 1.54. Which color of light,
Supplementary Figure 1. GO thin film thickness characterization. The thickness of the prepared GO thin
 Supplementary Figure 1. GO thin film thickness characterization. The thickness of the prepared GO thin film is characterized by using an optical profiler (Bruker ContourGT InMotion). Inset: 3D optical
- Near Field Scanning Optical Microscopy - Electrostatic Force Microscopy - Magnetic Force Microscopy
 - Near Field Scanning Optical Microscopy - Electrostatic Force Microscopy - Magnetic Force Microscopy Yongho Seo Near-field Photonics Group Leader Wonho Jhe Director School of Physics and Center for Near-field
LOS 1 LASER OPTICS SET
 LOS 1 LASER OPTICS SET Contents 1 Introduction 3 2 Light interference 5 2.1 Light interference on a thin glass plate 6 2.2 Michelson s interferometer 7 3 Light diffraction 13 3.1 Light diffraction on a
Helmholtz coils measure all three components of the total moment of the magnet block.
 Helmholtz coils measure all three components of the total moment of the magnet block. Helmholtz coil measurements were made by vendor and delivered with the magnets. Comparison measurements made at APS
Operating longitudinal mode Several Polarization ratio > 100:1. Power. Warranty. 30 <1.5 <5% Near TEM ~4.0 one year
 DL CW Blue Violet Laser, 405nm 405 nm Operating longitudinal mode Several Applications: DNA Sequencing Spectrum analysis Optical Instrument Flow Cytometry Interference Measurements Laser lighting show
Laser Beam Analysis Using Image Processing
 Journal of Computer Science 2 (): 09-3, 2006 ISSN 549-3636 Science Publications, 2006 Laser Beam Analysis Using Image Processing Yas A. Alsultanny Computer Science Department, Amman Arab University for
Laser Telemetric System (Metrology)
") Laser Telemetric System (Metrology) Laser telemetric system is a non-contact gauge that measures with a collimated laser beam (Refer Fig. 10.26). It measure at the rate of 150 scans per second. It basically
Laser Telemetric System (Metrology) Laser telemetric system is a non-contact gauge that measures with a collimated laser beam (Refer Fig. 10.26). It measure at the rate of 150 scans per second. It basically
Nano Beam Position Monitor
 Introduction Transparent X-ray beam monitoring and imaging is a new enabling technology that will become the gold standard tool for beam characterisation at synchrotron radiation facilities. It allows
Properties of Structured Light
 Properties of Structured Light Gaussian Beams Structured light sources using lasers as the illumination source are governed by theories of Gaussian beams. Unlike incoherent sources, coherent laser sources
Tuesday, Nov. 9 Chapter 12: Wave Optics
 Tuesday, Nov. 9 Chapter 12: Wave Optics We are here Geometric optics compared to wave optics Phase Interference Coherence Huygens principle & diffraction Slits and gratings Diffraction patterns & spectra
Experimental setup to perform ferromagnetic resonance studies at the Modern Physics Laboratory
 Experimental setup to perform ferromagnetic resonance studies at the Modern Physics Laboratory Author: Daniel Benejam Camps Advisor: Joan Manel Hernàndez Ferràs Facultat de Física, Universitat de Barcelona,
T40B. Torque Flange. Special features. Data sheet. Overall concept
 T40B Torque Flange Special features - Nominal (rated) torques 50 N m, 0 N m, 200 N m, 500 N m, 1 kn m, 2 kn m, 3 kn m, 5 kn m and kn m - Nominal rated rotational speed up to 24000 rpm (depending on nominal
3-Axis Magnetic Sensor HMC1043
 3-Axis Magnetic Sensor HMC1043 Advanced Information The Honeywell HMC1043 is a miniature three-axis surface mount sensor array designed for low field magnetic sensing. By adding the HMC1043 with supporting
System Options. Magnetic Property Measurement System. AC Susceptibility. AC Susceptibility Specifications
 System Options AC Susceptibility Magnetic Property Measurement System Many materials display dissipative mechanisms when exposed to an oscillating magnetic field, and their susceptibility is described
Intermediate and Advanced Labs PHY3802L/PHY4822L
 Intermediate and Advanced Labs PHY3802L/PHY4822L Torsional Oscillator and Torque Magnetometry Lab manual and related literature The torsional oscillator and torque magnetometry 1. Purpose Study the torsional
Lecture 20: Optical Tools for MEMS Imaging
 MECH 466 Microelectromechanical Systems University of Victoria Dept. of Mechanical Engineering Lecture 20: Optical Tools for MEMS Imaging 1 Overview Optical Microscopes Video Microscopes Scanning Electron
Page 2 A 42% B 50% C 84% D 100% (Total 1 mark)
") Q1.A transformer has 1150 turns on the primary coil and 500 turns on the secondary coil. The primary coil draws a current of 0.26 A from a 230 V ac supply. The current in the secondary coil is 0.50 A.
Q1.A transformer has 1150 turns on the primary coil and 500 turns on the secondary coil. The primary coil draws a current of 0.26 A from a 230 V ac supply. The current in the secondary coil is 0.50 A.
Optical Isolator Tutorial (Page 1 of 2) νlh, where ν, L, and H are as defined below. ν: the Verdet Constant, a property of the
 νlh, where ν, L, and H are as defined below. ν: the Verdet Constant, a property of the") Aspheric Optical Isolator Tutorial (Page 1 of 2) Function An optical isolator is a passive magneto-optic device that only allows light to travel in one direction. Isolators are used to protect a source
Aspheric Optical Isolator Tutorial (Page 1 of 2) Function An optical isolator is a passive magneto-optic device that only allows light to travel in one direction. Isolators are used to protect a source
2. Pulsed Acoustic Microscopy and Picosecond Ultrasonics
 1st International Symposium on Laser Ultrasonics: Science, Technology and Applications July 16-18 2008, Montreal, Canada Picosecond Ultrasonic Microscopy of Semiconductor Nanostructures Thomas J GRIMSLEY
Versatile magneto-optic Kerr effect polarimeter for studies of domain-wall dynamics in magnetic nanostructures
 REVIEW OF SCIENTIFIC INSTRUMENTS 77, 103901 2006 Versatile magneto-optic Kerr effect polarimeter for studies of domain-wall dynamics in magnetic nanostructures Corneliu Nistor, Geoffrey S. D. Beach, and
Optics and Lasers. Matt Young. Including Fibers and Optical Waveguides
 Matt Young Optics and Lasers Including Fibers and Optical Waveguides Fourth Revised Edition With 188 Figures Springer-Verlag Berlin Heidelberg New York London Paris Tokyo Hong Kong Barcelona Budapest Contents
Brown University Department of Physics. Physics 6 Spring 2006 A SIMPLE FLUXGATE MAGNETOMETER
 Brown University Department of Physics Physics 6 Spring 2006 1 Introduction A SIMPLE FLUXGATE MAGNETOMETER A simple fluxgate magnetometer can be constructed out available equipment in the lab. It can easily
Inductive Sensors. Fig. 1: Geophone
 Inductive Sensors A voltage is induced in the loop whenever it moves laterally. In this case, we assume it is confined to motion left and right in the figure, and that the flux at any moment is given by
Akiyama-Probe (A-Probe) guide
 guide") Akiyama-Probe (A-Probe) guide This guide presents: what is Akiyama-Probe, how it works, and what you can do Dynamic mode AFM Version: 2.0 Introduction NANOSENSORS Akiyama-Probe (A-Probe) is a self-sensing
Akiyama-Probe (A-Probe) guide This guide presents: what is Akiyama-Probe, how it works, and what you can do Dynamic mode AFM Version: 2.0 Introduction NANOSENSORS Akiyama-Probe (A-Probe) is a self-sensing
:... resolution is about 1.4 μm, assumed an excitation wavelength of 633 nm and a numerical aperture of 0.65 at 633 nm.
 PAGE 30 & 2008 2007 PRODUCT CATALOG Confocal Microscopy - CFM fundamentals :... Over the years, confocal microscopy has become the method of choice for obtaining clear, three-dimensional optical images
Micro-manipulated Cryogenic & Vacuum Probe Systems
 Janis micro-manipulated probe stations are designed for non-destructive electrical testing using DC, RF, and fiber-optic probes. They are useful in a variety of fields including semiconductors, MEMS, superconductivity,
DICOM Correction Proposal
 Tracking Information - Administration Use Only DICOM Correction Proposal Correction Proposal Number Status CP-1713 Letter Ballot Date of Last Update 2018/01/23 Person Assigned Submitter Name David Clunie
Department of Electrical Engineering and Computer Science, Massachusetts Institute of Technology, 77. Table of Contents 1
 Efficient single photon detection from 500 nm to 5 μm wavelength: Supporting Information F. Marsili 1, F. Bellei 1, F. Najafi 1, A. E. Dane 1, E. A. Dauler 2, R. J. Molnar 2, K. K. Berggren 1* 1 Department
TechNote. T001 // Precise non-contact displacement sensors. Introduction
 TechNote T001 // Precise non-contact displacement sensors Contents: Introduction Inductive sensors based on eddy currents Capacitive sensors Laser triangulation sensors Confocal sensors Comparison of all
Uncovering a Hidden RCL Series Circuit
 Purpose Uncovering a Hidden RCL Series Circuit a. To use the equipment and techniques developed in the previous experiment to uncover a hidden series RCL circuit in a box and b. To measure the values of
Radial Polarization Converter With LC Driver USER MANUAL
 ARCoptix Radial Polarization Converter With LC Driver USER MANUAL Arcoptix S.A Ch. Trois-portes 18 2000 Neuchâtel Switzerland Mail: info@arcoptix.com Tel: ++41 32 731 04 66 Principle of the radial polarization
EE119 Introduction to Optical Engineering Spring 2003 Final Exam. Name:
 EE119 Introduction to Optical Engineering Spring 2003 Final Exam Name: SID: CLOSED BOOK. THREE 8 1/2 X 11 SHEETS OF NOTES, AND SCIENTIFIC POCKET CALCULATOR PERMITTED. TIME ALLOTTED: 180 MINUTES Fundamental
Large Signal Displacement Measurement with an MTI Photonic Sensor Rev B
 Radiant Technologies, Inc. 2835D Pan American Freeway NE Albuquerque, NM 8717 Tel: 55-842-87 Fax: 55-842-366 e-mail: radiant@ferrodevices.com www.ferrodevices.com Large Signal Displacement Measurement
Development of Control Algorithm for Ring Laser Gyroscope
 International Journal of Scientific and Research Publications, Volume 2, Issue 10, October 2012 1 Development of Control Algorithm for Ring Laser Gyroscope P. Shakira Begum, N. Neelima Department of Electronics
White Paper: Modifying Laser Beams No Way Around It, So Here s How
 White Paper: Modifying Laser Beams No Way Around It, So Here s How By John McCauley, Product Specialist, Ophir Photonics There are many applications for lasers in the world today with even more on the
7 Telsa SQUID Magnetometer
 7 Telsa SQUID Magnetometer Cryogen Free / Liquid Helium Cooled www.cryogenic.co.uk Introduction S700X - For better magnetic measurements Cryogen free or Liquid Helium based system High homogeneity 7 Tesla
Angular Drift of CrystalTech (1064nm, 80MHz) AOMs due to Thermal Transients. Alex Piggott
 AOMs due to Thermal Transients. Alex Piggott") Angular Drift of CrystalTech 38 197 (164nm, 8MHz) AOMs due to Thermal Transients Alex Piggott July 5, 21 1 .1 General Overview of Findings The AOM was found to exhibit significant thermal drift effects,
Angular Drift of CrystalTech 38 197 (164nm, 8MHz) AOMs due to Thermal Transients Alex Piggott July 5, 21 1 .1 General Overview of Findings The AOM was found to exhibit significant thermal drift effects,
Will contain image distance after raytrace Will contain image height after raytrace
 Name: LASR 51 Final Exam May 29, 2002 Answer all questions. Module numbers are for guidance, some material is from class handouts. Exam ends at 8:20 pm. Ynu Raytracing The first questions refer to the
Lecture 26. PHY 112: Light, Color and Vision. Finalities. Final: Thursday May 19, 2:15 to 4:45 pm. Prof. Clark McGrew Physics D 134
 PHY 112: Light, Color and Vision Lecture 26 Prof. Clark McGrew Physics D 134 Finalities Final: Thursday May 19, 2:15 to 4:45 pm ESS 079 (this room) Lecture 26 PHY 112 Lecture 1 Introductory Chapters Chapters
Compact Sensors - S8 Series. Compact size and high performance for the most challenging detection applications
 Compact size and high performance for the most challenging detection applications Compact dimensions (14x42x25 mm) Background suppression for transparent and shiny objects High speed contrast sensor up
Spatial detection of ferromagnetic wires using GMR sensor and. based on shape induced anisotropy
 Spatial detection of ferromagnetic wires using GMR sensor and based on shape induced anisotropy Behrooz REZAEEALAM Electrical Engineering Department, Lorestan University, P. O. Box: 465, Khorramabad, Lorestan,
Terahertz control of nanotip photoemission
 Terahertz control of nanotip photoemission L. Wimmer, G. Herink, D. R. Solli, S. V. Yalunin, K. E. Echternkamp, and C. Ropers Near-infrared pulses of 800 nm wavelength, 50 fs duration and at 1 khz repetition
Compact Sensors - S8 Series. Compact size and high performance for the most challenging detection applications
 Compact size and high performance for the most challenging detection applications Compact dimensions (14x42x25 mm) Background suppression for transparent and shiny objects High speed contrast sensor up
Chapter Ray and Wave Optics
 109 Chapter Ray and Wave Optics 1. An astronomical telescope has a large aperture to [2002] reduce spherical aberration have high resolution increase span of observation have low dispersion. 2. If two
Intrinsic mirror birefringence measurements for the Any Light Particle Search (ALPS)
") Intrinsic mirror birefringence measurements for the Any Light Particle Search (ALPS) Claire Baum University of Florida August 11, 2016 Abstract In this paper, I use a heterodyne polarimeter to measure
Intrinsic mirror birefringence measurements for the Any Light Particle Search (ALPS) Claire Baum University of Florida August 11, 2016 Abstract In this paper, I use a heterodyne polarimeter to measure
AC Transport Option for the PPMS. 31 October, 2002
 AC Transport Option for the PPMS 31 October, 2002 Outline Basics of electrical transport measurements QD ACT Hardware Performing ACT Measurements Basic Troubleshooting Electrical Resistance Resistance:
Optical Microscope. Active anti-vibration table. Mechanical Head. Computer and Software. Acoustic/Electrical Shield Enclosure
 Optical Microscope On-axis optical view with max. X magnification Motorized zoom and focus Max Field of view: mm x mm (depends on zoom) Resolution : um Working Distance : mm Magnification : max. X Zoom
STEM Spectrum Imaging Tutorial
 STEM Spectrum Imaging Tutorial Gatan, Inc. 5933 Coronado Lane, Pleasanton, CA 94588 Tel: (925) 463-0200 Fax: (925) 463-0204 April 2001 Contents 1 Introduction 1.1 What is Spectrum Imaging? 2 Hardware 3
(A) 2f (B) 2 f (C) f ( D) 2 (E) 2
 2f (B) 2 f (C) f ( D) 2 (E) 2") 1. A small vibrating object S moves across the surface of a ripple tank producing the wave fronts shown above. The wave fronts move with speed v. The object is traveling in what direction and with what
1. A small vibrating object S moves across the surface of a ripple tank producing the wave fronts shown above. The wave fronts move with speed v. The object is traveling in what direction and with what