PRACTICAL PROBLEMS INVOLVING PHASE NOISE MEASUREMENTS
|
|
|
- Agatha Cain
- 6 years ago
- Views:
Transcription
1 33rdAnnual Precise Time and Time Interval (P77 1)Meeting PRACTICAL PROBLEMS INVOLVING PHASE NOISE MEASUREMENTS Warren F. Walls Femtosecond Systems, Inc Van Gordon St., Ste. 301-N Wheat Ridge, CO , USA Web: w ww.phasenoise.com Abstract RADAR systems, secure communications, space-based applications, precision navigation, and computer timing applications are among some of the increasingly lurge number of modern electronic systems with phase noise performance requiremerzts. Making these measurements is not always as easy as using the ubiquitous multi-meter. The topology or measurement configuration can signriantly impact the speed, level of accuracy, and noise jloor of the measurement itself. Careful attention must be paid to many different details in order to ensure the best possible and most accurate measurement. The inherentpresence of various noise types and the interaction of amplitude and phase noise can cause a user, who blindly characterizes signals, to possibly misrepresent or misinterpret the performance and other issues. A survey of various phase noise measurement techniques is presented with their associated qualities. A few specifi measurement requirements are shown with examples of actual measurements in order to illustrate current technology capability. Drawbacks of various configurations, as well as typical gotchas, are mentioned. INTRODUCTION Advances in the performance of personal communication systems, as well as precision navigation and others areas, have continued to demand more stable and quieter systems. Phase noise, amplitude noise, and Allan deviation are the three common terms used when talking about the performance of a highly stable, low noise system. Understanding these areas and the different ways to use the tools is very key. Different analysis approaches and tools can be used to characterize various behaviors of a system and, thus, help in the development and integration of their performance. The phase noise measurement portion alone is large enough that this paper focuses on just a few of the key phase noise measurement typologies and reviews their advantages and disadvantages. Finally, a variety of reminders and gotcha s are discussed. SINGLE-CHANNEL MEASUREMENT SYSTEM The single channel measurement system refers to the fact that only one channel comes out to the FFT or spectrum analyzer. Figure 1 illustrates such a system. This system topology typically refers to a twosource system where one signal is phase-locked to the other. This technique is generally used when two sources, at the same frequency, are involved. This approach works over a large frequency range and has a 407
2 reasonably low phase noise measurement floor. With only two different mixers it is possible to measure the noise on carriers from 1 MHz to 18 or 26 GHz. This is one of the simplest systems to set up and start using. Although this approach is good for measuring some of the better oscillators, one does have to worry about PLL effects close to the carrier when measuring noisy sources. If one has a very unstable oscillator, a lot of PLL gain is required to capture and hold the device in quadrature. The large amount of gain necessary to hold the wild source in lock can show itself in the phase noise plot. This is generally seen by a roll off of the noise as one approaches zero Hz offset. One of the other disadvantages is that one cannot separate the noise in the reference from that in the DUT. Multiple measurements may be required to determine which source dominates the noise floor. If the reference is 20 db below the noise of the DUT, then the reference can be ignored and the DUT is the main contributor. If the DUT and reference are at the same level, then divide the noise between the two sources - subtract 3 db. The three-cornered-hat method may be employed to find the best source. One must also make sure that enough averages have been taken on the FFT or spectrum analyzer for the confidence interval being reported. This is discussed in more detail below. Figure 1: Single Channel Phase Noise Measurement Setup DELAY LINE DISCRIMINATOR The delay line discriminator technique is similar to the single-channel system except that only one source is used. Figure 2 illustrates a typical configuration. The source is usually amplified and then fed into a directional coupler. The through path of the directional coupler drives the long length of delay line. For our illustration, we used +23 dbm out of the amplifier and 500 ns of delay cable. This is typically about 350 feet or so of cable or around 10 db of attenuation. The coupled signal is attenuated 10 db in the coupler and fed into the phase shifter. The through path looses about 1 db in the coupler, then about 10 db in the delay line, The resultant is about +12 dbm on both sides of a +7 dbm mixer, which turns it on hard. This produces the best phase noise measurement sensitivity. This technique gives S,(f) instead of S&f). In order to convert, one must divide by f2, the offset frequency at which the measurement is being made, and correctly calibrate the mixer sensitivity. The carrier frequency is then shifted up and-down from center frequency an amount that produces about +-1V change from 0 at the output of the phase noise detector. The total delta in frequency, with the total delta in voltage change, gives the mixer sensitivity adjustment. 408
3 LoWNok myth Phose Noise Detector Figure 2: Delay Line Discriminator Configuration One of the advantages is the fast measurement setup time. Since the system is put into quadrature using the delay line, no PLL is invoked. This system configuration is best for noisy sources. The fast PLL is not used; instead, the system tracks the noisy oscillator. The long delay partially decorrelates the noise from one side from the noise on the other, thus making it possible to make the measurement. Adding an amplifier inside the loop significantly raises the noise floor. That is why so much power must be present at the input. The downside is that the solution is fairly narrow band. Multiple delay lines are required for large offset frequencies and in order to cover a large carrier frequency range. Losses in the cables and the frequency coverage of the coupler and amplifier are limited. There is also a null that occurs at the offset frequency f = UT. It is typical recommended that a delay line be used to 1/(4~). For our example of 500 ns, one would use it from dc to 500 khz. Details can be found in the references. The noise floor of the system is dependent upon the length of delay. Longer delay means lower noise floor, but higher loss and lower offset frequency. There is ultimately a balance point between the cost of the cable and the loss through the cable of a given noise floor and delay length. The delay line discriminator approach, while it does not involve the trickier PLL topology, it is much higher in noise then the two-oscillator approach. See Figure 6 for a comparison of the noise floors. CROSS-CORRELATION The cross-correlation measurement system is similar to the two-oscillator system, except that there are three oscillators. Figure 3 illustrates a typical configuration. The noise from the first reference feeds into the first phase noise detector and ends up on channel 1 of the FFT analyzer. The noise from the second reference shows up in the second phase noise detector and in channel 2 of the FFT. The DUT noise goes into the high isolation inductive power splitter and then into each of the two phase noise detectors and into both channels of the FFT analyzer. When the analyzer is set to average, the common noise is kept, and the noise not common to both channels is averaged away. This approach is more complex, requires more equipment, and is therefore more expensive. One typically achieves an improvement of 15 to 20 db over the two-oscillator noise floor. Another way of looking at this is that the reference noise is reduced by 15 to 20 db. This enables one to measure new devices that are better than anything else (up to db better 409
4 than the references). This advantage means that one can make a clear measurement of a source and know that the measured noise is the DUT Figure 3 : Cross-Correlation Phase Noise Measurement System Like the two-oscillator method, the PLL is used in this approach to keep the sources in quadrature at the mixer. Typically one uses the cross-correlation approach for the best sources and, therefore, keeping them locked is not as difficult. Each reference is locked to track the DUT. PLL bandwidth does need to be monitored. Corrections for PLL bandwidth works to some degree, but deep corrections have growing errors. Since the noise of the uncorrelated inputs is being averaged away, many more averages are required to achieve the same confidence interval. Just like the two-oscillator method, and unlike the basic delay line discriminator, this system can be used over a large frequency range without changing a lot of hardware. The delay discriminator system can be extended using a front-end down conversion, say to 100 MHz, and then the rest of the amplifier and loop section is always done at 100 MHz. Cross-correlation can also be added to the delay discriminator solution to improve the noise floor by 15 to 20 db. "GOTCHAS" There are many areas in which one can be tricked into false readings or frustrated with the process of trying to achieve a good measurement. Some of these areas are touched on in this section. 410
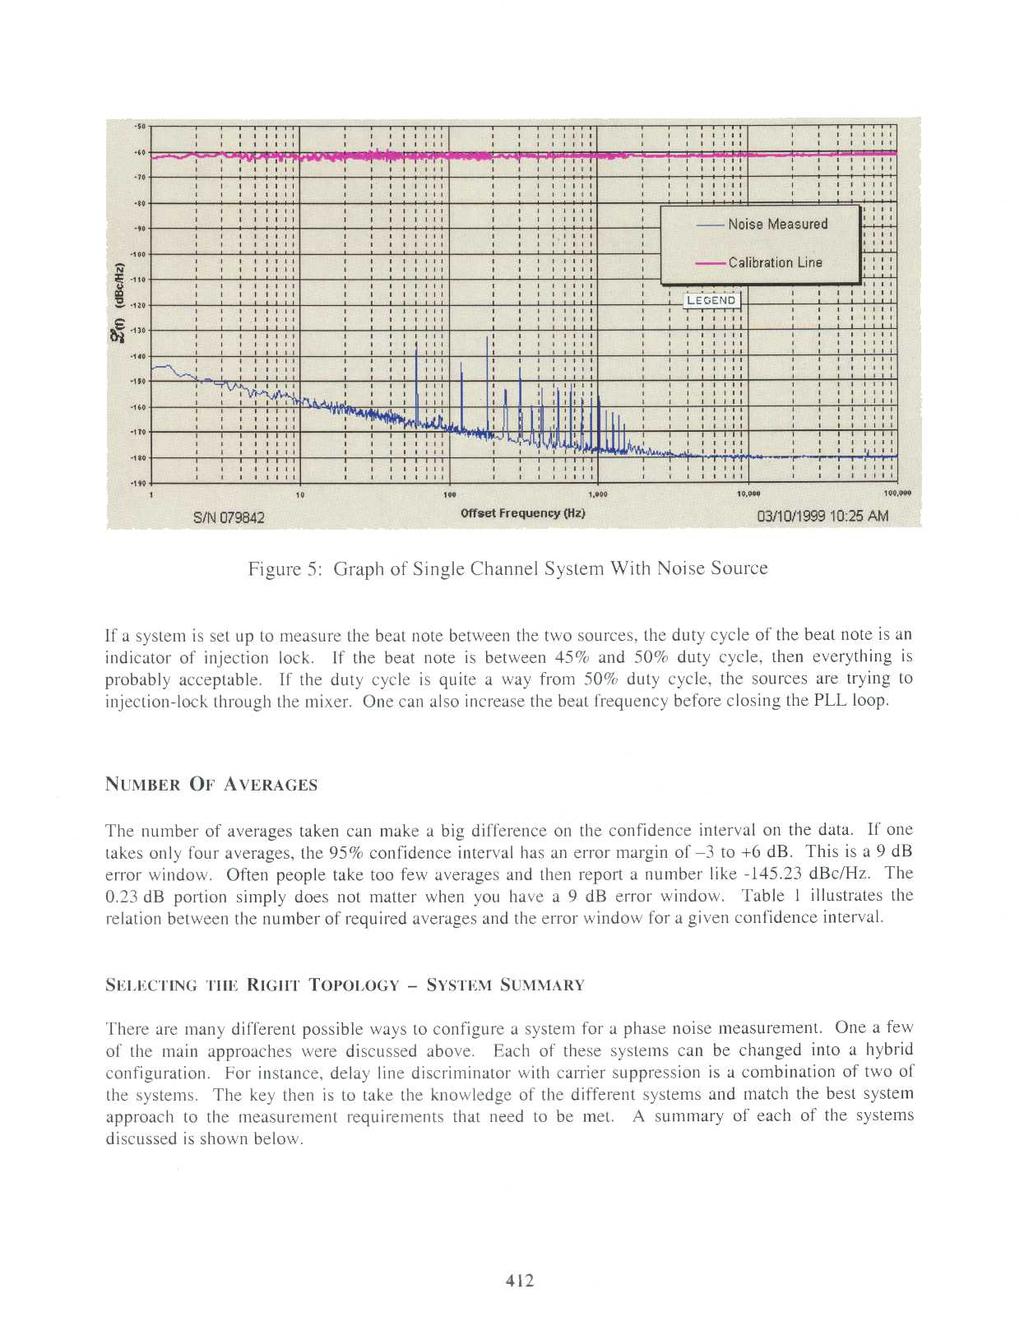
5 PHASENOISESTANDARD Some of the simple calibrations work well when one understands that the rest of the system is well behaved. Most of the time this is acceptable. Sometimes it is necessary to look at an entire system s performance including the PLL. The AMPM Calibration Standard allows one to inject a known amount of phase noise onto a signal and look at how this transfers through the system. How the system reports the final number can be compared to how the noise was put onto the carrier and a correction for the system can be determined for all offset frequencies being used. Figure 4 Illustrates the typology of the system and Figure 5 shows a typical resulting plot. The flat line at the top of the plot illustrates the calibration level and flatness of the measurement. The regular noise plot at the bottom is the calibrated noise measurement. This one plot then encapsulates the entire performance of the system including the end results.. Figure 4: Single Channel System With Noise Source INJECTION LOCKING Injection locking occurs when the system appears to phase lock itself without the help of the PLL. In this case, control of the system is lost to some extent and true quadrature is not guaranteed. The noise of the sources is also cleaned up due to the injection lock; therefore, the resultant measurement is biased. Injection locking can occur through the power supplies, through the air, and through the mixer itself. Microwave sources in particular, but also sources that are not shielded properly will phase-lock through the air. One can place a large glass of water in the area and watch the system change. The water absorbs some of the radiation from the sources and changes the lock. Power supplies must have good isolation and the sources must have good isolation to the mixer. Sometimes low noise isolation amplifiers must be used to prevent the sources from locking through the mixer. 41 1
6
7 Number of Samples k z 1 (approx. 68%) k G 1.9 (approx. 95%) Sm = S[l+A]; S = SmL,,+dB Sm = S[l+A]; S = Sm,,+dB A SmL SrnH A SmL SmH O OS Table 1: Error Window vs. Number of Averages for a Given Confidence Interval Single-Channel Tw- Source Method (See Figure 1) Uses two sources - one reference, one device under test PLL used to keep both sources in quadrature at output of mixer PLL bandwidth can bias data close to the carrier Lower noise floor than delay line discriminator approach Low cost to implement and broad frequency coverage with few components Can be difficult to determine which source or system floor dominates See Figure 6 for a typical system noise floor plot Delay Line Discriminator (See Figure 2) Uses one source and a long length of delay cable Works better with noisy sources Quadrature achieved using a phase shifter No PLL bandwidth attenuation to worry about Requires more components than Single-Channel Two Source Method Higher Noise Floor than Single-Channel Two-Source Method Faster to setup than most other methods See Figure 6 for a typical system noise floor plot 413
8
9 Broadband okay, but l/f region too high. Look at a better reference or use carrier suppression or replace mixer. System overall noise floor is too high. Change over to a cross-correlation topology. Calibration has errors due to mixer/amplifier gain variations with offset frequency. Use an AM/PM calibration standard to measure the system at each offset frequency. Residual detection of AM noise from Ref or DUT compromises measurement. See if a mixer with better balance will solve the problem or try to inject AM on the signal and adjust the phase balance (dc offset in the PLL loop) to minimize AM detection or switch to carrier suppression. Injection locking is occurring. Improve the isolation between the sources and the mixer either by using an attenuator or an isolation amplifier. One may also need to look at power supplies or shielding. PLL bandwidth compensating for the phase noise close to the carrier. Reduce the PLL gain or switch to the delay line discriminator approach or measure the amount of attenuation and compensate. This can be done using an AM/PM calibration standard. PLL doesn t seem to be locking. Do you have the right tuning voltage for your PLL output matched to the tuning range of your source? Does the source tune far enough to match the frequency of the other source? An external bias to the tune might be necessary to get the source close to the desired operating frequency. PLL still doesn t seem to work. Frequency-divide the sources to a much lower frequency. Since the phase excursion also is divided, much less PLL gain is required and, hence, the PM bias is much less. The final plot has large excursions between the peaks and valleys. If you don t have a fairly fine line through the noise sections of the plot, the number of averages needs to be increased. See Table 1 for details. Line harmonics are too high or causing excess measurement noise. Make sure all of the equipment is on the same side of the ac line. Look at using line filters, conditioners, or batteries. Consider using an inside/outside dc block. Move the measurement system away from high ac current sources and transformers. CONCLUSION Characterizing the phase noise of a system or component is not necessarily very easy. Many different approaches are possible, but the key is to find the best approach for the measurement requirements at hand. 415
10 A survey of some of the more common topologies along with some possible trouble spots helps one to review and keep in mind the advantages and limitations of each approach. GENERAL REFERENCES F. L. Walls, A. J. D. Clements, C. M. Felton, M. A. Lombardi, and M. D. Vanek, 1990, Extending the Range and Accuracy of Phase Noise Measurements, National Institute of Standards and Technology (NIST) Technical Note 1337, TN D. W. Allan, 1990, Time and Frequency (Time-Domain) Characterization, Estimation, and Prediction of Precision Clocks and Oscillators, ibid., TN D. Allan, H. Hellwig, P. Kartaschoff, J. Vanier, J. Vig, G. M. R. Winkler, 1990, Standard Terminology for Fundamental Frequency and Time Metrology, ibid., TNl International Consultative Committee on Radiocommunications (CCIR), 1990, Characterization of Frequency and Phase Noise, ibid., TN Proceedings of the National Conference of Standards Laboratories (NCSL) Workshop and Symposium on Precision Phase Noise Metrology, August 199 1, Albuquerque, New Mexico, USA. 416
A COMPACT, AGILE, LOW-PHASE-NOISE FREQUENCY SOURCE WITH AM, FM AND PULSE MODULATION CAPABILITIES
 A COMPACT, AGILE, LOW-PHASE-NOISE FREQUENCY SOURCE WITH AM, FM AND PULSE MODULATION CAPABILITIES Alexander Chenakin Phase Matrix, Inc. 109 Bonaventura Drive San Jose, CA 95134, USA achenakin@phasematrix.com
Antenna Measurements using Modulated Signals
 Antenna Measurements using Modulated Signals Roger Dygert MI Technologies, 1125 Satellite Boulevard, Suite 100 Suwanee, GA 30024-4629 Abstract Antenna test engineers are faced with testing increasingly
Lab Exercise PN: Phase Noise Measurement - 1 -
 Lab Exercise PN: Phase Noise Measurements Phase noise is a critical specification for oscillators used in applications such as Doppler radar and synchronous communications systems. It is tricky to measure
Keysight Technologies 8 Hints for Making Better Measurements Using RF Signal Generators. Application Note
 Keysight Technologies 8 Hints for Making Better Measurements Using RF Signal Generators Application Note 02 Keysight 8 Hints for Making Better Measurements Using RF Signal Generators - Application Note
note application Measurement of Frequency Stability and Phase Noise by David Owen
 application Measurement of Frequency Stability and Phase Noise note by David Owen The stability of an RF source is often a critical parameter for many applications. Performance varies considerably with
PN9000 PULSED CARRIER MEASUREMENTS
 The specialist of Phase noise Measurements PN9000 PULSED CARRIER MEASUREMENTS Carrier frequency: 2.7 GHz - PRF: 5 khz Duty cycle: 1% Page 1 / 12 Introduction When measuring a pulse modulated signal the
Residual Phase Noise Measurement Extracts DUT Noise from External Noise Sources By David Brandon and John Cavey
 Residual Phase Noise easurement xtracts DUT Noise from xternal Noise Sources By David Brandon [david.brandon@analog.com and John Cavey [john.cavey@analog.com Residual phase noise measurement cancels the
PXA Configuration. Frequency range
 Keysight Technologies Making Wideband Measurements Using the Keysight PXA Signal Analyzer as a Down Converter with Infiniium Oscilloscopes and 89600 VSA Software Application Note Introduction Many applications
Phase Noise and Tuning Speed Optimization of a MHz Hybrid DDS-PLL Synthesizer with milli Hertz Resolution
 Phase Noise and Tuning Speed Optimization of a 5-500 MHz Hybrid DDS-PLL Synthesizer with milli Hertz Resolution BRECHT CLAERHOUT, JAN VANDEWEGE Department of Information Technology (INTEC) University of
Model 7000 Series Phase Noise Test System
 Established 1981 Advanced Test Equipment Rentals www.atecorp.com 800-404-ATEC (2832) Model 7000 Series Phase Noise Test System Fully Integrated System Cross-Correlation Signal Analysis to 26.5 GHz Additive
Agilent PNA Microwave Network Analyzers
 Agilent PNA Microwave Network Analyzers Application Note 1408-1 Mixer Transmission Measurements Using The Frequency Converter Application Introduction Frequency-converting devices are one of the fundamental
Glossary of VCO terms
 Glossary of VCO terms VOLTAGE CONTROLLED OSCILLATOR (VCO): This is an oscillator designed so the output frequency can be changed by applying a voltage to its control port or tuning port. FREQUENCY TUNING
Linearity Improvement Techniques for Wireless Transmitters: Part 1
 From May 009 High Frequency Electronics Copyright 009 Summit Technical Media, LLC Linearity Improvement Techniques for Wireless Transmitters: art 1 By Andrei Grebennikov Bell Labs Ireland In modern telecommunication
Berkeley Nucleonics Corporation
 Berkeley Nucleonics Corporation A trusted source for quality and innovative instrumentation since 1963 Test And Measurement Nuclear Expertise RF/Microwave BNC at Our Core BNC Mission: Providing our customers
Title: New High Efficiency Intermodulation Cancellation Technique for Single Stage Amplifiers.
 Title: New High Efficiency Intermodulation Cancellation Technique for Single Stage Amplifiers. By: Ray Gutierrez Micronda LLC email: ray@micronda.com February 12, 2008. Introduction: This article provides
APPH6040B / APPH20G-B Specification V2.0
 APPH6040B / APPH20G-B Specification V2.0 (July 2014, Serial XXX-XX33XXXXX-XXXX or higher) A fully integrated high-performance cross-correlation signal source analyzer for to 7 or 26 GHz 1 Introduction
MAKING TRANSIENT ANTENNA MEASUREMENTS
 MAKING TRANSIENT ANTENNA MEASUREMENTS Roger Dygert, Steven R. Nichols MI Technologies, 1125 Satellite Boulevard, Suite 100 Suwanee, GA 30024-4629 ABSTRACT In addition to steady state performance, antennas
Measurements 2: Network Analysis
 Measurements 2: Network Analysis Fritz Caspers CAS, Aarhus, June 2010 Contents Scalar network analysis Vector network analysis Early concepts Modern instrumentation Calibration methods Time domain (synthetic
A 3 TO 30 MHZ HIGH-RESOLUTION SYNTHESIZER CONSISTING OF A DDS, DIVIDE-AND-MIX MODULES, AND A M/N SYNTHESIZER. Richard K. Karlquist
 A 3 TO 30 MHZ HIGH-RESOLUTION SYNTHESIZER CONSISTING OF A DDS, -AND-MIX MODULES, AND A M/N SYNTHESIZER Richard K. Karlquist Hewlett-Packard Laboratories 3500 Deer Creek Rd., MS 26M-3 Palo Alto, CA 94303-1392
Keysight Technologies PNA-X Series Microwave Network Analyzers
 Keysight Technologies PNA-X Series Microwave Network Analyzers Active-Device Characterization in Pulsed Operation Using the PNA-X Application Note Introduction Vector network analyzers (VNA) are the common
Added Phase Noise measurement for EMBRACE LO distribution system
 Added Phase Noise measurement for EMBRACE LO distribution system G. Bianchi 1, S. Mariotti 1, J. Morawietz 2 1 INAF-IRA (I), 2 ASTRON (NL) 1. Introduction Embrace is a system composed by 150 receivers,
Keysight Technologies E5052B Signal Source Analyzer Advanced Phase Noise and Transient Measurement Techniques. Application Note
 Keysight Technologies E5052B Signal Source Analyzer Advanced Phase Noise and Transient Measurement Techniques Application Note Introduction The Keysight Technologies, Inc. E5052B Signal Source Analyzer
Optical generation of frequency stable mm-wave radiation using diode laser pumped Nd:YAG lasers
 Optical generation of frequency stable mm-wave radiation using diode laser pumped Nd:YAG lasers T. Day and R. A. Marsland New Focus Inc. 340 Pioneer Way Mountain View CA 94041 (415) 961-2108 R. L. Byer
Keysight Technologies Pulsed Antenna Measurements Using PNA Network Analyzers
 Keysight Technologies Pulsed Antenna Measurements Using PNA Network Analyzers White Paper Abstract This paper presents advances in the instrumentation techniques that can be used for the measurement and
Optoelectronic Components Testing with a VNA(Vector Network Analyzer) VNA Roadshow Budapest 17/05/2016
 VNA Roadshow Budapest 17/05/2016") Optoelectronic Components Testing with a VNA(Vector Network Analyzer) VNA Roadshow Budapest 17/05/2016 Content Introduction Photonics & Optoelectronics components Optical Measurements VNA (Vector Network
Optoelectronic Components Testing with a VNA(Vector Network Analyzer) VNA Roadshow Budapest 17/05/2016 Content Introduction Photonics & Optoelectronics components Optical Measurements VNA (Vector Network
UNIT-3. Electronic Measurements & Instrumentation
 UNIT-3 1. Draw the Block Schematic of AF Wave analyzer and explain its principle and Working? ANS: The wave analyzer consists of a very narrow pass-band filter section which can Be tuned to a particular
Understanding Low Phase Noise Signals. Presented by: Riadh Said Agilent Technologies, Inc.
 Understanding Low Phase Noise Signals Presented by: Riadh Said Agilent Technologies, Inc. Introduction Instabilities in the frequency or phase of a signal are caused by a number of different effects. Each
Using Frequency Diversity to Improve Measurement Speed Roger Dygert MI Technologies, 1125 Satellite Blvd., Suite 100 Suwanee, GA 30024
 Using Frequency Diversity to Improve Measurement Speed Roger Dygert MI Technologies, 1125 Satellite Blvd., Suite 1 Suwanee, GA 324 ABSTRACT Conventional antenna measurement systems use a multiplexer or
레이저의주파수안정화방법및그응용 박상언 ( 한국표준과학연구원, 길이시간센터 )
") 레이저의주파수안정화방법및그응용 박상언 ( 한국표준과학연구원, 길이시간센터 ) Contents Frequency references Frequency locking methods Basic principle of loop filter Example of lock box circuits Quantifying frequency stability Applications
레이저의주파수안정화방법및그응용 박상언 ( 한국표준과학연구원, 길이시간센터 ) Contents Frequency references Frequency locking methods Basic principle of loop filter Example of lock box circuits Quantifying frequency stability Applications
Performance of the Prototype NLC RF Phase and Timing Distribution System *
 SLAC PUB 8458 June 2000 Performance of the Prototype NLC RF Phase and Timing Distribution System * Josef Frisch, David G. Brown, Eugene Cisneros Stanford Linear Accelerator Center, Stanford University,
Improving Amplitude Accuracy with Next-Generation Signal Generators
 Improving Amplitude Accuracy with Next-Generation Signal Generators Generate True Performance Signal generators offer precise and highly stable test signals for a variety of components and systems test
An Investigation into the Effects of Sampling on the Loop Response and Phase Noise in Phase Locked Loops
 An Investigation into the Effects of Sampling on the Loop Response and Phase oise in Phase Locked Loops Peter Beeson LA Techniques, Unit 5 Chancerygate Business Centre, Surbiton, Surrey Abstract. The majority
Measuring Non-linear Amplifiers
 Measuring Non-linear Amplifiers Transceiver Components & Measuring Techniques MM3 Jan Hvolgaard Mikkelsen Radio Frequency Integrated Systems and Circuits Division Aalborg University 27 Agenda Non-linear
Pulsed VNA Measurements:
 Pulsed VNA Measurements: The Need to Null! January 21, 2004 presented by: Loren Betts Copyright 2004 Agilent Technologies, Inc. Agenda Pulsed RF Devices Pulsed Signal Domains VNA Spectral Nulling Measurement
Phase-Locked Loop Engineering Handbook for Integrated Circuits
 Phase-Locked Loop Engineering Handbook for Integrated Circuits Stanley Goldman ARTECH H O U S E BOSTON LONDON artechhouse.com Preface Acknowledgments xiii xxi CHAPTER 1 Cetting Started with PLLs 1 1.1
Single Conversion LF Upconverter Andy Talbot G4JNT Jan 2009
 Single Conversion LF Upconverter Andy Talbot G4JNT Jan 2009 Mark 2 Version Oct 2010, see Appendix, Page 8 This upconverter is designed to directly translate the output from a soundcard from a PC running
Receiver Architecture
 Receiver Architecture Receiver basics Channel selection why not at RF? BPF first or LNA first? Direct digitization of RF signal Receiver architectures Sub-sampling receiver noise problem Heterodyne receiver
Keysight Technologies
 Keysight Technologies Generating Signals Basic CW signal Block diagram Applications Analog Modulation Types of analog modulation Block diagram Applications Digital Modulation Overview of IQ modulation
AN X-BAND FREQUENCY AGILE SOURCE WITH EXTREMELY LOW PHASE NOISE FOR DOPPLER RADAR
 AN X-BAND FREQUENCY AGILE SOURCE WITH EXTREMELY LOW PHASE NOISE FOR DOPPLER RADAR H. McPherson Presented at IEE Conference Radar 92, Brighton, Spectral Line Systems Ltd England, UK., October 1992. Pages
Configuration of PNA-X, NVNA and X parameters
 Configuration of PNA-X, NVNA and X parameters VNA 1. S-Parameter Measurements 2. Harmonic Measurements NVNA 3. X-Parameter Measurements Introducing the PNA-X 50 GHz 43.5 GHz 26.5 GHz 13.5 GHz PNA-X Agilent
Fast and Accurate Simultaneous Characterization of Signal Generator Source Match and Absolute Power Using X-Parameters.
 Fast and Accurate Simultaneous Characterization of Signal Generator Source Match and Absolute Power Using X-Parameters. April 15, 2015 Istanbul, Turkey R&D Principal Engineer, Component Test Division Keysight
MITIGATING INTERFERENCE ON AN OUTDOOR RANGE
 MITIGATING INTERFERENCE ON AN OUTDOOR RANGE Roger Dygert MI Technologies Suwanee, GA 30024 rdygert@mi-technologies.com ABSTRACT Making measurements on an outdoor range can be challenging for many reasons,
of Switzerland Analog High-Speed Products
 of Switzerland Analog High-Speed Products ANAPICO PRODUCTS 2012/2013 www.anapico.com Anapico Inc. is a growing Swiss manufacturer of leading edge products for RF test & measurement. The product ranges
DCNTS Phase Noise Analyzer 2 MHz to 1.8 / 26 / 50 / 140 GHz
 DCNTS Phase Noise Analyzer 2 MHz to 1.8 / 26 / 50 / 140 GHz Datasheet The DCNTS is the highest performance Phase Noise Analyzer with unique flexible capabilities as summarized below: Phase Noise Amplitude
Timing Noise Measurement of High-Repetition-Rate Optical Pulses
 564 Timing Noise Measurement of High-Repetition-Rate Optical Pulses Hidemi Tsuchida National Institute of Advanced Industrial Science and Technology 1-1-1 Umezono, Tsukuba, 305-8568 JAPAN Tel: 81-29-861-5342;
Agilent AN 1275 Automatic Frequency Settling Time Measurement Speeds Time-to-Market for RF Designs
 Agilent AN 1275 Automatic Frequency Settling Time Measurement Speeds Time-to-Market for RF Designs Application Note Fast, accurate synthesizer switching and settling are key performance requirements in
Agilent 8360B/8360L Series Synthesized Swept Signal/CW Generators 10 MHz to 110 GHz
 Agilent 8360B/8360L Series Synthesized Swept Signal/CW Generators 10 MHz to 110 GHz ity. l i t a ers V. n isio c e r P. y t i l i ib Flex 2 Agilent 8360 Synthesized Swept Signal and CW Generator Family
Measurement Setup for Phase Noise Test at Frequencies above 50 GHz Application Note
 Measurement Setup for Phase Noise Test at Frequencies above 50 GHz Application Note Products: R&S FSWP With recent enhancements in semiconductor technology the microwave frequency range beyond 50 GHz becomes
ENGINEERING COMMITTEE Interface Practices Subcommittee AMERICAN NATIONAL STANDARD ANSI/SCTE Measurement Procedure for Noise Power Ratio
 ENGINEERING COMMITTEE Interface Practices Subcommittee AMERICAN NATIONAL STANDARD ANSI/SCTE 119 2006 Measurement Procedure for Noise Power Ratio NOTICE The Society of Cable Telecommunications Engineers
CMOS 120 GHz Phase-Locked Loops Based on Two Different VCO Topologies
 JOURNAL OF ELECTROMAGNETIC ENGINEERING AND SCIENCE, VOL. 17, NO. 2, 98~104, APR. 2017 http://dx.doi.org/10.5515/jkiees.2017.17.2.98 ISSN 2234-8395 (Online) ISSN 2234-8409 (Print) CMOS 120 GHz Phase-Locked
A Guide to Calibrating Your Spectrum Analyzer
 A Guide to Calibrating Your Application Note Introduction As a technician or engineer who works with electronics, you rely on your spectrum analyzer to verify that the devices you design, manufacture,
Vector Network Analyzer
 Vector Network Analyzer VNA Basics VNA Roadshow Budapest 17/05/2016 Content Why Users Need VNAs VNA Terminology System Architecture Key Components Basic Measurements Calibration Methods Accuracy and Uncertainty
PHOTONIC INTEGRATED CIRCUITS FOR PHASED-ARRAY BEAMFORMING
 PHOTONIC INTEGRATED CIRCUITS FOR PHASED-ARRAY BEAMFORMING F.E. VAN VLIET J. STULEMEIJER # K.W.BENOIST D.P.H. MAAT # M.K.SMIT # R. VAN DIJK * * TNO Physics and Electronics Laboratory P.O. Box 96864 2509
Abstract: Stringent system specifications impose tough performance requirements on the RF and microwave cables used in aerospace and defense
 1 Abstract: Stringent system specifications impose tough performance requirements on the RF and microwave cables used in aerospace and defense communication systems. With typical tools, it can be very
Understanding RF and Microwave Analysis Basics
 Understanding RF and Microwave Analysis Basics Kimberly Cassacia Product Line Brand Manager Keysight Technologies Agenda µw Analysis Basics Page 2 RF Signal Analyzer Overview & Basic Settings Overview
A new generation Cartesian loop transmitter for fl exible radio solutions
 Electronics Technical A new generation Cartesian loop transmitter for fl exible radio solutions by C.N. Wilson and J.M. Gibbins, Applied Technology, UK The concept software defined radio (SDR) is much
Microwave Fundamentals A Survey of Microwave Systems and Devices p. 3 The Relationship of Microwaves to Other Electronic Equipment p.
 Microwave Fundamentals A Survey of Microwave Systems and Devices p. 3 The Relationship of Microwaves to Other Electronic Equipment p. 3 Microwave Systems p. 5 The Microwave Spectrum p. 6 Why Microwave
Narrow Pulse Measurements on Vector Network Analyzers
 Narrow Pulse Measurements on Vector Network Analyzers Bert Schluper Nearfield Systems Inc. Torrance, CA, USA bschluper@nearfield.com Abstract - This paper investigates practical aspects of measuring antennas
Agilent Technologies PSA Series Spectrum Analyzers Test and Adjustment Software
 Test System Overview Agilent Technologies PSA Series Spectrum Analyzers Test and Adjustment Software Test System Overview The Agilent Technologies test system is designed to verify the performance of the
Spurious-Mode Suppression in Optoelectronic Oscillators
 Spurious-Mode Suppression in Optoelectronic Oscillators Olukayode Okusaga and Eric Adles and Weimin Zhou U.S. Army Research Laboratory Adelphi, Maryland 20783 1197 Email: olukayode.okusaga@us.army.mil
Digital Waveform with Jittered Edges. Reference edge. Figure 1. The purpose of this discussion is fourfold.
 Joe Adler, Vectron International Continuous advances in high-speed communication and measurement systems require higher levels of performance from system clocks and references. Performance acceptable in
SC5307A/SC5308A 100 khz to 6 GHz RF Downconverter. Datasheet SignalCore, Inc.
 SC5307A/SC5308A 100 khz to 6 GHz RF Downconverter Datasheet 2017 SignalCore, Inc. support@signalcore.com P RODUCT S PECIFICATIONS Definition of Terms The following terms are used throughout this datasheet
AMERICAN NATIONAL STANDARD
 Interface Practices Subcommittee AMERICAN NATIONAL STANDARD Measurement Procedure for Noise Power Ratio NOTICE The Society of Cable Telecommunications Engineers (SCTE) / International Society of Broadband
325 to 500 GHz Vector Network Analyzer System
 325 to 500 GHz Vector Network Analyzer System By Chuck Oleson, Tony Denning and Yuenie Lau OML, Inc. Abstract - This paper describes a novel and compact WR-02.2 millimeter wave frequency extension transmission/reflection
1 Introduction: frequency stability and accuracy
 Content 1 Introduction: frequency stability and accuracy... Measurement methods... 4 Beat Frequency method... 4 Advantages... 4 Restrictions... 4 Spectrum analyzer method... 5 Advantages... 5 Restrictions...
High Frequency VCO Design and Schematics
 High Frequency VCO Design and Schematics Iulian Rosu, YO3DAC / VA3IUL, http://www.qsl.net/va3iul/ This note will review the process by which VCO (Voltage Controlled Oscillator) designers choose their oscillator
LNS ultra low phase noise Synthesizer 8 MHz to 18 GHz
 LNS ultra low phase noise Synthesizer 8 MHz to 18 GHz Datasheet The LNS is an easy to use 18 GHz synthesizer that exhibits outstanding phase noise and jitter performance in a 3U rack mountable chassis.
Keysight Technologies Making Accurate Intermodulation Distortion Measurements with the PNA-X Network Analyzer, 10 MHz to 26.5 GHz
 Keysight Technologies Making Accurate Intermodulation Distortion Measurements with the PNA-X Network Analyzer, 10 MHz to 26.5 GHz Application Note Overview This application note describes accuracy considerations
Agilent E5505A Phase Noise Measurement System
 Agilent E5505A Phase Noise Measurement System Notice: This document contains references to Agilent. Please note that Agilent s Test and Measurement business has become Keysight Technologies. For more information,
Agilent PSA Series Spectrum Analyzers Self-Guided Demonstration for Phase Noise Measurements
 Agilent PSA Series Spectrum Analyzers Self-Guided Demonstration for Phase Noise Measurements Product Note This demonstration guide is a tool to help you gain familiarity with the basic functions and important
Experiment No. 3 Pre-Lab Phase Locked Loops and Frequency Modulation
 Experiment No. 3 Pre-Lab Phase Locked Loops and Frequency Modulation The Pre-Labs are informational and although they follow the procedures in the experiment, they are to be completed outside of the laboratory.
BluePhase 1000 PHASE NOISE TEST SYSTEM. Operations Manual
 BluePhase 1000 PHASE NOISE TEST SYSTEM Operations Manual WENZEL ASSOCIATES, INC. 2215 Kramer Lane Austin, TX 78758 USA 512-835-2038 fax 512-719-4086 http://www.wenzel.com e-mail: sales@wenzel.com Table
Clock Measurements Using the BI220 Time Interval Analyzer/Counter and Stable32
 Clock Measurements Using the BI220 Time Interval Analyzer/Counter and Stable32 W.J. Riley Hamilton Technical Services Beaufort SC 29907 USA Introduction This paper describes methods for making clock frequency
EVLA Memo 105. Phase coherence of the EVLA radio telescope
 EVLA Memo 105 Phase coherence of the EVLA radio telescope Steven Durand, James Jackson, and Keith Morris National Radio Astronomy Observatory, 1003 Lopezville Road, Socorro, NM, USA 87801 ABSTRACT The
Analysis of Phase Noise Profile of a 1.1 GHz Phase-locked Loop
 Analysis of Phase Noise Profile of a 1.1 GHz Phase-locked Loop J. Handique, Member, IAENG and T. Bezboruah, Member, IAENG 1 Abstract We analyzed the phase noise of a 1.1 GHz phaselocked loop system for
GET10B Radar Measurement Basics- Spectrum Analysis of Pulsed Signals. Copyright 2001 Agilent Technologies, Inc.
 GET10B Radar Measurement Basics- Spectrum Analysis of Pulsed Signals Copyright 2001 Agilent Technologies, Inc. Agenda: Power Measurements Module #1: Introduction Module #2: Power Measurements Module #3:
Agilent 86030A 50 GHz Lightwave Component Analyzer Product Overview
 Agilent 86030A 50 GHz Lightwave Component Analyzer Product Overview 2 Characterize 40 Gb/s optical components Modern lightwave transmission systems require accurate and repeatable characterization of their
A Prototype Wire Position Monitoring System
 LCLS-TN-05-27 A Prototype Wire Position Monitoring System Wei Wang and Zachary Wolf Metrology Department, SLAC 1. INTRODUCTION ¹ The Wire Position Monitoring System (WPM) will track changes in the transverse
General configuration
 Transmitter General configuration In some cases the modulator operates directly at the transmission frequency (no up conversion required) In digital transmitters, the information is represented by the
LOW POWER GLOBAL NAVIGATION SATELLITE SYSTEM (GNSS) SIGNAL DETECTION AND PROCESSING
 SIGNAL DETECTION AND PROCESSING") LOW POWER GLOBAL NAVIGATION SATELLITE SYSTEM (GNSS) SIGNAL DETECTION AND PROCESSING Dennis M. Akos, Per-Ludvig Normark, Jeong-Taek Lee, Konstantin G. Gromov Stanford University James B. Y. Tsui, John Schamus
LOW POWER GLOBAL NAVIGATION SATELLITE SYSTEM (GNSS) SIGNAL DETECTION AND PROCESSING Dennis M. Akos, Per-Ludvig Normark, Jeong-Taek Lee, Konstantin G. Gromov Stanford University James B. Y. Tsui, John Schamus
Jitter Measurements using Phase Noise Techniques
 Jitter Measurements using Phase Noise Techniques Agenda Jitter Review Time-Domain and Frequency-Domain Jitter Measurements Phase Noise Concept and Measurement Techniques Deriving Random and Deterministic
SC5407A/SC5408A 100 khz to 6 GHz RF Upconverter. Datasheet. Rev SignalCore, Inc.
 SC5407A/SC5408A 100 khz to 6 GHz RF Upconverter Datasheet Rev 1.2 2017 SignalCore, Inc. support@signalcore.com P R O D U C T S P E C I F I C A T I O N S Definition of Terms The following terms are used
DC/DC Converter Stability Measurement
 Strongly supported by By Stephan Synkule, Lukas Heinzle & Florian Hämmerle 2018 by OMICRON Lab V3.3 Visit www.omicron-lab.com for more information. Contact support@omicron-lab.com for technical support.
FREQUENCY AGILE FM MODULATOR INSTRUCTION BOOK IB
 FMT615C FREQUENCY AGILE FM MODULATOR INSTRUCTION BOOK IB1215-02 TABLE OF CONTENTS SECTION SUBJECT 1.0 Introduction 2.0 Installation & Operating Instructions 3.0 Specification 4.0 Functional Description
HP Archive. This vintage Hewlett Packard document was preserved and distributed by www. hparchive.com Please visit us on the web!
 HP Archive This vintage Hewlett Packard document was preserved and distributed by www. hparchive.com Please visit us on the web! On-line curator: Glenn Robb This document is for FREE distribution only!
CH85CH2202-0/85/ $1.00
 SYNCHRONIZATION AND TRACKING WITH SYNCHRONOUS OSCILLATORS Vasil Uzunoglu and Marvin H. White Fairchild Industries Germantown, Maryland Lehigh University Bethlehem, Pennsylvania ABSTRACT A Synchronous Oscillator
MEASURING HUM MODULATION USING MATRIX MODEL HD-500 HUM DEMODULATOR
 MEASURING HUM MODULATION USING MATRIX MODEL HD-500 HUM DEMODULATOR The SCTE defines hum modulation as, The amplitude distortion of a signal caused by the modulation of the signal by components of the power
Development of high cost performance signal analyzer MS2830A -044/045
 Development of high cost performance signal analyzer MS2830A -044/045 Yuji Kishi, Shuichi Matsuda, Koichiro Tomisaki, Kozo Yokoyama, Yoshiaki Yasuda, Tsukasa Yasui, Kota Kuramitsu [Summary] We have developed
Understanding Mixers Terms Defined, and Measuring Performance
 Understanding Mixers Terms Defined, and Measuring Performance Mixer Terms Defined Statistical Processing Applied to Mixers Today's stringent demands for precise electronic systems place a heavy burden
From the Computing and Multimedia Division of Integrated Device Technology, Inc.
 IDT CLOCK BUFFERS OFFER ULTRA LOW ADDITIVE PHASE JITTER From the Computing and Multimedia Division of Integrated Device Technology, Inc. Overview High performance clock buffers are widely used in digital
Termination Insensitive Mixers By Howard Hausman President/CEO, MITEQ, Inc. 100 Davids Drive Hauppauge, NY
 Termination Insensitive Mixers By Howard Hausman President/CEO, MITEQ, Inc. 100 Davids Drive Hauppauge, NY 11788 hhausman@miteq.com Abstract Microwave mixers are non-linear devices that are used to translate
A Method for Gain over Temperature Measurements Using Two Hot Noise Sources
 A Method for Gain over Temperature Measurements Using Two Hot Noise Sources Vince Rodriguez and Charles Osborne MI Technologies: Suwanee, 30024 GA, USA vrodriguez@mitechnologies.com Abstract P Gain over
PXIe Contents. Required Software CALIBRATION PROCEDURE
 CALIBRATION PROCEDURE PXIe-5160 This document contains the verification and adjustment procedures for the PXIe-5160. Refer to ni.com/calibration for more information about calibration solutions. Contents
Contents. CALIBRATION PROCEDURE NI PXIe GHz and 14 GHz RF Vector Signal Analyzer
 CALIBRATION PROCEDURE NI PXIe-5665 3.6 GHz and 14 GHz RF Vector Signal Analyzer This document contains the verification procedures for the National Instruments PXIe-5665 (NI 5665) RF vector signal analyzer
CUSTOM INTEGRATED ASSEMBLIES
 17 CUSTOM INTEGRATED ASSEMBLIES CUSTOM INTEGRATED ASSEMBLIES Cougar offers full first-level integration capabilities, providing not just performance components but also full subsystem solutions to help
CHAPTER. delta-sigma modulators 1.0
 CHAPTER 1 CHAPTER Conventional delta-sigma modulators 1.0 This Chapter presents the traditional first- and second-order DSM. The main sources for non-ideal operation are described together with some commonly
Enhancement of VCO linearity and phase noise by implementing frequency locked loop
 Enhancement of VCO linearity and phase noise by implementing frequency locked loop Abstract This paper investigates the on-chip implementation of a frequency locked loop (FLL) over a VCO that decreases
Your Network. Optimized.
 Over 20 years of research both at the National Institute of Standards and Technology (NIST) and in private industry have been dedicated to the research and development of Symmetricom s phase noise and
Keysight Technologies Optimizing RF and Microwave Spectrum Analyzer Dynamic Range. Application Note
 Keysight Technologies Optimizing RF and Microwave Spectrum Analyzer Dynamic Range Application Note 02 Keysight Optimizing RF and Microwave Spectrum Analyzer Dynamic Range Application Note 1. Introduction
Essential Capabilities of EMI Receivers. Application Note
 Essential Capabilities of EMI Receivers Application Note Contents Introduction... 3 CISPR 16-1-1 Compliance... 3 MIL-STD-461 Compliance... 4 Important features not required by CISPR 16-1-1 or MIL-STD-461...