Ph 77 ADVANCED PHYSICS LABORATORY ATOMICANDOPTICALPHYSICS
|
|
|
- Edward Todd
- 6 years ago
- Views:
Transcription
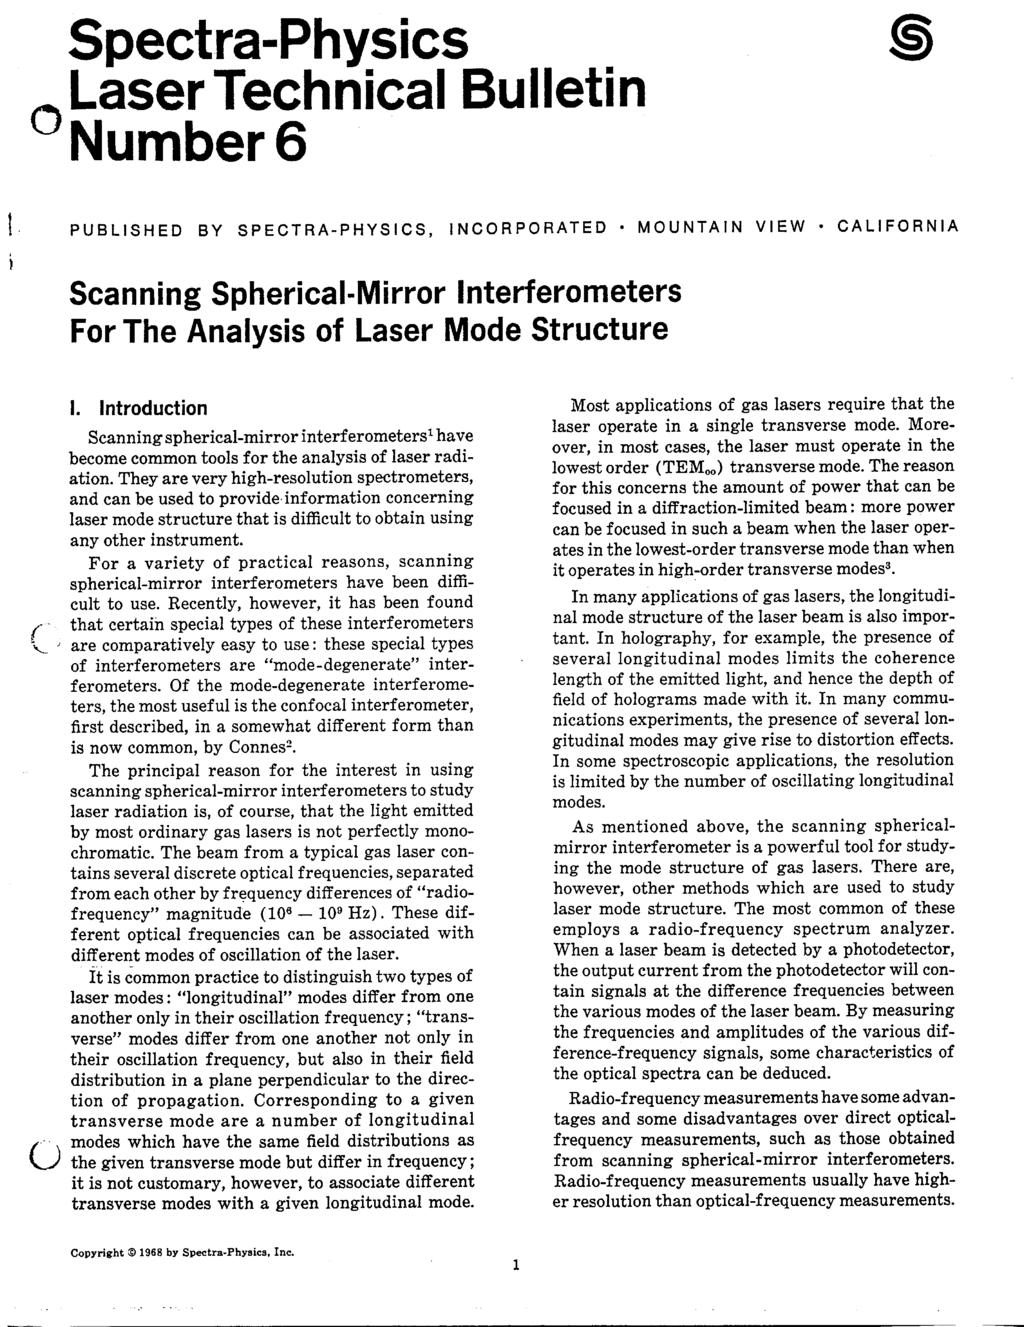
1 Ph 77 ADVANCED PHYSICS LABORATORY ATOMICANDOPTICALPHYSICS Expt. 71 Fabry-Perot Cavities and FM Spectroscopy I. BACKGROUND Fabry-Perot cavities (also called Fabry-Perot etalons) are ubiquitous elements in optical physics, and they are used for such applications as sensitive wavelength discriminators, as stable frequency references, and for building up large field intensities with low input powers. Also, lasers are all made from optical cavities. For our diode lasers, the cavity is made from a semiconductor material a few millimeters in length, and the light propagates inside the semiconductor. Cavities are often made from two curved mirrors as shown in Figure 1. In this lab you will investigate some cavity properties, and you will see how a cavity can be used as an optical spectrum analyzer to measure the spectral content of a laser. In this capacity, you will use the cavity to observe radio-frequency (RF) sidebands on the laser output. A basic Fabry-Perot cavity consists of two reflectors separated by a fixed distance L, as is shown in Figure 1; curved reflectors are typically used because such a configuration can trap light in a stable mode. (Two flat mirrors can also make a cavity of sorts, but it is not stable; the light walks off perpendicular to the cavity axis.) An excellent detailed discussion of the properties of Fabry-Perot cavities is given by Yariv (1991), and you may want to look through Chapter 4ofthistexttobetterunderstandthedetailsof cavity physics. Another useful, although somewhat dated, reference is attached as an appendix at the end of this hand-out. Much of the physics of optical cavities can be understood by considering the flat-mirror case, which reduces the problem to 1D. Physically, this case can be realized if the flat mirrors have effectively infinite extent and the input light can be approximated by a perfect plane wave. For two identical mirrors, each with reflectivity R and transmission T (R + T =1), the amplitude of the transmitted and reflected electric field amplitudes (which you will calculate as a prelab problem) are given by E t = Te iδ 1 Re 2iδ E i E r = (1 ei2δ ) R 1 Re i2δ E i where E i is the amplitude of the incident light and δ =2πL/λ is the phase shift of the light after propagating through the cavity (we assume the index of refraction is unity inside the cavity). The transmitted light intensity is then 2 I = E t I 0 E i = Te iδ 2 1 Re 2iδ The cavity transmission peaks when e 2iδ =1, or equivalently at frequencies ν m = mc/2l, wherem is an integer, c is the speed of light. At these frequencies the cavity length is an integer number of half- Page 1
2 Figure 1. The basic Fabry-Perot cavity. The curved surfaces of the mirrors are coated for high reflectivity, while the flat surfaces are anti-reflection coated and have negligible reflectivity. The curved lines inside the cavity represent the shape of the resonance optical mode. wavelengths of light. Note that the peak transmission is I/I 0 =1, regardless of R. The separation between adjacent peaks, called the free-spectral range, is given by ν FSR = ν m+1 ν m = c 2L. If the mirror reflectivity is high (for our cavity mirrors it is approximately 99.5 percent) then the transmission peaks will be narrow compared with ν FSR.Thefull-width-at-half-maximum, ν fwhm,(i. e. the separation between two frequencies where the transmission is half the peak value) is written as ν fwhm = ν FSR /F, where F is called the cavity finesse. If T 1 the finesse can be shown from the above to be approximately F π R 1 R π T The results so far describe an ideal cavity, in which there is no absorption or other loss of light inside the cavity. The peak transmission of such an ideal Fabry-Perot cavity is unity, as can be seen above. Introducing small losses in the cavity leads to the expression Tαe iδ E t = 1 Rα 2 e 2iδ E i where α is a loss parameter (the fractional intensity loss from a single pass through the cavity is equal to ε =1 α 2 ). This gives a peak cavity transmission I peak I 0 T 2 (1 ε) (T + ε) 2 T 2 (T + ε) 2 Page 2
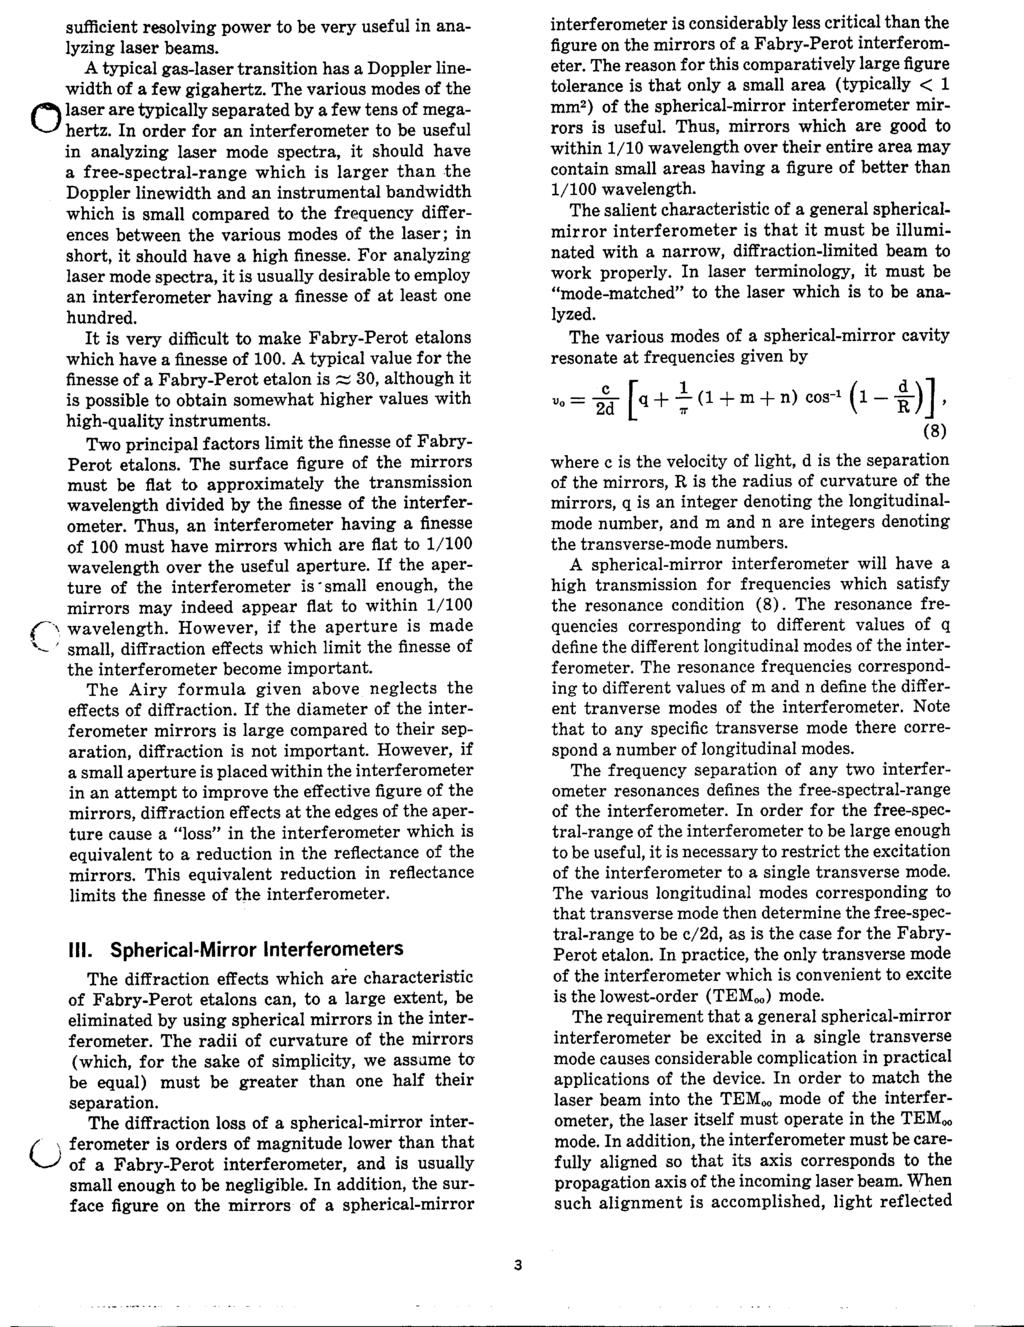
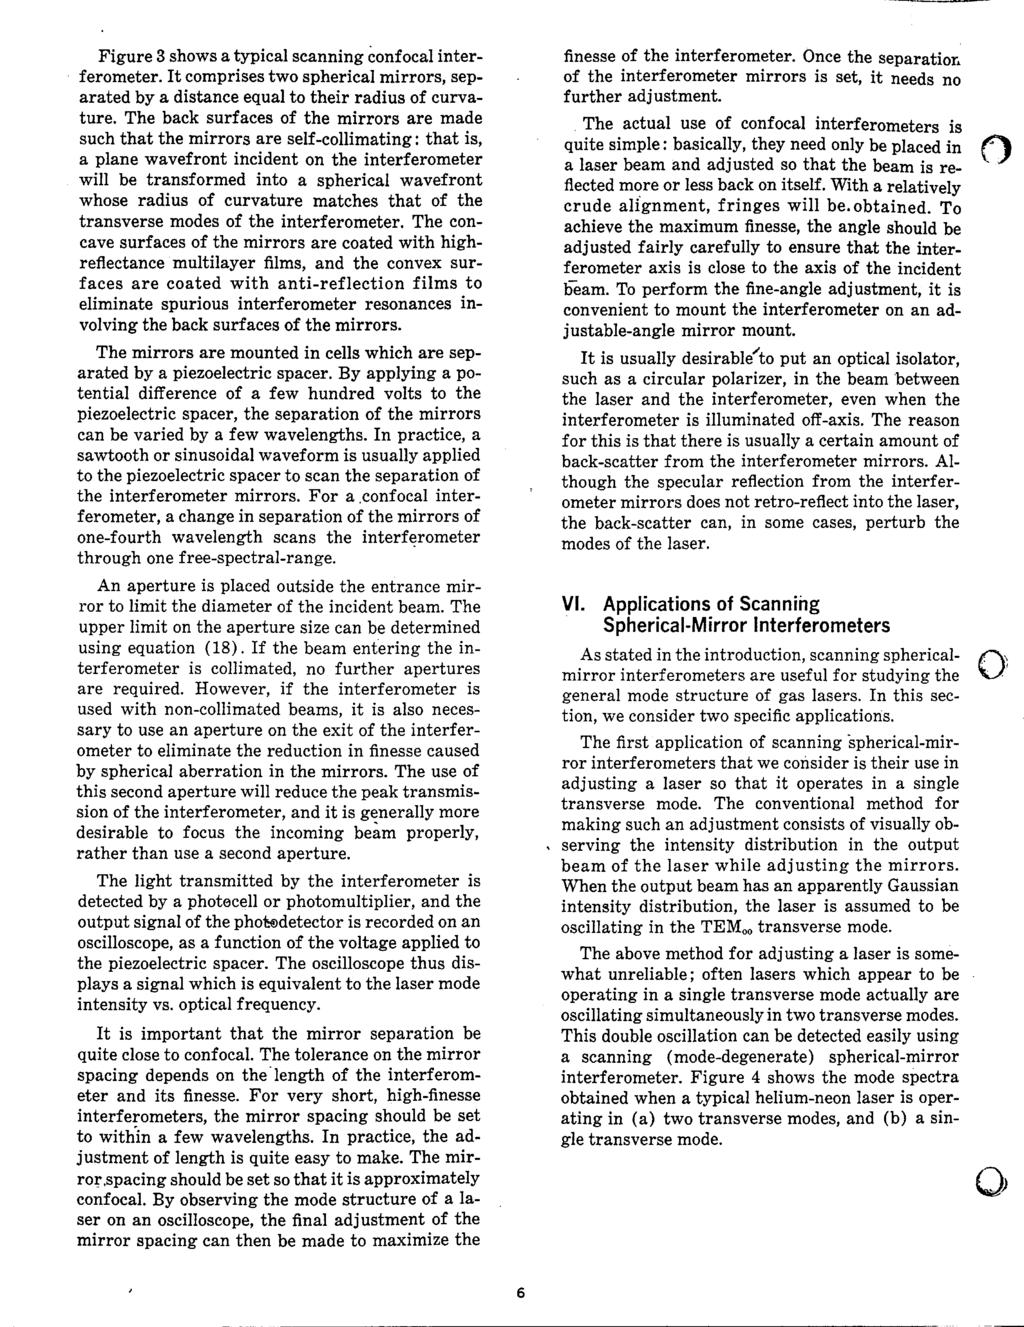
3 and a finesse F πα R 1 α 2 R π T + ε It is sometimes useful to think of the Fabry-Perot cavity as an interferometer, and it is also useful to think of it as an optical resonator. If the input laser frequency is not near ν m,thebeameffectively just reflects off the first mirror surface (which after all does have a high reflectivity). If the input is equal to ν m,however,thenlightleakingoutfrominsidethecavitydestructivelyinterfereswiththereflected beam. Right after turning on the input beam, the power inside the cavity builds up until the light leaking out in the backward direction exactly cancels the reflected input beam, and the beam leaking out in the forward direction just equals the input beam (neglecting cavity losses). Thus at ν m the total cavity transmission is unity, and the light bouncing back and forth in the cavity is 1/T times as intense as the input beam. Problem 1. Derive the above expressions for E r and E t as a function of δ when ε =0. [Hint: write down a series expression that describes the sums of all the transmitted and reflected beams. Use reflected and transmitted amplitudes r and t, where r 2 = R and t 2 = T. Then sum the series. Use the fact that if the reflected amplitude is r for light entering the cavity, then it is r 0 = r for light reflecting from inside the cavity (why? in one case, light is going from in air into glass; in the other case, light is going from glass into air).] Also derive the peak cavity transmission I peak /I 0, and finesse F, in the limit T,ε R. Plot the transmitted and reflected intensities, I tran /I 0 and I reflect /I 0, of a cavity as a function of δ for R = 0.9, 0.95, 0.99 and ε =0. The Optical Spectrum Analyzer. If we can scan the cavity length, for example by attaching one mirror to a piezo-electric transducer (PZT) tube, as shown in Figure 2, then we can make an interesting gadget called an optical spectrum analyzer. Scanning the spacing L (which equivalently scans the phase δ you used in your calculations) then scans the cavity resonant frequencies ν m. If the laser beam contains frequencies in a range around some ν 0,thenbyscanningthePZTonecanrecordthelaserspectrum,as is shown in Figure 2. Note that there is some ambiguity in the spectrum; a single laser frequency ν 0 produces peaks in the spectrum analyzer output at ν 0 + j ν FSR,wherej is any integer. If a laser contains two closely spaced modes, as in the example shown in Figure 2, then the output signal is obvious. But if the laser modes are separated by more than ν FSR, then the output may be difficult to interpret. In the lab, you will scan the laser frequency while keeping the cavity length fixed, but the resulting measurements are basically the same as if you scanned the cavity length. Laguerre-Gaussian Modes. The above analysis strictly holds only for the 1D plane-wave case, and real cavities must have mirrors of finite extent. In this case, it s best to thing of Fabry-Perot cavities as full 3D optical resonators, rather than simply a set of two mirrors. By curving the mirrors, the cavity supports asetoftrappednormalmodesoftheelectromagneticfield, known as Laguerre-Gaussian modes. Aslong as the cavity has cylindrical symmetry, the transverse mode patterns are described by a combination of a Page 3
4 Figure 2. Using a Fabry-Perot cavity as an optical spectrum analyzer. Here the input laser power as a function of frequency P (f) is shown with a multi-mode structure. By scanning the cavity length with a piezoelectric (PZT) tube, the laser s mode structure can be seen in the photodiode output as a function of PZT voltage I(V ). Notethesignalrepeatswiththeperiodofthecavityfree-spectralrange. Gaussian beam profile with a Laguerre polynomial. The modes are labeled by TEM p,wherep and are integers labeling the radial and angular mode orders. The intensity at a point r, φ (in polar coordinates) is given by I p (r, φ) =I 0 ρ L p(ρ) 2 cos 2 ( φ)e ρ where ρ =2r 2 /w 2 and L p is the associate Laguerre polynomial of order p and index. The radial scale of the mode is given by w, andmodespreservetheirgeneralshape during propagation. A sample of some Laguerre-Gaussian modes is shown in Figure 3. This figure displays the transverse mode profiles; the longitudinal profile of the mode is that of a standing wave inside the cavity, which has some number n of nodes. The various modes with different n, p, and in general all have different resonant frequencies. The TEM 00 mode has a simple Gaussian beam profile, and this is the mode one usually wants to excite inside the cavity. Lasers typically use this mode, and thus generate Gaussian output beams. As you will see in the lab, however, it is not always trivial to excite just the TEM 00 mode inside a cavity. Note that the mode shape shown in Figure 1 essentially shows w for a TEM 00 mode as a function of position inside the cavity. The mode has a narrow waist at the center of the cavity, and diffraction causes the beam to expand away from the center. At the waist, the wavefronts of the electric field (or equivalently the nodes of the standing wave) are flat and perpendicular to the cavity axis. At the mirrors, the wavefronts are curved and coincide with the mirror surfaces, so the wave reflects back upon itself. Page 4
 TEM 01 modes rotated 90 with respect to one another. Confocal Resonators.")
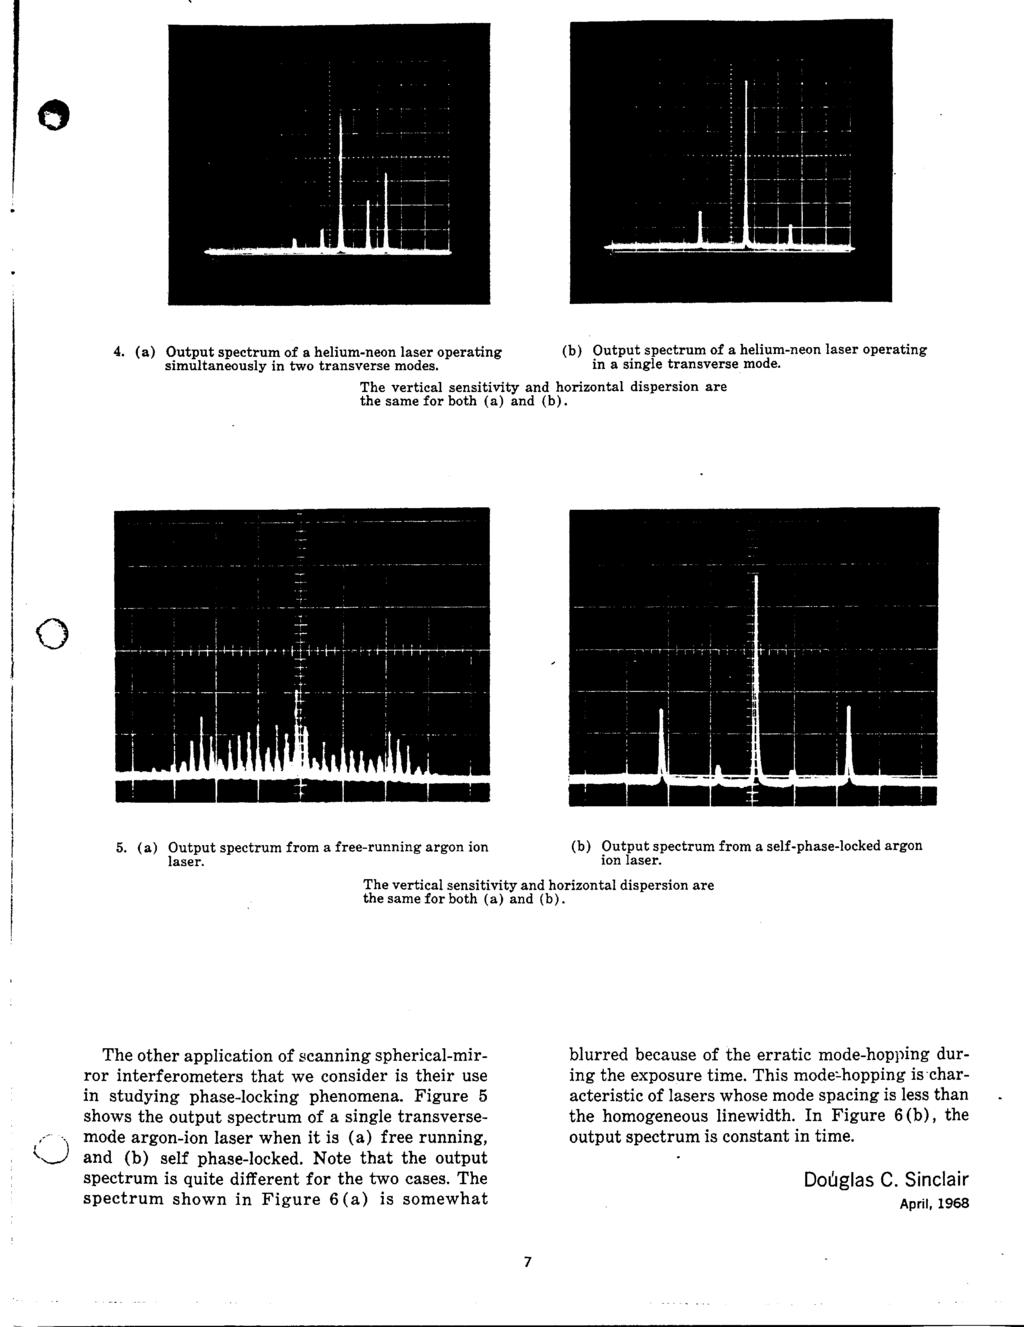
5 Figure 3. Several Laguerre-Gaussian modes, which are the electromagnetic normal modes inside a Fabry-Perot cavity. The TEM 01 mode, called a doughnut mode, is a superposition of two (degenerate) TEM 01 modes rotated 90 with respect to one another. Confocal Resonators. An interesting (and useful) degeneracy occurs if we choose the cavity length to be equal to the radius of curvature of the Fabry-Perot mirrors, L = R mirror. In this case, the mode frequencies of the various transverse modes all become degenerate with a separation of c/4l = ν FSR /2 (see Yariv, Section 4.6, for a derivation of this). For this special case, called a confocal cavity, the spectrum will look just like that shown in Figure 2, except the mode spacing will be ν confocal = c/4l. Thewidth of the transmission peaks ν fwhm stays roughly the same in principle, but in practice ν fwhm depends on how well the cavity is aligned, and how precisely we have L = R mirror. Another nice feature of the confocal cavity is that the cavity transmission is insensitive to laser alignment. Figure 4 shows that each resonant mode in the confocal cavity can be thought of as a bow-tie mode, which traverses the cavity twice before retracing its path hence ν confocal = c/4l. This is a crude picture, but it can be helpful in understanding the confocal cavity. It shows you in a rough way how the output spectrum might be insensitive to alignment, since the bow-tie modes are excited no matter where the beam enters the cavity. You will work with a confocal and non-confocal cavity in the lab, and hopefully this will all make good sense once you see it all in action. FM Spectroscopy. In the radio-frequency domain, there exists a substantial technology built up around amplitude-modulation and frequency-modulation of an electromagnetic carrier wave(which gives us,for example, AM and FM radio broadcasting). If one boosts the typical carrier wave frequency from 100 MHz Page 5
6 Figure 4. Ray paths for a confocal Fabry-Perot cavity (the off-axis scale is exaggerated). (FM radio) to 500 THz (optical), the same ideas apply to AM and FM modulation of lasers. The resulting optical technology has many applications, the most dominant one being fiber-optic communications. Modulating the injection current to the diode laser is a very simple way to modulate the laser output, both in frequency and amplitude. (Using non-linear crystal modulators is another way to modulate a laser beam.) The basic idea is that one drives the laser with an injection current which consists of a large DC part and a small high-frequency AC part on top. The AC part produces both AM and FM modulation of the laser, but we will ignore the smaller AM part for now. For pure frequency modulation, we can write the electric field of the laser beam at some fixed location as: E(t) = E 0 exp( iω 0 t iφ(t)) where φ(t) is the modulated phase of the laser output. We always assume that φ(t) is slowly varying compared to the unmodulated phase change ω 0 t,sinceω 0 is at optical frequencies, and our modulation will be at radio frequencies. If we re putting in a single sinusoidal phase modulation we have φ(t) =β sin(ωt) where Ω is the modulation frequency, and β, calledthemodulationindex,givesthepeakphaseexcursion induced by the modulation. If we note that the instantaneous optical frequency is given by the instantaneous rate-of-change of the total phase, we have ω instant = ω 0 + dφ/dt = ω 0 + βω cos(ωt) = ω 0 + ω cos(ωt) where ω is the maximum frequency excursion. Note that β = ω/ω is the dimensionless ratio of the maximum frequency excursion to frequency modulation rate. It is useful to expand the above expression for the electric field into a carrier wave and a series of Page 6
7 sidebands E(t) = E 0 exp[ iω 0 t iβ sin(ωt)] = E n= X 0 n= J n (β)exp[ i(ω 0 + nω)t] ) = E n= X 0 (J 0 (β)exp( iω 0 t)+ J n (β)[exp[ i(ω 0 + nω)t]+( 1) n exp[ i(ω 0 nω)t]] n=1 This transformation shows that our original optical sine-wave has now developed a comb-like structure in frequency space. The J 0 term at the original frequency ω 0 is the optical carrier frequency (in analogy with radio terminology), while the other terms at frequencies ω 0 ± nω form sidebands around the carrier. The sideband amplitudes are given by J n (β), whichrapidlybecomessmallforn>β.notethatthetotal power in the beam is given by Ē Ē = E 2 0 " J 2 0 (β)+2 n= X n=1 J n (β) 2 # = E 2 0 which is independent of β, as it must be for pure frequency modulation. Often one wishes to add two small sidebands around the carrier, for which one wants β<<1, and the sideband power is then given by J 1 (β) 2 β 2 /4. Evaluatingtheabovesum,andconvolvingwithaLorentzianlaser+cavityspectrum gives an output power n= X I(ω) =J0 2 (β)l(ω; ω 0 )+ J n (β) 2 [L(ω; ω 0 + nω)+l(ω; ω 0 nω)] n=1 where L(ω; ω 0 ) is a normalized Lorentzian function centered at ω 0. Problem 2. Evaluate and plot the above optical spectrum, as you might expect to see it using your Fabry-Perot optical spectrum analyzer (remember that a photodiode measures optical power, notelectric field amplitude). Plot versus frequency ν = ω/2π, whichiswhatafrequencymeterreads. Assumea Lorentzian laser+cavity linewidth of ν =10MHz. Plot three curve with: 1) Ω/2π =120MHz, β =0.5; 2) Ω/2π =30MHz, β =1.5; and3)ω/2π =1MHz, β =20.Noteforthelastplotyouwillhavetoevaluate the sum up to fairly high n, atleastton>β. For β À 1, notethatthespectrumlooksmuchlike what you would expect for slowly scanning the laser frequency from ω 0 βω to ω 0 + βω. II. LABORATORY EXERCISES. Your first task in this lab is to look at the light transmitted through a simple cavity using the set-up shown in Figure 5. Use the ramp generator in the laser controller to scan the laser frequency (ask your TA how), and monitor the photodiode output on the oscilloscope. In order to get any light through the cavity, you need to align the incoming laser beam so that: 1) the beam hits the center of the first mirror, and 2) the beam is pointed down the cavity axis. The mirrors M1 and M2 provide the necessary adjustments to align the incident beam, and note that the different degrees of freedom are nicely decoupled M1 mostly changes the laser position at the cavity, and M2 mostly changes the angle of the entering beam. Page 7
8 Figure 5. Optics set-up to view the light transmitted through the short cavity. First adjust M1 so the beam is centered on the cavity, and then adjust M2 so the backreflected beam coincides with the incident beam. Use a white card with a hole in it to see the position of the backreflected beam. Iterate as necessary. When this looks good, place a white card behind the cavity to view the transmitted beam. It will be faint, but you should be able to see a pair of bright spots, or perhaps a bright ring, on the card. To bring the transmitted beam to a single spot, you will probably need to walk the input beam, which is a way to systematically sample the 4-dimensional alignment space defined by the four adjustments of M1 and M2. Your TA can show you how. Once you have the transmitted beam down to a single, sharp spot, place the photodiode to intercept the beam, and place the TV camera to view the shape of the beam. With the sweep on, you should see a forest of peaks on thetransmittedsignal. Eachpeakcorrespondsto asinglecavitymodeyouareexcitingwiththelaser. EachTEM np mode has a slightly different frequency, so each gives a separate peak. In addition, the spectrum repeats with a period of ν FSR. If you tweak the alignment of the incoming beam slightly, you will see the peaks all change height. This is because you excite different modes with different alignments. With the sweep off, youcanexaminetheshapesofthedifferent modes using the TV camera. Move the piezo DC offset adjust to select different modes. Compare with Figure 3 above. Print out an oscilloscope trace showing a typical scan, and tape it into your notebook. Page 8
9 Figure 6. The cavity transmission with fairly good mode matching. Note the dominant TEM 00 modes separated by ν FSR. The peaks heights are very sensitive to alignment and even to vibration. Mode Matching. Now you should try to excite just the TEM 00 mode of the cavity, which means you have to mode match the incoming beam to the cavity mode. If you think about the mode inside the cavity (see Figure 1), you can see that the beams leaking out of the cavity diverge in both directions. You can see this if you use a white card with a hole in it placed far from the cavity. The reflected beam from the cavity will make a large spot on the card, much larger than the incoming beam. Thus the input beam is not well matched to the cavity modes. To match the TEM 00 mode, the incoming beam should be converging. You can achieve this by placing a500mmfocallengthlensabout11inchesinfrontofthecavity. Beforealigningthecavity,notethatthe size of the reflected beam is now about equal to the incoming laser size, so the mode match is better than before. Align the cavity with the lens in place and view the transmitted signal. You should see fewer large modes. Turn the sweep down to identify the different modes on the TV. Find the TEM 00 mode, and tweak the mirror alignment to maximize this mode while minimizing the others. With some effort, you can produce a transmitted signal that looks something like that shown in Figure 6, with dominant TEM 00 peaks separated by ν FSR.Youcannotdomuchbetterthanthis,evenintheory,fortworeasons:1)the mode-matching lens is actually not quite right to match to the cavity, so you are bound to excite some other modes; and 2) the incoming laser beam is itself not a perfect TEM 00 mode (expand the beam with a lens and you can see that it doesn t have a perfect Gaussian shape), which means it contains other modes Page 9
10 at some level. Print out a trace showing your best TEM 00 modes. The Confocal Cavity. The next task is to set up the confocal Fabry-Perot cavity as shown in Figure 7 and to look at some of its properties. Unlike the previous cavity, the confocal cavity is insensitive to the precise alignment and mode matching of the input beam, because the different transverse modes are degenerate in frequency (see the discussion in Section I above). Nevertheless, you still have to align things reasonably well, using the same procedures described above. Observe the Mode Structure of the Cavity. Align the input beam and adjust the cavity length until the transmitted signal shows a series of sharp peaks (much different than with the non-confocal cavity!). Tweak the cavity length so the peaks are narrow and symmetrical, which should maximize the transmitted peak intensity. Once that looks good, change the cavity length by a large amount (say 10 turns of the mounting tube) and observed the transmitted spectrum. As the cavity length is changed away from the confocal length, the transverse modes are no longer degenerate. At first, you see the peaks broaden and become asymmetrical. Then, as you change the length more, you can see individual mode peaks show up. Change the input beam alignment to see the different modes change in amplitude. Print out a few spectra with different cavity lengths. Measure the Transmitted and Reflected Intensities. Adjust the cavity length to its confocal value, and align the input beam to maximize the height of the transmitted peaks. Tweak the length and alignment with some care to produce sharp, symmetrical peaks with the highest possible amplitude. When that looks good, insert a "pick-off" mirrorsomewhereinthebeamandsendittothesecondphotodiode. Usethemir- ror to maximize the photodiode signal on the oscilloscope (so the beam is centered on the photodetector), and measure the output voltage (and note the photodiode gain). It works well to use the measure feature on the oscilloscope to measure the average output voltage. With care, you could convert this voltage to milliwatts of laser power, but you will be taking power ratios, so you don t need this conversion. Without changing the cavity alignment, set up the second lens and photodiode as shown in Figure 7. Again make sure the beam is centered on the photodetector and measure the output signal. The value should be about 25% of what you measured previously (because the beam intensity was diminished twice by the 50:50 beamsplitter). If you don t get within a few percent of that value, something is wrong (probably the alignment). Next send the first photodiode signal directly into the oscilloscope along with the second. Note that the dips in reflected light correspond to the peaks in transmitted light, as you would expect. Measure the peak widths and make sure they are greater than 20 μsec, so that the photodiode is fast enough to record the full peak. If not, use a slower scan. Measure the height of the transmitted peaks and compare with the input beam intensity, to produce a peak transmitted fraction. Keepinmindthe photodiode gains, which may be different, and how many times the various beams went through the beamsplitter. You should be able to produce a transmitted fractionbetween5%and10%.ifyourmeasurement is above 10%, you probably made an error somewhere (or your cavity alignment is amazingly good). If Page 10
11 Figure 7. Optics set-up for the confocal cavity. your measurement gives you something below 5%, again check for simple errors. If that s not it, tweak the cavity length and alignment until the peak transmitted fraction is above 5%. When everything looks good, print out the spectrum showing sharp peaks. Measure the Cavity Finesse. Capture a single sweep on the oscilloscope and use the built-in cursors to measure the effective finesse of the cavity. Measure the spacing between the peaks (the free spectral range) and then change the time-base on the scope and measure the full-width at half-maximum of the peaks. The effective finesse is then F = ν FSR / ν FWHM. You should get F>100 or even F>200 if the cavity is well aligned. Why is the transmitted peak intensity only 5%, when in principle it could be 100%? Part of the reason is losses inside the cavity, as described in the discussion in Section I, but that s only a small part. Calculate about how great the losses would have to be to produce a 5% transmitted intensity, assuming a mirror transmission of 1%. The actual mirror losses are probably less than 0.1% per bounce (unless the mirrors are very dirty, which they shouldn t be). The main reason for the low transmitted intensity is that the mode degeneracy is not perfect. If you change the cavity length or input beam alignment only slightly, you can see the peak height drop quickly. Since the input beam is not mode-matched to the cavity, the transmitted intensity of any given mode is fairly low. And if the modes are not perfectly degenerate, they don t overlap well, resulting in a low peak intensity. With a non-confocal cavity and a well mode-matched beam, it is possible to achieve a peak transmitted intensity close to 100%. However, for simply looking at the frequency structure of a laser (i.e., with an optical spectrum analyzer), the confocal cavity is quite convenient to use, even with its lower transmitted intensity. Page 11
12 FM Spectroscopy. Next you should observe the FM spectra you calculated in the prelab exercises, using the confocal Fabry-Perot cavity as an optical spectrum analyzer. With the transmitted signal showing nice sharp peaks, reduce the sweep to zoom in on a single peak. Then take the RF function generator, turn it on, and feed it into the RF Input BNC of the diode laser. (NOTE: Do not disconnect the cable from its connection at the laser. The laser is sensitive to static discharge, which can easily burn out the diode. Also turn the RF generator on first, andthenfeedtheoutputintothelaser. Thishelpsavoidvoltagespikes that may occur when you turn the generator on.) As you vary the oscillator frequency Ω/2π and the amplitude (which changes ω and thus β), you should observe the range of behavior you calculated. Record several traces that correspond as closely as you can achieve to your three calculated plots. You should get pretty good agreement (if not, check with the TA). One significant difference between calculated and measured spectra is that the measured spectra may be asymmetric. This is due to residual amplitude modulation of the laser, which we did not include in our pure FM calculation. Measure the Free-Spectral Range. Finally, put two high-frequency sidebands on your laser, print out aspectrum,andusetheknownsidebandfrequencytomeasurethefree-spectral-rangeofthefabry-perot cavity. Compare with what you expect for a cavity length of 20 cm (equal to the radius of curvature of the mirrors). III. REFERENCES Yariv, A. 1991, Optical Electronics, SaundersCollegePublishing,4thed. Page 12
13
14
15
16
17
18
19
20
OPTI 511L Fall (Part 1 of 2)
") Prof. R.J. Jones OPTI 511L Fall 2016 (Part 1 of 2) Optical Sciences Experiment 1: The HeNe Laser, Gaussian beams, and optical cavities (3 weeks total) In these experiments we explore the characteristics
Prof. R.J. Jones OPTI 511L Fall 2016 (Part 1 of 2) Optical Sciences Experiment 1: The HeNe Laser, Gaussian beams, and optical cavities (3 weeks total) In these experiments we explore the characteristics
R. J. Jones Optical Sciences OPTI 511L Fall 2017
 R. J. Jones Optical Sciences OPTI 511L Fall 2017 Semiconductor Lasers (2 weeks) Semiconductor (diode) lasers are by far the most widely used lasers today. Their small size and properties of the light output
Ph 77 ADVANCED PHYSICS LABORATORY ATOMICANDOPTICALPHYSICS
 Ph 77 ADVANCED PHYSICS LABORATORY ATOMICANDOPTICALPHYSICS Expt. 72 Laser Frequency Stabilization I. BACKGROUND In many precision optical measurements, it is desirable to have a laser with a well-defined
SA210-Series Scanning Fabry Perot Interferometer
 435 Route 206 P.O. Box 366 PH. 973-579-7227 Newton, NJ 07860-0366 FAX 973-300-3600 www.thorlabs.com technicalsupport@thorlabs.com SA210-Series Scanning Fabry Perot Interferometer DESCRIPTION: The SA210
Notes on Laser Resonators
 Notes on Laser Resonators 1 He-Ne Resonator Modes The mirrors that make up the laser cavity essentially form a reflecting waveguide. A stability diagram that will be covered in lecture is shown in Figure
R. J. Jones College of Optical Sciences OPTI 511L Fall 2017
 R. J. Jones College of Optical Sciences OPTI 511L Fall 2017 Active Modelocking of a Helium-Neon Laser The generation of short optical pulses is important for a wide variety of applications, from time-resolved
visibility values: 1) V1=0.5 2) V2=0.9 3) V3=0.99 b) In the three cases considered, what are the values of FSR (Free Spectral Range) and
 V1=0.5 2) V2=0.9 3) V3=0.99 b) In the three cases considered, what are the values of FSR (Free Spectral Range) and") EXERCISES OF OPTICAL MEASUREMENTS BY ENRICO RANDONE AND CESARE SVELTO EXERCISE 1 A CW laser radiation (λ=2.1 µm) is delivered to a Fabry-Pérot interferometer made of 2 identical plane and parallel mirrors
EXERCISES OF OPTICAL MEASUREMENTS BY ENRICO RANDONE AND CESARE SVELTO EXERCISE 1 A CW laser radiation (λ=2.1 µm) is delivered to a Fabry-Pérot interferometer made of 2 identical plane and parallel mirrors
Fabry-Perot Cavity FP1-A INSTRUCTOR S MANUAL
 Fabry-Perot Cavity FP1-A INSTRUCTOR S MANUAL A PRODUCT OF TEACHSPIN, INC. TeachSpin, Inc. 2495 Main Street Suite 409 Buffalo, NY 14214-2153 Phone: (716) 885-4701 Fax: (716) 836-1077 WWW.TeachSpin.com TeachSpin
MASSACHUSETTS INSTITUTE OF TECHNOLOGY Department of Electrical Engineering and Computer Science
 Student Name Date MASSACHUSETTS INSTITUTE OF TECHNOLOGY Department of Electrical Engineering and Computer Science 6.161 Modern Optics Project Laboratory Laboratory Exercise No. 6 Fall 2010 Solid-State
ECE 185 HELIUM-NEON LASER
 ECE 185 HELIUM-NEON LASER I. OBJECTIVES To study the output characteristics of a He-Ne laser: maximum power output, power conversion efficiency, polarization, TEM mode structures, beam divergence, and
Experimental Physics. Experiment C & D: Pulsed Laser & Dye Laser. Course: FY12. Project: The Pulsed Laser. Done by: Wael Al-Assadi & Irvin Mangwiza
 Experiment C & D: Course: FY1 The Pulsed Laser Done by: Wael Al-Assadi Mangwiza 8/1/ Wael Al Assadi Mangwiza Experiment C & D : Introduction: Course: FY1 Rev. 35. Page: of 16 1// In this experiment we
Ph 77 ADVANCED PHYSICS LABORATORY ATOMICANDOPTICALPHYSICS
 Ph 77 ADVANCED PHYSICS LABORATORY ATOMICANDOPTICALPHYSICS Expt. 72 Laser Frequency Stabilization I. BACKGROUND In many precision optical measurements, it is desirable to have a laser with a well-defined
Fabry Perot Resonator (CA-1140)
") Fabry Perot Resonator (CA-1140) The open frame Fabry Perot kit CA-1140 was designed for demonstration and investigation of characteristics like resonance, free spectral range and finesse of a resonator.
Fabry Perot Resonator (CA-1140) The open frame Fabry Perot kit CA-1140 was designed for demonstration and investigation of characteristics like resonance, free spectral range and finesse of a resonator.
Laser stabilization and frequency modulation for trapped-ion experiments
 Laser stabilization and frequency modulation for trapped-ion experiments Michael Matter Supervisor: Florian Leupold Semester project at Trapped Ion Quantum Information group July 16, 2014 Abstract A laser
Diffraction. Interference with more than 2 beams. Diffraction gratings. Diffraction by an aperture. Diffraction of a laser beam
 Diffraction Interference with more than 2 beams 3, 4, 5 beams Large number of beams Diffraction gratings Equation Uses Diffraction by an aperture Huygen s principle again, Fresnel zones, Arago s spot Qualitative
DESIGN OF COMPACT PULSED 4 MIRROR LASER WIRE SYSTEM FOR QUICK MEASUREMENT OF ELECTRON BEAM PROFILE
 1 DESIGN OF COMPACT PULSED 4 MIRROR LASER WIRE SYSTEM FOR QUICK MEASUREMENT OF ELECTRON BEAM PROFILE PRESENTED BY- ARPIT RAWANKAR THE GRADUATE UNIVERSITY FOR ADVANCED STUDIES, HAYAMA 2 INDEX 1. Concept
ADVANCED OPTICS LAB -ECEN 5606
 ADVANCED OPTICS LAB -ECEN 5606 Basic Skills Lab Dr. Steve Cundiff and Edward McKenna, 1/15/04 rev KW 1/15/06, 1/8/10 The goal of this lab is to provide you with practice of some of the basic skills needed
CHAPTER 5 FINE-TUNING OF AN ECDL WITH AN INTRACAVITY LIQUID CRYSTAL ELEMENT
 CHAPTER 5 FINE-TUNING OF AN ECDL WITH AN INTRACAVITY LIQUID CRYSTAL ELEMENT In this chapter, the experimental results for fine-tuning of the laser wavelength with an intracavity liquid crystal element
B. Cavity-Enhanced Absorption Spectroscopy (CEAS)
") B. Cavity-Enhanced Absorption Spectroscopy (CEAS) CEAS is also known as ICOS (integrated cavity output spectroscopy). Developed in 1998 (Engeln et al.; O Keefe et al.) In cavity ringdown spectroscopy,
B. Cavity-Enhanced Absorption Spectroscopy (CEAS) CEAS is also known as ICOS (integrated cavity output spectroscopy). Developed in 1998 (Engeln et al.; O Keefe et al.) In cavity ringdown spectroscopy,
FRAUNHOFER AND FRESNEL DIFFRACTION IN ONE DIMENSION
 FRAUNHOFER AND FRESNEL DIFFRACTION IN ONE DIMENSION Revised November 15, 2017 INTRODUCTION The simplest and most commonly described examples of diffraction and interference from two-dimensional apertures
Doppler-Free Spetroscopy of Rubidium
 Doppler-Free Spetroscopy of Rubidium Pranjal Vachaspati, Sabrina Pasterski MIT Department of Physics (Dated: April 17, 2013) We present a technique for spectroscopy of rubidium that eliminates doppler
ADVANCED OPTICS LAB -ECEN Basic Skills Lab
 ADVANCED OPTICS LAB -ECEN 5606 Basic Skills Lab Dr. Steve Cundiff and Edward McKenna, 1/15/04 Revised KW 1/15/06, 1/8/10 Revised CC and RZ 01/17/14 The goal of this lab is to provide you with practice
PHYS 3153 Methods of Experimental Physics II O2. Applications of Interferometry
 Purpose PHYS 3153 Methods of Experimental Physics II O2. Applications of Interferometry In this experiment, you will study the principles and applications of interferometry. Equipment and components PASCO
EE119 Introduction to Optical Engineering Spring 2003 Final Exam. Name:
 EE119 Introduction to Optical Engineering Spring 2003 Final Exam Name: SID: CLOSED BOOK. THREE 8 1/2 X 11 SHEETS OF NOTES, AND SCIENTIFIC POCKET CALCULATOR PERMITTED. TIME ALLOTTED: 180 MINUTES Fundamental
Principles of Optics for Engineers
 Principles of Optics for Engineers Uniting historically different approaches by presenting optical analyses as solutions of Maxwell s equations, this unique book enables students and practicing engineers
A review of Pound-Drever-Hall laser frequency locking
 A review of Pound-Drever-Hall laser frequency locking M Nickerson JILA, University of Colorado and NIST, Boulder, CO 80309-0440, USA Email: nickermj@jila.colorado.edu Abstract. This paper reviews the Pound-Drever-Hall
Fabry-Perot Interferometer
 Experimental Optics Contact: Maximilian Heck (maximilian.heck@uni-jena.de) Ria Krämer (ria.kraemer@uni-jena.de) Last edition: Ria Krämer, March 2017 Fabry-Perot Interferometer Contents 1 Overview 3 2 Safety
A novel tunable diode laser using volume holographic gratings
 A novel tunable diode laser using volume holographic gratings Christophe Moser *, Lawrence Ho and Frank Havermeyer Ondax, Inc. 85 E. Duarte Road, Monrovia, CA 9116, USA ABSTRACT We have developed a self-aligned
880 Quantum Electronics Optional Lab Construct A Pulsed Dye Laser
 880 Quantum Electronics Optional Lab Construct A Pulsed Dye Laser The goal of this lab is to give you experience aligning a laser and getting it to lase more-or-less from scratch. There is no write-up
Wavelength Control and Locking with Sub-MHz Precision
 Wavelength Control and Locking with Sub-MHz Precision A PZT actuator on one of the resonator mirrors enables the Verdi output wavelength to be rapidly tuned over a range of several GHz or tightly locked
Multiply Resonant EOM for the LIGO 40-meter Interferometer
 LASER INTERFEROMETER GRAVITATIONAL WAVE OBSERVATORY - LIGO - CALIFORNIA INSTITUTE OF TECHNOLOGY MASSACHUSETTS INSTITUTE OF TECHNOLOGY LIGO-XXXXXXX-XX-X Date: 2009/09/25 Multiply Resonant EOM for the LIGO
Fabry-Perot Interferometer
 Experimental Optics Contact: Maximilian Heck (maximilian.heck@uni-jena.de) Last edition: Ria Krämer, January 2017 Contents 1 Overview 3 2 Safety Issues 3 2.1 Eye hazard..................................
MICROWAVE OPTICS. Instruction Manual and Experiment Guide for the PASCO scientific Model WA-9314B G
 Includes Teacher's Notes and Typical Experiment Results Instruction Manual and Experiment Guide for the PASCO scientific Model WA-9314B 012-04630G MICROWAVE OPTICS 10101 Foothills Blvd. Roseville, CA 95678-9011
DIODE LASER SPECTROSCOPY (160309)
") DIODE LASER SPECTROSCOPY (160309) Introduction The purpose of this laboratory exercise is to illustrate how we may investigate tiny energy splittings in an atomic system using laser spectroscopy. As an
DIODE LASER SPECTROSCOPY (160309) Introduction The purpose of this laboratory exercise is to illustrate how we may investigate tiny energy splittings in an atomic system using laser spectroscopy. As an
5: SOUND WAVES IN TUBES AND RESONANCES INTRODUCTION
 5: SOUND WAVES IN TUBES AND RESONANCES INTRODUCTION So far we have studied oscillations and waves on springs and strings. We have done this because it is comparatively easy to observe wave behavior directly
레이저의주파수안정화방법및그응용 박상언 ( 한국표준과학연구원, 길이시간센터 )
") 레이저의주파수안정화방법및그응용 박상언 ( 한국표준과학연구원, 길이시간센터 ) Contents Frequency references Frequency locking methods Basic principle of loop filter Example of lock box circuits Quantifying frequency stability Applications
레이저의주파수안정화방법및그응용 박상언 ( 한국표준과학연구원, 길이시간센터 ) Contents Frequency references Frequency locking methods Basic principle of loop filter Example of lock box circuits Quantifying frequency stability Applications
Constructing a Confocal Fabry-Perot Interferometer
 Constructing a Confocal Fabry-Perot Interferometer Michael Dapolito and Eric Wu Laser Teaching Center Department of Physics and Astronomy, Stony Brook University Stony Brook, NY 11794 July 9, 2018 Introduction
 15-8 1/31/2014 PRELAB PROBLEMS 1. Why is the boundary condition of the cavity such that the component of the air displacement χ perpendicular to a wall must vanish at the wall? 2. Show that equation (5)
EE119 Introduction to Optical Engineering Fall 2009 Final Exam. Name:
 EE119 Introduction to Optical Engineering Fall 2009 Final Exam Name: SID: CLOSED BOOK. THREE 8 1/2 X 11 SHEETS OF NOTES, AND SCIENTIFIC POCKET CALCULATOR PERMITTED. TIME ALLOTTED: 180 MINUTES Fundamental
Ph 77 ADVANCED PHYSICS LABORATORY ATOMIC AND OPTICAL PHYSICS
 Ph 77 ADVANCED PHYSICS LABORATORY ATOMIC AND OPTICAL PHYSICS Diode Laser Characteristics I. BACKGROUND Beginning in the mid 1960 s, before the development of semiconductor diode lasers, physicists mostly
Department of Electrical Engineering and Computer Science
 MASSACHUSETTS INSTITUTE of TECHNOLOGY Department of Electrical Engineering and Computer Science 6.161/6637 Practice Quiz 2 Issued X:XXpm 4/XX/2004 Spring Term, 2004 Due X:XX+1:30pm 4/XX/2004 Please utilize
Evaluation of Scientific Solutions Liquid Crystal Fabry-Perot Etalon
 Evaluation of Scientific Solutions Liquid Crystal Fabry-Perot Etalon Testing of the etalon was done using a frequency stabilized He-Ne laser. The beam from the laser was passed through a spatial filter
DPSS 266nm Deep UV Laser Module
 DPSS 266nm Deep UV Laser Module Specifications: SDL-266-XXXT (nm) 266nm Ave Output Power 1-5mW 10~200mW Peak power (W) ~10 ~450 Average power (mw) Average power (mw) = Single pulse energy (μj) * Rep. rate
Installation and Characterization of the Advanced LIGO 200 Watt PSL
 Installation and Characterization of the Advanced LIGO 200 Watt PSL Nicholas Langellier Mentor: Benno Willke Background and Motivation Albert Einstein's published his General Theory of Relativity in 1916,
Wave Front Detection for Virgo
 Wave Front Detection for Virgo L.L.Richardson University of Arizona, Steward Observatory, 933 N. Cherry ave, Tucson Arizona 8575, USA E-mail: zimlance@email.arizona.edu Abstract. The use of phase cameras
Spectral phase shaping for high resolution CARS spectroscopy around 3000 cm 1
 Spectral phase shaping for high resolution CARS spectroscopy around 3 cm A.C.W. van Rhijn, S. Postma, J.P. Korterik, J.L. Herek, and H.L. Offerhaus Mesa + Research Institute for Nanotechnology, University
Exercise 1-3. Radar Antennas EXERCISE OBJECTIVE DISCUSSION OUTLINE DISCUSSION OF FUNDAMENTALS. Antenna types
 Exercise 1-3 Radar Antennas EXERCISE OBJECTIVE When you have completed this exercise, you will be familiar with the role of the antenna in a radar system. You will also be familiar with the intrinsic characteristics
SECOND HARMONIC GENERATION AND Q-SWITCHING
 SECOND HARMONIC GENERATION AND Q-SWITCHING INTRODUCTION In this experiment, the following learning subjects will be worked out: 1) Characteristics of a semiconductor diode laser. 2) Optical pumping on
Physics 476LW. Advanced Physics Laboratory - Microwave Optics
 Physics 476LW Advanced Physics Laboratory Microwave Radiation Introduction Setup The purpose of this lab is to better understand the various ways that interference of EM radiation manifests itself. However,
Imaging Systems Laboratory II. Laboratory 8: The Michelson Interferometer / Diffraction April 30 & May 02, 2002
 1051-232 Imaging Systems Laboratory II Laboratory 8: The Michelson Interferometer / Diffraction April 30 & May 02, 2002 Abstract. In the last lab, you saw that coherent light from two different locations
Week IX: INTERFEROMETER EXPERIMENTS
 Week IX: INTERFEROMETER EXPERIMENTS Notes on Adjusting the Michelson Interference Caution: Do not touch the mirrors or beam splitters they are front surface and difficult to clean without damaging them.
AS Physics Unit 5 - Waves 1
 AS Physics Unit 5 - Waves 1 WHAT IS WAVE MOTION? The wave motion is a means of transferring energy from one point to another without the transfer of any matter between the points. Waves may be classified
MASSACHUSETTS INSTITUTE OF TECHNOLOGY Department of Electrical Engineering and Computer Science
 Student Name Date MASSACHUSETTS INSTITUTE OF TECHNOLOGY Department of Electrical Engineering and Computer Science 6.161 Modern Optics Project Laboratory Laboratory Exercise No. 6 Fall 2016 Electro-optic
Optical Communications and Networking 朱祖勍. Sept. 25, 2017
 Optical Communications and Networking Sept. 25, 2017 Lecture 4: Signal Propagation in Fiber 1 Nonlinear Effects The assumption of linearity may not always be valid. Nonlinear effects are all related to
Physics 309 Lab 2 Faraday Effect
 Physics 309 Lab 2 Faraday Effect The Faraday effect is rotation of the plane of light polarization by a magnetic field acting on a material. The rotation angle θ is proportional to the magnetic field and
Chapter Ray and Wave Optics
 109 Chapter Ray and Wave Optics 1. An astronomical telescope has a large aperture to [2002] reduce spherical aberration have high resolution increase span of observation have low dispersion. 2. If two
The Lightwave Model 142 CW Visible Ring Laser, Beam Splitter, Model ATM- 80A1 Acousto-Optic Modulator, and Fiber Optic Cable Coupler Optics Project
 The Lightwave Model 142 CW Visible Ring Laser, Beam Splitter, Model ATM- 80A1 Acousto-Optic Modulator, and Fiber Optic Cable Coupler Optics Project Stephen W. Jordan Seth Merritt Optics Project PH 464
Construction and Characterization of a Prototype External Cavity Diode Laser
 Construction and Characterization of a Prototype External Cavity Diode Laser Joshua Wienands February 8, 2011 1 1 Introduction 1.1 Laser Cooling Cooling atoms with lasers is achieved through radiation
Ultra stable laser sources based on molecular acetylene
 U N I V E R S I T Y O F C O P E N H A G E N F A C U L T Y O F S C I E N C E Ultra stable laser sources based on molecular acetylene Author Parisah Akrami Niels Bohr Institute Supervisor: Jan W. Thomsen
Figure 1. Schematic diagram of a Fabry-Perot laser.
 Figure 1. Schematic diagram of a Fabry-Perot laser. Figure 1. Shows the structure of a typical edge-emitting laser. The dimensions of the active region are 200 m m in length, 2-10 m m lateral width and
Lecture 04: Solar Imaging Instruments
 Hale COLLAGE (NJIT Phys-780) Topics in Solar Observation Techniques Lecture 04: Solar Imaging Instruments Wenda Cao New Jersey Institute of Technology Valentin M. Pillet National Solar Observatory SDO
Swept Wavelength Testing:
 Application Note 13 Swept Wavelength Testing: Characterizing the Tuning Linearity of Tunable Laser Sources In a swept-wavelength measurement system, the wavelength of a tunable laser source (TLS) is swept
Communication Engineering Prof. Surendra Prasad Department of Electrical Engineering Indian Institute of Technology, Delhi
 Communication Engineering Prof. Surendra Prasad Department of Electrical Engineering Indian Institute of Technology, Delhi Lecture - 16 Angle Modulation (Contd.) We will continue our discussion on Angle
HOLIDAY HOME WORK PHYSICS CLASS-12B AUTUMN BREAK 2018
 HOLIDAY HOME WK PHYSICS CLASS-12B AUTUMN BREAK 2018 NOTE: 1. THESE QUESTIONS ARE FROM PREVIOUS YEAR BOARD PAPERS FROM 2009-2018 CHAPTERS EMI,AC,OPTICS(BUT TRY TO SOLVE ONLY NON-REPEATED QUESTION) QUESTION
Physics 431 Final Exam Examples (3:00-5:00 pm 12/16/2009) TIME ALLOTTED: 120 MINUTES Name: Signature:
 TIME ALLOTTED: 120 MINUTES Name: Signature:") Physics 431 Final Exam Examples (3:00-5:00 pm 12/16/2009) TIME ALLOTTED: 120 MINUTES Name: PID: Signature: CLOSED BOOK. TWO 8 1/2 X 11 SHEET OF NOTES (double sided is allowed), AND SCIENTIFIC POCKET CALCULATOR
Physics 431 Final Exam Examples (3:00-5:00 pm 12/16/2009) TIME ALLOTTED: 120 MINUTES Name: PID: Signature: CLOSED BOOK. TWO 8 1/2 X 11 SHEET OF NOTES (double sided is allowed), AND SCIENTIFIC POCKET CALCULATOR
The electric field for the wave sketched in Fig. 3-1 can be written as
 ELECTROMAGNETIC WAVES Light consists of an electric field and a magnetic field that oscillate at very high rates, of the order of 10 14 Hz. These fields travel in wavelike fashion at very high speeds.
Combining a stable and an unstable resonator
 CHAPTER 9 Combining a stable and an unstable resonator We investigate a two-mirror resonator comprising two multi-mode cavities that are intrinsically coupled. The key element of this system is a mirror
Spectroscopy of Ruby Fluorescence Physics Advanced Physics Lab - Summer 2018 Don Heiman, Northeastern University, 1/12/2018
 1 Spectroscopy of Ruby Fluorescence Physics 3600 - Advanced Physics Lab - Summer 2018 Don Heiman, Northeastern University, 1/12/2018 I. INTRODUCTION The laser was invented in May 1960 by Theodor Maiman.
Optical Cavity Designs for Interferometric Gravitational Wave Detectors. Pablo Barriga 17 August 2009
 Optical Cavity Designs for Interferoetric Gravitational Wave Detectors Pablo Barriga 7 August 9 Assignents.- Assuing a cavity of 4k with an ITM of 934 radius of curvature and an ETM of 45 radius of curvature.
Projects in microwave theory 2009
 Electrical and information technology Projects in microwave theory 2009 Write a short report on the project that includes a short abstract, an introduction, a theory section, a section on the results and
Computer Generated Holograms for Optical Testing
 Computer Generated Holograms for Optical Testing Dr. Jim Burge Associate Professor Optical Sciences and Astronomy University of Arizona jburge@optics.arizona.edu 520-621-8182 Computer Generated Holograms
3 General Principles of Operation of the S7500 Laser
 Application Note AN-2095 Controlling the S7500 CW Tunable Laser 1 Introduction This document explains the general principles of operation of Finisar s S7500 tunable laser. It provides a high-level description
Polarization Experiments Using Jones Calculus
 Polarization Experiments Using Jones Calculus Reference http://chaos.swarthmore.edu/courses/physics50_2008/p50_optics/04_polariz_matrices.pdf Theory In Jones calculus, the polarization state of light is
ECEN. Spectroscopy. Lab 8. copy. constituents HOMEWORK PR. Figure. 1. Layout of. of the
 ECEN 4606 Lab 8 Spectroscopy SUMMARY: ROBLEM 1: Pedrotti 3 12-10. In this lab, you will design, build and test an optical spectrum analyzer and use it for both absorption and emission spectroscopy. The
E X P E R I M E N T 12
 E X P E R I M E N T 12 Mirrors and Lenses Produced by the Physics Staff at Collin College Copyright Collin College Physics Department. All Rights Reserved. University Physics II, Exp 12: Mirrors and Lenses
Frequency Control and Stabilization of a Laser System
 Frequency Control and Stabilization of a Laser System Chu Cheyenne Teng Advisor: Professor David A. Hanneke December 10, 2013 Submitted to the Department of Physics of Amherst College in partial fulfilment
Physics 248 Spring 2009 Lab 1: Interference and Diffraction
 Name Section Physics 248 Spring 2009 Lab 1: Interference and Diffraction Your TA will use this sheet to score your lab. It is to be turned in at the end of lab. You must clearly explain your reasoning
EC Transmission Lines And Waveguides
 EC6503 - Transmission Lines And Waveguides UNIT I - TRANSMISSION LINE THEORY A line of cascaded T sections & Transmission lines - General Solution, Physical Significance of the Equations 1. Define Characteristic
Optical design of shining light through wall experiments
 Optical design of shining light through wall experiments Benno Willke Leibniz Universität Hannover (member of the ALPS collaboration) Vistas in Axion Physics: A Roadmap for Theoretical and Experimental
Experiment 12: Microwaves
 MASSACHUSETTS INSTITUTE OF TECHNOLOGY Department of Physics 8.02 Spring 2005 OBJECTIVES Experiment 12: Microwaves To observe the polarization and angular dependence of radiation from a microwave generator
Kit for building your own THz Time-Domain Spectrometer
 Kit for building your own THz Time-Domain Spectrometer 16/06/2016 1 Table of contents 0. Parts for the THz Kit... 3 1. Delay line... 4 2. Pulse generator and lock-in detector... 5 3. THz antennas... 6
Stabilizing an Interferometric Delay with PI Control
 Stabilizing an Interferometric Delay with PI Control Madeleine Bulkow August 31, 2013 Abstract A Mach-Zhender style interferometric delay can be used to separate a pulses by a precise amount of time, act
KULLIYYAH OF ENGINEERING
 KULLIYYAH OF ENGINEERING DEPARTMENT OF ELECTRICAL & COMPUTER ENGINEERING ANTENNA AND WAVE PROPAGATION LABORATORY (ECE 4103) EXPERIMENT NO 3 RADIATION PATTERN AND GAIN CHARACTERISTICS OF THE DISH (PARABOLIC)
UV/Optical/IR Astronomy Part 2: Spectroscopy
 UV/Optical/IR Astronomy Part 2: Spectroscopy Introduction We now turn to spectroscopy. Much of what you need to know about this is the same as for imaging I ll concentrate on the differences. Slicing the
NANO 703-Notes. Chapter 9-The Instrument
 1 Chapter 9-The Instrument Illumination (condenser) system Before (above) the sample, the purpose of electron lenses is to form the beam/probe that will illuminate the sample. Our electron source is macroscopic
ECEN 4606, UNDERGRADUATE OPTICS LAB
 ECEN 4606, UNDERGRADUATE OPTICS LAB Lab 2: Imaging 1 the Telescope Original Version: Prof. McLeod SUMMARY: In this lab you will become familiar with the use of one or more lenses to create images of distant
Wave optics and interferometry
 11b, 2013, lab 7 Wave optics and interferometry Note: The optical surfaces used in this experiment are delicate. Please do not touch any of the optic surfaces to avoid scratches and fingerprints. Please
Optical Vernier Technique for Measuring the Lengths of LIGO Fabry-Perot Resonators
 LASER INTERFEROMETER GRAVITATIONAL WAVE OBSERVATORY -LIGO- CALIFORNIA INSTITUTE OF TECHNOLOGY MASSACHUSETTS INSTITUTE OF TECHNOLOGY Technical Note LIGO-T97074-0- R 0/5/97 Optical Vernier Technique for
Lecture 6 Fiber Optical Communication Lecture 6, Slide 1
 Lecture 6 Optical transmitters Photon processes in light matter interaction Lasers Lasing conditions The rate equations CW operation Modulation response Noise Light emitting diodes (LED) Power Modulation
GEOMETRICAL OPTICS Practical 1. Part I. BASIC ELEMENTS AND METHODS FOR CHARACTERIZATION OF OPTICAL SYSTEMS
 GEOMETRICAL OPTICS Practical 1. Part I. BASIC ELEMENTS AND METHODS FOR CHARACTERIZATION OF OPTICAL SYSTEMS Equipment and accessories: an optical bench with a scale, an incandescent lamp, matte, a set of
Tutorial Zemax 9: Physical optical modelling I
 Tutorial Zemax 9: Physical optical modelling I 2012-11-04 9 Physical optical modelling I 1 9.1 Gaussian Beams... 1 9.2 Physical Beam Propagation... 3 9.3 Polarization... 7 9.4 Polarization II... 11 9 Physical
Laser Beam Analysis Using Image Processing
 Journal of Computer Science 2 (): 09-3, 2006 ISSN 549-3636 Science Publications, 2006 Laser Beam Analysis Using Image Processing Yas A. Alsultanny Computer Science Department, Amman Arab University for
Module 4 : Third order nonlinear optical processes. Lecture 24 : Kerr lens modelocking: An application of self focusing
 Module 4 : Third order nonlinear optical processes Lecture 24 : Kerr lens modelocking: An application of self focusing Objectives This lecture deals with the application of self focusing phenomena to ultrafast
Optics Laboratory Spring Semester 2017 University of Portland
 Optics Laboratory Spring Semester 2017 University of Portland Laser Safety Warning: The HeNe laser can cause permanent damage to your vision. Never look directly into the laser tube or at a reflection
UCI ZEEMAN EFFECT. Observe the fine structure lines of mercury and the Zeeman splitting of one or more of these lines as a function of magnetic field.
 UCI ZEEMAN EFFECT OBJECTIVES Observe the fine structure lines of mercury and the Zeeman splitting of one or more of these lines as a function of magnetic field. Compare the observed splitting with theoretical
2. Pulsed Acoustic Microscopy and Picosecond Ultrasonics
 1st International Symposium on Laser Ultrasonics: Science, Technology and Applications July 16-18 2008, Montreal, Canada Picosecond Ultrasonic Microscopy of Semiconductor Nanostructures Thomas J GRIMSLEY
Characteristics of point-focus Simultaneous Spatial and temporal Focusing (SSTF) as a two-photon excited fluorescence microscopy
 as a two-photon excited fluorescence microscopy") Characteristics of point-focus Simultaneous Spatial and temporal Focusing (SSTF) as a two-photon excited fluorescence microscopy Qiyuan Song (M2) and Aoi Nakamura (B4) Abstracts: We theoretically and experimentally
Characteristics of point-focus Simultaneous Spatial and temporal Focusing (SSTF) as a two-photon excited fluorescence microscopy Qiyuan Song (M2) and Aoi Nakamura (B4) Abstracts: We theoretically and experimentally
Spectrometer using a tunable diode laser
 Spectrometer using a tunable diode laser Ricardo Vasquez Department of Physics, Purdue University, West Lafayette, IN April, 2000 In the following paper the construction of a simple spectrometer using
Pound-Drever-Hall Locking of a Chip External Cavity Laser to a High-Finesse Cavity Using Vescent Photonics Lasers & Locking Electronics
 of a Chip External Cavity Laser to a High-Finesse Cavity Using Vescent Photonics Lasers & Locking Electronics 1. Introduction A Pound-Drever-Hall (PDH) lock 1 of a laser was performed as a precursor to
Cavity-Enhanced Observation of Conformational Changes in BChla
 Cavity-Enhanced Observation of Conformational Changes in BChla Dirk Englund Summer Undergraduate Research Fellowship 2001 California Institute of Technology October 25, 2001 Abstract This research aims