Characterizing Photodiodes of the Homodyne Detector for Advanced Virgo Squeezer
|
|
|
- Stanley Gaines
- 6 years ago
- Views:
Transcription
1 Characterizing Photodiodes of the Homodyne Detector for Advanced Virgo Squeezer Alexandra Montesano August 1,
2 Contents 1 Abstract 3 2 Introduction Gravitational Waves Motivation Squeezed Light Quantum Noise in Advanced Detectors OPO Squeezing Ponderomotive Squeezing Homodyne Detection 7 5 Gaussian Beam Characteristics 9 6 Experimental Method Gaussian Beam Simulation Rotation θ y Rotation θ x Changing the PD Position on the Homodyne Detector Observations Results and Analysis 15 8 Conclusions and Perspectives 20 9 Other Work at La Sapienza Acknowledgments References Appendix I 24 2
3 1 Abstract In the process for squeezing light, the homodyne detector is the device that detects the level of squeezing in a given method. In 2015, the squeezing group at La Sapienza developed a circuit board for the homodyne detector. In this report, I summarize the measurements done on the on the homodyne detector to verify how the DC response of the photodiode (PD) changes in function of the angle of incidence (AOI) and the polarization of the incoming beam in two different configurations. The purpose of these tests is to discover under what conditions the PDs produce the maximum DC Voltage. 2 Introduction 2.1 Gravitational Waves Gravitational Waves (GW) are very relevant in physics today. It started with Einstein s prediction that there are changes in spacetime that are caused by large cosmic interactions [7]. In the past two years, scientists have detected three GWs. Though all of these detections were caused by violent interactions in space, any accelerating mass can, in theory, produce gravitational radiation. The problem is that the detectors that exist today are not sensitive enough to observe smaller interactions. Around the world there are four major gravitational wave detectors, including two LIGO observatories located in the United States, Virgo located in Italy, and GEO600 located in Germany. To make an accurate observation of GWs, there must be detection from at least three of the four sites. Virgo was constructed as a Michaelson Interferometer with three kilometer long arms to detect GWs. Since its original construction in 2003, Virgo has been modified from its original design. In 2011, Virgo began to undergo a series of upgrades to increase sensitivity, becoming Advanced Virgo. Since then, Virgo has gone through many scientific runs and continues its 3
4 journey to increase sensitivity for the detection of GWs in the future. 2.2 Motivation The ultimate goal of squeezed light in this context is to reduce the quantum noise found in GW detectors. La Sapienza University of Rome is a section of the National Institute of Nuclear Physics, one of the main collaborators in the construction of Virgo. Facing the problem of sensitivity in Virgo, at La Sapienza they are exploring using squeezed light to combat this issue. There is already a method of squeezing being explored in the Squeezing Lab to improve sensitivity; this is the Optical Parametric Oscillator based method. With this method in other detectors, there has been progress in improving detection; however the group at La Sapienza believes the Ponderomotive Squeezing of Light could be more successful. The goal of the POLIS (Ponderomotive Light Squeezing) project is to improve sensitivity in the low frequency band. This is a deficiency found in other squeezing methods. Currently, the INFN section at La Sapienza has provided the circuit board for the Homodyne Detector in the Squeezing Lab at Virgo. An Optical Parametric Oscillator system is used to produce the squeezed light. The PD used in conjunction with this circuit is a custom made, high efficiency Infrared PD from LASER COMPONENTS R (LC). The manufacturer gave us the information that the PDs have a maximum response at an AOI of 20 with an incoming beam of S-Polarization; however, this was not confirmed experimentally. There is also uncertainty on which axis the detector should be rotated. With the present work, we wanted to check experimentally these PD characteristics. It is necessary to find the maximum DC Output Voltage, so that it is certain we are maximizing the functionality of the PD. The Eptiaxx PDs were used to perfect the experimental procedure before taking data with the LC PDs. The homodyne detector used will also be the same for the experimental setup for the Ponderomotive method of light squeezing. We used the homodyne detector to test these features because it already has a 4
5 DC Output channel for both PD positions; this allows us to observe the changes in the voltage without requiring new electronics. 3 Squeezed Light 3.1 Quantum Noise in Advanced Detectors Because these advanced detectors have increased sensitivity, their main limitation is the quantum nature of light. The sources of noise in these detectors are shown in Figue 1, where you can see the noise of Advanced Virgo (AdV) is approaching this limit. The Quantum Noise is an uncorrelated sum of both the Radiation Pressure Noise and the Shot Noise: h quantum (v) = h 2 shot (v) + h2 RP (v) The Radiation Pressure Noise (RPN) is due to the transfer of momentum from the photons to the mirrors where as the Shot Noise (SN) is due to the uncertainty in the number of photons. RPN dominates the quantum noise at low frequencies and S.N. at high frequencies. Squeezed States of Light are seen as a solution to overcoming the Standard Quantum Limit. Light can be squeezed in one of two quadrature, each of which correspond to one of the contributions to the quantum noise. As seen in Figure 2, the uncertainties in both quadrature obey the Heisenberg Uncertainty Principle. We cannot defy this, but we can minimize the uncertainty in one quadrature to generate a squeezed state. An ideal squeezer would produce frequency dependent squeezed states to overcome many values of RPN and SN across the GW detection spectrum. 3.2 OPO Squeezing Optical Parametric Oscilator based squeezing utilizes the characteristics of non-linear crystals and mirrors in a cavity to produce squeezed states. This method is currently being explored at Virgo and has shown success at GEO600 in Hannover. This method of squeezing requires two 5

![[3] Figure 2: This figure shows the effect of squeezing on the Phase](/docs-images/75/72334525/images/6-2.jpg "Quadrature as well as the equation defining the uncertainties in both")
6 Figure 1: This figure is a graphical representation of the expected noise sources of AdV. [3] Figure 2: This figure shows the effect of squeezing on the Phase Quadrature as well as the equation defining the uncertainties in both quadratures by the Heisenberg Uncertainty Principal. [3] 6
7 Figure 3: This figure shows method of producing squeezed light with non-linear crystals. [6] lasers one with a frequency of ω 0 and one with a frequency of 2ω 0, as shown in Figure 3. The combination of these two lasers with the non-linear processes in the dielectric generate a phase quadrature squeezed state. This makes OPO Squeezing very effective in reducing Shot Noise at high frequencies; however a method is needed to reduce RPN at lower frequencies. 3.3 Ponderomotive Squeezing Ponderomotive Squeezing is a method that uses the features of optical springs in an empty cavity with suspended mirrors to produce squeezed light. The effects of the optical springs have been observed; however there is yet a group to observe squeezed states with this method. It is being pursued because of it s potential to produce frequency dependent squeezed states. As seen in Figure 4, the squeezed state is produced by the radiation pressure creating a phase shift between the two mirrors that couples the phase and amplitude quadratures. The Light Squeezing group at La Sapienza is working to construct a suspended bench for producing this method of squeezing. 4 Homodyne Detection The Homodyne Detector is composed of a circuit board that has five channels and two PDs. It is used as a diagnostic tool in measuring the amount of squeezed light produced in a given system. 7
![Figure 4: This figure shows method of producing squeezed light with an empty cavity containing suspended mirrors. [4] A conceptual scheme of the circuit can be found in Figure 5.](/docs-images/75/72334525/images/8-0.jpg "The Self-Subtraction allows us to Figure 5: This figure shows an conceptual scheme of the functions of the electronics on the Homodyne Detector [2].")
8 Figure 4: This figure shows method of producing squeezed light with an empty cavity containing suspended mirrors. [4] A conceptual scheme of the circuit can be found in Figure 5. The Self-Subtraction allows us to Figure 5: This figure shows an conceptual scheme of the functions of the electronics on the Homodyne Detector [2]. gain information on the squeezed light produced where the Sum gives information regarding the shot noise of the local oscillator [2] Our interest in the Homodyne Detector is for the use of it s DC Outputs. This circuit provides us with a convenient way to measure the DC signal produced by the PDs without having to introduce new electronics. A picture of the Homodyne Circuit that is used both in the lab at La Sapienza and at Virgo is shown in Figure 6. Connections were made to the homodyne detector for measuring the DC Voltage Output of each PD as shown in Figure 7. We use the oscilloscopes to measure the DC signal of either PD, and the DC Voltage Source is used to aliment the circuit and thus the PDs. 8

9 Figure 6: This figure shows an image of the homodyne detector used for experiments at La Sapienza and Virgo. 5 Gaussian Beam Characteristics A Nd:YAG, 1064nm, Gaussian beam laser was used to generate the photocurrent in the homodyne detector. The beam has a Guassian profile meaning it does not have a constant radius as shown in Figure 8. The smallest radius of the beam is called the beam waist (w0 ). Then the beam expands as you travelling farther from the waist. The rate at which the beam grows after the waist is represented by the divergence in the following equation: θ = λ/(πw0 ). Other values related to the Gaussian beam are the Rayleigh Range (zr ), the Depth of Focus (b), and the Beam Radius as a Function of Distance (w(z)), where z represents the position on the optical axis. As you add lenses in the path of the Gaussian beam, all the aforementioned values are distorted from those of the original beam. To model this, we have used a program 9
 6 Experimental Method 6.")

10 Figure 7: This figure shows a diagram of the connections made to the homodyne detector to measure the DC Voltage Output of either PD. called GaussianBeam to simulate the effects of optical elements on the beam (this will be further discussed in Section-Method-) 6 Experimental Method 6.1 Gaussian Beam Simulation Before taking data, we had to design an optical path that would keep the Gaussian Beam waist smaller than the PD s sensitive area. To assist in modelling the behavior of the Gaussian Beam through different optical elements, we used the program GaussianBeam. We found that the optimal configuration was that shown in Figure 9. This decision was based on obtaining the best beam waist size and position while using lenses that were available to us in the lab. Moreover, we wanted to have a beam with a small divergence, so the waist does not vary much when the AOI is shifted. To compensate for any divergence we will move the homodyne and thus the PD along the optical axis, so that the PD will not be always at the beam waist position. After configuring the path of the beam, we took a few days to finalize the setup. We decided that three translation stages in the x-y-z planes would be ideal for realigning of the homodyne detector after adjustments were made with a rotation stage. Our biggest challenge was finding 10

11 Figure 8: This figure shows a diagram of a Gaussian Beams with the relevant parameters. compatible stages to create a stable stand for the detector. A complete list of equipment used in the optical setup can be found in Appendix I. 6.2 Rotation θ y The first set of data was taken to check the beam polarization. To do this we had to put two optical densities just after the laser to attenuate the out-coming power from the laser. The power meter that we use for these measurements has a maximum power of 5mW, beyond this threshold it saturates. We did not change the polarization for the original set of measurements. Another set of measurements was taken to understand if the waveplates available in the lab were quarter waveplates (QWP) or half wave plate (HWP). We needed this information in order to manipulate the polarization of the laser beam arriving on our detector. We know that the beam produced by the laser has a defined polarization S, but we need 1 HWP or a combination of 2 QWP to change the polarization from S to P. In addition along the beam path, after the two optical densities (ODs), we put a polarizing beam splitter (PBS) in order to clean the polarization of the beam. In fact, the beam produced by the laser is not a purely S-Polarized, but it has a small contribution of P polarization; more precisely the beam was 90% S-Polarized 11

12 Figure 9: This figure shows the optimized parameters of the optical elements to be set-up on the optical bench in order to fit previous constraints. This work was done using GaussianBeam R software. and 10% P-Polarized. The PBS allowed us to split the two contributions and be sure of the polarization of the beam arriving on the detector. To accommodate the limits of our power meter, we switched out the two optical densities for a stronger filter. We found that we could produce 98% S-Polarized light with the first polarizer at 28 and the second at 50. This became the S-Polarized configuration for the following measurements. We found that with the first polarizer at 28 and the second at 185 we could produced 94% P-Polarized light. This became the P-Polarized configuration for the following measurements. With thee variation in the polarization of the beam, we took data manipulating the AOI of the laser on the PD of the homodyne detector for each polarization. A schematic of this setup is shown in Figure 10. This setup can be manipulated to also measure the S-Polarized light by moving the second lens and adjusting the quarter wave plates. With these configurations we adjusted the AOI around the y-axis using the rotational stage. We then used the x-y-z translation stages to realign the beam on the PD. The alignment is complete when the DC signal is maximized. This will be referred to as Rotation θ y and can be seen in Figure 11. After taking 12


13 Figure 10: This figure shows a schematic for the setup required to measure the DC Output Voltage versus the AOI of the homodyne detector with P-Polarized light. data with the Eptiaxx PD and perfecting the experimental procedure, we switched it out for the LC #1 and #4 PD. We tested the DC Voltage Output dependence on polarization and AOI again for these PD. 6.3 Rotation θ x We had inferred that our results would be the same regardless of the plane in which we rotated the detector; however, we wanted to confirm this hypothesis. We spent another day reconfiguring the base of the homodyne detector to rotate around the x-axis as shown in Figure 12. This new configuration allowed us to rotate on the new axis as well as adjust the homodyne detector in the x-y-z plane for realignment. For this configuration, we used a similar experimental procedure to measure the DC Voltage Output use the rotational stage to set the AOI and adjust the x, y, and z stages to find the maximum DC signal. This will be known as Rotation θ x. For this set of data we also tested the effect of the direction of rotation on the DC Voltage Output under the hypothesis that it would not affect the DC signal. We rotated the detector about the x-axis in both the clockwise and counterclockwise directions. We were unable to rotate in both directions for Rotation θ y because of the physical limits of the optical bench. 13


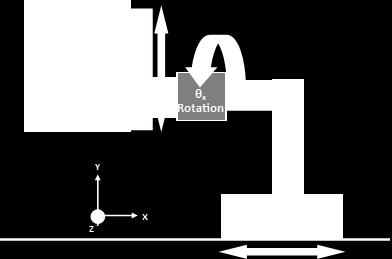
14 Figure 11: This figure shows a schematic for rotating the homodyne detector about the y-axis. Figure 12: This figure shows a schematic for rotating the homodyne detector about the x-axis. 14
15 6.4 Changing the PD Position on the Homodyne Detector All previous data was taken with the PDs in Position 1 on the homodyne detector. After taking data with the two Rotational methods, the position of the PD was switched from Position 1 to Position 2 to confirm that this change had no effect on the DC Voltage Output. These configurations can be seen again in Figure 7. We then tested the LC #1 and #4 PDs with Rotation θ y in this configuration. 6.5 Observations It is important to note that as the process of taking data progressed, our method evolved and became more normalized. In the beginning, we would often adjust the scale to increase precision in our results; however, we noticed that changing the scale can alter the measurement. With such small differences between data points, we decided to keep the oscilloscope on the 50mV scale to have better accuracy in our readings. The oscilloscope would also raise the base voltage reading over a period of time. When we first turned on the oscilloscope, it would read at around 2mV with no light on the PD, but we discovered that after about ten minutes of ramp time, it would read around 9mV. We waited until the oscilloscope read 9mV with no light incident on the detector to begin taking data. We also learned that our setup could become uncalibrated easily. Because of this, we were careful to check that the homodyne detector was truly perpendicular at 0 on the rotational stage. 7 Results and Analysis The results of the different experiments can be found in Figures It is important to note that these graphs display the absolute value of the DC Voltage; however, the sign of the voltage is actually negative for PDs in position one and positive for the PDs in position two. The error in the data was calculated by watching the oscillation of the voltage reading for one minute. We 15
16 Figure 13: This figure shows the relationship between the DC Voltage Output and the AOI for all data where S-Polarized Light was incident on the PD. The various conditions under which each data set was taken are explained in the legend. then took the highest and lowest values seen, subtracted them, and divided by two. This error can be seen in the error bars on each plot. All the raw data for this experiment can be accessed at: It seems that for all of the data sets, the homodyne detector shows a peak around 20. The part we did not predict; however is that this maximum is not absolute for the P-Polarized Light. Also, we saw that the location of the maximum is slightly variable. To analyze these curves, we used KaleidaGraph to fit curves to the data sets depending on the polarization of the light used. For S-Polarized Light, we fitted the first portion of the data by the following equation: y = M 0 + M 1 x + M 2 x 2 16
17 Figure 14: This figure shows the relationship between the DC Voltage Output and the AOI for all data where P-Polarized Light was incident on the PD. The various conditions under which each data set was taken are explained in the legend. 17

18 Figure 15: This figure shows the parabolic fit and equation applied to the first portion of the S-Polarized data taken with the LC #4 PD being rotated about the y-axis. An example of this fit can be seen in Figure 15. The second half of the S-Polarization data as well as the entire P-Polarization curve were fitted with the following equation: y = m 1 m 2 e (m 3x+m 4 ) Examples of these fits can be found in Figures After fitting the curves, for the S-Polarization, we calculated the maximum of the fit function for the first portion of the data to find the theoretical maximum DC Voltage and maximum AOI. We then compared the theoretical to the experimental with a percent difference. A summary of the S-Polarized Data can be found in Figure 18. For certain methods of rotation the fit is better than others. For the P-Polarized curve, we noticed that the first part of the function from an AOI of 0 to 25 was relatively constant. Because of this, to test the quality of our fit, we took the experimental average of the DC Voltage within that range as well as the average value of the function in the same range. We then compared the two vales through a percent difference 18


19 Figure 16: This figure shows the negative exponential grown fit and equation applied to the second portion of the S-Polarized data taken with the LC #1 PD being rotated around the y-axis in PD position two. Figure 17: This figure shows the negative exponential growth fit and equation applied to the P-Polarized data for the data taken with the LC #1 PD being rotated about the x-axis in the clockwise direction. 19

20 Figure 18: This figure summarizes all of the data taken with S-Polarized Light. We initially took the maximum AOI and DC Voltage from the experimental data and compared it to the maxima of the fitted functions through a percent difference calculation. After finding each value we averaged the experimental and theoretical values for the maximum AOI and DC Voltage and took and overall percent difference. calculation; this is shown in Figure Conclusions and Perspectives From the data, we have concluded that the Homodyne Detector in the Virgo Squeezing Lab does not need to be adjusted. It can remain in the setup with an AOI of 20. The rotation will also remain about the y-axis. We found that the S and P-Polarized lights produce different curves. This shows that the polarization does have an effect on the DC Voltage produced by the PDs. For further research, we would like to take more data for each configuration. This will allow us to have more precise results. It would be especially helpful for the S-Polarized light to see if there is another possible cure fit for the first portion of the data. The ultimate goal would be to characterize all of the LC PDs. 20

21 Figure 19: This figure summarizes all of the data taken with S-Polarized Light. We initially took the average DC Voltage from the experimental data and compared it to the average value of the fitted functions through a percent difference calculation. After finding each value we averaged the experimental and theoretical values for the mean DC Voltage and took and overall percent difference. 9 Other Work at La Sapienza Two of the projects being tackled by various faculty at La Sapienza are the Suspended Interferometer for Ponderomotive Squeezing (SIPS) Project and the assembly of payloads for Advanced Virgo (AdV). The SIPS project aims to create a system in which squeezed light can be produced using Ponderomotive techniques instead of Optical Parametric Oscillators. The payload assembly is a collaborative activity between INFN Roma One and many other institutions in Italy. The purpose is to assemble and suspend the payloads within Virgo. Sibilla Di Pace works mostly with the finite element analysis simulations to optimize the design of SIPS in order to be radiation pressure noise limited. Luca Naticchioni is the SIPS coordinator and works on payload assembly for AdV. Paola Puppo also assists with the payloads by running simulations to test thermal noise in these payloads. Ettore Majorana is an expert in in the control of suspension at Virgo and assists with the payload suspension to the super attenuator in Virgo. 21
22 Besides the experimental work being done at La Sapienza, there is also a large number of faculty working in a group to find Continuous GWs. This task is difficult because the signal duration of these waves is longer than those that have been observed in the past. An obvious source of continuous waves is asymmetric spinning neutron stars. Other possible sources include fast-spinning, young magnetars and super-radiant instabilities in spinning black holes. These occurrences, however, are hard to detect because often they do not know the typical amplitude of the signal. Another obstacle to consider is the changing position of the source which can cause amplitude and frequency modulation. Cristiano Palomba is working in targeted searches for known pulsars. These searches are based on a match filter where the position, frequency, and spin-down of the star is known. This kind of search is the most specific out of the types of searches associated with continuous GWs. Simone Mastrogiovanni performs searches for poorly known neutron stars, so he works between direct and targeted searches. In direct searches, the position of the source is known, but the frequency and spin-down are not. He creates filters to deal with non-monochromatic signals due to the Doppler Effect, spin-down, and antenna response. With these filters he has characterized methods to look for continuous waves in Fermi-LAT data; however with the use of more templates, more outliars appear. These can be due to statistical fluctuation, Non-Gaussian data, and instrumental noise artifacts. Paola Leaci is investigating specifically continuous waves emitted by a companion orbiting a neutron star before coalescence. She observes accretion disks in low mass, x-ray binaries. The best candidate for her research is Scorpius X-1 because it is the brightest and closest of the low mass, x-ray binaries with the highest accuracy of orbit. When taking data, she wants to observe many orbits, so she tries to find binaries with smaller orbital periods. She has developed filters to look for Gaussian Noise characteristics in her data that may show information about orbit parameters and periodicity. Right now she is working to improve these filters for other sources of noise. One of the major components of this group is 22
23 Sergio Frasca. He has created a library of Band Sample Data or BSD that organizes the sample signals. With this library, there is a large amount of signals that are corrected for Doppler and spin-down and available for analysis. This allows for members of the group to have a well organized source of signals to use in their development of data analysis techniques. 10 Acknowledgments I would like to thank the following people and institutions who helped make my work possible. Paola Puppo and Luca Naticchioni, thank you for taking me as a part of your team for the past two months. Sibilla Di Pace, thank you for being there to guide me through my project and to tell me anything I needed to know about my research, public transportation strikes, or Italian food. Thank you to La Sapienza for being an amazing host institution. Thank you to Bernard Whiting, Guido Miller, and the University of Florida for selecting me for this unique research opportunity, and thank you to the National Science Foundation for making it all possible. Finally, thank you to Andrew Miller for being my guide and translator for most of my time in Rome; I don t want to imagine having to survive here without you. 11 References 1. Albert Einstein Institut. (2017), Squeezed Light. 2. Advanced Virgo Squeezing Working Group. (2015), Advanced Virgo Squeezer Technical Design Report. 3. Di Pace, S. (2014), Towards the Observation of the Quantum Radiation Pressure Noise in a Susponded Interferometer: the QuRaG experiment. 4. Naticchioni, L. (2016), Ponderomotive squeezing of light; Overcoming the Standard Quantum Limit in the detection band of interferometric gravitational wave detectors. 23
24 5. Paschotta DRCBC. (2017), Gaussian Beams. Encyclopedia of Laser Physics and Technology - Gaussian beams, laser beam, fundamental transverse modes. RP Photonics Consulting GmbH. 6. Sequino V, Vardaro M, et al. (2017), Development of an audio-frequency band vacuum squeezer for the quantum noise reduction in the Gravitational Wave detector Advanced Virgo. 7. LIGO IPAC Communications Education Team. (2014) What are Gravitational Waves?. 12 Appendix I Experimental Equipment 1. Thorlabs 125mm Lens 2. Thorlabs 200mm Lens 3. Polarizing Beam-Splitter 4. Two Thorlabs Quarter Wave Plate Polarizers 5. Three Thorlabs Linear Translation Stages 6. Thorlabs 1-Aixis Rotation Stage 7. Various Thorlabs Mounts 8. Optical Filter 9. InnoLight Nd:YAG Infrared Laser 1064nm 10. Homodyne Detector Circuit Board developed by the Advanced Virgo Squeezing Group at La Sapienza 11. Eptiaxx PD 12. LASER COMPONENTS #1 PD 13. LASER COMPONENTS #4 PD 14. IsoTech Laboratory DC Power Supply 15. Keysight InfiniiVision Digital Storage Oscilloscope 16. LaserPoint Mod 3000-Laser Power and Energy Meter Andover Corporation Optical Density 24
Gravitational Wave Detection and Squeezed Light
 Gravitational Wave Detection and Squeezed Light David Sliski November 16, 2009 1 Introduction Among the revolutionary predictions of Einstein s theory of general relativity is the existence of gravitational
Installation and Characterization of the Advanced LIGO 200 Watt PSL
 Installation and Characterization of the Advanced LIGO 200 Watt PSL Nicholas Langellier Mentor: Benno Willke Background and Motivation Albert Einstein's published his General Theory of Relativity in 1916,
The generation and application of squeezed light in gravitational wave detectors and status of the POLIS project
 The generation and application of squeezed light in gravitational wave detectors and status of the POLIS project De Laurentis* on behalf of POLIS collaboration *Università degli studi di Napoli 'Federico
Multiply Resonant EOM for the LIGO 40-meter Interferometer
 LASER INTERFEROMETER GRAVITATIONAL WAVE OBSERVATORY - LIGO - CALIFORNIA INSTITUTE OF TECHNOLOGY MASSACHUSETTS INSTITUTE OF TECHNOLOGY LIGO-XXXXXXX-XX-X Date: 2009/09/25 Multiply Resonant EOM for the LIGO
Laser Beam Analysis Using Image Processing
 Journal of Computer Science 2 (): 09-3, 2006 ISSN 549-3636 Science Publications, 2006 Laser Beam Analysis Using Image Processing Yas A. Alsultanny Computer Science Department, Amman Arab University for
Back-Reflected Light and the Reduction of Nonreciprocal Phase Noise in the Fiber Back-Link on LISA
 Back-Reflected Light and the Reduction of Nonreciprocal Phase Noise in the Fiber Back-Link on LISA Aaron Specter The Laser Interferometer Space Antenna (LISA) is a joint ESA NASA project with the aim of
CO2 laser heating system for thermal compensation of test masses in high power optical cavities. Submitted by: SHUBHAM KUMAR to Prof.
 CO2 laser heating system for thermal compensation of test masses in high power optical cavities. Submitted by: SHUBHAM KUMAR to Prof. DAVID BLAIR Abstract This report gives a description of the setting
Intrinsic mirror birefringence measurements for the Any Light Particle Search (ALPS)
") Intrinsic mirror birefringence measurements for the Any Light Particle Search (ALPS) Claire Baum University of Florida August 11, 2016 Abstract In this paper, I use a heterodyne polarimeter to measure
Intrinsic mirror birefringence measurements for the Any Light Particle Search (ALPS) Claire Baum University of Florida August 11, 2016 Abstract In this paper, I use a heterodyne polarimeter to measure
Commissioning of Advanced Virgo
 Commissioning of Advanced Virgo VSR1 VSR4 VSR5/6/7? Bas Swinkels, European Gravitational Observatory on behalf of the Virgo Collaboration GWADW Takayama, 26/05/2014 B. Swinkels Adv. Virgo Commissioning
FPPO 1000 Fiber Laser Pumped Optical Parametric Oscillator: FPPO 1000 Product Manual
 Fiber Laser Pumped Optical Parametric Oscillator: FPPO 1000 Product Manual 2012 858 West Park Street, Eugene, OR 97401 www.mtinstruments.com Table of Contents Specifications and Overview... 1 General Layout...
Cavity Optics for Frequency-Dependent Light Squeezing
 Cavity Optics for Frequency-Dependent Light Squeezing Natalie Macdonald St. Johns University (Dated: August 1, 2017) Abstract. In gravitational wave detection, frequency-dependent squeezed light sources
Advanced Virgo commissioning challenges. Julia Casanueva on behalf of the Virgo collaboration
 Advanced Virgo commissioning challenges Julia Casanueva on behalf of the Virgo collaboration GW detectors network Effect on Earth of the passage of a GW change on the distance between test masses Differential
7. Michelson Interferometer
 7. Michelson Interferometer In this lab we are going to observe the interference patterns produced by two spherical waves as well as by two plane waves. We will study the operation of a Michelson interferometer,
MASSACHUSETTS INSTITUTE OF TECHNOLOGY Department of Electrical Engineering and Computer Science
 Student Name Date MASSACHUSETTS INSTITUTE OF TECHNOLOGY Department of Electrical Engineering and Computer Science 6.161 Modern Optics Project Laboratory Laboratory Exercise No. 6 Fall 2010 Solid-State
The Virgo detector. L. Rolland LAPP-Annecy GraSPA summer school L. Rolland GraSPA2013 Annecy le Vieux
 The Virgo detector The Virgo detector L. Rolland LAPP-Annecy GraSPA summer school 2013 1 Table of contents Principles Effect of GW on free fall masses Basic detection principle overview Are the Virgo mirrors
Final Report for IREU 2013
 Final Report for IREU 2013 Seth Brown Albert Einstein Institute IREU 2013 7-20-13 Brown 2 Background Information Albert Einstein s revolutionary idea that gravity is caused by curves in the fabric of space
Ultra-stable flashlamp-pumped laser *
 SLAC-PUB-10290 September 2002 Ultra-stable flashlamp-pumped laser * A. Brachmann, J. Clendenin, T.Galetto, T. Maruyama, J.Sodja, J. Turner, M. Woods Stanford Linear Accelerator Center, 2575 Sand Hill Rd.,
Arm Cavity Finesse for Advanced LIGO
 LASER INTERFEROMETER GRAVITATIONAL WAVE OBSERVATORY - LIGO - CALIFORNIA INSTITUTE OF TECHNOLOGY MASSACHUSETTS INSTITUTE OF TECHNOLOGY Technical Note LIGO-T070303-01-D Date: 2007/12/20 Arm Cavity Finesse
EE119 Introduction to Optical Engineering Fall 2009 Final Exam. Name:
 EE119 Introduction to Optical Engineering Fall 2009 Final Exam Name: SID: CLOSED BOOK. THREE 8 1/2 X 11 SHEETS OF NOTES, AND SCIENTIFIC POCKET CALCULATOR PERMITTED. TIME ALLOTTED: 180 MINUTES Fundamental
Effects of Incident Optical Power on the Effective Reverse Bias Voltage of Photodiodes This Lab Fact demonstrates how the effective reverse bias
 Effects of Incident Optical Power on the Effective Reverse Bias Voltage of Photodiodes This Lab Fact demonstrates how the effective reverse bias voltage on a photodiode can vary as a function of the incident
Single Photon Interference Laboratory
 Single Photon Interference Laboratory Renald Dore Institute of Optics University of Rochester, Rochester, NY 14627, U.S.A Abstract The purpose of our laboratories was to observe the wave-particle duality
A Thermal Compensation System for the gravitational wave detector Virgo
 A Thermal Compensation System for the gravitational wave detector Virgo M. Di Paolo Emilio University of L Aquila and INFN Roma Tor Vergata On behalf of the Virgo Collaboration Index: 1) Thermal Lensing
OPTI 511L Fall (Part 1 of 2)
") Prof. R.J. Jones OPTI 511L Fall 2016 (Part 1 of 2) Optical Sciences Experiment 1: The HeNe Laser, Gaussian beams, and optical cavities (3 weeks total) In these experiments we explore the characteristics
Prof. R.J. Jones OPTI 511L Fall 2016 (Part 1 of 2) Optical Sciences Experiment 1: The HeNe Laser, Gaussian beams, and optical cavities (3 weeks total) In these experiments we explore the characteristics
Polarization Sagnac interferometer with a common-path local oscillator for heterodyne detection
 1354 J. Opt. Soc. Am. B/Vol. 16, No. 9/September 1999 Beyersdorf et al. Polarization Sagnac interferometer with a common-path local oscillator for heterodyne detection Peter T. Beyersdorf, Martin M. Fejer,
Results from the Stanford 10 m Sagnac interferometer
 INSTITUTE OF PHYSICSPUBLISHING Class. Quantum Grav. 19 (2002) 1585 1589 CLASSICAL ANDQUANTUM GRAVITY PII: S0264-9381(02)30157-6 Results from the Stanford 10 m Sagnac interferometer Peter T Beyersdorf,
Compensating thermal lensing in Faraday rotators.
 Compensating thermal lensing in Faraday rotators. Donovan McFeron University of Florida. New Physics Building Corner of Museum and North South Drive Gainesville, FL 36 ( August 3, 000) ABSTRACT An analyzer
PHYS 3153 Methods of Experimental Physics II O2. Applications of Interferometry
 Purpose PHYS 3153 Methods of Experimental Physics II O2. Applications of Interferometry In this experiment, you will study the principles and applications of interferometry. Equipment and components PASCO
CHAPTER 5 FINE-TUNING OF AN ECDL WITH AN INTRACAVITY LIQUID CRYSTAL ELEMENT
 CHAPTER 5 FINE-TUNING OF AN ECDL WITH AN INTRACAVITY LIQUID CRYSTAL ELEMENT In this chapter, the experimental results for fine-tuning of the laser wavelength with an intracavity liquid crystal element
VIRGO. The status of VIRGO. & INFN - Sezione di Roma 1. 1 / 6/ 2004 Fulvio Ricci
 The status of VIRGO Fulvio Ricci Dipartimento di Fisica - Università di Roma La Sapienza & INFN - Sezione di Roma 1 The geometrical effect of Gravitational Waves The signal the metric tensor perturbation
Automation of Photoluminescence Measurements of Polaritons
 Automation of Photoluminescence Measurements of Polaritons Drake Austin 2011-04-26 Methods of automating experiments that involve the variation of laser power are discussed. In particular, the automation
arxiv: v1 [gr-qc] 10 Sep 2007
![arxiv: v1 [gr-qc] 10 Sep 2007](/thumbs/74/70185142.jpg "arxiv: v1 [gr-qc] 10 Sep 2007") LIGO P070067 A Z A novel concept for increasing the peak sensitivity of LIGO by detuning the arm cavities arxiv:0709.1488v1 [gr-qc] 10 Sep 2007 1. Introduction S. Hild 1 and A. Freise 2 1 Max-Planck-Institut
LIGO P070067 A Z A novel concept for increasing the peak sensitivity of LIGO by detuning the arm cavities arxiv:0709.1488v1 [gr-qc] 10 Sep 2007 1. Introduction S. Hild 1 and A. Freise 2 1 Max-Planck-Institut
OPAC 202 Optical Design and Instrumentation. Topic 3 Review Of Geometrical and Wave Optics. Department of
 OPAC 202 Optical Design and Instrumentation Topic 3 Review Of Geometrical and Wave Optics Department of http://www.gantep.edu.tr/~bingul/opac202 Optical & Acustical Engineering Gaziantep University Feb
Angular Drift of CrystalTech (1064nm, 80MHz) AOMs due to Thermal Transients. Alex Piggott
 AOMs due to Thermal Transients. Alex Piggott") Angular Drift of CrystalTech 38 197 (164nm, 8MHz) AOMs due to Thermal Transients Alex Piggott July 5, 21 1 .1 General Overview of Findings The AOM was found to exhibit significant thermal drift effects,
Angular Drift of CrystalTech 38 197 (164nm, 8MHz) AOMs due to Thermal Transients Alex Piggott July 5, 21 1 .1 General Overview of Findings The AOM was found to exhibit significant thermal drift effects,
Filter Cavity Experiment and Frequency Dependent Squeezing. MIT Tomoki Isogai
 Filter Cavity Experiment and Frequency Dependent Squeezing MIT Tomoki Isogai Outline What is squeezing? Squeezing so far Why do we need frequency dependent squeezing? Filter Cavity Experiment at MIT Frequency
The 34th International Physics Olympiad
 The 34th International Physics Olympiad Taipei, Taiwan Experimental Competition Wednesday, August 6, 2003 Time Available : 5 hours Please Read This First: 1. Use only the pen provided. 2. Use only the
Characteristics of point-focus Simultaneous Spatial and temporal Focusing (SSTF) as a two-photon excited fluorescence microscopy
 as a two-photon excited fluorescence microscopy") Characteristics of point-focus Simultaneous Spatial and temporal Focusing (SSTF) as a two-photon excited fluorescence microscopy Qiyuan Song (M2) and Aoi Nakamura (B4) Abstracts: We theoretically and experimentally
Characteristics of point-focus Simultaneous Spatial and temporal Focusing (SSTF) as a two-photon excited fluorescence microscopy Qiyuan Song (M2) and Aoi Nakamura (B4) Abstracts: We theoretically and experimentally
Doppler-Free Spetroscopy of Rubidium
 Doppler-Free Spetroscopy of Rubidium Pranjal Vachaspati, Sabrina Pasterski MIT Department of Physics (Dated: April 17, 2013) We present a technique for spectroscopy of rubidium that eliminates doppler
Polarization Experiments Using Jones Calculus
 Polarization Experiments Using Jones Calculus Reference http://chaos.swarthmore.edu/courses/physics50_2008/p50_optics/04_polariz_matrices.pdf Theory In Jones calculus, the polarization state of light is
Mechanical Characterization of a LISA Telescope Test Structure
 UNIVERSITY OF TRENTO Faculty of Mathematical, Physical and Natural Sciences Undergraduate school in Physics Mechanical Characterization of a LISA Telescope Test Structure Candidate Ilaria Pucher Advisors
Absolute distance interferometer in LaserTracer geometry
 Absolute distance interferometer in LaserTracer geometry Corresponding author: Karl Meiners-Hagen Abstract 1. Introduction 1 In this paper, a combination of variable synthetic and two-wavelength interferometry
Stability of a Fiber-Fed Heterodyne Interferometer
 Stability of a Fiber-Fed Heterodyne Interferometer Christoph Weichert, Jens Flügge, Paul Köchert, Rainer Köning, Physikalisch Technische Bundesanstalt, Braunschweig, Germany; Rainer Tutsch, Technische
Exposure schedule for multiplexing holograms in photopolymer films
 Exposure schedule for multiplexing holograms in photopolymer films Allen Pu, MEMBER SPIE Kevin Curtis,* MEMBER SPIE Demetri Psaltis, MEMBER SPIE California Institute of Technology 136-93 Caltech Pasadena,
Supplementary Figure 1. Effect of the spacer thickness on the resonance properties of the gold and silver metasurface layers.
 Supplementary Figure 1. Effect of the spacer thickness on the resonance properties of the gold and silver metasurface layers. Finite-difference time-domain calculations of the optical transmittance through
Experiment 1: Fraunhofer Diffraction of Light by a Single Slit
 Experiment 1: Fraunhofer Diffraction of Light by a Single Slit Purpose 1. To understand the theory of Fraunhofer diffraction of light at a single slit and at a circular aperture; 2. To learn how to measure
Laser stabilization and frequency modulation for trapped-ion experiments
 Laser stabilization and frequency modulation for trapped-ion experiments Michael Matter Supervisor: Florian Leupold Semester project at Trapped Ion Quantum Information group July 16, 2014 Abstract A laser
Investigation of Squeezed Light with an Injection Locked Laser
 Investigation of Squeezed Light with an Injection Locked Laser Thomas W. Noel REU program, College of William and Mary July 31, 2008 Abstract Quantum physics implies a certain unavoidable amount of noise
SECOND HARMONIC GENERATION AND Q-SWITCHING
 SECOND HARMONIC GENERATION AND Q-SWITCHING INTRODUCTION In this experiment, the following learning subjects will be worked out: 1) Characteristics of a semiconductor diode laser. 2) Optical pumping on
PH 481/581 Physical Optics Winter 2013
 PH 481/581 Physical Optics Winter 2013 Laboratory #1 Week of January 14 Read: Handout (Introduction & Projects #2 & 3 from Newport Project in Optics Workbook), pp. 150-170 of "Optics" by Hecht Do: 1. Experiment
9. Microwaves. 9.1 Introduction. Safety consideration
 MW 9. Microwaves 9.1 Introduction Electromagnetic waves with wavelengths of the order of 1 mm to 1 m, or equivalently, with frequencies from 0.3 GHz to 0.3 THz, are commonly known as microwaves, sometimes
PH 481/581 Physical Optics Winter 2014
 PH 481/581 Physical Optics Winter 2014 Laboratory #1 Week of January 13 Read: Handout (Introduction & Projects #2 & 3 from Newport Project in Optics Workbook), pp.150-170 of Optics by Hecht Do: 1. Experiment
Development of a Simulink Arm-Locking System Luis M. Colon Perez 1, James Ira Thorpe 2 and Guido Mueller 2
 Development of a Simulink Arm-Locking System Luis M. Colon Perez 1, James Ira Thorpe 2 and Guido Mueller 2 1 Department of Physics, University of Puerto Rico, Rio Piedras, Puerto Rico 00931 2 Department
AP Physics Problems -- Waves and Light
 AP Physics Problems -- Waves and Light 1. 1974-3 (Geometric Optics) An object 1.0 cm high is placed 4 cm away from a converging lens having a focal length of 3 cm. a. Sketch a principal ray diagram for
White Paper: Modifying Laser Beams No Way Around It, So Here s How
 White Paper: Modifying Laser Beams No Way Around It, So Here s How By John McCauley, Product Specialist, Ophir Photonics There are many applications for lasers in the world today with even more on the
Virgo status and commissioning results
 Virgo status and commissioning results L. Di Fiore for the Virgo Collaboration 5th LISA Symposium 13 july 2004 VIRGO is an French-Italian collaboration for Gravitational Wave research with a 3 km long
Physics 262. Lab #1: Lock-In Amplifier. John Yamrick
 Physics 262 Lab #1: Lock-In Amplifier John Yamrick Abstract This lab studied the workings of a photodiode and lock-in amplifier. The linearity and frequency response of the photodiode were examined. Introduction
The Florida control scheme. Guido Mueller, Tom Delker, David Reitze, D. B. Tanner
 The Florida control scheme Guido Mueller, Tom Delker, David Reitze, D. B. Tanner Department of Physics, University of Florida, Gainesville 32611-8440, Florida, USA The most likely conguration for the second
IV Assembly and Automation of the SPR Spectrometer
 IV Assembly and Automation of the SPR Spectrometer This chapter is dedicated to the description of the experimental set-up and the procedure used to perform SPR measurements. We start with a schematic
Ph 3455 The Photoelectric Effect
 Ph 3455 The Photoelectric Effect Required background reading Tipler, Llewellyn, section 3-3 Prelab Questions 1. In this experiment you will be using a mercury lamp as the source of photons. At the yellow
visibility values: 1) V1=0.5 2) V2=0.9 3) V3=0.99 b) In the three cases considered, what are the values of FSR (Free Spectral Range) and
 V1=0.5 2) V2=0.9 3) V3=0.99 b) In the three cases considered, what are the values of FSR (Free Spectral Range) and") EXERCISES OF OPTICAL MEASUREMENTS BY ENRICO RANDONE AND CESARE SVELTO EXERCISE 1 A CW laser radiation (λ=2.1 µm) is delivered to a Fabry-Pérot interferometer made of 2 identical plane and parallel mirrors
EXERCISES OF OPTICAL MEASUREMENTS BY ENRICO RANDONE AND CESARE SVELTO EXERCISE 1 A CW laser radiation (λ=2.1 µm) is delivered to a Fabry-Pérot interferometer made of 2 identical plane and parallel mirrors
880 Quantum Electronics Optional Lab Construct A Pulsed Dye Laser
 880 Quantum Electronics Optional Lab Construct A Pulsed Dye Laser The goal of this lab is to give you experience aligning a laser and getting it to lase more-or-less from scratch. There is no write-up
Experiment 19. Microwave Optics 1
 Experiment 19 Microwave Optics 1 1. Introduction Optical phenomena may be studied at microwave frequencies. Using a three centimeter microwave wavelength transforms the scale of the experiment. Microns
Interferometric OSEM Sensor Development
 LASER INTERFEROMETER GRAVITATIONAL WAVE OBSERVATORY LIGO Laboratory / LIGO Scientific Collaboration Advanced LIGO UK March 004 Interferometric OSEM Sensor Development Clive Speake, Stuart Aston (The University
PHYS2090 OPTICAL PHYSICS Laboratory Microwaves
 PHYS2090 OPTICAL PHYSICS Laboratory Microwaves Reference Hecht, Optics, (Addison-Wesley) 1. Introduction Interference and diffraction are commonly observed in the optical regime. As wave-particle duality
Designing Optical Layouts for AEI s 10 meter Prototype. Stephanie Wiele August 5, 2008
 Designing Optical Layouts for AEI s 10 meter Prototype Stephanie Wiele August 5, 2008 This summer I worked at the Albert Einstein Institute for Gravitational Physics as a member of the 10 meter prototype
Quantum States of Light and Giants
 Quantum States of Light and Giants MIT Corbitt, Bodiya, Innerhofer, Ottaway, Smith, Wipf Caltech Bork, Heefner, Sigg, Whitcomb AEI Chen, Ebhardt-Mueller, Rehbein QEM-2, December 2006 Ponderomotive predominance
SHOCK AND VIBRATION RESPONSE SPECTRA COURSE Unit 4. Random Vibration Characteristics. By Tom Irvine
 SHOCK AND VIBRATION RESPONSE SPECTRA COURSE Unit 4. Random Vibration Characteristics By Tom Irvine Introduction Random Forcing Function and Response Consider a turbulent airflow passing over an aircraft
Future X-ray and GW Measurements of NS M and R. Cole Miller University of Maryland and Joint Space-Science Institute
 Future X-ray and GW Measurements of NS M and R Cole Miller University of Maryland and Joint Space-Science Institute 1 Outline A recap Estimates from energy-dependent X-ray waveforms NICER and LOFT-P What
Using a Negative Impedance Converter to Dampen Motion in Test Masses
 Using a Negative Impedance Converter to Dampen Motion in Test Masses Isabella Molina, Dr.Harald Lueck, Dr.Sean Leavey, and Dr.Vaishali Adya University of Florida Department of Physics Max Planck Institute
ADVANCED VIRGO at the DAWN WORKSHOP
 Giovanni Losurdo Advanced Virgo Project Leader for the Virgo Collaboration and EGO ADVANCED VIRGO at the DAWN WORKSHOP DAWN Workshop, May 8, 2015 G Losurdo - AdV Project Leader 1 ADVANCED VIRGO! Participated
Experimental Competition
 37 th International Physics Olympiad Singapore 8 17 July 2006 Experimental Competition Wed 12 July 2006 Experimental Competition Page 2 List of apparatus and materials Label Component Quantity Label Component
Broadband Photodetector
 LASER INTERFEROMETER GRAVITATIONAL WAVE OBSERVATORY LIGO Laboratory / LIGO Scientific Collaboration LIGO-D1002969-v7 LIGO April 24, 2011 Broadband Photodetector Matthew Evans Distribution of this document:
Exercise 4. Angle Tracking Techniques EXERCISE OBJECTIVE
 Exercise 4 Angle Tracking Techniques EXERCISE OBJECTIVE When you have completed this exercise, you will be familiar with the principles of the following angle tracking techniques: lobe switching, conical
A gravitational wave is a differential strain in spacetime. Equivalently, it is a differential tidal force that can be sensed by multiple test masses.
 A gravitational wave is a differential strain in spacetime. Equivalently, it is a differential tidal force that can be sensed by multiple test masses. Plus-polarization Cross-polarization 2 Any system
Coherent Laser Measurement and Control Beam Diagnostics
 Coherent Laser Measurement and Control M 2 Propagation Analyzer Measurement and display of CW laser divergence, M 2 (or k) and astigmatism sizes 0.2 mm to 25 mm Wavelengths from 220 nm to 15 µm Determination
Week IX: INTERFEROMETER EXPERIMENTS
 Week IX: INTERFEROMETER EXPERIMENTS Notes on Adjusting the Michelson Interference Caution: Do not touch the mirrors or beam splitters they are front surface and difficult to clean without damaging them.
Laser Locking with Doppler-free Saturated Absorption Spectroscopy
 Laser Locking with Doppler-free Saturated Absorption Spectroscopy Paul L. Stubbs, Advisor: Irina Novikova W&M Quantum Optics Group May 12, 2010 Abstract The goal of this project was to lock the frequency
Lab 12 Microwave Optics.
 b Lab 12 Microwave Optics. CAUTION: The output power of the microwave transmitter is well below standard safety levels. Nevertheless, do not look directly into the microwave horn at close range when the
Wave Front Detection for Virgo
 Wave Front Detection for Virgo L.L.Richardson University of Arizona, Steward Observatory, 933 N. Cherry ave, Tucson Arizona 8575, USA E-mail: zimlance@email.arizona.edu Abstract. The use of phase cameras
6 Experiment II: Law of Reflection
 Lab 6: Microwaves 3 Suggested Reading Refer to the relevant chapters, 1 Introduction Refer to Appendix D for photos of the apparatus This lab allows you to test the laws of reflection, refraction and diffraction
Real-Time Scanning Goniometric Radiometer for Rapid Characterization of Laser Diodes and VCSELs
 Real-Time Scanning Goniometric Radiometer for Rapid Characterization of Laser Diodes and VCSELs Jeffrey L. Guttman, John M. Fleischer, and Allen M. Cary Photon, Inc. 6860 Santa Teresa Blvd., San Jose,
Optical lever for KAGRA
 Optical lever for KAGRA Kazuhiro Agatsuma 2014/May/16 2014/May/16 GW monthly seminar at Tokyo 1 Contents Optical lever (OpLev) development for KAGRA What is the optical lever? Review of OpLev in TAMA-SAS
LIGO-P R. High-Power Fundamental Mode Single-Frequency Laser
 LIGO-P040053-00-R High-Power Fundamental Mode Single-Frequency Laser Maik Frede, Ralf Wilhelm, Dietmar Kracht, Carsten Fallnich Laser Zentrum Hannover, Hollerithallee 8, 30419 Hannover, Germany Phone:+49
The VIRGO detection system
 LIGO-G050017-00-R Paolo La Penna European Gravitational Observatory INPUT R =35 R=0.9 curv =35 0m 95 MOD CLEAN ER (14m )) WI N d:yag plar=0 ne.8 =1λ 064nm 3km 20W 6m 66.4m M odulat or PR BS N I sing lefrequ
How to Build a Gravitational Wave Detector. Sean Leavey
 How to Build a Gravitational Wave Detector Sean Leavey Supervisors: Dr Stefan Hild and Prof Ken Strain Institute for Gravitational Research, University of Glasgow 6th May 2015 Gravitational Wave Interferometry
The VIRGO injection system
 INSTITUTE OF PHYSICSPUBLISHING Class. Quantum Grav. 19 (2002) 1829 1833 CLASSICAL ANDQUANTUM GRAVITY PII: S0264-9381(02)29349-1 The VIRGO injection system F Bondu, A Brillet, F Cleva, H Heitmann, M Loupias,
R. J. Jones Optical Sciences OPTI 511L Fall 2017
 R. J. Jones Optical Sciences OPTI 511L Fall 2017 Semiconductor Lasers (2 weeks) Semiconductor (diode) lasers are by far the most widely used lasers today. Their small size and properties of the light output
5 Advanced Virgo: interferometer configuration
 5 Advanced Virgo: interferometer configuration 5.1 Introduction This section describes the optical parameters and configuration of the AdV interferometer. The optical layout and the main parameters of
LISA and SMART2 Optical Work in Europe
 LISA and SMART2 Optical Work in Europe David Robertson University of Glasgow Outline Overview of current optical system work Title Funded by Main focus Prime Phase Measuring System LISA SMART2 SEA (Bristol)
The VIRGO suspensions
 INSTITUTE OF PHYSICSPUBLISHING Class. Quantum Grav. 19 (2002) 1623 1629 CLASSICAL ANDQUANTUM GRAVITY PII: S0264-9381(02)30082-0 The VIRGO suspensions The VIRGO Collaboration (presented by S Braccini) INFN,
A Multiwavelength Interferometer for Geodetic Lengths
 A Multiwavelength Interferometer for Geodetic Lengths K. Meiners-Hagen, P. Köchert, A. Abou-Zeid, Physikalisch-Technische Bundesanstalt, Braunschweig Abstract: Within the EURAMET joint research project
Physics 4C Chabot College Scott Hildreth
 Physics 4C Chabot College Scott Hildreth The Inverse Square Law for Light Intensity vs. Distance Using Microwaves Experiment Goals: Experimentally test the inverse square law for light using Microwaves.
Chapter 21. Alternating Current Circuits and Electromagnetic Waves
 Chapter 21 Alternating Current Circuits and Electromagnetic Waves AC Circuit An AC circuit consists of a combination of circuit elements and an AC generator or source The output of an AC generator is sinusoidal
Characterization of an Electro-Optical Modulator for Next Linear Collider. Photocathode Research
 SLAC-TN-04-062 September 2004 Characterization of an Electro-Optical Modulator for Next Linear Collider Photocathode Research Matthew Kirchner Office of Science, Student Undergraduate Laboratory Internship
A Method of Directly Measuring the Speed of Light Using Different Optical Path Lengths
 WJP X, XXXX.XX Wabash (20XX) Journal of Physics 1 A Method of Directly Measuring the Speed of Light Using Different Optical Path Lengths Thomas F. Pizarek, Adam L. Fritsch, and Samuel R. Krutz Department
Ultrashort Pulse Measurement Using High Sensitivity Two Photon Absorption Waveguide Semiconductor
 Ultrashort Pulse Measurement Using High Sensitivity Two Photon Absorption Wguide Semiconductor MOHAMMAD MEHDI KARKHANEHCHI Department of Electronics, Faculty of Engineering Razi University Taghbostan,
Exercise 1-4. The Radar Equation EXERCISE OBJECTIVE DISCUSSION OUTLINE DISCUSSION OF FUNDAMENTALS
 Exercise 1-4 The Radar Equation EXERCISE OBJECTIVE When you have completed this exercise, you will be familiar with the different parameters in the radar equation, and with the interaction between these
Absorption: in an OF, the loss of Optical power, resulting from conversion of that power into heat.
 Absorption: in an OF, the loss of Optical power, resulting from conversion of that power into heat. Scattering: The changes in direction of light confined within an OF, occurring due to imperfection in
Single Slit Diffraction
 PC1142 Physics II Single Slit Diffraction 1 Objectives Investigate the single-slit diffraction pattern produced by monochromatic laser light. Determine the wavelength of the laser light from measurements
Far field intensity distributions of an OMEGA laser beam were measured with
 Experimental Investigation of the Far Field on OMEGA with an Annular Apertured Near Field Uyen Tran Advisor: Sean P. Regan Laboratory for Laser Energetics Summer High School Research Program 200 1 Abstract
ADVANCED OPTICS LAB -ECEN 5606
 ADVANCED OPTICS LAB -ECEN 5606 Basic Skills Lab Dr. Steve Cundiff and Edward McKenna, 1/15/04 rev KW 1/15/06, 1/8/10 The goal of this lab is to provide you with practice of some of the basic skills needed