MRI Anatomy and Positioning Series Module 12: Fat Suppression Techniques
|
|
|
- Marjory Rice
- 6 years ago
- Views:
Transcription


1 MRI Anatomy and Positioning Series Module 12: Fat Suppression Techniques 1
2 Introduction... 3 RF FatSat... 4 HOAST... 4 FatSat... 5 Segment FS... 8 PhaseCycle... 9 Water Excitation STIR FatSep Gradient Echo FatSep Single Echo Multi Echo Fast Spin Echo FatSep Single Echo Multi Echo Conclusion Appendix A: References for Fat Suppression Techniques Module Appendix B: References for Pictures for Fat Suppression Techniques Module
3 Introduction Signal from fat can play a critical role in determining the useful contrast of MR images in many situations. Being able to control the signal developed by fatty tissue is a powerful and perhaps underrated method available in our scan library. Fat tissues have a short T1 relaxation time (when longitudinal recovery is occurring), and appear as hypersignal in T1-weighted sequences. The T2 relaxation time of fat is also relatively short (when transverse decay is occurring), but fat still appears as a relatively high signal intensity in T2-weighted sequences with multiple echoes, such as FSE (Fast Spin Echo). Fat can be helpful in the display of anatomy and pathology. In T2-weighted FSE images of the lumbar spine, bright fat outlines the exiting nerve roots in a manner normally associated with T1-weighted images, while the high signal from CSF (CerebroSpinal Fluid) provides high contrast to display the intra-thecal nerve roots clearly. However, the high signal intensity of fat can hide enhancement after a Gadolinium contrast injection in T1-weighted sequences, or an edematous hypersignal in fatty organs in T2-weighted sequences. It may be difficult to distinguish fat from other tissues with high T1 and T2 signal intensities, such as blood degradation products in a hematoma. Fat is responsible for chemical shift artifacts, and is also clearly visible in motion artifacts. There are many situations in clinical MRI where it is desirable to remove the fat contribution from the total MR signal, without affecting the water signal- in other words, fat suppression. Fat suppression techniques can be used to enhance tissue contrast and lesion conspicuity, to determine if the tissue of interest has high or low lipid content, and to remove artifacts. Specific examples include suppression of the marrow signal from around joints and in vertebrae, and the suppression of the fat signal in the orbits to better differentiate tissues of interest (cartilage and ligaments, bone metastases, optic nerve, etc.) from surrounding fatty tissue. Fat suppression techniques can definitely add a useful extra dimension to the manipulation of image contrast. There are two basic families of techniques that are used to reduce or even suppress the signal from fat tissue: Those based on the particular T1 of fat; the T1 values for fat are much shorter than those of water; STIR sequences are based on the T1 of fat Those based on chemical shift, which is the difference in hydrogen resonance frequency in fat molecules compared to hydrogen resonance frequency in water and other soft tissues; hydrogen protons in water resonate slightly faster than those in fat; spectral or RF fat saturation, fat separation (Dixon technique), and selective excitation of water are based on chemical shift Each of the fat suppression methods to be discussed in this seminar comes with pros and cons. Selection of a specific method depends on the field strength used for scanning, the field-of-view size, whether regional or global fat suppression is required, whether an increase in scan time is acceptable, etc. The choice of technique may not be motivated by the absolute quality of fat suppression, but more importantly by the contrast between tissues. Additional challenges include field homogeneity, metal susceptibility, scan time increase, and reduction of SNR (Signal to Noise Ratio). 3

4 RF FatSat RF (Radio Frequency) FatSat (Fat Saturation) techniques take advantage of the difference in resonant frequencies between fat and water. This difference increases with increasing magnetic field strength through a scaling factor called the chemical shift. Chemical shift occurs because the electron clouds surrounding hydrogen nuclei behave differently in fat and water. In triglyceride molecules of fat, the electron clouds are evenly shared, and they serve to shield the hydrogen nuclei from the external magnetic field. The stronger the shielding fields are, the more they can reduce the magnetic field that the hydrogen nuclei experience, so the nuclei will precess at a lower Larmor frequency. In water molecules, the electron-negative oxygen atom steals the electrons from the hydrogen nuclei, leaving them de-shielded. The hydrogen nuclei in water experience a higher magnetic field than the hydrogen in fat, and precess at a higher Larmor frequency. Since fat and water are precessing at different Larmor frequencies, a frequency selective RF pulse can be applied that will only affect the magnetization of the fat protons. RF fat saturation methods available on Hitachi s Oasis and Echelon Oval MR systems include FatSat, Phase Cycle, Segment FatSat, and Water Excitation (Figure 1). The RF FatSat methods that are available will vary based on the pulse sequence and additional parameters that have been selected. Parameters available in the Saturation section will also vary with the type of Saturation that is selected, or may default to a specific selection. Figure 1 Saturation parameters available with RF FatSat HOAST HOAST (Higher Order Active Shim Technology) provides uniform RF FatSat, outstanding large FOV (Field Of View) capabilities, and excellent off-isocenter imaging. In a uniform, or homogeneous, magnetic field, fat and water peaks have a constant frequency separation. Without HOAST, the patient s body makes the magnetic field non-uniform, which makes fat saturation inconsistent. With HOAST, the effect of the patient s body is reduced, promoting consistent fat saturation, even across large FOV s. Higher order active shimming adjusts for each patient, which maximizes image quality. Use of Hitachi s Regional Shim parameter produces excellent off-isocenter fat suppression, enabling high uniformity on FatSat images for anatomy that must be scanned out of isocenter. 4


5 FatSat Routine FatSat involves the application of a 90 RF pulse that is tuned to the resonant frequency of fat. This pulse is integrated into the pulse sequence, and occurs prior to the excitation pulse for the MR pulse sequence. The FatSat pulse causes the magnetic vector of fat to be flipped into the transverse plane. The RF excitation pulse that is applied when the MR sequence begins will flip the fat-based nuclei further, so they are now below the transverse plane. With no component of transverse magnetization, the fat nuclei do not produce a signal. When FatSat is selected as the type of Saturation, additional parameters available for selection include: Wave Provides options for the waveform of the FatSat pulse; each of the waveforms maintains a minimum TR, which limits the number of slices available. Oasis system choices are Sinc, H-Sinc Light, and H-Sinc Heavy; OVAL system choices are Sinc, H-Sinc, H-Sinc Light, H-Sinc Heavy. H-Sinc Light suppresses lipids, while H-Sinc Heavy suppresses lipids, as well as fatty protons that precess at the same frequency as water. Duration Sets the time (in milliseconds) for the FatSat pulse to be active. This value determines the frequency bandwidth for the patient signal that is suppressed by the FatSat pulse. Time and frequency bandwidth are inversely related, so a shorter time results in a wider frequency bandwidth, while a longer time results in a narrower frequency bandwidth. RF amp. % Sets the strength (RF amplitude) of the FatSat pulse. If this value is changed, the suppression effects of the fat signals will change; 100% of the initial value is the optimal strength calculated from the Wave and Duration parameters. Off. Freq [Hz] Displays the offset frequency, or frequency difference, between the fat peak and the water peak. This value is field strength dependent, and should not be changed. It should be set at -173Hz for the Oasis system, and -224Hz for the Echelon Oval system. This parameter field does not appear when the Freq. graph field is set to Auto or ON (Figures 2-4). Freq. graph Setting determines whether or not a Frequency Graph is displayed in the Frequency Prescan window. If set to off, the Frequency Graph does not display, but the Off Freq. parameter field will display. If set to Auto, the Frequency Graph displays when the Off. Freq. is determined in the Exam window during the acquisition. If set to ON, the Frequency Graph is displayed. Figure 2 Offset Frequency displays when Frequency Graph is turned off Figure 3 Frequency Graph set to Auto 5
.")
6 Figure 4 Frequency Graph set to ON Frequency graph results are displayed in the Frequency Prescan window when any type of saturation has been selected in the Saturation parameter field, and the Freq. graph selection is set to ON, or Auto, under select conditions (with FatSat on Oasis, with FatSat or Segment FatSat on Echelon Oval). The Frequency Prescan window opens after the Prescan is performed (Figure 5). The settings displayed for the frequency graph include: Frequency (MHz) Displays the central frequency Offset Frequency (Hz) Displays the FatSat pulse s frequency, as a value relative to the central frequency; set at -173 for Oasis, and -224 for OVAL; this setting is changed if something other than fat is to be suppressed (e.g. silicone or saline) Noise Threshold (%) Used only in conjunction with the Weighted selection for Search Mode (Hitachi recommends using the Peak method for Search Mode) Search Mode Select search method for frequency values, either Peak or Weighted method; Hitachi recommends the Peak method, where center frequency is set at the signal s maximum frequency value Reset Param Resets the above parameters to their initial settings Items displayed on the frequency graph include: Vertical axis Signal value Horizontal axis Frequency (MHz) Green vertical line Offset frequency (fat peak) Blue vertical line Center frequency (water peak) 6

.")
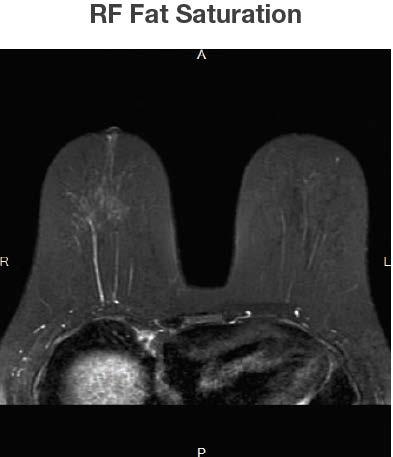
7 The blue vertical line should be positioned so that it is centered at the base of the water peak, splitting the base into two equal parts. The water peak is the peak on the right. It is acceptable if the blue line does not go through the exact point of the water peak. The green vertical line will move in conjunction with movement of the blue vertical line, in order to maintain the proper offset frequency between fat and water. Blue vertical line centered at base of water peak Figure 5 Frequency Graph display FatSat can be applied to virtually any sequence with any weighting (Figure 6). It can be used for fat suppression after Gadolinium injections, and will not modify the contrast of other tissues. Using FatSat adds another RF pulse, so TR and acquisition time will increase, and SAR will increase as well. FatSat does require a homogeneous magnetic field, so shimming should be performed prior to its use. Figure 6 FatSat results in breast imaging 7
. The actual shift in Hertz depends on the field strength of the magnet being used.")
 is only -45Hz. The occurrence of chemical shift is responsible for the chemical shift artifact that occurs during frequency encoding.")
8 FatSat is easier to accomplish at higher field strengths vs. lower field strengths, as the frequency difference between the two resonances increases with field strength. Protons in fat and water molecules are separated by a chemical shift of approximately 3.5 ppm (parts per million). The actual shift in Hertz depends on the field strength of the magnet being used. Hitachi s Oasis magnet (1.2T) has an offset frequency between fat and water of -173Hz (Hertz), while the Echelon Oval (1.5T) has an offset frequency of -224Hz. The offset frequency on the AIRIS Elite (0.3T) is only -45Hz. The occurrence of chemical shift is responsible for the chemical shift artifact that occurs during frequency encoding. The difference in resonant frequency between water and fat protons at the same location can be mislocated by the Fourier transformation when the MRI signals are converted from the frequency domain to the spatial domain. The chemical shift artifact causes accentuation of any fat-water interfaces along the frequency axis, and may be mistaken for pathology. It is visualized as a bright or dark band at the edge of the anatomy where fat and water are in the same location (e.g. kidneys and orbits). Although chemical shift artifacts increase at higher field strengths, the use of FatSat (and other fat suppression techniques) can eliminate these artifacts, as they are suppressing or eliminating the fat signal. Segment FS When Segment FS (Segmented FatSat) is selected, the FatSat pulses are applied in numerous segments or sections, in order to maintain uniform fat suppression throughout a dynamic scan. Segment FS is only available when RSSG is selected as the Sequence parameter, and the 2D/3D selection is 3D. If TIGRE is selected in the Mode parameter field under RSSG, the Saturation parameter field will default to Segment FS. The 3D RSSG sequence in TIGRE mode with Segment FS is the basis of Hitachi s TIGRE sequence. The Saturation parameters explained above (Wave, Duration, RF amp, and Off. Freq), as well as the frequency graph, are all available with Segment FS (Figure 7). H-Sinc is recommended as the setting for the Wave parameter field when the TIGRE sequence is used, as it provides more consistent fat saturation with TIGRE. Segment FS also incorporates the Segment # parameter, found in the Seq. Parameter area. This setting has been optimized in Oasis and Echelon Oval protocols, and should not be adjusted. If the Segment # is increased, scan time is decreased, but the effects of the fat suppression are also reduced. Figure 7 Segment FS selected as Saturation parameter; additional parameter Segment# also utilized 8
.")
9 Segment FS is primarily used in conjunction with the TIGRE (T1 GRadient Echo) sequence, which is a fast 3D T1-weighted spoiled gradient echo with fat suppression. TIGRE is used for dynamic studies of the breast, liver, prostate, and kidneys. The use of Segment FS helps to provide uniform fat suppression throughout these dynamic studies (Figures 8-9). Figure 8 Images from TIGRE sequence in abdomen; arterial image on left, venous image on right Figure 9 Images from TIGRE sequence in abdomen; 90 second delay image on left, 3 minute delay image on right PhaseCycle When PhaseCycle fat saturation is used, scanning is performed multiple times, and fat signals are selectively suppressed. When fat and water based nuclei are within the same voxel, the differences in their precessional frequencies will cause the MR signals from each to move in- and out-of-phase with each other. This constructive and destructive interference causes the signal level to vary in strength cyclically after the excitation pulse. The frequency of this variation is equal to the chemical shift, so it varies with field strength. This phase cycling effect is also the basis for FatSep, or the Dixon method. In-phase and out-of-phase images can be selected by choosing an appropriate TE (Time to Echo). Images obtained when the fat and water vectors are in-phase will have similar contrast to Spin Echo images. Images obtained when fat and water vectors are out-of-phase will display a chemical how Phase Cycle fat saturation misregistration artifact, or India ink artifact, at borders of fatty and water based tissue. This artifact appears as a dark outline of organs, and occurs when voxels contain equal amounts of fat and water spins, causing a complete cancellation of signal. If there are not equal amounts of fat and 9
10 water spins in the voxels, varying degrees of signal loss will occur, compared to the in-phase image. However, this varying signal loss can be used to identify fatty infiltration of the liver, and tumor infiltration of marrow spaces. T2* decay causes a rapid decrease in magnetization, so it is important for image quality to use the earliest possible TE for out-of-phase imaging. At 1.5T, this TE time is 2.2msec, so partial echo techniques may be used to implement this short TE. Although some SNR may be sacrificed, that loss is preferable to waiting for the next out-of-phase period and incurring T2* decay. Use of PhaseCycle fat saturation requires that the Multi scan mode parameter be set to Fluoro or Dynamic, and the Sequence must be a BASG. Again, the Saturation parameters explained above (Wave, Duration, RF amp, and Off.Freq), as well as the frequency graph, are all available with PhaseCycle. In addition, there is a Quasi TimeRes field that can be set to off or ON. Time resolution may be improved if this parameter is set to ON, and data is shared. PhaseCycle fat saturation can be used as a method to characterize tissues based on differences in water and fat resonance frequencies. This method may be used in abdominal imaging to characterize certain diseases, such as adrenal adenomas and hepatic steatosis. As mentioned above, it can also be used to identify fatty infiltration of the liver, and tumor infiltration of marrow spaces. Water Excitation The water excitation technique uses a short series of RF pulses to selectively excite only water protons, leaving the fat spins unaffected. This series of RF pulses are called binomial pulses, which are correctly phased broadband RF pulses that selectively excite water by exploiting the phase cycling effect. Their net effect is to produce a 90 pulse for the water spins, and a 0 pulse for the fat spins. Although these binomial pulses may be slightly longer in duration than normal excitation pulses, they are a quick way to achieve fat suppression. Binomial pulses are a class of composite pulses with flip angles that follow the pattern of coefficients of the binomial expansion of (a + b) n. Binomial excitation methods are described numerically, with the number referring to the relative amplitude of the pulse. The total of the flip angles of the pulses will add up to 90. A 1:1 pulse would be a pair of pulses, each with 45 flip angles, shown as (45-45 ). A 1:2:1 pulse would be a ( ) triplet. A 1:3:3:1 pulse would be a ( ) quadruplet. Any combination whose ratios follow the binomial pattern and add up to 90 will work to selectively excite water and leave the fat resonance unchanged. For further understanding, below is an explanation of how two appropriately timed broadband nonselective 45 pulses (1:1) result in selective excitation of the water signal only (Figure 10): At equilibrium, the magnetization vectors of water and fat both point along the z-axis in the direction of the main magnetic field (B 0) The first 45 pulse causes both vectors to be tipped partially toward the transverse plane and begin to precess; since fat and water protons precess at different frequencies, after a few msec the fat and water vectors will be exactly 180 out of phase; the time it takes for fat and water to get 180 out of phase is used as the inter-pulse delay time 10

, and 2D/3D BASG (BAlanced SARGE). The Saturation parameters explained above (Duration, RF amp, and Off.")
11 After the inter-pulse delay time, a second non-selective 45 pulse will rotate the fat vector back to its original position along the z-axis, while rotating the water vector entirely into the transverse plane The combination of the two non-selective 45 pulses had the same effect as a single frequency-selective 90 water excitation pulse Figure 10 1:1 water excitation pulses Water excitation as a fat saturation method can be used with specific sequences on the Oasis and Echelon Oval MR systems, namely 2D SE (Spin Echo), 2D/3D GE (Gradient Echo), 2D/3D RSSG (RF Spoiled SARGE), 2D/3D TOF (Time Of Flight), and 2D/3D BASG (BAlanced SARGE). The Saturation parameters explained above (Duration, RF amp, and Off.Freq), as well as the frequency graph, are all available with Water Excitation. The Wave parameter field displays the groups of composite pulses that are available (Figure 11). Figure 11 Water excitation wave parameter choices 11

12 As the number of waveforms, or RF pulses, increases, the effect of water excitation is increased. However, the minimum TR and TE are restricted because of the increased duration of the RF pulse. A triplet or higher binomial chain may slightly prolong the water excitation sequence. Water excitation pulses are less sensitive than most other techniques to non-uniformities in RF pulse transmission, including variations in flip angle. The nulling of fat is primarily controlled by precise timing of the interpulse delays that allow water and fat to go out of phase. Even if the flip angles are not perfect, and water is not exactly at 90, the total flip angle for the fat spins will still be 0. Water excitation is somewhat sensitive to B 0 magnetic field inhomogeneities. Water excitation has been found to be valuable in musculoskeletal imaging for excellent depiction of cartilage in all extremities (Figure 12). Additional reported uses include 3D applications in the breast and liver. Figure 12 Water excitation image STIR STIR is an acronym for Short TI Inversion Recovery or Short Tau Inversion Recovery. STIR works as a fat suppression method by exploiting the difference in T1 relaxation times between fat and water, not their chemical shift. The value of the inversion time, TI, is selected so that the fat signal does not contribute to the resulting image. The TI value depends on field strength, since the T1 of fat increases with field strength. Using a flip angle of 180, the total signal (fat and water) is initially inverted, and allowed to relax back to equilibrium via T1 relaxation. As the spins relax back to their equilibrium configuration, the signal for each spin group evolves from a negative signal, through zero (the null point), to a positive signal, at a rate that is determined by the T1 of the spin group. Since fat has such a short T1 time, the null point for fat signal typically occurs much sooner than for other tissues. If the MR sequence is started when the fat signal is at its null point, the fat spins will not contribute to the resulting image. Tissues with a T1 time that is different from fat will have a signal, as they have either not yet reached their null point, or have recovered past it. 12

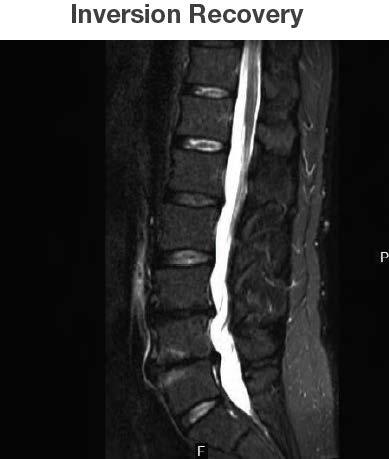
13 Fat suppressed images resulting from STIR sequences will be inherently T1-weighted. However, the T1 contrast will be inverted relative to conventional T1-weighting. Tissues with a short T1 will appear dark, while tissues with a long T1 will be bright. The signal from tissues with a T1 time close to the T1 time of fat will also be substantially suppressed when STIR fat suppression is used, leaving STIR images with an intrinsically lower SNR. STIR, as well as other short and medium TI sequences, has an additional useful feature termed additive T1 + T2 contrast. In routine Spin Echo imaging, lesions with prolonged T1 and T2 have competitive effects on signal intensity, namely that increased T1 reduces signal, while increased T2 increases signal. In STIR imaging, the effects of increased T1 and increased T2 are additive (Figure 13). This occurs because the longitudinal magnetization of long T1 lesions remains inverted on STIR, and produces a high signal. Additive T1 and T2 effects allow for better visualization of MS plaques on a STIR image as opposed to a Spin Echo image. Figure 13 Additive T1 and T2 effects; MS plaque seen better on STIR image on right vs. Spin Echo image on left STIR is a widely used method of fat suppression, as it is available at all field strengths. It is often the preferred method of fat suppression in situations where RF FatSat techniques may not be ideal (e.g. large fields-of-view, lower field strengths, areas of high magnetic susceptibility). STIR is not sensitive to magnetic field homogeneities, and offers uniform fat suppression, even when imaging away from isocenter. It is often the only fat suppression method available for lower field strength magnets ( 0.3T). The most important limitation when using STIR for fat suppression is that it cannot be used postgadolinium to demonstrate contrast. Signal suppression achieved with STIR is not specific to fat. Any material that has a short T1 time will be nulled, including melanin, methemoglobin, mucus, proteinaceous material, etc., so overall SNR is decreased. 13

14 FatSep The principle behind FatSep (Fat Separation) is based on the Dixon technique, which was proposed in Dixon suggested use of a chemical shift imaging method based on the in-phase/out-of-phase cycling of fat and water to create fat only and water only images. Water only images are therefore fat suppressed. Water and fat protons have slightly different resonance frequencies, so their spins go in- and out-ofphase with each other as a function of time. The period of this phase cycling is 1/ f, where f is the frequency offset between the spins. At 1.5T, the phase cycling period totals 4.4ms, while at 1.2T, it is 5.8ms. In-phase and out-of-phase conditions occur twice per cycle, or approximately every 2.2ms at 1.5T, and every 2.9ms at 1.2T. Out-of-phase times at 1.5T (Echelon Oval) are 2.2, 6.6, and 11.0ms, and in-phase times are 4.4, 8.8, and 13.2ms. Out-of-phase times at 1.2T (Oasis) are 2.9, 8.7, and 11.6ms, with in-phase times of 5.8, 11.6, and 17.4ms. If the in- and out-of-phase images are added, the result is a water-only image, which is fat suppressed. If the in- and out-of-phase images are subtracted, the result is a fat-only image, which is water suppressed (Figure 14). This sequence type can deliver up to four contrasts in one measurement out-of-phase, in-phase, water, and fat images (Figures 15-16). Figure 14 When added, fat vectors cancel out, resulting in water-only image (fat suppressed); when subtracted, fat-only image remains (water suppressed) Figure 15 Oasis In-Phase image on left, Out-of-Phase image on right 14

15 Figure 16 Oasis Water image (fat suppressed) on left, Fat image (water suppressed) on right In- and out-of-phase images can be obtained from separate acquisitions, or as different echoes of the same acquisition. The number of points referred to with the Dixon technique (typically 2-point or 3- point) indicates the number of image sets that will be acquired at different TE values within the same acquisition. Early applications of the Dixon technique (in the 1980 s) were not always successful, as the 2-point method required assumptions of perfect B 0 homogeneity, with no significant local susceptibility effects. Modifications were proposed during the 1990 s, but it wasn t until the early 2000 s that the Dixon technique experienced a resurgence. Modern magnet designs, improved shimming techniques, better algorithms, and faster Dixon methods have increased its popularity. FatSep has been found to be a robust fat suppression technique, and can be used throughout the body. Scanning with the Dixon technique is a standard part of most abdominal imaging protocols. Out-ofphase imaging offers the benefit of a dark border between fatty and non-fatty tissues in the abdomen. Abdominal lesions whose signal intensity decreases on out-of-phase images are more likely to contain microscopic fat, which helps to differentiate adrenal adenomas (which usually contain fat) from carcinomas and metastases ( which do not contain fat). FatSep can be helpful in the diagnosis of a variety of abdominal lesions, including angiomyolipomas, clear cell renal cell carcinoma, and focal fatty infiltration of the liver. When combined with Gradient Echo (GE) sequences, the Dixon technique is beneficial for liver imaging, as four image types can be acquired with one breath-hold. The Dixon technique combined with Fast Spin Echo (FSE) sequences offers excellent fat suppression with high resolution, which is beneficial for extremity scans. FatSep also offers effective fat suppression near metallic implants and metallic prostheses, which is not the case with other fat suppression methods. FatSep has the advantage of offering four image sets, each with different contrast. FatSep is effective in areas of high magnetic susceptibility, where other fat suppression techniques may fail, as it is less sensitive than FatSat to B 0 and B 1 inhomogeneities. FatSep scan times are comparable to scan times of other fat suppression techniques. Larger FOV scans benefit from more uniform fat suppression when FatSep is used. 15
.")
16 The Hitachi Oasis and Echelon Oval systems offer a variety of sequences that incorporate FatSep, including Gradient Echo and Fast Spin Echo sequences with single echo and/or multi echo capabilities. (A variety of FatSep sequences are available on the AIRIS family of MR systems, as well as the Altaire MR system). The chart below provides a reference guide as to the types of FatSep sequences offered on the Oasis and Echelon Oval systems, including differentiation between single echo and multi echo, use of 2- point or 3-point Dixon method, and use with 2D and/or 3D acquisitions (Figure 17). FatSep Sequences GE Single Echo RSSG Single Echo RSSG Multi Echo Oasis N/A N/A 2D or 3D, 2-pt. Dixon Echelon Oval 2D or 3D, 2-pt. 2D or 3D, 2-pt. 2D or 3D, 2-pt. Dixon Dixon Dixon Figure 17 FatSep sequences for Oasis and Echelon Oval systems FSE Single Echo FSE Multi Echo 2D, 2-pt. Dixon 2D, 3-pt. Dixon 2D, 2-pt. Dixon 2D, 3-pt. Dixon The Hitachi Oasis and Echelon Oval systems also offer a selectable FatSep Strength parameter, which is used to determine the fat suppression strength in the water image. This parameter is available in the Saturation parameters section (Figure 18). The choices listed under FatSep Strength are Light, Medium, or Heavy, which indicate the degree of suppression of the fat signal. This setting can be adjusted to the Radiologist s preference, depending on the extent of fat suppression desired in the water images. Figure 18 FatSep Strength parameter Gradient Echo FatSep FatSep sequences are available as both single echo and multi echo, with combinations of GE and RSSG sequences available on the Hitachi Oasis and/or Echelon Oval MR systems. Although scan time is increased, it can be compensated for by the increased flexibility offered with other parameters, as well as the addition of RAPID. 16

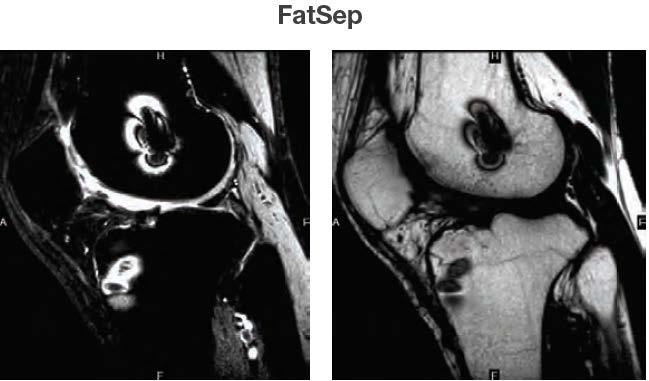
17 Single Echo Single echo GE and RSSG FatSep sequences are available on the Echelon OVAL. These sequences measure the out-of-phase echo after the first RF excitation, and the in-phase echo after the second RF excitation. Both of these sequences use the 2-point Dixon technique, and both can be used with 2D or 3D acquisitions. Both the single echo GE and RSSG FatSep sequences allow for the use of smaller FOV with high resolution, and more parameter flexibility. The single echo RSSG FatSep sequence offers a variable TE, and more flexibility for FOV and bandwidth parameters. When the single echo RSSG FatSep sequence is used with 3D acquisitions, it is recommended that the 3D Acq. Mode field be set to Circular, in order to reduce scan time and improve SNR. Both the single echo GE and RSSG sequences are used with orthopedic and spine scanning, with the GE resulting in T2*- weighted images, and the RSSG resulting in T1-weighted images (Figure 19). Figure 19 Single Echo GE T2* FatSep images on left; Single Echo RSSG FatSep images on right; both sets of images display out-of-phase image on top left, in-phase image on top right, water image (fat suppressed) on bottom left, and fat image (water suppressed) on bottom right 17

18 Multi Echo The Multi Echo GE FatSep sequence is the RSSG sequence, which is available on both the Oasis and Echelon Oval systems. This sequence can be a 2D or 3D acquisition, and uses the 2-point Dixon technique to produce fat suppressed images. The TE parameter is set at an intermediate value that is in between the first echo (out-of-phase) and the second echo (in-phase). The Oasis system has a fixed TE time of 4.4ms, which falls between the out-of-phase time of 2.9ms and the in-phase time of 5.8ms. On the Echelon Oval, the TE field displays settings that are at fixed intervals between the out-of-phase and in-phase times on this system (e.g., TE of 3.4ms., which is between the initial out-of-phase time of 2.2ms. and in-phase time of 4.4ms.; TE of 7.8ms., which is between the out-of-phase time of 6.6ms. and the in-phase time of 8.8ms., etc.), up to a maximum TE setting of 79.5ms. When the multi echo RSSG FatSep sequence is used with 3D acquisitions, it is recommended that the 3D Acq. Mode field be set to Circular, in order to reduce scan time and improve SNR. The Multi Echo RSSG FatSep sequence does have some FOV and bandwidth restrictions. This sequence is recommended for abdominal scanning, as the shorter scan times mean shorter breath holds for patients (Figure 20). It is also suggested for use with orbit, pituitary, and enterography scans. Figure 20 Multi Echo RSSG FatSep images; out-of-phase image on top left, in-phase image on top right, water (fat suppressed) image on bottom left, fat (water suppressed) image on bottom right Fast Spin Echo FatSep FatSep FSE sequences are available as both single echo with 2-pt. Dixon, and multi echo with 3-pt. Dixon. They are available on both the Oasis and the Echelon Oval MR systems, and can be used with 2D acquisitions only. 18
,")
19 Single Echo When performing the Single Echo FSE FatSep sequence, each echo is acquired in between each of the 180 refocusing pulses. As an example, if we used an Echo Factor of 3, the first, second, and third echoes, (acquired after the first, second and third refocusing pulses associated with the initial 90 excitation pulse), will all contribute to the out-of-phase image. After the second 90 excitation pulse, the first, second, and third echoes (acquired after the first, second, and third refocusing pulses associated with the second 90 excitation pulse), will all contribute to the in-phase image. The Inter Echo Time parameter can be decreased to achieve a lower TE by increasing the Bandwidth. The E. Factor (Echo Factor) and Echo Alloc. (Echo Allocation) parameters can be set to achieve the desired tissue weighting, so these sequences can be used for T1-weighted scans, short TE proton density- weighted scans, as well as T2-weighted scans. Although scan time is increased on Single Echo FSE FatSep sequences, it can be compensated for with the increased flexibility offered with other parameters, including the addition of RAPID. These sequences also have fewer restrictions on bandwidth and FOV, as well as the advantage of reductions in metal susceptibility and flow artifacts. They are often used for brain and spine scanning, as well as for arthrograms in orthopedic scanning (Figure 21). Figure 21 Single Echo FSE FatSep images; out-of-phase image on top left, in-phase image on top right, water image (fat suppressed) on bottom left, fat image (water suppressed) on bottom right 19

20 Multi Echo The Multi Echo FSE FatSep sequence acquires multiple echoes after each 180 pulse, and uses the 3- point Dixon technique. With the 3-point Dixon technique, image results include an out-of-phase, an inphase, and a second out-of-phase image. The multiple echoes from each echo train have different phase encodes, and will contribute to different out-of-phase and in-phase images. Using the example of an echo factor of three, the three echoes produced after the first 180 refocusing pulse will be placed in the first out-of-phase, the first in-phase, and the second out-of-phase images, respectively. The three echoes produced after the second 180 refocusing pulse will be placed in the first out-of-phase, the first in-phase, and the second out-of-phase images, respectively, and so on. The IET (Inter Echo Time) is set at a default value, which is 17ms. on the Oasis, and 15ms. on the Echelon Oval. The TE parameter is calculated by the system, based on the Echo Factor and Echo Allocation parameters. Due to their higher TE values, these sequences should only be used for T2-weighted imaging. Multi Echo FSE FatSep sequences offer increased SNR with a decrease in scan time, but have more bandwidth and FOV restrictions. When used for abdominal scanning, Multi Echo FSE FatSep sequences allow for shorter breath hold times for patients, as opposed to Single Echo FSE FatSep. These sequences can also be used for orthopedic cases where metal is involved, as there is considerably less artifact from metal on FatSep images compared to routine FatSat images (Figure 22). Figure 22 Echelon Oval Multi Echo FSE FatSep with 3-point Dixon technique, which results in additional out-of-phase image; 3-point Dixon technique also reduces the effects of field inhomogeneities and metal artifact susceptibility Conclusion This concludes the Fat Suppression Techniques module. You must complete the post-test for this activity with a score of 75% or better in order to receive Continuing Education credits. 20
21 Appendix A: References for Fat Suppression Techniques Module Brown, Greg. (n.d.) Fat Suppression Techniques. Retrieved from Cameron, Ian, PhD. (n.d.). Techniques of Fat Suppression. Retrieved from Elster, Allen D., M.D. (n.d.) Dixon Method. Retrieved from Elster, Allen D., M.D. (n.d.). CHESS/Fat-Sat Pulses. Retrieved from Elster, Allen D., M.D. (n.d.). Fat Suppression Methods. Retrieved from Elster, Allen D., M.D. (n.d.). Fat v Water. Retrieved from Elster, Allen D., M.D. (n.d.). Fat/Water Chemical Shift. Retrieved from Elster, Allen D., M.D. (n.d.). In-Phase v Out-of-Phase. Retrieved from Elster, Allen D., M.D. (n.d.). Short TI Inversion Recovery. Retrieved from Elster, Allen D., M.D. (n.d.). Water Excitation Pulses. Retrieved from Higgins, Dave. (12February2010). Revising MRI- Fat Suppression. Retrieved from Hoa, Denis. (n.d.). Fat signal suppression by short TI inversion-recovery (STIR). Retrieved from Hoa, Denis. (n.d.). Imaging water and fat. Retrieved from Courses/e-MRI/Improving-MRI-contrast-Imaging-water-and-fat/fat-signal-suppression Hoa, Denis. (n.d.). Improving MRI contrast: Imaging water and fat. Retrieved from Hoa, Denis. (n.d.). MRI Fat Saturation (Fat Sat, CHESS, SPIR, SPECIAL). Retrieved from Magnetic Resonance- Technology Information Portal. (n.d.). Fat Suppression. Retrieved from 21
22 Appendix B: References for Pictures for Fat Suppression Techniques Module Figures 1-9 Hitachi Healthcare Americas Figure 10 Figures 11, 12 Hitachi Healthcare Americas Figure 13 Figure 14 Hitachi Medical Corporation Figures Hitachi Healthcare Americas 22
Pulse Sequence Design and Image Procedures
 Pulse Sequence Design and Image Procedures 1 Gregory L. Wheeler, BSRT(R)(MR) MRI Consultant 2 A pulse sequence is a timing diagram designed with a series of RF pulses, gradients switching, and signal readout
Pulse Sequence Design Made Easier
 Pulse Sequence Design Made Easier Gregory L. Wheeler, BSRT(R)(MR) MRI Consultant gurumri@gmail.com 1 2 Pulse Sequences generally have the following characteristics: An RF line characterizing RF Pulse applications
H 2 O and fat imaging
 H 2 O and fat imaging Xu Feng Outline Introduction benefit from the separation of water and fat imaging Chemical Shift definition of chemical shift origin of chemical shift equations of chemical shift
MR Advance Techniques. Flow Phenomena. Class II
 MR Advance Techniques Flow Phenomena Class II Flow Phenomena In this class we will explore different phenomenona produced from nuclei that move during the acquisition of data. Flowing nuclei exhibit different
MRI Metal Artifact Reduction
 MRI Metal Artifact Reduction PD Dr. med. Reto Sutter University Hospital Balgrist Zurich University of Zurich OUTLINE Is this Patient suitable for MR Imaging? Metal artifact reduction Is this Patient suitable
Background (~EE369B)
") Background (~EE369B) Magnetic Resonance Imaging D. Nishimura Overview of NMR Hardware Image formation and k-space Excitation k-space Signals and contrast Signal-to-Noise Ratio (SNR) Pulse Sequences 13
Background (~EE369B) Magnetic Resonance Imaging D. Nishimura Overview of NMR Hardware Image formation and k-space Excitation k-space Signals and contrast Signal-to-Noise Ratio (SNR) Pulse Sequences 13
MR Basics: Module 8 Image Quality
 Module 8 Transcript For educational and institutional use. This transcript is licensed for noncommercial, educational inhouse or online educational course use only in educational and corporate institutions.
Principles of MRI EE225E / BIO265. Lecture 21. Instructor: Miki Lustig UC Berkeley, EECS. M. Lustig, EECS UC Berkeley
 Principles of MRI Lecture 21 EE225E / BIO265 Instructor: Miki Lustig UC Berkeley, EECS Question What is the difference between the images? Answer Both T1-weighted spin-echo gradient-echo Lower SNR Meniscus
Advanced MSK MRI Protocols at 3.0T. Garry E. Gold, M.D. Associate Professor Department of Radiology Stanford University
 Advanced MSK MRI Protocols at 3.0T Garry E. Gold, M.D. Associate Professor Department of Radiology Stanford University Outline Why High Field for MSK? SNR and Relaxation Times Technical Issues Example
Cardiac MR. Dr John Ridgway. Leeds Teaching Hospitals NHS Trust, UK
 Cardiac MR Dr John Ridgway Leeds Teaching Hospitals NHS Trust, UK Cardiac MR Physics for clinicians: Part I Journal of Cardiovascular Magnetic Resonance 2010, 12:71 http://jcmr-online.com/content/12/1/71
HETERONUCLEAR IMAGING. Topics to be Discussed:
 HETERONUCLEAR IMAGING BioE-594 Advanced MRI By:- Rajitha Mullapudi 04/06/2006 Topics to be Discussed: What is heteronuclear imaging. Comparing the hardware of MRI and heteronuclear imaging. Clinical applications
Gradient Spoiling. Average balanced SSFP magnetization Reduce sensitivity to off-resonance. FFE, FISP, GRASS, GRE, FAST, Field Echo
 Gradient Spoiling Average balanced SSFP magnetization Reduce sensitivity to off-resonance FFE, FISP, GRASS, GRE, FAST, Field Echo 1 Gradient-Spoiled Sequence (GRE, FFE, FISP, GRASS) RF TR G z G y G x Signal
1 Introduction. 2 The basic principles of NMR
 1 Introduction Since 1977 when the first clinical MRI scanner was patented nuclear magnetic resonance imaging is increasingly being used for medical diagnosis and in scientific research and application
(N)MR Imaging. Lab Course Script. FMP PhD Autumn School. Location: C81, MRI Lab B0.03 (basement) Instructor: Leif Schröder. Date: November 3rd, 2010
MR Imaging. Lab Course Script. FMP PhD Autumn School. Location: C81, MRI Lab B0.03 (basement) Instructor: Leif Schröder. Date: November 3rd, 2010") (N)MR Imaging Lab Course Script FMP PhD Autumn School Location: C81, MRI Lab B0.03 (basement) Instructor: Leif Schröder Date: November 3rd, 2010 1 Purpose: Understanding the basic principles of MR imaging
(N)MR Imaging Lab Course Script FMP PhD Autumn School Location: C81, MRI Lab B0.03 (basement) Instructor: Leif Schröder Date: November 3rd, 2010 1 Purpose: Understanding the basic principles of MR imaging
MR Basics: Module 6 Pulse Sequences
 Module 6 Transcript For educational and institutional use. This transcript is licensed for noncommercial, educational inhouse or online educational course use only in educational and corporate institutions.
MR in RTP. MR Data for Treatment Planning: Spatial Accuracy Issues, Protocol Optimization, and Applications (Preview of TG117 Report) Acknowledgements
 Acknowledgements") MR Data for Treatment Planning: Issues, Protocol Optimization, and s (Preview of TG117 Report) Debra H. Brinkmann Mayo Clinic, Rochester MN Acknowledgements TG-117 Use of MRI Data in Treatment Planning
MR Data for Treatment Planning: Issues, Protocol Optimization, and s (Preview of TG117 Report) Debra H. Brinkmann Mayo Clinic, Rochester MN Acknowledgements TG-117 Use of MRI Data in Treatment Planning
MRI Summer Course Lab 2: Gradient Echo T1 & T2* Curves
 MRI Summer Course Lab 2: Gradient Echo T1 & T2* Curves Experiment 1 Goal: Examine the effect caused by changing flip angle on image contrast in a simple gradient echo sequence and derive T1-curves. Image
SIGNA Explorer Lift revives our MR
 Seiji Shiotani, MD, PhD Seirei Fuji Hospital in Fuji City, Shizuoka, Japan Masayoshi Sugimura Seirei Fuji Hospital in Fuji City, Shizuoka, Japan SIGN Explorer Lift revives our MR The clinical usefulness
2014 M.S. Cohen all rights reserved
 2014 M.S. Cohen all rights reserved mscohen@g.ucla.edu IMAGE QUALITY / ARTIFACTS SYRINGOMYELIA Source http://gait.aidi.udel.edu/res695/homepage/pd_ortho/educate/clincase/syrsco.htm Surgery is usually recommended
Module 2. Artefacts and Imaging Optimisation for single shot methods. Content: Introduction. Phase error. Phase bandwidth. Chemical shift review
 MRES 7005 - Fast Imaging Techniques Module 2 Artefacts and Imaging Optimisation for single shot methods Content: Introduction Phase error Phase bandwidth Chemical shift review Chemical shift in pixels
Pulse Sequences: Rapid Gradient Echo
 Pulse Sequences: Rapid Gradient Echo M229 Advanced Topics in MRI Holden H. Wu, Ph.D. 2018.04.17 Department of Radiological Sciences David Geffen School of Medicine at UCLA Class Business Office hours -
The Enlightened Choice for High-field MRI
 The Enlightened Choice for High-field MRI ECHELON heralds the dawn of a new standard for 1.5T superconductive MRI. The ECHELON features a small footprint with economics that do not compromise diagnostic
Image Quality/Artifacts Frequency (MHz)
") The Larmor Relation 84 Image Quality/Artifacts (MHz) 42 ω = γ X B = 2πf 84 0.0 1.0 2.0 Magnetic Field (Tesla) 1 A 1D Image Magnetic Field Gradients Magnet Field Strength Field Strength / Gradient Coil
The Larmor Relation 84 Image Quality/Artifacts (MHz) 42 ω = γ X B = 2πf 84 0.0 1.0 2.0 Magnetic Field (Tesla) 1 A 1D Image Magnetic Field Gradients Magnet Field Strength Field Strength / Gradient Coil
MRI SYSTEM COMPONENTS Module One
 MRI SYSTEM COMPONENTS Module One 1 MAIN COMPONENTS Magnet Gradient Coils RF Coils Host Computer / Electronic Support System Operator Console and Display Systems 2 3 4 5 Magnet Components 6 The magnet The
10. Phase Cycling and Pulsed Field Gradients Introduction to Phase Cycling - Quadrature images
 10. Phase Cycling and Pulsed Field Gradients 10.1 Introduction to Phase Cycling - Quadrature images The selection of coherence transfer pathways (CTP) by phase cycling or PFGs is the tool that allows the
MARP. MR Accreditation Program Quality Control Beyond Just the Scans and Measurements July 2005
 ACR MRI accreditation program MR Accreditation Program Quality Control Beyond Just the Scans and Measurements July 2005 Carl R. Keener, Ph.D., DABMP, DABR keener@marpinc.com MARP Medical & Radiation Physics,
MR in Tx Planning. Acknowledgements. Outline. Overview MR in RTP
 MR Data for Treatment Planning and Stereotactic Procedures: Sources of Distortion, Protocol Optimization, and Assessment (Preview of TG117 Report) Debra H. Brinkmann Mayo Clinic, Rochester MN Acknowledgements
Magnetic Resonance Imaging Principles, Methods, and Techniques
 Magnetic Resonance Imaging Principles, Methods, and Techniques Perry Sprawls Jr., Emory University Publisher: Medical Physics Publishing Corporation Publication Place: Madison, Wisconsin Publication Date:
Magnetic Resonance Imaging
 Magnetic Resonance Imaging Principles, Methods, and Techniques Perry Sprawls, Ph.D., FACR, FAAPM, FIOMP Distinguished Emeritus Professor Department of Radiology Emory University Atlanta, Georgia Medical
2015 Spin echoes and projection imaging
 1. Spin Echoes 1.1 Find f0, transmit amplitudes, and shim settings In order to acquire spin echoes, we first need to find the appropriate scanner settings using the FID GUI. This was all done last week,
MRI at a Glance. Catherine Westbrook. Blackwell Science
 MRI at a Glance Catherine Westbrook Blackwell Science MRI at a Glance MRI at a Glance CATHERINE WESTBROOK MSC DCRR CTC Director of Training and Education Lodestone Patient Care Ltd Blackwell Science 2002
Chapter 2. The Physics of Magnetic Resonance Imaging
 Chapter 2. The Physics of Magnetic Resonance Imaging 2.1. Introduction The origins of the Nuclear Magnetic Resonance (NMR) signal and how it is manipulated to form images are the subjects of this chapter.
SIEMENS MAGNETOM Skyra syngo MR D13
 Page 1 of 12 SIEMENS MAGNETOM Skyra syngo MR D13 \\USER\CIND\StudyProtocols\PTSA\*ep2d_M0Map_p2_TE15 TA:7.9 s PAT:2 Voxel size:2.5 2.5 3.0 mm Rel. SNR:1.00 :epfid Properties Routine Contrast Prio Recon
Compact yet Sophisticated
 Compact yet Sophisticated Hitachi has brought Open MRI one step further in its evolution, to better assist medical professionals who work at the forefront of healthcare. AIRIS Light MSK offers radiologists
High Field MRI: Technology, Applications, Safety, and Limitations
 High Field MRI: Technology, Applications, Safety, and Limitations R. Jason Stafford, Ph.D. The University of Texas M. D. Anderson Cancer Center, Houston, TX Introduction The amount of available signal
NMR Basics. Lecture 2
 NMR Basics Lecture 2 Continuous wave (CW) vs. FT NMR There are two ways of tuning a piano: - key by key and recording each sound (or frequency). - or, kind of brutal, is to hit with a sledgehammer and
M R I Physics Course. Jerry Allison Ph.D., Chris Wright B.S., Tom Lavin B.S., Nathan Yanasak Ph.D. Department of Radiology Medical College of Georgia
 M R I Physics Course Jerry Allison Ph.D., Chris Wright B.S., Tom Lavin B.S., Nathan Yanasak Ph.D. Department of Radiology Medical College of Georgia M R I Physics Course Magnetic Resonance Imaging Spatial
RAD 229: MRI Signals and Sequences
 RAD 229: MRI Signals and Sequences Brian Hargreaves All notes are on the course website web.stanford.edu/class/rad229 Course Goals Develop Intuition Understand MRI signals Exposure to numerous MRI sequences
In a typical biological sample the concentration of the solute is 1 mm or less. In many situations,
 Water suppression n a typical biological sample the concentration of the solute is 1 mm or less. n many situations, the signals of interest are those of amide protons that exchange with the solvent water.
MAGNETIC RESONANCE IMAGING
 CSEE 4620 Homework 3 Fall 2018 MAGNETIC RESONANCE IMAGING 1. THE PRIMARY MAGNET Magnetic resonance imaging requires a very strong static magnetic field to align the nuclei. Modern MRI scanners require
Noninvasive Blood Flow Mapping with Arterial Spin Labeling (ASL) Paul Kyu Han and Sung-Hong Park
 Paul Kyu Han and Sung-Hong Park") Noninvasive Blood Flow Mapping with Arterial Spin Labeling (ASL) Paul Kyu Han and Sung-Hong Park Department of Bio and Brain Engineering, Korea Advanced Institute of Science and Technology (KAIST), Daejeon,
Noninvasive Blood Flow Mapping with Arterial Spin Labeling (ASL) Paul Kyu Han and Sung-Hong Park Department of Bio and Brain Engineering, Korea Advanced Institute of Science and Technology (KAIST), Daejeon,
SECTION I - CHAPTER 2 DIGITAL IMAGING PROCESSING CONCEPTS
 RADT 3463 - COMPUTERIZED IMAGING Section I: Chapter 2 RADT 3463 Computerized Imaging 1 SECTION I - CHAPTER 2 DIGITAL IMAGING PROCESSING CONCEPTS RADT 3463 COMPUTERIZED IMAGING Section I: Chapter 2 RADT
RF pulse design and the Small Tip Angle Approximation
 RF pulse design and the Small Tip Angle Approximation Dr Shaihan J Malik Lecturer in Imaging Sciences Division of Imaging Sciences & Biomedical Engineering King s College London shaihan.malik@kcl.ac.uk
Architecture of Quality Imaging Mary K. Henne, MS, CNMT, RDMS, RVT Ultrasound Education Specialist GE Healthcare
 Architecture of Quality Imaging Mary K. Henne, MS, CNMT, RDMS, RVT Ultrasound Education Specialist GE Healthcare 2 DOC1292532 Architecture of Quality Imaging Agile Acoustic Architecture E-Series and XDclear
Lab 8 6.S02 Spring 2013 MRI Projection Imaging
 1. Spin Echos 1.1 Find f0, TX amplitudes, and shim settings In order to acquire spin echos, we first need to find the appropriate scanner settings using the FID GUI. This was all done last week, but these
BOLD fmri: signal source, data acquisition, and interpretation
 BOLD fmri: signal source, data acquisition, and interpretation Cheryl Olman 4 th year student, Department of Neuroscience and Center for Magnetic Resonance Research Discussion series Week 1: Biological
functional MRI: A primer
 Activation Leads to: functional MRI: A primer CBF Increased +ΔR CBV Increased +ΔR (C+) O Utilization Increased slightly? Venous [O ] Increased -ΔR* Glucose Utilization Increased? Lactate BOLD R=/T R=/T
MRI imaging in neuroscience Dr. Thom Oostendorp Lab class: 2 hrs
 MRI imaging in neuroscience Dr. Thom Oostendorp Lab class: 2 hrs 1 Introduction In tomographic imaging techniques, such as MRI, a certain tissue property within a slice is imaged. For each voxel (volume
Index COPYRIGHTED MATERIAL. Note: Page number followed by italics are for figures and bold are for tables, respectively.
 Note: Page number followed by italics are for figures and bold are for tables, respectively. abdominal imaging aliasing along the phase axis of abdomen, 256 entry-slice phenomenon (ESP) in, 283, 283 5
NIH Public Access Author Manuscript Magn Reson Med. Author manuscript; available in PMC 2010 July 21.
 NIH Public Access Author Manuscript Published in final edited form as: Magn Reson Med. 2010 April ; 63(4): 1092 1097. doi:10.1002/mrm.22223. Spatially Varying Fat-Water Excitation Using Short 2DRF Pulses
Your first NMR measurement
 Your first NMR measurement Introduction Select 10mM water in D2O as NMR sample. The NMR spectrum of such sample consists of only two signals: the water signal and the peak of the reference (TSP). Follow
TimTX TrueShape. The parallel transmit architecture of the future. Answers for life.
 www.siemens.com/trueshape TimTX TrueShape The parallel transmit architecture of the future. The product/feature (mentioned herein) is not commercially available. Due to regulatory reasons its future availability
FAST AND CONTRAST-ENHANCED PHASE-SENSITIVE MAGNETIC RESONANCE IMAGING
 FAST AND CONTRAST-ENHANCED PHASE-SENSITIVE MAGNETIC RESONANCE IMAGING A Dissertation by JONG BUM SON Submitted to the Office of Graduate Studies of Texas A&M University in partial fulfillment of the requirements
MRI MRI REGISTRY REVIEW PHYSICAL PRINCIPLES OF IMAGE FORMATION ARTIFACTS SUPERCONDUCTIVE MAGNET ANAIBI MOLINA(R) (RT) (MR) (CT) T2 DEPHASING
 (RT) (MR) (CT) T2 DEPHASING") MRI ANAIBI MOLINA(R) (RT) (MR) (CT) T2 DEPHASING SUPERCONDUCTIVE MAGNET FREE INDUCTION DECAY ARTIFACTS MRI REGISTRY REVIEW PHYSICAL PRINCIPLES OF IMAGE FORMATION Mri Registry Review Physical Principles
MRI ANAIBI MOLINA(R) (RT) (MR) (CT) T2 DEPHASING SUPERCONDUCTIVE MAGNET FREE INDUCTION DECAY ARTIFACTS MRI REGISTRY REVIEW PHYSICAL PRINCIPLES OF IMAGE FORMATION Mri Registry Review Physical Principles
12/21/2016. Siemens Medical Systems Research Agreement Philips Healthcare Research Agreement AAN and ASN Committees
 Joseph V. Fritz, PhD Nandor Pintor, MD Dent Neurologic Institute ASN 2017 Friday, January 20, 2017 Siemens Medical Systems Research Agreement Philips Healthcare Research Agreement AAN and ASN Committees
GE Healthcare. Discovery MR T. Simply powerful. Powerfully simple.
 GE Healthcare Discovery MR750 3.0T Simply powerful. Powerfully simple. Break free. The breast images you need in only two sequences. A complete liver study in a 15-minute time slot. Routine fmri with shorter
Liver imaging beyond expectations with Ingenia
 Publication for the Philips MRI Community Issue 47 2012/3 Liver imaging beyond expectations with Ingenia Contributed by John Penatzer, RT, MR clinical product specialist, Cleveland, OH, USA Publication
IR/SR TrueFISP. Works-in-Progress package Version 1.2. For the SIEMENS Magnetom. Installation and User s Guide NUMARIS/4VA21B.
 Works-in-Progress package Version 1.2 For the Installation and User s Guide NUMARIS/4VA21B January 22, 2003 Section of Medical Physics, University Hospital Freiburg, Germany Contact: Klaus Scheffler PhD
Simultaneous Multi-Slice (Slice Accelerated) Diffusion EPI
 Diffusion EPI") Simultaneous Multi-Slice (Slice Accelerated) Diffusion EPI Val M. Runge, MD Institute for Diagnostic and Interventional Radiology Clinics for Neuroradiology and Nuclear Medicine University Hospital Zurich
Simultaneous Multi-Slice (Slice Accelerated) Diffusion EPI Val M. Runge, MD Institute for Diagnostic and Interventional Radiology Clinics for Neuroradiology and Nuclear Medicine University Hospital Zurich
Medical Imaging. X-rays, CT/CAT scans, Ultrasound, Magnetic Resonance Imaging
 Medical Imaging X-rays, CT/CAT scans, Ultrasound, Magnetic Resonance Imaging From: Physics for the IB Diploma Coursebook 6th Edition by Tsokos, Hoeben and Headlee And Higher Level Physics 2 nd Edition
Multi-channel SQUID-based Ultra-Low Field Magnetic Resonance Imaging in Unshielded Environment
 Multi-channel SQUID-based Ultra-Low Field Magnetic Resonance Imaging in Unshielded Environment Andrei Matlashov, Per Magnelind, Shaun Newman, Henrik Sandin, Algis Urbaitis, Petr Volegov, Michelle Espy
A. SPECIFIC AIMS: phase graph (EPG) algorithms to cover a wide range of MRI
 algorithms to cover a wide range of MRI") A. SPECIFIC AIMS: A.. Overview: The promise of improved MRI results at high field strength is compromised by the difficulties encountered at high field, including: i) Non-uniform excitation, due to the
A. SPECIFIC AIMS: A.. Overview: The promise of improved MRI results at high field strength is compromised by the difficulties encountered at high field, including: i) Non-uniform excitation, due to the
Siemens AG, Healthcare Sector. syngo MR D Operator Manual - Breast 0.0.
 Siemens AG, Healthcare Sector Cs2 syngo Breast Operator 2010-2012 MR-05019 630 02 English 06/2012 n.a. Informatik, Manual D13 Cape syngo MR D13 Operator Manual - Breast syngo MR D13 www.siemens.com/healthcare
6.S02 MRI Lab Acquire MR signals. 2.1 Free Induction decay (FID)
") 6.S02 MRI Lab 1 2. Acquire MR signals Connecting to the scanner Connect to VMware on the Lab Macs. Download and extract the following zip file in the MRI Lab dropbox folder: https://www.dropbox.com/s/ga8ga4a0sxwe62e/mit_download.zip
6.S02 MRI Lab 1 2. Acquire MR signals Connecting to the scanner Connect to VMware on the Lab Macs. Download and extract the following zip file in the MRI Lab dropbox folder: https://www.dropbox.com/s/ga8ga4a0sxwe62e/mit_download.zip
1D Transient NOE on the Bruker DRX-500 and DRX-600
 1D Transient NOE on the Bruker DRX-500 and DRX-600 Reference: Stott, K., Stonehouse, J., Keeler, T.L. and Shaka, A.J., J. Amer. Chem. Soc. 1995, 117 (14), pp. 4199-4200. At thermal equilibrium in a strong
The Script of ZST + Presentation. MIS Upstream Marketing Team [ 日期 ]
![The Script of ZST + Presentation. MIS Upstream Marketing Team [ 日期 ]](/thumbs/94/119182132.jpg "The Script of ZST + Presentation. MIS Upstream Marketing Team [ 日期 ]") 1 The Script of ZST + Presentation MIS Upstream Marketing Team [ 日期 ] 1 The Script of ZST + Presentation Since Mindray was founded to develop ultrasound business, core technology has always been the engine
1 The Script of ZST + Presentation MIS Upstream Marketing Team [ 日期 ] 1 The Script of ZST + Presentation Since Mindray was founded to develop ultrasound business, core technology has always been the engine
Radionuclide Imaging MII Single Photon Emission Computed Tomography (SPECT)
") Radionuclide Imaging MII 3073 Single Photon Emission Computed Tomography (SPECT) Single Photon Emission Computed Tomography (SPECT) The successful application of computer algorithms to x-ray imaging in
Radionuclide Imaging MII 3073 Single Photon Emission Computed Tomography (SPECT) Single Photon Emission Computed Tomography (SPECT) The successful application of computer algorithms to x-ray imaging in
Applications Guide. Spectral Editing with SVS. (Works-in-Progress) MAGNETOM TaTs and Verio Systems (3T)
 MAGNETOM TaTs and Verio Systems (3T)") Applications Guide Spectral Editing with SVS (Works-in-Progress) MAGNETOM TaTs and Verio Systems (3T) syngo MR Numaris 4 VB17A June 2009 Version 1.1 WIP #529 Important Note This document provides a description
Applications Guide Spectral Editing with SVS (Works-in-Progress) MAGNETOM TaTs and Verio Systems (3T) syngo MR Numaris 4 VB17A June 2009 Version 1.1 WIP #529 Important Note This document provides a description
Ultrasound Bioinstrumentation. Topic 2 (lecture 3) Beamforming
 Beamforming") Ultrasound Bioinstrumentation Topic 2 (lecture 3) Beamforming Angular Spectrum 2D Fourier transform of aperture Angular spectrum Propagation of Angular Spectrum Propagation as a Linear Spatial Filter Free
Ultrasound Bioinstrumentation Topic 2 (lecture 3) Beamforming Angular Spectrum 2D Fourier transform of aperture Angular spectrum Propagation of Angular Spectrum Propagation as a Linear Spatial Filter Free
Delivering Better Patient Care with SIGNA Architect
 Delivering etter Patient Care with SIGNA Architect As a regional leader in outpatient-based diagnostic imaging, the radiologists and staff at Inova Fairfax MRI Center are focused on one thing: the patient.
PHY3902 PHY3904. Nuclear magnetic resonance Laboratory Protocol
 PHY3902 PHY3904 Nuclear magnetic resonance Laboratory Protocol PHY3902 PHY3904 Nuclear magnetic resonance Laboratory Protocol GETTING STARTED You might be tempted now to put a sample in the probe and try
Page 1 of 9. Protocol: adult_other_adni3_study_human_ge_3t_25w_ _ _1. 3 Plane Localizer. 3 Plane Localizer PATIENT POSITION
 3 Localizer FOV 26.0 Slice Thickness 5.0 Slice Spacing 0.0 Freq 256 Phase 128 3-PLANE 3 Localizer Unswap Phase Correction Gradient Echo Imaging Options Seq, Fast Recon All Images Contrast Yes/ 3 Localizer
NEMA Standards Publication MS (R2014) Determination of Signal-to-Noise Ratio (SNR) in Diagnostic Magnetic Resonance Imaging
 Determination of Signal-to-Noise Ratio (SNR) in Diagnostic Magnetic Resonance Imaging") NEMA Standards Publication MS 1-2008 (R2014) Determination of Signal-to-Noise Ratio (SNR) in Diagnostic Magnetic Resonance Imaging Published by: National Electrical Manufacturers Association 1300 North
NEMA Standards Publication MS 1-2008 (R2014) Determination of Signal-to-Noise Ratio (SNR) in Diagnostic Magnetic Resonance Imaging Published by: National Electrical Manufacturers Association 1300 North
Half-Pulse Excitation Pulse Design and the Artifact Evaluation
 Half-Pulse Excitation Pulse Design and the Artifact Evaluation Phillip Cho. INRODUCION A conventional excitation scheme consists of a slice-selective RF excitation followed by a gradient-refocusing interval
MRI Systems and Coil Technology
 MRI for Technologists MRI Systems and Coil Technology PROGRAM INFORMATION MRI for Technologists is a training program designed to meet the needs of radiologic technologists entering or working in the field
Works-in-Progress package Version 1.0. For the SIEMENS Magnetom. Installation and User s Guide NUMARIS/4VA21B. January 22, 2003
 Works-in-Progress package Version 1.0 For the Installation and User s Guide NUMARIS/4VA21B January 22, 2003 Section of Medical Physics, University Hospital Freiburg, Germany Contact: Klaus Scheffler PhD,
RF Pulse Toolkit: Application Specific Design
 RF Pulse Toolkit: Application Specific Design William A Grissom Department of Biomedical Engineering, Vanderbilt University, Nashville, TN, USA will.grissom@vanderbilt.edu Introduction RF excitation is
Advances in Antenna Measurement Instrumentation and Systems
 Advances in Antenna Measurement Instrumentation and Systems Steven R. Nichols, Roger Dygert, David Wayne MI Technologies Suwanee, Georgia, USA Abstract Since the early days of antenna pattern recorders,
Welcome at MR Achieva 3.0T TX. About the system. Index. 1.1 Introduction
 1 Welcome at MR Achieva 3.0T TX Welcome to the Introduction of and e-learning module for the Achieva 3 Tesla TX-system. This CBT is setup for those engineers who will soon receive a Achieva 3Tesla TX system.
Passive Tracking Exploiting Local Signal Conservation: The White Marker Phenomenon
 Passive Tracking Exploiting Local Signal Conservation: The White Marker Phenomenon Jan-Henry Seppenwoolde,* Max A. Viergever, and Chris J.G. Bakker Magnetic Resonance in Medicine 50:784 790 (2003) This
Steady-state sequences: Spoiled and balanced methods
 Steady-state sequences: Spoiled and balanced methods Karla L Miller, FMRIB Centre, University of Oxford What is steady-state imaging? In the context of MRI pulse sequences, the term steady state typically
Challenges of Field Inhomogeneities and a Method for Compensation. Angela Lynn Styczynski Snyder. Michael Garwood, Ph.D., Adviser
 Challenges of Field Inhomogeneities and a Method for Compensation A DISSERTATION SUBMITTED TO THE FACULTY OF THE GRADUATE SCHOOL OF THE UNIVERSITY OF MINNESOTA BY Angela Lynn Styczynski Snyder IN PARTIAL
The SENSE Ghost: Field-of-View Restrictions for SENSE Imaging
 JOURNAL OF MAGNETIC RESONANCE IMAGING 20:1046 1051 (2004) Technical Note The SENSE Ghost: Field-of-View Restrictions for SENSE Imaging James W. Goldfarb, PhD* Purpose: To describe a known (but undocumented)
Gradients. Effects of B0 gradients on transverse magnetisation Similar to figure 10 of Sattler review Progr. NMR 34 (1999), 93
, 93") Gradients 1. What are gradients? Modern high-resolution NMR probes contain -besides the RF coils - additional coils that can be fed a DC current. The coils are built so that a pulse (~1 ms long) of DC
Gradients 1. What are gradients? Modern high-resolution NMR probes contain -besides the RF coils - additional coils that can be fed a DC current. The coils are built so that a pulse (~1 ms long) of DC
Lesson 06: Pulse-echo Imaging and Display Modes. These lessons contain 26 slides plus 15 multiple-choice questions.
 Lesson 06: Pulse-echo Imaging and Display Modes These lessons contain 26 slides plus 15 multiple-choice questions. These lesson were derived from pages 26 through 32 in the textbook: ULTRASOUND IMAGING
Improve Image Quality of Transversal Relaxation Time PROPELLER and FLAIR on Magnetic Resonance Imaging
 Journal of Physics: Conference Series PAPER OPEN ACCESS Improve Image Quality of Transversal Relaxation Time PROPELLER and FLAIR on Magnetic Resonance Imaging To cite this article: N Rauf et al 2018 J.
A Conceptual Tour of Pulsed NMR*
 A Conceptual Tour of Pulsed NMR* Many nuclei, but not all, possess both a magnetic moment, µ, and an angular momentum, L. Such particles are said to have spin. When the angular momentum and magnetic moment
Improving high-field MRI using parallel excitation
 review Improving high-field MRI using parallel excitation MRI at high magnetic field strengths promises to deliver clearer images of the body s structure and function. However, high-field MRI currently
EE469B: Assignment 1 Solutions
 EE469B Fall 26-7 RF Pulse Design for MRI EE469B: Assignment Solutions Due Thursday Oct 6 Introduction This assignment concerns typical Fourier transform designs of excitation pulses. This includes designing
ISSN X CODEN (USA): PCHHAX. The role of dual spin echo in increasing resolution in diffusion weighted imaging of brain
: PCHHAX. The role of dual spin echo in increasing resolution in diffusion weighted imaging of brain") Available online at www.derpharmachemica.com ISSN 0975-413X CODEN (USA): PCHHAX Der Pharma Chemica, 2016, 8(17):15-20 (http://derpharmachemica.com/archive.html) The role of in increasing resolution in
Available online at www.derpharmachemica.com ISSN 0975-413X CODEN (USA): PCHHAX Der Pharma Chemica, 2016, 8(17):15-20 (http://derpharmachemica.com/archive.html) The role of in increasing resolution in
1.5T HIGH FIELD SMALL ANIMAL MRI
 1.5T HIGH FIELD SMALL ANIMAL MRI Designed Specifically for Veterinarians TECHNICAL GUIDE ADVANCING THE ART AND SCIENCE OF VETERINARY MRI The PetVet is the only high-field MRI system designed specifically
Diff Ganzkörper ep2d_diff_stir_b50_800_tra
 Table of contents \\USER Ganzkörper clinical Diff Ganzkörper ep2d_diff_stir_b50_800_tra - 1 - \\USER\Ganzkörper\clinical\Diff Ganzkörper\ep2d_diff_stir_b50_800_tra TA: 2:23 PM: ISO Voxel size: 1.6 1.6
PULSED/CW NUCLEAR MAGNETIC RESONANCE
 PULSED/CW NUCLEAR MAGNETIC RESONANCE The Second Generation of TeachSpin s Classic Explore NMR for both Hydrogen (at 21 MHz) and Fluorine Nuclei Magnetic Field Stabilized to 1 part in 2 million Homogenize
BACKGROUND. ** 78% of all MRI scanners have Image Quality problems. *** *** 25% of all Multi-Channel RF coils have at least one bad channel.
 Range of Results from over 534 ACR-mandated Annual MRI Performance Evaluations on over 204 Magnets from 8 Vendors Spanning a 10-year Period Moriel NessAiver, Ph.D. - Simply Physics - Baltimore, MD moriel@simplyphysics.com
Improvement of the Image Quality of Black-blood Magnetic Resonance Imaging with the Subtraction Double Inversion Recovery Technique
 J Radiol Sci 2014; 39: 105-110 Improvement of the Image Quality of Black-blood Magnetic Resonance Imaging with the Subtraction Double Inversion Recovery Technique Shih-Ming Huang 1,2 Shu-Hui Peng 1,2 Jan-Yang
RF Pulse Design. Multi-dimensional Excitation II. M229 Advanced Topics in MRI Kyung Sung, Ph.D Class Business
 RF Pulse Design Multi-dimensional Excitation II M229 Advanced Topics in MRI Kyung Sung, Ph.D. 2018.04.12 Class Business - Homework 1 will be due on 4/26 - Office hours Instructors: Fri 10-12 noon TAs:
Pulsed NMR Experiment Guide Kenneth Jackson Physics 173, Spring 2014 Professor Tsai
 Pulsed NMR Experiment Guide Kenneth Jackson Physics 173, Spring 2014 Professor Tsai 1. Introduction NMR or nuclear magnetic resonance occurs when nuclei are placed in a magnetic field. It is a physical
Digital Imaging CT & MR
 Digital Imaging CT & MR January 22, 2008 Digital Radiography, CT and MRI generate images in a digital format What is a Digital Image? A digital image is made up of picture elements, pixels row by column
3T Unlimited. ipat on MAGNETOM Allegra The Importance of ipat at 3T. medical
 3T Unlimited ipat on MAGNETOM Allegra The Importance of ipat at 3T s medical ipat on MAGNETOM Allegra The Importance of ipat at 3T The rise of 3T MR imaging Ultra High Field MR (3T) has flourished during
EE469B: Assignment 4 Solutions
 EE469B Fall 26-7 RF Pulse Design for MRI EE469B: Assignment 4 Solutions Due Thursday Oct 27. True Null/Flyback Spectral-Spatial Pulses True null and flyback designs are very closely related. In this problem