Wavelength Drift in CWDM Systems: Impact and Measurement
|
|
|
- August Wilson
- 6 years ago
- Views:
Transcription

1 Dublin Institute of Technology Masters Engineering 2017 Wavelength Drift in CWDM Systems: Impact and Measurement Thomas Freir Dublin Institute of Technology, Follow this and additional works at: Part of the Electrical and Electronics Commons Recommended Citation Freir, T. (2017) Wavelength drift in CWDM systems: Impact and Measurement. Masters thesis, DIT, This Theses, Masters is brought to you for free and open access by the Engineering at It has been accepted for inclusion in Masters by an authorized administrator of For more information, please contact This work is licensed under a Creative Commons Attribution- Noncommercial-Share Alike 3.0 License

2 School of Electrical and Electronic Engineering Dublin Institute of Technology Kevin Street, Dublin 8. Wavelength drift in CWDM systems: Impact and Measurement. Thomas Freir October 2017 A thesis submitted to the Dublin Institute of Technology for the degree of Master of Philosophy Supervised by Prof. Gerald Farrell (DIT) i
3 Abstract The research begins with an investigation of wavelength drift in Coarse Wavelength Division Multiplexing (CWDM) systems, especially in the context of temperature dependent wavelength drift. A simple model was proposed using a typical application from ITU-T G.695. OptiSystem was chosen as the simulation platform due to its ease of use, the variety and flexibility of its inbuilt components and similar models simulated on the platform in the past. The research then investigates the measurement of wavelength drift focusing on how to determine an acceptable wavelength accuracy for a CWDM wavelength monitor. The chosen approach arose from observations of the results from a model of how wavelength drift impacts the most important system parameter in CWDM systems, which is error performance. The statistical confidence levels of Bit Error Ratio (BER) measurements taken by typical industry test and measurement equipment was considered and their statistical worst case BER results were calculated. An argument is made equating wavelength drift to an equivalent degradation of a links BER. Using the model developed a minimum wavelength accuracy of nm for the CWDM wavelength monitor was calculated. Following a survey of instruments marketed to the CWDM industry, a set of attributes that are representative of the different types of instruments available was made. These attributes were categorised into parameters and features. Each parameter and feature was considered in the context of a wavelength monitor for use in CWDM systems with a subsequent reclassification of the attributes into essential features and key ii
4 parameters, hence the attributes of a CWDM wavelength monitor were specified. An in-depth investigation of wavelength measurement operating principles was carried out with the aim of identifying a suitable technology to implement a CWDM wavelength monitor. The ratiometric wavelength measurement operating principle was chosen to implement a proof of principle CWDM wavelength monitor as it offers the best potential to meet the required specification with a least complex solution. The ratiometric wavelength measurement operating principle was discussed in more detail followed by an investigation of the maximum discrimination of the optical filter used in this technique. The limits on the maximum discrimination of the optical filter due to an optical sources wideband noise were then modelled with a proof of principle experiment carried out to validate the model. iii
5 Declaration I certify that this thesis, which I now submit for examination for the award of MPhil, is entirely my work and has not been taken from the work of others, save and to the extent that such work has been cited and acknowledged within the text of my work. This thesis was prepared according to the Regulations for Graduate Study by Research of the Dublin Institute of Technology (DIT) and has not been submitted in whole or in part for another award in any other third level institution. The work reported on in this thesis conforms to the principles and requirements of the DIT's guidelines for ethics in research. DIT has permission to keep, lend or copy this thesis in whole or in part, on condition that any such use of the material of the thesis be duly acknowledged. Signature Date Thomas Freir iv
6 Acknowledgements I first must thank my supervisor Professor Gerald Farrell, for his guidance, support and patience during this research. In particular, I must thank him for being so generous with his time in discussing the research. At different stages during the research assistance was lent by the following people for which I am most grateful. I must thank Professor Yuliya Semenova, Dublin Institute of Technology for her time and advice especially in the area of lasers. Mr. Derek Cassidy of BT Ireland gave great insight into the operation and commissioning of commercial CWDM systems. Dr. Bernard Enright, Dublin Institute of Technology, gave invaluable assistance in the area of statistics. I am most grateful to Dr. Ginu Rajan, University of Wollongong, and Dr Qian Wang, Data Storage Institute at Zhejiang University, for sharing their work, especially in the use of their Matlab model. Finally, I thank my family, especially my wife Caitriona Freir, who has shown patience and supported me during my research. v
7 Abbreviations AOTF Acousto-Optic tunable Filter ASHRAE American Society of Heating, Refrigerating and Air-Conditioning Engineers BER Bit Error Ratio BERT Bit Error Ratio Test set CATV CAble TeleVision CCD Charge-Coupled Device CL Confidence Level CWDM Coarse Wavelength Division Multiplexing Dc Dispersion Coefficient DFB Distributed FeedBack DML Directly Modulated Laser DWDM Dense Wavelength Division Multiplexing EA-EML Electro-Absorption-based Externally Modulated Laser ECL External Cavity Laser EDFA Erbium-Doped Fiber Amplifier EMC ElectroMagnetic Compatibility vi
8 FBG Fibre Bragg Grating FGL Fibre Bragg Grating Laser FWHM Full-Width Half-Maximum ICT Information and Communication Technology ITU International Telecommunication Union ITU-T International Telecommunication Union - Telecommunication Standardization Sector LD Laser Diode LED Light Emitting Diode MEMS MicroElectroMechanical Systems NRZ Non-Return-to-Zero OADM Optical Add/Drop Multiplexer OE Optical to Electronic OEM Original Equipment Manufacturer OLM Optical Layer Monitoring OOK On-Off Keying OSA Optical Spectrum Analyser OSNR Optical-Signal-to-Noise-Ratio OXC Optical Cross Connect vii
9 PDL Polarisation Dependent Loss PMD Polarisation Mode Dispersion PONs Passive Optical Networks PRBS Pseudo-Random Bit Sequence RIN Relative Intensity Noise R-OADM Reconfigurable Optical Add/Drop Multiplexer SBS Stimulated Brillouin Scattering SDH Synchronous Digital Hierarchy SMF Single-Mode Fibre SNR Signal to Noise Ratio SPO Single Parameter Optimisation TDM Time Division Multiplexing TLS Tunable Laser Source VCSEL Vertical-Cavity Surface-Emitting Laser WDM Wavelength Division Multiplexing viii
10 Table of Contents Abstract... ii Declaration... iv Acknowledgements... v Abbreviations... vi List of Figures... xii List of Tables... xvi 1 Coarse Wavelength Division Multiplexing Introduction CWDM Overview Optical layer monitoring ITU-T standards CWDM versus DWDM System specification method: the black link and black box approach Aims and Objectives Methodology Summary of Chapters Analysis and model development for Channel drift in CWDM Introduction CWDM channels ix
11 2.3 ITU-T G.695 Application Codes CWDM wavelength drift Temperature dependent wavelength drift CWDM system modelling Worst-case analysis Model Overview Summary Using the model to determine the accuracy with which wavelength needs to be measured An overview of approaches to determine wavelength accuracy System performance using Bit Error Ratio Statistical confidence level in bit error ratio testing Linking wavelength accuracy to BER Parameter selection and validation for the model Multiplexer / demultiplexer parameters (mux/demux) Multiplexer / demultiplexer filter response validation Transmitter parameters and validation Optical fibre parameters Receiver parameters Using the model to analyse BER and wavelength drift Summary CWDM wavelength monitor specification and implementation Introduction CWDM instrument attributes CWDM wavelength measurement instrument features x
12 4.4 CWDM wavelength monitor parameter specification Key parameter rationale Additional parameters Final specification Identifying an appropriate wavelength measurement approach Operating principle of a CWDM wavelength monitor Assessment strategy used to identify appropriate operating principle for use in a CWDM wavelength monitor Summary Proof of principle implementation of ratiometric operating principle Introduction Overview of a ratiometric wavelength measurement system Worked example of a ratiometric wavelength measurement scheme Resolution of a Ratiometric System Filter discrimination limits in a ratiometric system Implications for a CWDM wavelength monitoring system Wavelength-dependent optical filter Proof of principle wavelength discrimination Summary Conclusions Summary of work Thesis conclusions Future work Bibliography xi
13 List of Figures Figure 1-1 Measurement response time versus measurement type in the context of optical layer monitoring. Figure redrawn from a white paper from Proximion AB titled Optical Layer Monitoring [3] Figure 1-2 Black Box approach [5] Reproduced and annotated from ITU-T G Figure 1-3 Black Link approach [5] Reproduced, edited and annotated from ITU-T G Figure 2-1 Sample G.695 application code Figure 2-2 Laser drifting into the stop band of an ideal multiplexer Figure 2-3 Laser diode linewidths Figure Total IC usage by system type ($291.3B) Source IC Insights [18] Figure 2-5 Variation in wavelength of laser due to manufacturing Figure 2-6 Variation in wavelength due to changes in temperature of a laser with a central wavelength variation of -3 nm due to manufacturing Figure 2-7 Variation in wavelength due to changes in temperature of a laser with a central wavelength variation of +3 nm due to manufacturing Figure 2-8 Legend explaining the proposed application code to be modelled Figure 2-9 Reproduced from ITU-T G.695, table with CWDM physical layer parameters, including those of application code S-C4L1-1D2 [7] Figure 2-10 Block diagram of a four-channel unidirectional CWDM link Figure 3-1 System under test by a bit error rate test set Figure 3-2 Plot of Poisson Distribution Function Figure 3-3 Plot of Poisson Distribution Function with cumulative probability to 95% shaded Figure 3-4 Block diagram of optical path from Tx1 to Rx xii
14 Figure 3-5 Components and subsystems of the Multiplexer and Demultiplexer models. Reproduced from OptiSystem component library Figure 3-6 Illustration of mux/demux optical parameters, adapted and consolidated from ITU-T G.671. Parameters 1, 2 & 3 from Table Figure 3-7 Illustration of adjacent channel isolation in a multiplexer or demultiplexer adapted from ITU-T G Figure 3-8 Illustration of Non-adjacent channel isolation in a multiplexer or demultiplexer adapted from ITU-T G Figure 3-9 Screen shot of OptiSystem interface Figure 3-10 Block diagram of simulation components shown in Figure Figure 3-11 Wavelength response of the 1511 nm input port of the four-port multiplexer Figure 3-12 Simulated results, wavelength response of the OptiSystem 4 channel mux/demux Figure 3-13 Measurement set-up for a transmitter eye diagram reproduced from ITU-T G Figure 3-14 Transmitter eye diagram with STM16 eye mask from OptiSystem simulation Figure 3-15 OptiSystem model - SPO varying optical fibre length to achieve BER of 1x10-12 at Rx Figure 3-16 OptiSystem model - SPO varying Tx1 wavelength to achieve BER of 2.0x10⁻¹² at Rx Figure nm 1591 nm and 1611 nm ITU-T G Channels with an imaginary channel at 1631 nm for illustration purposes only Figure 5-1 Block diagram of a generic ratiometric wavelength measurement system. 116 Figure 5-2 Spectral response of a generic wavelength discriminator (optical filter) xiii
15 Figure 5-3 Spectral response of a sample wavelength discriminator (optical filter) Figure 5-4 Intensity distribution of a typical tunable laser source in the wavelength region 1500 nm to 1600 nm. Reproduced from [91] Figure 5-5 Transmission response of wavelength discriminator and the associated power ratio at the photodetectors from model in [91]. Source has an SNR of 55 db with a random component < 1 db Figure 5-6 Difference between transmission response and output ratio at 1600 nm for a source SNR of 55 db Figure 5-7 Modelled transmission response of a db wavelength discriminator and the ratio at the photodetectors for sources with an SNR of 60, 50, 40 & 30 db Figure 5-8 Block diagram of optical path from Tx1 to Rx1 in a sample CWDM system Figure 5-9 Difference between transmission response and output ratio at 1621 nm with a source SNR of 30 db, measured at Rs Figure 5-10 Block diagram of a ratiometric wavelength measurement system using a wavelength dependent filter Figure 5-11 Three port generic WDM optical splitter, reproduced from Newport.com Figure 5-12 Wavelength response of generic Newport WDM optical splitters, reproduced from Newport.com [94] Figure 5-13 Wavelength dependent splitter and equivalent wavelength flat splitter and filter combination Figure 5-14 Block diagram of the experimental setup replicating the placement of a ratiometric power meter at the Ss reference point (near the CWDM transmitter) Figure 5-15 Ratio detected by ratiometric power meter with a step input change in wavelength of 0.1 nm, system input connected at the Ss reference point xiv
16 Figure 5-16 Components and subsystems of the Multiplexer and Demultiplexer models. Reproduced from OptiSystem component library Figure 5-17 Block diagram of the experimental setup replicating the placement of a ratiometric power meter at the Rs reference point (near the CWDM receiver) Figure 5-18 Ratio detected by ratiometric power meter with a step input change in wavelength of 0.1 nm, system input connected at the Rs reference point Figure 5-19 Comparison of Figure 5-15 and Figure xv
17 List of Tables Table 1-1 Dispersion and attenuation on a 50 km G.652 fibre link at 1551 nm and ±6.5 nm Table 1-2 Relevant ITU-T Recommendations... 8 Table 1-3 Comparison of DWDM and CWDM package sizes reproduced from Coarse Wavelength Division Multiplexing: Technologies and Applications (Optical Science and Engineering), Hans Jorg Thiele, Marcus Nebeling [11] Table 2-1 CWDM nominal central wavelengths reproduced from ITU-T G Spectral grids for WDM applications: CWDM wavelength grid Table 2-2 Application code legend, adapted from ITU-T G Table 2-3 Overview of light sources, Reproduced from Coarse Wavelength Division Multiplexing - Technologies and Applications - Chapter 3, Hans Jorg Thiele, Marcus Nebeling Table 3-1 Sample BER tests of an imaginary link Table 3-2 N x BER for confidence levels 90%, 95% and 99%, reproduced from [42].. 49 Table 3-3 Poisson Distribution Table 3-4 Commercial four-channel CWDM Multiplexer and Demultiplexer specifications Table 3-5 Worst-case parameters of a four port CWDM multiplexer Table 3-6 Desired 0.5 db passband and 30 db adjacent channel isolation wavelength intersection points and simulated results Table 3-7 Frequency and wavelength of three sample DWDM frequencies Table 3-8 Transmitter parameter values available in ITU-T G Table 3-9 Selected parameters of an ITU-T G.652.D single-mode fibre xvi
18 Table 4-1 Features of a representative survey of CWDM wavelength measurement and monitoring instruments Table 4-2 Summary of key parameters values for representative selection a CWDM wavelength measurement instrument Table 4-3 Specification of the attributes of a CWDM wavelength monitor Table 4-4 Commercial wavelength measurement instruments Table 4-5 Wavelength measurement operating principles with a sample of specific techniques and their key parameters and features Table 4-6 Assessment of operating principles for use in a CWDM monitor Table 5-1 Optical powers at various points in a ratiometric wavelength measurement system for an optical signal with 0 dbm and (-7 dbm) input optical power and three different CWDM wavelengths xvii
19 1 Coarse Wavelength Division Multiplexing 1.1 Introduction This Chapter introduces CWDM (coarse wavelength division multiplexing), briefly discussing its role in telecommunications systems and its robust nature with a focus on the non-temperature controlled nature of its laser sources. Source wavelength drift in CWDM networks, due to the lack of source temperature control, is considered and the possible impact this has on system performance is explored. Measurement of wavelength is then considered in the context of optical layer monitoring followed by an exploration of the International Telecommunication Union (ITU) standards for CWDM and related technologies. Finally, the aims and objectives of the thesis will be discussed. 1.2 CWDM Overview With the demand for very high-speed broadband and for reduced deployment costs for systems in metro and access networks, higher bit rates are required. One solution is to increase bit rates using Time Division Multiplexing (TDM) by moving for example to 40 Gbit/s and 100 Gbit/s line rates. These solutions are often difficult to deploy due to chromatic and polarisation mode dispersion. Alternatives include Dense Wavelength Division Multiplexing (DWDM) and Coarse Wavelength Division Multiplexing (CWDM) with the lower cost solution of CWDM often being attractive in metro and access networks. The rationales and distinctions between DWDM and CWDM are considered in more detail in Section
20 CWDM wavelengths are specified in ITU-T G.694.2, a grid of 18 central wavelength channels with sufficient separation to permit the use of uncooled 1 sources [1]. The wide spectral separation of the sources means that lower cost multiplexers and demultiplexers with wide bandwidths and generous guard bands can be utilised which can tolerate significant wavelength drift due to the loose wavelength tolerance and the use of sources without temperature control, by comparison to DWDM. Wavelength and power monitoring of these sources may be required as drift will impact link performance with changes in chromatic dispersion and link attenuation consequently degrading the Bit Error Ratio (BER) of the link. This can be illustrated by looking at the variation in dispersion and attenuation with wavelength of an ITU-T G.652 compliant singlemode fibre over a sample CWDM source s maximum wavelength range to demonstrate the impact of wavelength drift in a practical setting. Assuming a CWDM source with a central wavelength of 1551 nm, the source s wavelength tolerance of ± 6.5 nm gives a potential wavelength range of nm to nm and hence a dispersion coefficient (Dc) at the wavelength extremes of ps/nm.km and ps/nm.km respectively. From manufacture s datasheets of G.652 compliant fibres, the attenuation variation with wavelength over the 1525 nm to 1575 nm window does not exceed the attenuation at 1550 nm by 0.02 db/km [2]. Assuming the lowest loss is at 1550 nm and a linear variation in attenuation with wavelength, an approximate loss variation with wavelength 1 Both ITU-T G.695 and ITU-T G recommendations, when discussing the use of laser sources that are not temperature controlled use the term uncooled sources. To be consistent with the recommendations, where appropriate, this thesis will continue to use this term. 2
21 of db/km per 1 nm drift can be calculated. Over a 50 km link, the variation in dispersion and attenuation due to a CWDM source s wavelength drifting can be seen in Table 1-1. Table 1-1 Dispersion and attenuation on a 50 km G.652 fibre link at 1551 nm and ±6.5 nm. Parameter Values for λ1 Values for λ2 Values for λ3 Wavelength nm 1551 nm nm Dispersion ps ps 871 ps Attenuation db db 10.3 db It should be noted that that the attenuation variation results in Table 1-1 should be considered best case results. Some manufacturers maximum attenuation variation in this window are larger than 0.02 db/km. The 1551 nm source is in the low loss window with other parts of the spectrum having larger attenuation/wavelength slopes. Finally, the data is for G.652.D fibre with a low water peak and from the most recent revision of the recommendation in Other fibre types and older installed fibres will have much larger differences in attenuation with wavelength, particularly at lower wavelengths. In a more general sense wavelength and power monitoring is part of so-called optical layer monitoring and this is considered in the next Section. 1.3 Optical layer monitoring Optical Layer Monitoring (OLM) is a growing area in optical test and measurement as network operators strive to manage increasingly complex optically multiplexed networks [3]. OLM systems are capable of monitoring many physical layer parameters, 3
![as shown in Figure 1-1, by measuring wavelength on a continuous or periodic basis and by tracking other important parameters [3].](/docs-images/72/68037925/images/22-0.jpg "Figure 1-1 Measurement response time versus measurement type in the context of optical layer monitoring. Figure redrawn from a white paper from Proximion AB titled Optical Layer Monitoring [3].")
22 as shown in Figure 1-1, by measuring wavelength on a continuous or periodic basis and by tracking other important parameters [3]. Figure 1-1 Measurement response time versus measurement type in the context of optical layer monitoring. Figure redrawn from a white paper from Proximion AB titled Optical Layer Monitoring [3]. Considering Figure 1-1 in more detail it can be seen that the x-axis is split into 3 sections with the response to changes in parameters tracked in periods that vary from milliseconds to years depending on the application. In the millisecond range, one such measurement is channel power. For example, channel power can be monitored for protection switching, which by necessity must operate very rapidly to prevent data loss. Protection switching can be addressed by the physical, data-link or network layer with typical switch completion times in the 10 s of milliseconds. To achieve this target, optical layer monitoring equipment must be able to detect changes in output power in millisecond time spans. With time spans of seconds, so-called signal characteristic monitoring measurements can be considered. For example, links with advanced optical architectures are often 4
23 dynamically reconfigured. Components such as Reconfigurable Optical Add-Drop Multiplexers (R-OADM) and Optical Cross Connects (OXC) can add, drop and switch wavelengths and links. Due to the nature of DWDM and the use of optical amplifiers on these networks the channels need to be dynamically rebalanced and adjustments such as power balancing and gain tilt adjustments must be made. Optical layer monitoring equipment operating over measurement times of seconds can optimise these links by monitoring channel power and wavelength and signal quality parameters such as Optical-Signal-to-Noise-Ratio (OSNR). Finally, measurements on the scale of hours, days and years allow monitoring of parameter drift to detect the possible onset of failure. This is especially useful due to the increasing complexity of communications networks. Parameters can be sampled over time and as degradation becomes evident steps can be taken to counter it. One such parameter is wavelength drift. Wavelength drift can affect parameters such as the channel attenuation, dispersion, crosstalk and OSNR. As wavelength drift is often a result of temperature changes, measurement times are routinely in hours and days. In summary, optical layer monitoring equipment capable of measuring all the above measurements have a wide range of demands placed upon then, therefore they are complex and expensive and only deployed in high-end DWDM systems. As CWDM is considered a lower cost alternative to DWDM and is most often deployed in metro and access networks a less sophisticated lower cost monitoring solution is desirable. A key building block of a CWDM monitoring solution, is a single channel wavelength monitor, which is suitable for long-term wavelength monitoring of CWDM systems at low cost. The core focus of this research and thesis is on a single channel wavelength monitor for CWDM systems. 5
24 1.4 ITU-T standards It is well known that the telecommunications industry is highly regulated and standards driven. As a result, communications systems are defined in detailed standards, hence, any investigation of a system needs to take account of the relevant standards. This Section considers the relevant ITU-T (International Telecommunication Union - Telecommunication Standardization Sector) standards, for the research undertaken. The ITU (International Telecommunication Union) is the United Nations specialised agency for information and communication technologies with one its units being the ITU-T. The ITU-T has responsibility for developing ICT (information and communication technology) standards, known as recommendations, to ensure the interoperability of ICT [4]. In practice, this means that the main elements of systems can be purchased from different manufacturers with the reassurance that they will be able to interwork successfully. The ITU-T Manual 2009 Optical fibers, cables and systems is a reference text published by the ITU-T. The foreword states that The manual is intended as a guide for technologists, middle-level management, as well as regulators, to assist in the practical installation of optical fibre-based systems [5]. The preface divides the history of optical fibre technologies into a number of distinct phases and the role that ITU-T standards play in that phase. Phase 1 discusses lightwave systems operating in the 850 nm window, phase 2 considers the benefits gained by moving to the 1300 nm window and phase 3 shows how moving to the 1550 nm window minimised the need for repeaters and commercial systems operating at 2.5 Gbit/s that became available in
25 Phase 4 discusses the development of optical amplification and Wavelength Division Multiplexing (WDM) and the resulting explosion in the aggregate bit rate. The ITU-T Manual 2009 discusses the development of DWDM recommendations followed by CWDM recommendations and their role in access and metro applications. CWDM has a niche in the telecommunications market as a low-cost alternative to DWDM [6]. In comparison to DWDM, CWDM links have a limited range, with ITU-T G.695 specifying a target distance of km for a 4-channel system operating at 2.5 Gbit/s. Furthermore, optical amplifiers are currently not being specified in the CWDM recommendation [7]. CWDM s lower cost and ability to increase a links aggregate bit rate, without increasing the individual channel s line rates, hence overcoming the limits set by dispersion make it a strong contender in the access and metro market. Newer markets for CWDM include Passive Optical Networks (PONs) and enterprise local area networks. Table 1-2 lists various ITU-T recommendations and explains why they are relevant to the work described in this thesis and to CWDM. ITU-T G.695 is the core recommendation utilised as it specifies the key CWDM interfaces with other recommendations referenced for definitions, values and procedures. 7
26 Table 1-2 Relevant ITU-T Recommendations ITU-T Recommendation G.695 Optical interfaces for coarse wavelength division multiplexing applications. G.652 Characteristics of a singlemode optical fibre and cable. G.655 Characteristics of a nonzero dispersion-shifted single-mode optical fibre and cable. G.656 Characteristics of a fibre and cable with non-zero dispersion for wideband optical transport. G.671 Transmission characteristics of optical components and subsystems. G Spectral grids for WDM applications: CWDM wavelength grid. G.957 Optical interfaces for equipments and systems relating to the synchronous digital hierarchy. Relevance This Recommendation defines and provides values for optical interface parameters of physical point-to-point and ring CWDM system applications. This Recommendation describes physical and transmission attributes of a single-mode optical fibre and cable which has a zero-dispersion wavelength around 1310 nm. This is the most widely deployed type of single mode fibre with many CWDM systems operating over it. This Recommendation describes physical and transmission attributes of a single-mode optical fibre and cable which has a non-zero dispersion value throughout a wavelength range. It includes categories of fibre with chromatic dispersion curves bounded to the region 1460 nm to 1625 nm to support the operation of some CWDM channels from 1471 nm and up. This Recommendation describes physical and transmission attributes of a single-mode optical fibre and cable which has a non-zero dispersion value throughout the wavelength range 1460 nm to 1625 nm to support long haul CWDM and DWDM links. The following terms are defined in this recommendation - coarse wavelength division multiplexing; - optical wavelength multiplexer/demultiplexer; - channel insertion loss; - channel spacing; - reflectance. This Recommendation provides the wavelength grid for coarse wavelength division multiplexing applications. This wavelength grid supports a channel spacing of 20 nm. The following terms are defined in this recommendation - joint engineering*; - receiver sensitivity; - transverse compatibility. Numerous references are made to procedures defined in this recommendation. * Joint engineering is the process of defining improved interface characteristics for a link to deliver a performance that would otherwise not be possible using the ITU-T recommendations. The result of this is that both the transmitter and receiver are supplied by one vendor and compatibility and standardisation across manufacturers is no longer possible. 8
27 1.5 CWDM versus DWDM There is an inexorable increase in demand for bit rate capacity in transmission links, driven in the main by the growth of the internet. There are various measures for the maximum capacity of a single-mode fibre. Recent commercial equipment from Ciena Corp demonstrated 9.6 Tbit/s across hundreds of kilometres [8], but most links operate at tens of Gbit/s only. To increase a links bit rate, there are two traditional options. First, increase bit rates using TDM (increasing a channels line rate from 2.5 Gbit/s to 10 Gbit/s). This solution is often difficult to deploy due to chromatic and polarisation mode dispersion. Secondly, DWDM can be implemented. This solution can allow the multiplexing of more than 40 channels at multiple optical wavelengths without increasing the line rate (e.g. 40 x 2.5 Gbit/s). Although this is the solution of choice for high bandwidth links over distances of hundreds of kilometres, its cost does not scale down well for implementation over modestly high bit rate links (e.g. 4 x 2.5 Gbit/s) over shorter distances < 100 km. As already mentioned the lower cost and ability to increase bit rates without the limits set by dispersion make CWDM a strong contender over DWDM, particularly in the access and metro market, where transmission distances are more modest. CWDM competes with DWDM on a cost basis in niche areas. The reduced cost of CWDM over DWDM is achieved in a number of ways. The ITU-T Recommendation G Optical interfaces for coarse wavelength division multiplexing applications, specifies the maximum central wavelength deviation of uncooled sources to support CWDM applications. The simplification of transmitter design achieves cost savings as the main difference between DWDM systems and CWDM systems, is the use of temperature control using Peltier cooling systems to stabilise the wavelength of sources in DWDM systems and the use of uncooled sources in CWDM systems [9]. The total 9
28 wavelength variation of a CWDM source is ±6.5 nm. This wavelength variation is determined mainly by two factors. First a manufacturing tolerance of ±3 nm around the nominal wavelength is allowed in order to achieve a higher yield. Second, a further tolerance of ±3.5 nm allows for the use of sources that are not temperature controlled and hence their wavelength will drift during operation due to changes in the lasers operating temperature [1]. This manufacturing and wavelength tolerance will be discussed further in Section 2.5. ITU-T Recommendation G Spectral grids for WDM applications: CWDM wavelength grid, specifies the nominal central wavelength of uncooled sources to support CWDM applications and hence the nominal channel spacing of these wavelengths is 20 nm. In comparison, a 2.5 Gbit/s DWDM transmission system can have a channel spacing of 0.8 nm with a maximum wavelength deviation of about ±0.185 nm, a deviation that is 35 times better than a CWDM system [10]. Furthermore, as a result of the wide channel spacing, wider passband filters can be used in CWDM and allow a significant saving in cost in comparison to DWDM filters, in the order of 50% due, for example, to the reduced number of layers in thin film filter design, a frequently used technology for optical filters. For example, a 100 GHz DWDM thin film filter will employ 150 layers and a CWDM thin film filter 50 layers [11]. The effect of these relaxed wavelength tolerances is that CWDM systems can achieve cost savings through a combination of [7], Uncooled single mode lasers Relaxed laser wavelength selection tolerances Wide passband filters 10
29 In addition, CWDM typically utilises Directly Modulated Lasers (DMLs), where no external modulator is used compared to DWDM sources where external modulators can be required to meet the strict performance requirements [9]. Due to the simplifications in laser and transmitter design the package size of a CWDM module is also significantly smaller thus incurring further savings over DWDM as a higher channel density can be achieved within modules in CWDM system racks. Table 1-3 summarises and compares CWDM and DWDM in terms of the technology used. Table 1-3 Comparison of DWDM and CWDM package sizes reproduced from Coarse Wavelength Division Multiplexing: Technologies and Applications (Optical Science and Engineering), Hans Jorg Thiele, Marcus Nebeling [11]. Transmitter Board Area: DWDM CWDM 100 cm.2 (16 in.2) 20 cm.2 (3.1 in.2) Laser packages: Package Features: Cooled laser 4 cm. long, 2 cm. high, 2 cm. wide. - Butterfly package (or) - Dual inline laser package - Laser die - Monitor photodiode - Thermistor - Peltier cooler Uncooled laser 2 cm. long, 0.5 cm. in diameter. - Laser die - monitor photodiode - Mounted in a hermetically sealed metal container with a glass window. 1.6 System specification method: the black link and black box approach In this thesis, frequent use is made of block diagrams to explain the configuration of systems and monitoring strategies. In practice, the ITU-T recommendations of optical systems are typically specified in one of two system specifications, a so called black 11
30 box system or a black link system and it is thus useful to get a better understanding of these and their relevance to this thesis. Single-channel transmission and multi-channel transmission recommendations such as ITU-T G.691, ITU-T G.692, ITU-T G.693 and ITU-T G.695 specify interfaces as either black link or black box. In ITU-T G.695 when dealing with the different types of CWDM applications, a number of physical layer parameters such as channel power, channel wavelength, central wavelength and maximum attenuation are defined at various reference points. These reference points, listed below, do not in themselves define the physical layer parameters, rather the parameters are defined at the reference points: SS is a single-channel reference point at the CWDM network element tributary input; RS is a single-channel reference point at the CWDM network element tributary output; MPI-SM is a multi-channel reference point at the CWDM network element aggregate output; MPI-RM is a multi-channel reference point at the CWDM network element aggregate input; RPR Link reference point at the CWDM network element aggregate input; RPS Link reference point at the CWDM network element aggregate output. Figure 1-2 shows a black box approach in schematic form [5]. The black box approach combines together the components in a transmitter or a receiver and does not seek to specify the elements in the black box. 12
![Figure 1-2 Black Box approach [5] Reproduced and annotated from ITU-T G.695.](/docs-images/72/68037925/images/31-0.jpg "As can be seen in Figure 1-2 components such as the CWDM lasers and the optical multiplexer are combined into a black box and similarly with the optical demultiplexer and receiver circuitry.")
31 Figure 1-2 Black Box approach [5] Reproduced and annotated from ITU-T G.695. As can be seen in Figure 1-2 components such as the CWDM lasers and the optical multiplexer are combined into a black box and similarly with the optical demultiplexer and receiver circuitry. Physically the components may be optically spliced together and housed in a unit or may be individual transponder cards patched to a multiplexer. Either way, the components are treated as a black box and the multi-wavelength interface points MPI-SM and MPI-RM are at the output and input of the multiplexer and demultiplexer respectively. The black box model is important because it allows vendors to balance the transmitter power at different wavelengths given the different multiplexer and demultiplexer insertion losses at different wavelengths. This allows vendors to optimise the reach of the system and build compact and thermally efficient systems [9]. The specified parameters at the interface points allow for so called transverse (i.e. multivendor) compatibility of the CWDM network elements, that is between the sending black-box and the receiving black-box [5]. Each multichannel system operates over its own fibre or fibre pair (for the reverse direction) between MPI- SM and MPI-RM. 13

32 The black link approach, Figure 1-3, is used in multi-channel transmission recommendations such as ITU-T G.695, ITU-T G and ITU-T G With this approach, the link itself is considered black and will consist of a number of passive components such as the multiplexers, demultiplexers, optical fibre, splices and connectors. From a network design perspective, these components are treated as a system with an input and output with a set of single channel interface parameters such as transmitter power into the black link and receiver power out of the link. This approach enables transverse compatibility (multi-vendor) between the single-channel input and output points of a black-link [5]. That is, at a particular wavelength the transmitter and receiver can be supplied by different vendors. The black link approach means that the combined multiplexer, demultiplexers pair can be optimised so that their combined insertion loss at different wavelengths can compensate for the changes in fibre attenuation with wavelength. The black link approach also allows a multitude of operators to offer services over leased dark fibre [9]. Figure 1-3 Black Link approach [5] Reproduced, edited and annotated from ITU-T G
33 The decision to utilise either a black box description or black link description of a given system will depend on a number of factors, for example, whether the system is owned and operated by a single end user or whether individual wavelengths are to be leased to a number of independent operators. The proposed CWDM wavelength monitoring system that is the focus of this thesis will perform long term monitoring of wavelength drift in live systems, at a single wavelength. This means that the system will be inserted at the Single-channel interface reference points SS and RS of a black link, Figure 1-3 (i.e. the transmitter and receiver). Measuring at points SS and RS allows the interface parameters at the inputs and outputs of the black link to be validated. For example, the wavelength at a particular receiver can be measured to see if it is within the G.695 parameters for central wavelength. As will be shown later in the thesis the proposed wavelength monitoring system would not be suitable for measuring the wavelength at the interface reference points MPI-SM and MPI-Rm of a black box as the fibre at this point contains multiple channels, although if the black box is composed of discrete components measurement can be taken for individual wavelengths. 1.7 Aims and Objectives Aim - To investigate how a wavelength monitoring system for use in CWDM systems can be specified and implemented. The specific objectives that support this aim are: 1. To identify how system performance in CWDM systems is measured. 2. To identify the role that wavelength drift plays in system performance. 3. Build a CWDM system model that simulates the impact of wavelength drift on system performance and using the simulation results, develop a system specification for a wavelength monitoring system. 15
34 4. Identify a suitable method of determining the required wavelength accuracy of a CWDM wavelength monitor. 5. Using the system specification identify a suitable wavelength measurement technique. 6. Carry out a proof of principle experiment to validate the optical wavelength measurement technique. 1.8 Methodology The ITU-T recommendations, especially G.695, were thoroughly investigated and the parameters that influence system performance and their worst-case values were identified. In addition, industry practice and norms were investigated. Using OptiSystem, (a comprehensive software design suite that enables users to plan, test, and simulate optical links in the transmission layer of modern optical networks) a model was built that simulates the impact wavelength drift has on the performance of a CWDM system. The data collected informed the development of a system specification for a CWDM wavelength monitor to measure wavelength drift, independent of the implementation approach with parameters such as wavelength accuracy and resolution considered. Using the bit error ratio (BER) of a link an argument was developed that allowed the calculation of the minimum wavelength accuracy of a CWDM wavelength monitor. Using the system specification, a number of wavelength measurement techniques were considered and the most suitable was identified. 16
35 The limitations of the wavelength measurement technique were investigated in detail. The proof of principle was built using a number of off the shelf components. The wavelength measurement technique was implemented and tested using a tunable source. A series of conclusions were developed. 1.9 Summary of Chapters This thesis will investigate CWDM wavelength monitoring, the accuracy with which CWDM wavelengths must be measured and the implementation of a wavelength monitor capable of reaching the desired accuracy. The proposed title and structure is as follows: Wavelength drift in CWDM systems: Impact and Measurement. Chapter 1 Coarse Wavelength Division Multiplexing. As already discussed this Chapter sets the scene for CWDM and the ITU-T standards and the need for long term wavelength monitoring is discussed. Chapter 2 Analysis and model development for Channel drift in CWDM. After a detailed analysis of wavelength drift in CWDM systems an overview of a model to determine its impact is discussed. 17
36 Chapter 3 Using the model to determine the accuracy with which wavelength needs to be measured. This Chapter links wavelength accuracy to the system performance metric BER (bit error ratio). Using industry standard confidence levels, an argument is made linking BER to an equivalent wavelength. A CWDM system model is validated and then used to calculate a CWDM wavelength monitor s minimum wavelength accuracy. Chapter 4 CWDM wavelength monitor specification and implementation. This Chapter considers, in general, the specification of a CWDM wavelength monitor with a view to identifying a suitable candidate technology for implementation in a proof of principle. Chapter 5 Proof of principle implementation of ratiometric operating principle. This Chapter investigates the wavelength resolution limits of the proposed candidate technology followed by a proof of principle experiment to demonstrate that the desired resolution is achievable. Chapter 6 Conclusions This chapter provides the key conclusions from across the thesis and also outlines suggestions for future work. 18
37 2 Analysis and model development for Channel drift in CWDM 2.1 Introduction An objective of this thesis is to identify the role that wavelength drift plays in CWDM system performance. To do this we need to better understand CWDM and wavelength drift. This Chapter looks at CWDM sources in further detail, focussing on temperature dependent wavelength drift. A system model is then proposed to better understand and quantify the impact of wavelength drift on CWDM system performance. 2.2 CWDM channels Before investigating the role wavelength drift plays in CWDM system performance the wavelength parameters as defined in the ITU-T standards must be understood. The ITU-T recommendation, G Spectral grids for WDM applications: CWDM wavelength grid, specifies the nominal central wavelength of 18 uncooled sources to support CWDM applications, see Table 2-1. Table 2-1 CWDM nominal central wavelengths reproduced from ITU-T G Spectral grids for WDM applications: CWDM wavelength grid. Nominal central wavelengths (nm) for spacing of 20 nm
38 As can be seen in Table 2-1, the channel spacing of the CWDM sources is 20 nm. This channel spacing is an order of magnitude greater than the DWDM channel spacing of 1.6, 0.8, 0.4 nm or less. As discussed previously this large 20 nm channel spacing, in comparison to DWDM, allows for the use of uncooled sources, relaxed manufacturing tolerances and less costly wide passband filters. 2.3 ITU-T G.695 Application Codes ITU-T G.695 specifies the optical interfaces for CWDM applications. The G.695 interface applications are specified using the following standard notation CnWx ytz, see Table 2-2. Table 2-2 Application code legend, adapted from ITU-T G.695 Legend C n W x y t z Description Indicates that this is a CWDM application, as opposed to DWDM for example. The max number of channels supported by the application, typically 4, 8 or 16. Indicates span distance S for short haul (around 37 km) L for long haul (around 70 km) The maximum number of spans. Currently, for all applications this is 1, as optical amplification is not currently part of the recommendation. Indicates the highest class of optical tributary signal supported. i.e. the bit rate. 0 NRZ 1.25 Gbit/s. (Non-return-to-zero) 1 NRZ 2.5 Gbit/s. 2 NRZ 10 Gbit/s. This is a placeholder for future versions of the recommendation indicating the configuration supported. Currently, D is the only value used indicating the application does not use optical amplifiers Indicates the fibre type 1 indicating operation only in the 1310 nm region on ITU-T G.652 fibre; 2 indicating operation on ITU-T G.652 fibre; 3 indicating operation on ITU-T G.653 fibre; 5 indicating operation on ITU-T G.655 fibre. Bidirectional support is indicated by the addition of the letter B at the front of the application code. An S at the front of the application code indicates a system using the black link approach. 20
39 To illustrate the use of a G.695 application code we can consider a sample code as shown in Figure 2-1. Figure 2-1 Sample G.695 application code 2.4 CWDM wavelength drift For each application code, a table of physical layer parameters and values exists in the G.695 recommendation. Parameters such as minimum mean channel output power and maximum channel insertion loss will vary depending on the application code as channel insertion loss will change with parameters such as channel target length and channel count due to the multiplexer and demultiplexer insertion losses. For the purpose of this work, one of the key interface parameters specified in the application codes is maximum central wavelength deviation. Currently, all applications specified in G.695 specify the maximum central wavelength deviation of a CWDM source to be ±6.5 nm. A CWDM source s upper and lower wavelength bound can be defined using a channel s nominal central wavelength and the maximum central wavelength deviation. The upper and lower wavelength bounds are the wavelength limits placed on the centre wavelength of the source under all conditions and the limits 21
40 under which the multiplexers and demultiplexers must operate [1] [7]. These wavelength limits will be discussed further, later in the Chapter. The ±6.5 nm wavelength deviation is a compromise. If it is too small, then the system approaches the complexity and cost of a DWDM implementation while if it is larger the number of possible channels is too low and the system is uneconomic. The ±6.5 nm deviation from the nominal central wavelength of the laser is determined by a number of factors. An acceptable wavelength variation around the nominal wavelength is allowed in order to achieve a higher yield in manufacture and/or a relaxed fabrication tolerance and in particular the use of uncooled sources. As regards the latter issue, laser central wavelength is known to drift with temperature. For DWDM systems tight control of wavelength is required and hence tight control of temperature. In CWDM systems temperature control is not implemented and hence wavelength drift will occur within the specified temperature range of the laser. In addition to these two factors, the lasers in use are being directly modulated by a data stream typically using on-off keying (OOK). With the output of the laser being the carrier, modulation will introduce changes in the central wavelength. These processes include source chirp and broadening due to selfphase modulation [7]. CWDM lasers operating up to speeds of 10 Gbit/s are also directly modulated as this removes the need for an external modulator which reduces cost. Direct modulation of the laser may result in localised changes in the device s refractive index and in turn lead to changes in the radiation wavelength of the device with the time scale of a single bit interval. This effect is known as chirp. As the laser is driven by a modulation current, the carrier density in the device changes and hence the refractive index of the cavity changes causing the laser wavelength to vary [12] [13]. A further cause of chirp is due to self-phase modulation. This is due to high optical signal intensities which can reduce 22
41 carrier densities, impacting the refractive index of the cavity and varying the wavelength [14]. A typical value of chirp in a Distributed FeedBack laser (DFB laser) is 1.2 GHz/mA (for a 20 ma change in drive current there is a wavelength change of approximately 0.2 nm) [15]. As the change in the radiation wavelength is happening on a bit interval time scale, in effect the source will appear to have a larger linewidth. In terms of possible interference between channels this almost instantaneous change in the wavelength cannot be treated as a wavelength drift per se, but due to the effective broadening of the source spectrum, spectral components of a source may impinge into a multiplexer or demultiplexer s stop band before its central wavelength does as shown in Figure 2-2. In addition, this apparent broadening of the source linewidth plays a significant role in the impact of chromatic dispersion of the link. Figure 2-2 Laser drifting into the stop band of an ideal multiplexer. CWDM sources typically use DFB lasers. Table 2-3 shows an overview of different optical source types. As can be seen, DFB lasers cover the entire CWDM spectrum and offer bit rates up to 10 Gb/s under direct modulation. In addition, a DFB laser s low rate 23
42 of wavelength drift with temperature at 0.1 nm per degree Celsius, makes them suitable as uncooled sources in comparison with Fabry-Perot laser diodes which have poorer typical wavelength drift rates of 0.4 nm per degree Celsius [9]. Table 2-3 Overview of light sources, Reproduced from Coarse Wavelength Division Multiplexing - Technologies and Applications - Chapter 3, Hans Jorg Thiele, Marcus Nebeling. Source type Relative cost Output power (dbm) Wavelength range (nm) Modulation Application LED Very low < Mb/s LAN Fabry Perot Low 3 850, Gb/s Access VCSEL Low 0 850, 1310, 1550 Up to 10 Gb/s Access DFB Medium Direct: 2.5 CWDM, 10 Gb/s metro FGL Medium Gb/s Metro EA-EML High , 1550 Direct: 2.5 Metro Gb/s regional Linewidth is often defined for Fabry-Perot laser diodes in terms of the Full-Width Half- Maximum (FWHM) of the optical field power spectrum with typical values of 5 nm, which may include multiple lasing modes, see Figure 2-3. DFB lasers have much narrower linewidths, typically 0.08 pm (sometimes specified as a 10 MHz linewidth which converts to 0.08 pm at 1550 nm) and is often measured as the width of the spectrum at -20 db from the peak power, see Figure
43 Figure 2-3 Laser diode linewidths. In practice, DFB lasers acceptable for use in CWDM systems will have much wider linewidths. As discussed previously DFB lasers in CWDM systems are typically directly modulated and as a result experience chirp. A short survey of laser diode devices for CWDM applications typically shows a maximum linewidth of the lasers as < 1 nm, which includes a contribution from chirp. With a source s linewidth playing a significant role in a links chromatic dispersion, Fabry-Perot sources are only suitable for short links. 2.5 Temperature dependent wavelength drift This Section will discuss the operating temperature of electronic systems to put into context the specific case of CWDM laser sources that have a typical operating temperature range of 0 C to 70 C and this temperature range s impact on wavelength drift. 25
44 When discussing temperature in the context of electronics, one must first consider that the temperature of the surrounding air, the component case and the semi-conductor materials in the component will all be at different temperatures. As a result, manufacturers typically use the following definitions: TA = Ambient temperature. This is the temperature of the environment, still air. TC = Case temperature. This is the temperature of the case of the semiconductor device. TJ = Operating Junction temperature. This is the temperature of the device circuit itself under given operating conditions [16]. The operating junction temperature is a key temperature parameter as many physical properties of semiconductors are temperature dependent. Electronics manufacturers typically specify the maximum operating temperature (operating junction temperature often shortened to operating temperature) of semiconductor components into four temperature ranges [17]. Commercial: 0 C to 70 C Industrial: -40 C to 85 C Automotive: -40 C to 105 C Military: -55 C to 125 C Historically many electronic components were specified over the military range due to the large proportion of sales in military applications. More recently, as can be seen in Figure 2-4, due to the huge growth of computing and telecommunication applications for semiconductors that account for 74% of the total market [18], it has become uneconomic to manufacture and test components that are guaranteed to operate outside of the commercial temperature range of 0 C to 70 C [17]. As a result of this and the convergence of the computing and telecommunication industries, a large proportion of telecommunications equipment is rated at a commercial grade. 26
 Source IC Insights [18] Furthermore, computing and telecommunication equipment, such as CWDM modules, is usually operated in controlled environments.")
45 0.9% 7.4% 7.0% 10.7% 39.3% 34.7% Communications Computer Consumer Automotive Industrial/Medical Government/Military Figure Total IC usage by system type ($291.3B) Source IC Insights [18] Furthermore, computing and telecommunication equipment, such as CWDM modules, is usually operated in controlled environments. The ITU-T specifies five basic environmental classes, two of which are indoor, one temperature controlled and the other non-temperature controlled. An indoor temperature controlled environment is specified as typically having a temperature range of 5 C to 40 C [5]. An alternative source of building temperature guidelines is The American Society of Heating, Refrigerating and Air-Conditioning Engineers (ASHRAE) who publish thermal guidelines for data processing environments that include as well as data centre type facilities, both telecom facilities and communications rooms/closets [19]. In the ASHRAE document Thermal guidelines for data processing environments, the term server is used to generically describe any IT equipment such as servers, storage, network products, etc. used in datacentre-like applications [20]. ASHRAE publish thermal guidelines for a number of environmental classes with classes A1, A2, A3 & 27
46 A4 being applicable to datacentres, with varying levels of environmental control from tightly controlled to some control. Class A4 (the lowest level of control) has the widest range of allowable temperature at 5 C to 45 C [20]. It can be assumed that CWDM sources and modules will typically be operated in temperature controlled environments and that passive cooling technologies such as heat sinks or fans will be capable of maintaining the laser diodes operating temperature between the 0 C to 70 C range. This supports the contention that the allowable wavelength variation for a source due to manufacturing is typically ±3 nm (that accounts for six of a possible 13 nm) which leaves a wavelength variation of 7 nm for changes in temperature from 0 70 C assuming a wavelength rate of change of 0.1 nm per degree Celsius for a typical laser [9]. As CWDM lasers are typically specified at 25 C the allowable thermal drift is asymmetric, 25 C to 0 C and 25 C to 70 C. As a result of this, the wavelength drift is also asymmetric. To account for this and keep lasers within their allowable ±6.5 nm wavelength deviation, the standards allow for CWDM lasers central wavelength to be offset by 1 nm from the central wavelengths defined in G To better understand why, Figure 2-5 shows a system with the nominal central wavelength, 1551 nm, will use a source that at 25 C is 1550 nm. With a ±3 nm variation in wavelength due to manufacturing, the wavelength of the laser at 25 C at one extreme would be 1547 nm and the other extreme, 1553 nm. 28


47 Figure 2-5 Variation in wavelength of laser due to manufacturing. For the same laser, changes in temperature from 25 C to 0 C and from 25 C to 70 C will cause an additional change in wavelength of -2.5 nm and +4.5 nm respectively. As can be seen in Figure 2-6 when the laser manufacturing variation is at its -3 nm extreme changes in temperature will cause the wavelength to drift between nm and nm. Figure 2-6 Variation in wavelength due to changes in temperature of a laser with a central wavelength variation of -3 nm due to manufacturing. 29

48 At the other extreme when the laser manufacturing variation is at +3 nm as in Figure 2-7 changes in temperature will cause the total wavelength drift to lie between nm and nm Figure 2-7 Variation in wavelength due to changes in temperature of a laser with a central wavelength variation of +3 nm due to manufacturing. As can be seen in Figure 2-6 and Figure 2-7, as a result of the offset the laser will be limited to drifting between nm and nm even though the temperature and consequent wavelength drift is asymmetric. It should be noted that a considerable saving can be made by not temperature controlling the CWDM source itself, for example using a thermoelectric cooler, but by ensuring that the laser diode device itself operates within a 0 C to 70 C operating temperature range. This does not mean that vendors cannot supply equipment that can operate reliably in harsher environments such as outdoor enclosures. Trade-offs can be made such as reducing the wavelength variation due to manufacturing to allow for greater wavelength variation due to temperature or by introducing some form of limited or coarse temperature control which would negate some of the cost saving usually made in CWDM systems. 30
49 2.6 CWDM system modelling The aim of this thesis is to implement a wavelength monitoring system for use in CWDM systems. Implementation requires a system specification to be developed with specifications such as resolution, accuracy, and minimum channel power required. Wavelength measurement systems are already commercially available, some with wavelength accuracies of picometers. Such accuracy comes of at price, both financial and in terms of reliability with many of these systems being benchtop devices. A wavelength monitoring system for use in CWDM would need to be rugged, reliable and be relatively low cost as it may be required to monitor a link for extended periods of time. To develop a system specification that fully meets the requirements of a CWDM monitoring system but does not greatly exceed them, which would negatively impact cost, ruggedness and reliability, requires an understanding of how changes in transmitter wavelength affect system performance. A good starting point for this is a system model that would give a better understanding of how changes in wavelength affect a CWDM network s performance and hence would inform the system specification. A number of methods exist for modelling optical communications systems. A numerical model can be developed using a fundamental understanding of the components that can be implemented using C++, Java or Matlab [21] [22]. There are also a number of bespoke optical communications modelling software packages available e.g. FOCSS, Lightsim, ModeSYS, OptSim and OptiSYSTEM. It was decided that a software package for transmission system modelling would be used instead of modelling a system directly in C++ or Matlab, as these packages provide extensive libraries of optical components such as transmitters, receivers, fibres and multiplexers. A complex model can then be built and validated rapidly with extensive graphical output capabilities [23]. The author decided to use the OptiSystem package by Optiwave 31
50 Systems Inc. as it allows rapid validation of the multiple components required to model a CWDM system and an investigation showed that OptiSystem is well suited to this application as it has been used previously by several authors in the simulation of similar problems [24] [25] [26]. It provides straightforward access to component and system characterisation data with automatic parameter sweep and optimisation algorithms and extensive reporting functions [27]. Note that although OptiSystem allows the rapid modelling of complex systems using its library of components, it is not the intention of this research to create a model that simulates all aspects and parameters of a CWDM system but instead to create a model that can answer specific questions and provide insights into how wavelength drift impacts the operation of a CWDM system. This means that the model can be greatly simplified and for example, component parameters such as the return loss of a multiplexer can be ignored as the impact of that parameter will have little effect on the purpose of the simulation in question. When using a component from the OptiSystem library it should be noted that they are generic parts, often with a wide selection of customisable parameters allowing for the simulation of real world components engineered using different technologies. As will be discussed later, using the available data from manufacturers, models of the CWDM components can be built. To ensure the overall model can be used to provide the necessary insights and answers, the specification and validation of the parameters of key components in the model will need to draw from a range of data sources, such as manufacturers source data, ITU-T recommendations and other commercial data were available. 32
51 2.7 Worst-case analysis Worst-case design and worst-case analysis are common methods of designing and analysing optical communication systems. Both ITU-T G.957 Optical interfaces for equipments and systems relating to the synchronous digital hierarchy (SDH) and ITU-T G.955 Digital line systems based on the 1544 kbit/s and the 2048 kbit/s hierarchy on optical fibre cables, specify worst-case design approaches for the design of optical links as well as statistical design approaches [28] [29]. With regard to the CWDM model being developed here, a worst-case design model will be used for the following reasons. Worst-case analysis and design are common practice in the modelling and design of optical communications systems and are defined in ITU-T recommendations. Parameters in G.695 and G.671 are typically specified as worst-case values [7] [30]. Where statistical data may be desirable it is often difficult to obtain due to lack of availability or the commercially sensitive nature of the data. Freely available commercial data sheets may be the only source of parameter values due to the non-standardisation of recommendations such as ITU-T G.671. These data sheets typically supply maximum and minimum worst-case values of parameters. A worst-case analysis has the disadvantage in that it can be very pessimistic. However, in this case, as emphasised above, the analysis here is being applied not to design a CWDM system but rather to specify a wavelength monitoring system, in order to better understand the impact of wavelength drift on CWDM system performance, so as to better specify a wavelength monitoring system a model based on a worst-case analysis is thus acceptable. 33
52 2.8 Model Overview To model wavelength drift in a CWDM system, an obvious starting point would be to model a system with just two sources and two receivers. However, it is advantageous to align the choice of system with the system configurations available in the standards. In the ITU-T standards, different system configurations are referred to as applications. From the ITU-T G.695 standard, the simplest application is a four-channel unidirectional system with other applications being more complex with more channels and possibly bidirectional operation [7]. As discussed in Section 1.6 the wavelength monitoring system will perform long term monitoring of wavelength drift in live systems, at a single wavelength, hence the application is of a black link type. A simple four-channel unidirectional black link type system is referred to in the standard as S- C4L1-1D2. The application code legend is explained in Figure 2-8. ITU-T G.695 supplies a list of physical layer parameters for each application code, with the parameters for S-C4L1-1D2 listed in Figure 2-9. Figure 2-8 Legend explaining the proposed application code to be modelled 34
53 Figure 2-9 Reproduced from ITU-T G.695, table with CWDM physical layer parameters, including those of application code S-C4L1-1D2 [7] Another macro level choice in developing the model is the selection of the bit rate. ITU-T G.695 s lowest bitrate (for unidirectional systems) is 2.5 Gbit/s. 10 Gbit/s is possible and allowed for in the standards but the selection of a lower bit rate simplifies the model for the purpose intended in this work by reducing the effect dispersion plays 35

54 in modelling a CWDM system and on measurements such as link BER. As regards system span or length, selecting a long-haul link application code gives some flexibility in varying a link s attenuation. Finally, one needs to select the fibre type. ITU-T G.652.D singlemode fibre is one of the most widely deployed singlemode optical fibres [31] [32]. ITU-T G.652.D was standardised in 2003 and has been developed specifically for the implementation of CWDM, having a low water peak allowing operation over the CWDM wavelength range and a low Polarisation Mode Dispersion (PMD) making it suitable for operation at 2.5 Gbit/s and 10 Gbit/s. Figure 2-10 shows a block diagram of the four-channel unidirectional CWDM link, aligned with the S-C4L1-1D2 application code, which is to be modelled, where four transmitters send data to their respective receivers. By allowing the wavelength of Tx1 to drift towards that of Tx2, the model will examine the effect this has on the systems performance. Figure 2-10 Block diagram of a four-channel unidirectional CWDM link 36
55 2.9 Summary Having investigated wavelength drift in CWDM systems, especially in the context of temperature dependent wavelength drift a simple model was proposed using a typical application from ITU-T G.695. OptiSystem was chosen as the simulation platform due to its ease of use, the variety and flexibility of its inbuilt components and similar models being built simulated on the platform in the past. The following Chapter will first consider how the performance of a CWDM system should be measured, especially in the context of wavelength drift. The individual components of the system model, in Figure 2-10, will then be validated. Subsequently, using the model, the effect of wavelength drift on CWDM system performance will be examined and a minimum acceptable value of wavelength accuracy will be calculated. 37
56 3 Using the model to determine the accuracy with which wavelength needs to be measured. A key specification of any measurement system is its accuracy. One of the key aims of this thesis is to specify a low-cost wavelength measurement system for use as a longterm wavelength monitoring solution. The accuracy with which the solution must measure wavelength will have an impact on the possible technologies that can be selected to measure wavelength and on the complexity and hence cost of the solution. As a result, the minimum acceptable value of wavelength accuracy is a key specification. This Chapter will investigate the use of Bit Error Ratio (BER) as a means of measuring system performance and its use in a novel approach in determining a minimum wavelength accuracy, having first considered a number of other approaches. Having linked BER to wavelength accuracy the model proposed in Chapter 2 is validated and a worst-case model is prepared. The model is then run, calculating a minimum wavelength accuracy for the proposed CWDM wavelength monitor. 3.1 An overview of approaches to determine wavelength accuracy. A number of approaches to determine acceptable wavelength accuracy were considered and are described in this Section. One approach to setting the accuracy is to let a chosen technological solution determine the best-case accuracy possible. A survey of commercial CWDM wavelength measurement instruments (often called CWDM channel analysers) shows they typically have wavelength measurement accuracies in the order of ± 1 nm, for example the Anritsu MU909020A, JDSU COSA-4055 and the JDSU OCC-55 have wavelength measurement accuracies of ± 1 nm, ± 0.5 nm and ± 0.2 nm respectively. However, the accuracy of such instruments does not appear to be 38
57 set by any particular test and measurement requirement or industry standard but by the limitations of the technology employed to measure wavelength or the need to get a competitive specification advantage over a rival instrument manufacturer. As described in Chapter 1, this thesis sets out to develop a system specification for a CWDM wavelength monitor, independent of the implementation approach. In turn one of the core objectives of this thesis is to develop an analytic approach in determining the required wavelength accuracy of a wavelength monitor for CWDM systems. development of a system specification to measure wavelength drift Apart from letting a technological solution determine the available accuracy, another approach to determining the acceptable wavelength accuracy required is to consider the issue from a power penalty perspective. This offers the advantages of simplicity and familiarity as power penalties are commonly used as a measure of system noise or a way to measure or characterise the effect of varying some system variable such as laser diode parameters [33]. A power penalty can be defined as the increase in receiver power needed to eliminate the effect of some undesirable system noise or distortion elsewhere in a transmission link. In a CWDM system if one assumes that a channel s wavelength drifts beyond its maximum wavelength deviation of 6.5 nm, then as expected system performance is degraded. Defining a wavelength drift power penalty would allow a system designer to account for this degradation caused by this excess wavelength drift to allow the system to remain operational in the event of excessive drift. For example, an excess wavelength drift of X nm causes a degradation in system performance that can be corrected by a 1 db power penalty. Using this logic and using 1 db as a reasonable power penalty it can be said that the accuracy of the wavelength monitor needs to be better than X nm, on the basis that the system designer has accounted for possible excessive drift of up to X nm, by the inclusion of a 1 db power penalty in the system design. This approach was not pursued as there are no consistent values 39
58 assigned to power penalties in general use and by implication for CWDM wavelength drift. Power penalty values chosen, depend on the application and frequently on rules of thumb so picking a particular value of power penalty to equate with a wavelength drift would be somewhat arbitrary. The chosen approach arose from observations of the results from a model of how wavelength drift impacts the most important system parameter in CWDM systems, which is error performance. In the initial simulations of a CWDM system using OptiSystem, it was noticed that simulated measurements such as BER (bit error ratio, a measure of system performance) were inconsistent, with the results changing every time the simulation was rerun. This was expected since OptiSystem calculates the BER using the received signal s signalto-noise ratio. Noise is a random process and statistical in nature so every time the simulation is rerun the number of noise induced errors will vary. It was further discovered that as the noise has a Gaussian distribution, that repeated BER measurements also had a Gaussian distribution and by taking many BER measurements that an average more accurate value for BER could be calculated. Using this average value of BER plus one or two standard deviations gives a value of BER that is a statistical outlier, defined here as BERworst-case. Given a model of the CWDM link operating at its nominal wavelength +6.5 nm and its maximum allowable BER (average value over multiple simulations) and an outlier BER value of BERworst-case, the key question is what wavelength drift beyond 6.5 nm will result in a new deteriorated average BER measurement equal to the previous BERworst-case. This change in wavelength can then be used as the upper limit on excessive wavelength drift and hence would be a reasonable estimate of accuracy. In effect, the statistical uncertainty in the BER simulation can be equated to an equivalent amount of wavelength drift. 40
59 In practice, the OptiSystem package allows one to control the BER statistics by controlling the bit sequence length used during a simulation 2. By increasing the number of bits transmitted more accurate values of noise are obtained and hence more consistent values of BER with a smaller statistical variation can be obtained. This effectively negated the approach being considered since as longer bit sequences are simulated, the variation of the BER measurement result on repeated simulations kept falling. However, while the limitations of the OptiSystem package did not allow the reliable use of BER statistics to infer an acceptable wavelength accuracy, nevertheless the principle of the approach, that is that a better knowledge of the statistics of bit error performance could be used to infer a wavelength accuracy, remained valid and formed the foundation of the approach chosen. To link the statistics of bit error performance to wavelength accuracy requires an approach that is more analytical and does not suffer from the limitations of the OptiSystem package. 3.2 System performance using Bit Error Ratio In this Section, an analytical model is developed of the bit error processes in a digital transmission system as a means to determine the accuracy with which wavelength needs to be measured for CWDM monitoring. As described above, the approach chosen to define acceptable wavelength accuracy for the CWDM monitor involves inferring the accuracy required from the statistics of error performance. This, in turn, requires an 2 A simulation run using a longer bit sequence length will result in more realistic results. A doubling in bit sequence will typically result in a doubling of simulation time. Although OptiSystem allows a wide range of bit sequence lengths, it was found that the software crashed due to the limited computer memory when excessive bit sequence lengths are used. 41
60 analytical understanding of these statistics. This Section begins therefore with a summary of the basics of Bit Error Ratio (BER) measurement in digital transmission systems. System performance in telecommunications systems often uses the dimensionless coefficient bit error ratio or the bit error rate. These terms are often confused and in some cases are used interchangeably, hence they will need to be defined. The Bit Error Ratio (BER) is the ratio of the number of bit errors divided by the total number of transmitted bits, whereas the bit error rate is the number of errors per unit time. As a convention for any further references in this thesis to bit error ratio the abbreviation BER will be used, with the term bit error rate not being used in the thesis. ITU-T G.695 sets the maximum BER for a CWDM system at 1x10-12, that is, on average, one error for every trillion bits transmitted [7]. If a telecommunication system has a maximum BER of 1x10-12, we can assume that for every trillion bits transmitted there is on average no more than one binary 1 being mistaken for a binary 0 or vice versa. Efforts to measure the BER of a link can be made using a Bit Error Ratio Test-set (BERT). In practice, a BERT measures the bit error ratio using a limited number of transmitted bits. Figure 3-1 shows a telecommunications link under test by a BERT. A known sequence of bits is generated using a Pseudo-Random Bit Sequence (PRBS) pattern generator. This sequence of bits is modulated by the transmitter, sent over the channel and regenerated by the receiver where the error counter compares the received bits to the known transmitted signal. By dividing the number of errors counted by the total number of bits received the BER can be calculated. 42

61 Figure 3-1 System under test by a bit error rate test set The quality of a BER measurement improves with an increase in the total number of transmitted bits and as the number of bits increases, confidence in the accuracy of the BER improves. The following argument explains this reasoning. One of the advantages of using optical fibre is the fibre s immunity to electromagnetic interference. As a result, the dominant source of noise in a link is in the receiver [34]. There are three main sources of noise in a receiver: thermal noise; shot noise and quantum noise [35]. Due to the spontaneous nature of these noise sources bit errors are statistical in nature. To demonstrate how the statistical nature of bit errors effects BER measurements, Table 3-1 shows four sample results of the BERM (BERM, the BER measurement returned by a BERT) using an imaginary BERT. It is assumed that the imaginary link being tested has a statistical chance of an error occurring, of 1x On say four consecutive occasions n = 1x bits are transmitted and the number of errors k that occur are counted by the BERT. Due to the statistical nature of the noise in the link the number of actual errors detected on the four consecutive occasions may well vary, with four sample results shown in Table 43
62 3-1. The BERM of the four consecutive measurements can then be calculated by dividing k by n. However, by treating the four separate consecutive measurements as one long measurement the overall BERM calculated by adding the total number of transmitted bits and the total number of errors taken over the four separate consecutive measurements gives a more representative measurement of the BER as shown in Table 3-1. Table 3-1 Sample BER tests of an imaginary link Measurement number n total number of transmitted bits 1x x x x x k number of errors counted BERM - k n 0 1x x x10-12 Taken on its own, measurement #1 suggests that this is an ideal link with no errors occurring, but measurement #4 suggesting that the BERM is considerably worse than the 1x10-12 BERM calculated over a larger number of n = 4x The larger the value of n the closer the measured BERM is to the actual BER. This can be described by Equation 1. Equation 1 Probability estimate equation P (k) = k P(k) [36] n n Where, P(k) is the probability that an error will occur on a link P (k) is an estimate of the true P(k) k is the number of errors counted n is the number of bits transmitted 44
63 It can be deduced from Equation 1 that ideally an infinite number of bits must be transmitted to measure a true value of the BER and thus the probability that an error will occur. In practice, engineers have limited time to test links and hence methods have been developed that allow BER measurements over a fixed period of time. The question arises as to how long a BERT must be connected to a link to give an acceptable accurate BER. As an example, for a link operating at 2.5 Gbit/s, it will take 400 seconds to transmit 1x bits. As discussed above to be confident that such a link has a BER of better than 1x10-12 the BERT must count errors for many times 400 seconds. The key question is thus, how many bits must a BERT transmit, for a statistically valid test? 3.3 Statistical confidence level in bit error ratio testing In practice, a statistical confidence level is typically used in the measurement of BER. i.e. the BER measurement of 1x10-12 is correct with a confidence in the measurement of 95%. While a confidence level can be set at any percentage, texts on statistics will typically consider confidence levels of 90%, 95% and 99%. With regard to confidence levels of BER testing while 90%, 95% and 99% confidence levels can be found in the literature, the ITU-T and numerous industry sources consistently cite a 95% confidence level [5] [37] [38] [39] [40]. Techniques have been developed that achieve an industry standard confidence level (E.g. 95%) in BER testing by transmitting a large but fixed number of bits in sequence without any errors. To analyse this, it is necessary to consider the statistical nature of error occurrence. This approach utilises the binomial distribution. The binomial distribution shows the probability of a success or failure of an event in an experiment that is repeated multiple times. The binomial distribution can be used in BER analysis 45
64 as the transmission of an individual bit can be analysed as a success or failure (a bit error) with multiple bits being transmitted. Equation 2, specifies the number of times k that an event occurs in n independent trials where p is the probability of the event occurring in a single trial. It is an exact probability distribution for any number of discrete trials [41]. Equation 2 Binomial distribution function P n (k) = n! k!(n k)! pk q n k [42] P n (k) is the probability that k events occur in n trials, Where: An event is taken to mean the occurrence of a single error in a bit n is the number of trials i.e. in this case, the number of bits transmitted k is the number of events i.e. the number of bits which are in error p is the probability of an event occurring i.e. a bit error q is the probability of an event not occurring i.e. no bit error, thus q = 1- p The following conditions must be met for a binomial distribution to be valid [43]. The number of observations n is fixed (Number of bits transmitted). Each observation is independent (The probability of a bit being a 1 or 0 is not determined by the previous bits transmitted, true for random data in optical communications systems). Each observation represents one of two outcomes, "success" or "failure" (Bit without error or a bit error). The probability of "success" p is the same for each outcome (E.g. the probability of an error occurring is 1x10-12 ). 46
65 The probability that an error occurring is independent of the previous event can be considered true for optical communications systems where, burst errors are unlikely since the transmission medium (fibre) is immune to external interference. P n (k) is the probability that k errors will occur during a set number of transmitted bits n. Using these probabilities (the binomial distribution) the confidence level (the odds) that no more than N errors will occur during the transmission of n bits can be calculated, see Equation 3. Equation 3 BER confidence level. Confidence Level = 1 P n (k) N k=0 Due to the factorial in Equation 2, P n (k) is difficult to evaluate for large values of n (e.g. n=1x10 +12!) [44]. An alternative is to use the Poisson Limit Theorem allowing Equation 3 to be solved for n. Poissons Limit Theorem 3, states that if n, p 0 and np λ then the binomial distribution can be approximated by ( Poisson Limit Theorem and the Poisson Distribution Function) [45], which can be more easily evaluated, see Equation 4. Equation 4 Poisson distribution n! P n (k) = k! (n k)! pk q n k (λ)k n k! e λ As previously discussed the ITU-T and numerous industry sources consistently cite measuring the BER with a 95% confidence level. The technique employed requires the transmission of a large fixed number of consecutive bits (n), error free. If no errors 3 λ is the mean number of events in the interval. 47
66 occur during the transmission of these bits it can be said the links BER is better than the desired value with a 95% confidence level. This error free value of n will be large enough that we can be confident with a 95% confidence level that it is not just a statistical fluke. Using Equation 3 and Equation 4 and solving for n (number of bits to be transmitted), n can be found in terms of, N (the number of errors that occur during the transmission of n bits), a CL (confidence level) and p (the probability of an error occurring during the transmission of a single bit). If N = 0, (no errors occur) the equation can be simplified as in Equation 5, also detailed in [36]. Equation 5 Bits to be transmitted to achieve a given confidence level n = ln(1 CL) p + N npk ln( k=0 ) k! p ln(1 CL) p Using Equation 5, with p = 1x10-12 (probability of a bit error occurring) and CL = 95%, it is found that n = x In effect, if x bits can be transmitted without any errors then one can be certain with a statistical confidence of 95% that the probability of errors occurring, the BER, is better than 1x Using Equation 5, Table 3-2 can be generated which shows how many bits must be transmitted with one, two or no errors occurring to achieve a given confidence level. Table 3.2 shows for example, that to be confident that the link BER is no worse than 1x10-12 with a confidence level of 95% then 3.00 times (3 times the inverse of the BER 4 ) bits must be transmitted without errors. If one error occurs during the first 3x sequence of n bits, instead of assuming that the link has failed the BER test, the test should continue with 4.74 times bits being transmitted with only one error to x x x = 3x
67 maintain the 95% confidence level. It can be legitimately asked what would happen if an error occurs 1000 bits short of achieving the 3x bit target. It can be said that there is little difference between 3x and [3x ]. Using Equation 5 and calculating for CL with n = [3x ] it will be found that the CL will have reduced by a very small amount (1x10⁻⁷ change in the percentage confidence level). To be certain that the BER is 1x10-12 with an exact 95% confidence level the test should be run to 4.74 times as before. Table 3-2 N x BER for confidence levels 90%, 95% and 99%, reproduced from [42]. k Errors N x 1/BER CL 90% CL 95% CL 99% Linking wavelength accuracy to BER The above Section considers the measurement of BER to a given confidence level, based on a knowledge of the statistics of error occurrence. This Section uses that knowledge to infer an acceptable wavelength accuracy. Specifically, this Section draws conclusions regarding acceptable wavelength accuracy (when measuring drift) by modelling the impact of wavelength drift on BER. In Section 3.3 it was calculated that n = 3.00x bits must be transmitted without error to ensure the BER is no worse than 1x10-12 with a confidence level of 95%. As a starting point, the Poisson distribution function is plotted using the probability of k errors occurring during the transmission of a fixed number of bits, as can be seen in Figure
68 Figure 3-2 Plot of Poisson Distribution Function The curve shows the probability of a fixed number of errors k, occurring during the transmission of a fixed number of bits n = 3x bits given the probability of an error being 1x For example, the probability of exactly 2 errors occurring during the transmission of n bits is 22.4%. Likewise, the probability of 5 errors is 10.08%. The sum of the probabilities under the curve is 100%. Note, that although the curve in Figure 3-2 is continuous, it cannot be used to calculate the probability of, for example, four and a half errors. An error will either have or have not occurred, hence they will always be whole numbers. Even though the BER (Bit error ratio as n ) is 1x10-12 there is a 10.08% chance that 5 errors will be counted during a sequence of n = 3x bits. This means that there is a 10.08% chance that the bit error rate will be 5 errors 3x bits = 1.667x Table 3-3 shows the probability of k errors occurring, the cumulative probability of k errors occurring and the bit error rate for k errors occur during the transmission of n = 3x bits. 50
69 Table 3-3 Poisson Distribution k errors Probability of k errors occurring Cumulative probability Bit error rate % % % % 3.33E % % 6.67E % % 1.00E % % 1.33E % % 1.67E % % 2.00E % % 2.33E % % 2.67E % % 3.00E % % 3.33E % % 3.67E % % 4.00E % % 4.33E % % 4.67E % % 5.00E-12 As previously discussed industry finds it acceptable to test a link s BER to a confidence level of 95%. Figure 3-3 shows the same plot as in Figure 3-2 but with the shaded area showing the cumulative probability of k errors occurring up to 95%. This shows that we can be certain with a confidence of 95% that the number of errors k that occur during the transmission of n = 3x bits will lie within the shaded area. From Figure 3-3, we can say that we are 95% confident that no more than 6 errors will occur. Similarly, looking at the cumulative probability of k errors occurring in Table 3-3 it can be seen that when the cumulative probability has reached 95% ( % is the closest value to 95%, highlighted in Table 3-3) that a maximum of 6 errors could have occurred during the transmission of n bits. It can be said that we are confident to 95% that during the 51
70 transmission of n = 3x bits, with the probability that an error occurring on any one bit p = 1x10-12, that no more than 6 errors will occur. As 6 errors occurring would be the worst-case scenario for the 95% confidence level, one can calculate the BER for this scenario as: 2x errors 3x bits making the worst-case BER with 95% confidence equal to Figure 3-3 Plot of Poisson Distribution Function with cumulative probability to 95% shaded As discussed, a system with a BER of 1x10-12 with the probability of an error occurring following a Poisson distribution will have a worst-case BER of 2x10-12 with 95% confidence. Considering that engineers measuring the BER of optical links routinely make measurements with a confidence level of 95%, this thesis will attempt to link wavelength drift to the calculated worst-case BER of 2x To investigate system performance and channel BER the following model, Figure 3-4, was built in OptiSystem. When Tx1 (nominal wavelength 1511 nm) has drifted by the maximum wavelength deviation of 6.5 nm towards the adjacent channel and is now at 52
71 nm, and all other ITU-T G.695 parameters are at their worst-case values, for Rx1 to successfully regenerate the signal the BER must not exceed 1x As will be discussed in further detail later, the fibre parameter Length has been set so that when the wavelength drifts to nm the maximum BER of 1x10-12 of Rx1 set in ITU-T G.695 is reached but not exceeded in the simulation. Figure 3-4 Block diagram of optical path from Tx1 to Rx1 The wavelength drift of Tx1 beyond the maximum wavelength deviation of 6.5 nm will then be simulated. As a result, the wavelength will now be drifting into the stop-band of the multiplexer and demultiplexer optical filters causing the attenuation experienced by this wavelength to increase and the links BER to deteriorate. The amount by which the wavelength must drift, (in excess of +6.5 nm) to cause the links BER to deteriorate to 2x10-12, (the previously discussed worst-case BER) can be considered an acceptable value of wavelength accuracy. This excess drift will be written as λexcess. 53
72 We must remember that one of the key aims of this thesis is to specify a low-cost wavelength measurement system for use as a long-term wavelength monitoring solution. If a channel s wavelength is being measured by the specified wavelength monitor with an accuracy of ± λexcess, when it reports a wavelength of nm, (the 1511 nm channel that has drifted by the 6.5 nm maximum wavelength deviation) the worst-case scenario would be that the actual wavelength is nm + λexcess. In this case, the channels wavelength will have drifted by λexcess into the stop-band of the multiplexer and demultiplexer optical filters degrading the BER to the previously calculated value 2x It can be argued that this error in accuracy could result in a degradation of the BER that is equivalent to the confidence level with which bit error rate is measured. That is, an engineer will accept that a BERT that is returning a BERM of 1x10-12 with a 95% confidence level could actually, if measured for longer periods of time, have a BER of 2x10-12 which is equivalent to a wavelength measurement inaccuracy that results in, under the condition discussed, the same BER of 2x Parameter selection and validation for the model. As previously discussed in Section CWDM system modelling, the components in OptiSystem are generic parts, each with a wide selection of customisable parameters. This Section will look at the parameters of the various components in the model in the context of the model in Figure 3-4. The transmitter, receiver and optical fibre will be considered, with a specific focus placed on the multiplexer and demultiplexer as they are to a very significant extent the most wavelength dependent components employed in the system. Given that the purpose of the model developed here is to explore the impact of wavelength drift, this means that the multiplexer and demultiplexer parameters are of particular importance. 54
73 3.5.1 Multiplexer / demultiplexer parameters (mux/demux) The multiplexer and demultiplexer will play a vital role in the model. When the optical transmitter s wavelength drifts outside the passband of the mux/demux it becomes highly wavelength selective. As will be discussed later the multiplexer and demultiplexers input and outputs are modelled using an optical filter. The filters are strongly wavelength dependent especially outside the passband of the filter due to their large roll-off. Hence it is important to understand the main parameters of the multiplexer and demultiplexer and how OptiSystem models them. Figure 3-5 shows the different subsystems used by OptiSystem to model the multiplexer and demultiplexer. Many manufacturers could easily use the same block diagram to describe their devices, and while they may use different technologies and techniques to implement the coupling, splitting and filtering, the basic principle holds. It should be noted that the multiplexer and demultiplexer are very similar devices, their main difference being that one combines and the other splits. In practice, the same component is often configured to implement either a combiner or splitter, for example, a three-port optical coupler can be configured as either a one to two port splitter or a two to one port combiner. As a result, most manufacturers supply one device type that can be configured as either a multiplexer or demultiplexer. 55
74 Figure 3-5 Components and subsystems of the Multiplexer and Demultiplexer models. Reproduced from OptiSystem component library. ITU-T G.695 does not directly specify multiplexers or demultiplexers but references ITU-T G Transmission characteristics of optical components and subsystems. Within ITU-T G.671 are the parameters for numerous optical components including those for a CWDM optical wavelength mux/demux. In addition, ITU-T G.671 contains definitions for the parameters of each component. Unfortunately, the current version of ITU-T G.671 (02/2012) does not specify the values of any of the parameters of a CWDM mux/demux and as a result, they are not standardised but defined as being for further study. An alternative reasonable source of data is a detailed survey of commercially available parts. Table 3-4 shows a wide selection of commercially available four-channel CWDM mux/demux devices with their main operating parameters. Each component can be implemented as either a multiplexer or demultiplexer. 56
75 Table 3-4 Commercial four-channel CWDM Multiplexer and Demultiplexer specifications Parameter numbering Parameters db Ripple Channel Insertion Loss Typ / max Adjacent Channel Isolation mux/demux Non-Adjacent Channel Isolation Return Loss PMD PDL Directivity Units nm db db db db db ps db db Accelink Technologies / Cube optics > 13 NA/1.9 > 30 > 40 > 45 < 0.2 > 50 AFL Global > 14 < /2.0 > 30 > 45 > 45 < 0.10 < 0.15 > 50 Senko Opto-Link > 14 < /2.0 > 30 > 45 > 45 < 0.10 < 0.15 > 50 3M > 13 < /1.6 > 30 > 45 > 48 < 0.20 < 0.30 > 55 Transition Networks < 2.0 >30 > 40 > 45 < 0.2 > 50 Fiberon 13 < 0.5 NA /1.5 > 30 > 40 > 50 < 0.10 < 0.15 > 55 Grass valley 14 < 0.5 < 1.8 > 30 > 40 > 45 > 50 From Table 3-4 it is clear that there are a wide variety of parameter specifications for multiplexers and demultiplexers. For modelling purposes, it is important to understand each of these parameters and in particular their role in the context of the objective of the modelling being undertaken here. For clarity, the parameters have been numbered 1 to 9. It should be noted that these are not the only parameters specified on a multiplexer or 5 In practice, individual manufactures may specify other parameters; however, these parameters cannot be seen as relevant to the work of this thesis. 57
76 demultiplexers data sheet, there are numerous other environmental and mechanical parameters typically specified, but these are not relevant to this work. Parameters 1 to 9 were chosen for inclusion in Table 3-4 as these optical parameters could be considered relevant to modelling the effect of wavelength drift on the performance of a CWDM system with each parameter investigated further below. Figure 3-6 illustrates the main wavelength domain parameters of multiplexers and demultiplexers, that is parameters 1, 2 & 3 in Table 3-4. Nominal central wavelength 0 db Reference Peak Insertion Loss Ripple MUX / DEMUX input filter response Channel wavelength range λ in nm Figure 3-6 Illustration of mux/demux optical parameters, adapted and consolidated from ITU-T G.671. Parameters 1, 2 & 3 from Table 3-4. Passband - The passband, known as the channel wavelength range in ITU-T G.671 is specified as the wavelength range within which a CWDM device must operate with a specified performance. The wavelength range is specified as a maximum channel wavelength deviation around a nominal channel central wavelength. ITU-T G.695 specifies the maximum channel wavelength deviation across all interface types to be ± 6.5 nm. ITU-T G.671 does define a 1 db and 3 db passband width but the parameter is defined in relation only to 58
77 two defined components, Tunable filters and Optical add/drop multiplexer (OADM) subsystems (for WDM). Neither ITU-T G.671 nor ITU-T G.695 defines the db level at which the wavelength range should be measured. Looking at the data sheets of the devices from Table 3-4 every device specifies the passband for each channel having been measured at 0.5 db from the peak insertion loss. Using the standards and the commercial data the value of the maximum channel wavelength deviation to be used in the model is set to 13 nm (± 6.5) at 0.5 db. ITU-T G.695 states that the nominal central wavelength is used as a reference to define both the wavelength limits the transmitter may operate over and the wavelength limits that the multiplexer and demultiplexer specifications must operate to [7]. Ripple ITU-T G.671 defines ripple as the peak to peak insertion loss within a channel wavelength range. Given the limits of optical components, a flat pass band is rarely achieved. In practice, small variations may occur across the passband and are accounted for as so-called ripple. ITU-T G.671 defines the value of this parameter as being for further study. Using the ripple parameters from the commercial data, Table 3-4, it is clear that industry has in effect agreed on its value being < 0.5 db. As ripple is the maximum difference in insertion loss with respect to wavelength the larger the value the greater the change in attenuation a channel will experience with changes in wavelength. Hence when industry specifies its value as < 0.5 db, a worst-case value would be equal to 0.5 db. Channel Insertion loss G.671 defines the channel insertion loss as the reduction in optical power between an input and output port of a WDM device measured in db. ITU-T G.671 again defines the value of this parameter as being 59
78 for further study. Looking at the commercial data in Table 3-4 this figure varies from manufacturer to manufacturer and is likely dependent on the technology being used to implement the multiplexer or demultiplexers. For the purpose of the model, a worst-case insertion loss will be used with a value of 2 db for both the multiplexer and the demultiplexers as all of the devices in Table 3-4 have insertion losses better than 2 db. Channel isolation of a multiplexer or demultiplexer is a measure of a devices ability to reject wavelengths from a channel outside a wanted channels passband. The adjacent channel isolation is a devices ability to reject CWDM channels that use either the next lower or next higher nominal central wavelength. The nonadjacent channel isolation is a devices ability to reject CWDM channels other than the adjacent channels. Parameters 4 & 5 of a multiplexer or demultiplexer from Table 3-4 are illustrated in Figure 3-7 and Figure 3-8, showing adjacent channel isolation and non-adjacent channel isolation respectively. Adjacent channel isolation G.671 defines the adjacent channel isolation as the isolation of the adjacent channel when it is at its maximum wavelength deviation (6.5 nm closer the wanted channel). Figure 3-7 shows a wanted channel with a nominal central wavelength of 1551 nm and its adjacent channel which has a nominal central wavelength of 1531 nm. Both channels are allowed a maximum channel wavelength deviation of ± 6.5 nm. If both channels drift towards each other their wavelengths will be nm and nm as in Figure 3-6. It is at these wavelengths that the adjacent channel isolation is defined. In effect, the adjacent channel should be attenuated by this value in comparison to the wanted channel. 60
79 Adjacent Channel Isolation Nominal central wavelength MUX / DEMUX input filter response Adjacent Channel wavelength range Channel wavelength range λ in nm Figure 3-7 Illustration of adjacent channel isolation in a multiplexer or demultiplexer adapted from ITU-T G.671 Looking at Table 3-4, for most commercial products the adjacent channel isolation is typically set to > 30 db. As ITU-T G.671 defines the value of this parameter as being for further study it is reasonable to use this industry value of > 30 db in the model. As the adjacent channel isolation is a measure of a wanted channels rejection of an adjacent channel s optical power the larger this is the better. Hence when manufacturers specify the adjacent channel isolation as being greater than 30 db a worst-case value would be 30dB. Non-adjacent channel isolation ITU-T g.671 specifies that the non-adjacent channel as all the channels not immediately adjacent to the channel under consideration. The closest non-adjacent channel has a nominal central wavelength 40 nm from the wanted channel. Figure 3-8 illustrates this (with the adjacent channel removed for clarity). Using the same logic as in the Section on adjacent channel isolation the worst-case value to be used in the model will be 40 db. 61
80 Figure 3-8 Illustration of Non-adjacent channel isolation in a multiplexer or demultiplexer adapted from ITU-T G.671 There are several remaining parameters in Table 3-4, specifically parameters 6, 7, 8 & 9. These parameters are judged not to have a significant impact on the model used and developed here to investigate wavelength drift. However, for completeness, each of the parameters is defined below and in each case, a justification is provided as to why this parameter can be ignored in this specific case. Return Loss When modelling unidirectional systems in OptiSystem return loss is not included in the component parameters. As a result, it will not be included in the model. This is acceptable as the only effect return loss has in a unidirectional system is the loss of optical power (due to the light being reflected). This loss of light can be included in the model through the use of the multiplexer or demultiplexer s insertion loss parameter. Furthermore, in CWDM systems due to the robust nature of the sources, isolators are not required as low levels of reflected light will have no impact on the operation of the lasers unlike the case of more sophisticated DWDM lasers. 62
81 Polarisation Mode Dispersion (PMD) ITU-T G.671 defines the PMD as the maximum value of PMD over the channel wavelength and again this parameter is defined as being for further study. As can be seen in Table 3-4 the values of dispersion in commercial multiplexers and demultiplexers are all less than 0.2 ps. Looking at OptiSystem s multiplexer and demultiplexer components, it can be seen that PMD is a parameter that is not included in these components. With regard to simulating a 4 channel CWDM link, this is an acceptable omission from the simulation as the impact of such a small value, (< 0.2 ps) in comparison to chromatic dispersion values of > 100 ps, will have little impact. Polarisation Dependent Loss (PDL) ITU-T G.671 defines the PDL as the maximum insertion loss due to the state of polarisation over a channels wavelength range and again this parameter is defined as being for further study. As can be seen in Table 3-4 the values of dispersion in commercial multiplexers and demultiplexers are all less than 0.3 db. PDL is also a parameter that is not included in the simulation of multiplexers and demultiplexers in OptiSystem. This is an acceptable simplification of the multiplexers and demultiplexers component s simulation as any optical power loss due to PDL can be simulated the use of the multiplexer or demultiplexer s insertion loss parameter. In addition, the polarisation dependence of the input receivers is negligible. Directivity known as bidirectional (near-end) isolation in ITU-T G.671, is another parameter that is for further study. As can be seen in Table 3-4 the minimum value of directivity specified for the commercial multiplexers and demultiplexers is 50 db. OptiSystem does not include directivity as a parameter in its model of multiplexers and demultiplexers. As the simulation under consideration is unidirectional this will not have an impact on the model. 63

82 3.5.2 Multiplexer / demultiplexer filter response validation As mentioned previously the multiplexer and demultiplexer are to a very significant extent the most wavelength selective components employed in the system. Given that the purpose of the model developed here is to explore the impact of wavelength drift, this means that the impact of the response of the multiplexer and demultiplexer is of particular importance. Figure 3-9 shows a screenshot of the implementation of a simulation in OptiSystem. This simulation is being used to model the wavelength response of a multiplexer. The screenshot is shown here to give the reader an appreciation of the software s interface. However, screenshots are complex and contain a large amount of extraneous information so for the purpose of this thesis when discussing any further simulations, simplified, but equivalent, block diagrams will be used for clarity. Figure 3-10 is the block diagram equivalent of the screenshot shown in Figure 3-9. Figure 3-9 Screen shot of OptiSystem interface 64

83 Figure 3-10 Block diagram of simulation components shown in Figure 3-9 The WDM Mux 4x1 component in Figure 3-9, is a generic four port to one port optical multiplexer. In OptiSystem, parameters such as ripple, insertion loss and filter shape can be specified so a large variety of different multiplexers can be modelled. To investigate in detail the response of the mux/demux in simulation, a continuous wave laser with a narrow linewidth is connected to port one of the multiplexer and the wavelength is swept over an appropriate range. By measuring the optical power at the output port of the multiplexer the wavelength response of the multiplexer can be measured. As previously discussed the parameters of the multiplexer are to be set to worst-case values, now listed in Table 3-5. It should be noted that when setting the passband of the multiplexers filter it is defined in OptiSystem at the 3 db points, whereas in practice CWDM multiplexers define it as the 0.5 db points. Multiple iterations of the simulation were run varying the 3 db passband parameter until a 13 nm passband between the 0.5 db points was achieved. The multiplexer has the option of picking three filter shape parameters, rectangular, Bessel or Gaussian and what order the filter should be. It was found that the use of a 65
84 third order Gaussian filter best fits the required parameters of the multiplexer in Table 3-5. The filter centre wavelengths of the mux/demux are set to 1511, 1531, 1551 and 1571 nm as per the ITU-T G.695 application code S-C4L1-1D2. Table 3-5 Worst-case parameters of a four port CWDM multiplexer Parameter Passband Ripple Channel Insertion Loss Adjacent Channel Isolation Non-Adjacent Channel Isolation Worst-case value 13 nm 0.5 db 2 db 30 db 40 db Figure 3-11 shows the wavelength response of the 1511 nm input port of the four-port multiplexer. The passband and the adjacent channel isolation are clearly labelled. Table 3-6 shows the wavelengths that the 0.5 db and 30 db points should intersect with and the points achieved in the simulation. Figure 3-11 Wavelength response of the 1511 nm input port of the four-port multiplexer 66
85 Table 3-6 Desired 0.5 db passband and 30 db adjacent channel isolation wavelength intersection points and simulated results Lower wavelength bound Upper wavelength bound Central wavelength 1511 nm Specified 0.5 db passband wavelength = nm = nm Net specified passband (nm) 13 nm Simulated 0.5 db passband nm nm wavelength Net simulated passband (nm) nm Specified 30 db wavelength = nm = nm Simulated 30 db wavelength nm nm It should first be noted that the filter is not perfectly symmetrical around 1511 nm. This is due to how OptiSystem models a Gaussian optical filter. The filters transfer function is H(f) = αe ln( 2)(f f c B 2 )2N where H(f) is the filter transfer function, α is the insertion loss, f c is the filter centre frequency, B is the bandwidth, N is the filters order and f is the frequency. The bandwidth in Hz is equally distributed either side of the centre frequency, f c. The start and stop frequencies of the filters passband when converted into nm will not result in symmetrical wavelengths as λ = c. This can be illustrated f using the nominal central frequencies of three DWDM lasers equally spaced apart by 100 GHz as specified in ITU-T G Table 3-7 shows the frequency in THz of the three sources and their wavelengths λ, calculated using λ = c f where c is the speed of light in a vacuum. The difference in the wavelength between sources 1 and 2 and sources 2 and 3 are in the final column. As can be seen, although the sources are equally spaced in frequency (100 GHz), they are not equally spaced in wavelength. The same principle applies to the simulated Gaussian optical filter with its 0.5 db passband wavelengths not being symmetrical around 1511 nm with values of nm and nm. 67
86 Loss in db Table 3-7 Frequency and wavelength of three sample DWDM frequencies Frequency of DWDM source in λ = c f Wavelength difference Source THz nm Source THz nm However, this is not an issue as the difference is firstly very small, with the worst-case occurring for the lower wavelength bound with a value of 6.64 nm, an error of < 0.7% of the ideal 6.5 nm maximum deviation. Using OptiSystem the simulated filter shapes for the four wavelengths in the mux are shown in Figure 3-12 with the filters of the demultiplexer being the same Channel mux/demux wavelength response Wavelength in nm 1511 nm channel 1531 nm channel 1551 nm channel 1571 nm channel Figure 3-12 Simulated results, wavelength response of the OptiSystem 4 channel mux/demux 68
87 3.5.3 Transmitter parameters and validation The simulation package OptiSystem has a variety of options to model optical sources and transmitters with varying degrees of parameter control. For example, a continuous wave laser can be paired with a Mach-Zender modulator to model a typical DWDM system laser. The component used in this simulation, the so-called Directly Modulated Laser Measured allows parameters to be specified such as frequency, power, extinction ratio, rise and fall time, side modes, noise, chirp and others. It should be noted again that this Chapter is looking at the parameters of the various components in the model in the context of a simulation that explores the effect of wavelength drift on a CWDM channel. As such, where defined values are available from the standards, worst-case values in the context of the model will be used. Where parameters are not clearly defined in the standards a short survey of values taken from the specifications of commercial devices will be used. Where the parameter is not typically specified in datasheets values from the literature will be used. Table 3-8 shows a list of the parameters, as well as a rational as to the values used, for the CWDM transmitters used in the model that are set using data from the relevant application code, S-C4L1-1D2 in ITU-T G
88 Table 3-8 Transmitter parameter values available in ITU-T G.695 Parameter Values used Rational Central wavelength Bit rate taking account of line coding of the optical tributary signals Mean channel output power 1511, , , Mbit/s to 2.67 Gbit/s 0 dbm to +5 dbm Tx1 will nominally be set to 1511 nm and allowed to drift to simulate wavelength drift due to temperature or some other factor. Tx2, Tx3 & Tx4 will be set to their worst-case values, that is 6.5 nm less than their nominal values. These are worst-case values, in particular for Tx2 as in effect it has drifted towards Tx1 and may now interfere with Rx1. 6 ITU-T G Optical tributary signal class NRZ 2.5G applies to continuous digital signals with non-return to zero line coding, from nominally 622 Mbit/s to nominally 2.67 Gbit/s. The worst-case value of bit rate is chosen as the maximum at 2.67 Gbit/s as this will give bit rates with the smallest bit interval. These bits will be more susceptible to dispersion and timing errors. Tx1 will be set to +0 dbm. The minimum mean channel output power as this would be a worstcase scenario from the perspective of channel interference onto Rx1. Tx2, Tx3 & Tx4 will be set to +5 dbm, the maximum mean channel output power as this would be a worst-case scenario from the perspective of channel interference onto Rx1. Minimum channel extinction ratio 8.2 db All transmitters extinction ratios will be set to 8.2 db as this is a minimum, worst-case value. 6 In practice, it is unlikely that the wavelengths of two adjacent channel s lasers will drift in opposite directions as most drift is caused by temperature and it can be reasonably assumed that the lasers will undergo similar temperature variation. 70
89 A number of other CWDM transmitter parameters are not directly specified by ITU-T G.695, but must be set by manufacturers such that a certain bit error rate or dispersion values are met. These are discussed below. Linewidth As discussed in Section 2.4 DFB lasers in CWDM systems are typically directly modulated. A short survey of laser diode devices for CWDM applications typically shows the maximum linewidth / spectral width of the lasers as being specified to be < 1 nm, which includes a contribution from chirp. A search of the literature gives typical values of linewidth in DFB lasers of < 10 MHz [9]. It should be noted that using this value in OptiSystem give a linewidth of 10 MHz for an unmodulated laser. In practice, the simulation will include contributions from Chirp and hence the spectral width of the source will be greater than 10 MHz. Chirp As discussed in Section 2.4, chirp is an important parameter of a directly modulated CWDM DFB laser diode (directly modulated laser DML) transmitters, especially in the context of dispersion. The frequency chirp Δυ of a DML can be modelled as [9]: Equation 6 Frequency chirp of a directly modulated laser diode v = 1 dφ 2π dt = α 4π ( 1 dp(t) + k P(t)) P(t) dt where φ is the phase, P(t) is the output power as a function of time (t), α is the linewidth enhancement factor, and κ is the adiabatic chirp coefficient. The first term containing the chirp parameter α represents the dynamic chirp and the second term containing chirp parameter k represents the adiabatic chirp. The α and κ values will vary due to laser 71
90 design and manufacturing variation. Typical values quoted in the literature are α ~ 3 and κ ~ 20 THz/W [9] and hence will be used in the model. Relative Intensity Noise Values of relative intensity noise (RIN) typically range from -110 db/hz to -130 db/hz for low-cost edge emitting multimode laser diodes and less than -170 db/hz for highquality DFB lasers [46]. A short survey of CWDM sources results in typical values of RIN of 145 db/hz at 10dBm. Other parameters Transmitter parameters such as rise and fall time, pulse overshoot and pulse undershoot and ringing can be observed by the use of an eye diagram. ITU-T G.695 does not directly specify values for these other parameters but references the use of an eye diagram and an eye mask as in ITU-T G Rather than measuring each parameter of an eye pattern, mask testing means defining no-go areas such that if the pattern encroaches into these areas, the device under test is deemed to have failed. These areas are defined in an eye mask. To ensure a suitable transmitter signal, the manufacturers control the transmitter to prevent excessive degradation at the receiver by using the eye mask specified in ITU-T G

91 Figure 3-13 shows the test setup for an optical transmitter as specified in ITU-T G.957. The laser is being tested at SS the single-channel reference point discussed in Section 1.6. Figure 3-13 Measurement set-up for a transmitter eye diagram reproduced from ITU-T G.957 The transfer function of the receiver in Figure 3-13 is characterised in the standards by a fourth order Bessel-Thomson response as in Equation 7. Equation 7 Fourth order Bessel-Thomson transfer function With H(p) = ( y + 45y2 + 10y 3 + y 4 ) p = j ω ω r y = p ω r = 1.5πf 0 f 0 = bit rate The reference frequency is f r = 0.75f o. The nominal attenuation at this frequency is 3 db. 73
92 The test system in Figure 3-13 was implemented in OptiSystem using the transmitter parameters discussed previously and the default values of parameters such as rise and fall times, pulse overshoot and pulse undershoot. The resulting eye diagram (in black) and eye mask (red boxes) are shown in Figure An acceptable transmitter eye diagram must not cross into the mask, which is defined in ITU-T G.957. Figure 3-14 Transmitter eye diagram with STM16 eye mask from OptiSystem simulation Optical fibre parameters The OptiSystem component Optical Fibre CWDM has been chosen to model the fibre in the model. It simulates the propagation of an arbitrary configuration of optical signals in a single-mode fibre [47]. As previously discussed the parameters of the component will be set to model ITU-T G.652.D single-mode fibre using worst-case values were appropriate as shown in Table
93 Table 3-9 Selected parameters of an ITU-T G.652.D single-mode fibre Parameters Values Comment Attenuation db/km The attenuation coefficient has a typical link value of db/km over the 1530 nm to 1565 nm range. A survey of manufacturers shows that manufacturers routinely surpassed this value. Hence a worst-case value of db/km will be used. Attenuation vs wavelength Chromatic dispersion coefficient Polarisation mode dispersion (PMD) coefficient NA D1550 = 17 ps/nm.km S1550 = ps/nm 2.km PMDQ = 0.20 ps/ km The wavelength dependence of the attenuation of a single mode fibre over the C and L bands is low with manufacturers supplying optical fibres with wavelength dependences of only 0.02 db/km over a 1525 nm to 1575 nm window. In the model under consideration as the source will be drifting by only 6.5 nm, the wavelength dependence is negligible and hence will not be included. The dispersion values in ITU-T G.652.D are routinely surpassed by manufacturers hence it is reasonable to assume the values presented are worst-case. ITU-T G.652.D specifies a worst-case value of the PMD coefficient. The obvious missing parameter from Table 3-9 above is fibre length. As will become evident when the simulation is run, one of the requirements will be the ability to set the simulated system so that it just operates at the limit of an acceptable BER. For this purpose, the simplest approach is to vary the degradation of the signal arriving at the receiver. The simplest system parameter to control in order to vary the signal degradation (and thus the BER) is the fibre length. Other system parameters could have been chosen, for example, the transmitter output power levels, but transmitter output powers are controlled within specific ranges as previously discussed. For the purpose of 75
94 the model, the length of the fibre is set so that the when the transmitter is at its maximum wavelength deviation of 6.5 nm the BER at Rx1 is 1x Receiver parameters OptiSystem typically uses a PIN photodiode component and a fourth order Bessel- Thomson low pass filter component to model a receiver. The main PIN photodiode component parameter under consideration is the responsivity. Although the responsivity of PIN photodiodes is very dependent on wavelength over the 800 nm to 1700 nm window, due to the narrow range of wavelengths being used in this model and the typically flat response over this narrow wavelength range in InGaAs photodiodes, the responsivity parameter can be set to a typical value of 1 A/W. ITU-T G specifies a reference receiver and uses a fourth-order Bessel-Thomson filter with a cut-off frequency at 0.75 times the bit rate in question. 3.6 Using the model to analyse BER and wavelength drift OptiSystem has a simulated BER Test Set tool built into the software. It is often not practical to use this tool to measure the BER of a link. In theory, the transmission of one trillion bits must be simulated if a link has a bit error ratio of 1x10-12 to find one error. As previously discussed due to the random nature of noise in the system the bit error rate is not constant. That is, there will not be exactly one error per trillion bits transmitted. As a result, when using a BERT set (simulated or real) many multiples of the one trillion bits must be transmitted to get a statistically accurate BER. To simulate the transmission of trillions of bits is not practical as the transmission of each individual bit must be simulated which can take an order of magnitude longer than the bit interval, on typical PC hardware. 76
95 An alternative to directly measuring the BER offered by OptiSystem is to make an estimation of the BER by measuring the signal s signal-to-noise ratio. OptiSystem has a BER Analyzer component that uses numerical methods to estimate the BER [47] [48] [49] [50]. An important parameter in OptiSystem simulations is the bit sequence length. The larger this is the more accurate and repeatable results such as BER are. The price for increased accuracy is simulation time. The first simulation uses the model illustrated in Figure 3-15 to identify a fibre length that will give a reference BER of 1x10-12 at Rx1 under worst-case conditions. Then using this worst-case model as a reference, parameters such a source s wavelength can be changed and evaluated against the reference model s BER. The model s parameter values were set to worst-case values as previously discussed and the links length was set such that the BER at Rx1 is exactly 1x This was achieved using a Single Parameter Optimisation (SPO) routine in OptiSystem and averaging of simulation results. This routine will vary a selected parameter over a set range until a second parameter reaches a desired result. The wavelength for Tx1 that has drifted by +6.5 nm to nm is nominally 1511 nm and at this maximum wavelength deviation, with the optical fibre length parameter adjusted so the BER at Rx1 is 1x
 until a BER of 2.0x10⁻¹² was achieved at Rx1.")
96 Figure 3-15 OptiSystem model - SPO varying optical fibre length to achieve BER of 1x10-12 at Rx1. The model is then adapted, Figure 3-16, to identify by how much a wavelength must drift beyond its 6.5 nm deviation to degrade the BER to 2.0x10⁻¹² as calculated in Section 3.4. An SPO was used that varied the source wavelength (Tx1) until a BER of 2.0x10⁻¹² was achieved at Rx1. The result of this model is that an additional drift of nm will degrade the BER to 2.0x Using the argument developed in Section 3.4 it can be said that if the accuracy of the wavelength monitor is better than nm, then the confidence with which drift can be measured is comparable to the confidence which engineers and designers accept in measuring BER. For example, an engineer will accept that a BERT that is returning a BER of 1x10-12 with a 95% confidence level could mean an actual BER value that is as high as 2.0x This level of doubt regarding the BER value is accepted by the engineer and by implication it is asserted that a wavelength measurement inaccuracy up to nm is also acceptable since it also results in, under the condition discussed, the same BER of 2.0x
97 Figure 3-16 OptiSystem model - SPO varying Tx1 wavelength to achieve BER of 2.0x10⁻¹² at Rx Summary Different approaches to determining an acceptable wavelength accuracy for a CWDM wavelength monitor were considered. The chosen approach arose from observations of the results from a model of how wavelength drift impacts the most important system parameter in CWDM systems, which is error performance. The statistical confidence levels of BER measurements taken by typical industry test and measurement equipment was considered and their statistical worst-case BER results were calculated. A model was built and its components validated using a selection of worst-case parameters sourced from ITU-T Recommendations and manufacturers datasheets. Using the model, the wavelength drift in excess of ± 6.5 nm that gave an equivalent degradation of the worst-case BER was calculated. The argument was made that if the accuracy of the wavelength monitor is better than nm, the value of the excess wavelength drift, 79
98 then the confidence with which drift can be measured is comparable to the confidence which engineers and designers accept in measuring BER. The next Chapter will consider a CWDM wavelength monitors specification and investigate possible operating principles for a proof of principle implementation. 80
99 4 CWDM wavelength monitor specification and implementation. 4.1 Introduction The previous Chapter focussed on determining a reasonable value for the accuracy of a wavelength monitor for use in CWDM systems. While wavelength accuracy is a central attribute, it is nevertheless just one of a number such attributes for a wavelength monitor. A knowledge of the required accuracy and the specification of other attributes will play an important role in the choice of wavelength measurement technique. For the application under consideration here, some wavelength measurement techniques may not be suitable as they operate over a very narrow wavelength range or may require large amounts of optical power. This Chapter will first identify these other attributes that are essential in a specification whilst also establishing values for these attributes. In this way, a comprehensive specification for the CWDM wavelength monitor is developed. Using this specification, a range of wavelength measurement technologies, with different operating principles which have the potential to form the core of a CWDM wavelength monitor system can be considered and compared, with the aim of extracting a candidate technology that can meet the specification without burdening the system with unnecessary complexity. As outlined in Chapter 1, one of the candidate technologies will be selected for a proof of principle implementation described in Chapter 5. 81
100 4.2 CWDM instrument attributes There are a large number of wavelength measurement instruments currently available for use in test and measurement applications in the optical communications industry. These instruments use various technologies to measure wavelength across a range of applications, such as research, manufacture, component characterisation, network deployment and network performance monitoring. Each application will have varying requirements with regard to their attributes. Focusing on instruments marketed to the CWDM industry, a survey was undertaken, the results of which are representative of the different types of instruments available from a range of manufacturers and include wavelength measurement and channel analyser type instruments 7. The survey identifies a number of attributes which are commonly specified for these types of CWDM test and measurement equipment. These attributes can be separated into two groups, the first of which are called the parameters. These parameters are typically related to an instruments measurement and operational capabilities, for example, the degree of accuracy and resolution with which an 7 Wavelength measurement instruments are generally more general-purpose instruments and when used on a CWDM system will typically return a value for the wavelength of a single channel under test with some, such as an OSA, capable of presenting a spectrum showing the individual wavelengths of the multiplexed signal. Channel analysers for CWDM are more specific instruments, in that the instrument is often pre-set with the specification of CWDM systems. Such instruments can identify and measure channel peak CWDM wavelengths, with a range of functionality. Some channel analysers are comparable to a multi-channel power meter, i.e. they indicate which wavelength window a channel belongs to (e.g nm ± 6.5 nm) and its optical power but no further information about the wavelength is presented. 82
101 instrument can make a measurement. The second group of attributes can be better described as features. These features are not essential attributes of the measurement instrument but will typically make an instrument easier to operate, for example the inclusion of a high-resolution colour display and wireless connectivity or will provide some other information not related to the instruments measurement capabilities such as its physical dimensions. As consideration of the common features of the instruments used for CWDM test and measurement is the simpler task, this is the starting point in this Chapter, with consideration of the more complex task around the parameters following on. 4.3 CWDM wavelength measurement instrument features Table 4-1 lists the features of the representative CWDM wavelength measurement and monitoring instruments surveyed. Although the features listed are not all necessary for CWDM wavelength monitoring, several of them may be desirable. A wavelength monitor for use in monitoring wavelength drift (often because of fluctuations in temperature) may be required to be left in situ for long periods of time, from hours to many days or weeks. It is desirable that such an instrument be competitively priced so that it would be economical to dedicate a number such instruments to be left in place monitoring wavelength for long periods of time. Leaving high-value wavelength measurement instruments such as an OSA in situ for long periods of time would be not economical in many cases. In addition, a feature such as no moving parts would typically mean that the instrument is rugged and cheaper to manufacture. Table 4-1 lists the common features and in each case, a comment as to the necessity of the feature and a rating of the feature, as essential, recommended or optional. To show how common 83
102 each feature is, they are numbered showing the instruments from the representative survey (legend is at the bottom of the table) that list this or a similar feature in their marketing brochures. After considering the features in Table 4-1, the features rated essential are considered important enough that they should be implemented. Therefore, these essential features will be included in the specification of the CWDM wavelength monitoring instrument and will inform the choice of technology used to implement a proof of principle wavelength monitor in Chapter 5. 84
103 Table 4-1 Features of a representative survey of CWDM wavelength measurement and monitoring instruments Features (Legend for numbering in italics at end of table *) Pre-stored or user-defined threshold values for easy Go/No Go testing 1,2,5,12,14 Display e.g. High resolution, widescreen colour display that is easy to read indoors or out. 1,2,4,5,7,9,12,13,14 Rugged, sealed design provides years of service in the most challenging environments.1,5,7,8 Handheld device e.g. Compact and lightweight design for maximum portability in the field. 1,2,3,6,8,9,12 Dimensions and weight. 1,2,3,4,5,6,7,8,9,10,11,12,13 Capable of measuring the optical power of a CWDM channel. all devices Comment A useful feature that may make the instrument more user-friendly. May be a desirable feature, but will add considerable cost to the instrument. Possibly a desirable feature but in the context of use in a data centre type environment may not be needed. As with any piece of portable test equipment, it should include these features if technically possible. Typically, it should be capable of being easily stored when in use within or adjacent to the rack system types used for CWDM equipment. See above All the devices surveyed are capable of measuring the optical power of the channel/channels under test. Although not an absolutely necessary feature, it is apparent from the many instruments surveyed that it would be unusual for a wavelength measurement or channel analyser type instrument to be incapable of measuring optical power since this capability provides important additional insights for network troubleshooting. Rating Optional Optional Optional Essential Essential Essential 85
104 Measuring units dbm/db/mw. 4,11 This is a useful feature but may not be necessary. Optional Save stored measured data to PC, memory card or over a network connection to the cloud. 1,3,4,5,7,9,10,11,12,13,14 An instrument left in situ must have some form of internal storage or alternatively, remote monitoring of the instrument would be valuable considering the instrument may be in situ for many weeks at a distant location. Recommended High reliability e.g. No moving parts. 1,8,12,14 Compliant to ITU-T G and or ITU-T G.695 1,2,6,8,10 Battery operated, all devices An instrument with no moving parts would potentially be easier to manufacture which can result in a more economic instrument. An instrument with no moving parts may also be more rugged and possibly less sensitive to changes in temperature. This is an important feature as it will give users confidence that the wavelength monitor can tell if any channel across all ITU-T application codes is out of specification. Every device surveyed can be operated by battery with some devices capable of also being mains powered. An instrument that is to be left in situ, possibly for weeks will need to be mains powered or powered from a local source. Essential Essential * Numbered list of CWDM wavelength measurement and monitoring instruments, representative of the different types of instruments available from a range of manufacturers and includes optical spectrum analysers, wavelength monitors, and channel meters. 1) Anritsu MT909020A optical channel analyser 8) Bayspec CWDM optical channel performance monitor Recommended 2) JDSU COSA4055 CWDM optical spectrum analyser 3) Deviser AE600 CWDM channel analyser 4) EXFO FOT5200 channel analyser 5) Terahertz Technologies Inc. FTE8000 CWDM channel analyser 6) NSG America Inc. GoFoton CWDM optical power tester 7) Integra Networks CWDM optical power and wavelength meter 9) JDSU OCC-55 smart optical CWDM channel checker 10) Sunrise Telecom optical channel monitor modules 11) Optoware 16 channel CWDM power meter 12) Photop 18 channel optical power meter 13) Precision rated optics OSA118 CWDM channel analyser 14) VeEX RXT-4500 optical spectrum analyser 86
105 4.4 CWDM wavelength monitor parameter specification This Section considers the parameters typically listed for wavelength measurement and channel analyser type instruments for use in CWDM. Table 4-2, on page 88, lists the parameters commonly specified for the instruments surveyed. Following Table 4-2 each parameter is considered in the context of a CWDM wavelength monitor for use in monitoring wavelength drift in CWDM systems and a rationale for the proposed value of the parameter are made. These proposed values are specified in Table 4-2. As already stated the parameters listed are from a selection of wavelength measurement and channel monitoring CWDM test and measurement equipment types. Given that this thesis is considering a wavelength monitor for use in wavelength drift measurements, some of the parameters listed may not be applicable to such a device and as such the last column of Table 4-2 identifies whether the parameter is a key parameter, desirable parameter or not applicable. For the sake of clarity, the definitions of these parameter types are: Key parameter In the implementation of a CWDM wavelength monitor for use in wavelength drift measurements, a key parameter is a parameter that is an essential part of the specification; Desirable parameter - In the implementation of a wavelength monitor for use in wavelength drift measurements, a desirable parameter is an additional parameter that will bring some added value to the instrument. In some cases, the specified value of such parameters will be determined by the choice of technology used to implement the wavelength monitor; Not applicable As the list of parameters is taken from a selection of wavelength measurement and channel monitoring type CWDM test and measurement equipment, not all the parameters will be relevant to a wavelength monitor for use in wavelength drift measurements and hence will be labelled, not applicable. 87
106 Table 4-2 Summary of key parameters values for representative selection a CWDM wavelength measurement instrument. Key Parameters Parameters of typical instruments Instruments surveyed specifying this parameter 8 Proposed value for use in a wavelength monitor, rationale below Wavelength specific parameters Wavelength window mode 9 4,5,6,7,11,12 NA Not applicable Absolute wavelength range 10 1,2,3,8,9,10,13, nm to 1621 nm Key parameter Absolute wavelength accuracy 1,2,8,9,10,13, nm Key parameter Wavelength resolution 2,10,14 Better than nm Key parameter Power range per channel All devices -28 dbm to +5 dbm Key parameter Power meter capability parameters Channel power accuracy 1,2,4,5,7,9,10,11,12,14 1 db Desirable parameter Channel power resolution 2,5,7,8,10, db Desirable parameter Channel power repeatability 1,9,10, db Desirable parameter More general parameters Environmental operating temperature 11 1,2,3,4,7,9,10,12 5 C to 45 C Key parameter Relative humidity 1,4,10 8% to 90% [20] Key parameter Measurement time 2,3,5,8,9,10,13,14 Circa 1 second Desirable parameter EMC capability 1,9 EN61326 Key parameter Key parameter, Desirable parameter, Not applicable (rationale provided below) 8 Legend of instruments can be found in Table Of the instruments surveyed, some do not return a value of a channels absolute wavelength, but the nominal central wavelength and power of the channel under test. 10 These instruments will return an absolute value of wavelength with varying degrees of accuracy over the CWDM wavelength range. 11 Environmental operating temperature range considered in Section
107 4.4.1 Key parameter rationale Wavelength window many of the devices that specify this parameter do not attempt to measure a channel's wavelength accurately but instead simply indicate to the user whether the channel under test lies within the window of a particular nominal central wavelength ± 6.5 nm. This parameter is not applicable to the wavelength monitor being considered, as by definition a wavelength monitor needs to provide a far greater level of wavelength accuracy, rather than simply the presence or absence of a channel in a given window. Calibrated wavelengths / Absolute wavelength range This parameter can be interpreted as the wavelength range that the wavelength monitor must operate over. A wavelength monitor for use in CWDM must be capable of measuring the wavelength of any of the channels in ITU-T G.694.2, from the lowest wavelength channel to the highest wavelength channel. In addition, for the channels at the extreme ends of the CWDM range, that is 1271 nm and 1611 nm, the measurement range available must take account of a channel's potential wavelength drift below 1271 nm or above 1611 nm. Specifically, the nominal wavelength of the channel at 1271 nm may drift by 6.5 nm to nm and the nominal wavelength of the channel at 1611 nm may drift by +6.5 nm to nm. Furthermore, since one cannot predict within reason how far outside a window a channel might drift in practice, the wavelength monitor should also be capable of measuring the wavelength of the 1271 nm or 1611 nm channel that has drifted beyond its maximum wavelength deviation of 6.5 nm so that an engineer using the wavelength 89

108 monitor can measure this excessive drift. A key question is to what extent the wavelength monitor should be capable of measuring this excessive wavelength drift, that is below nm and above nm. This question can be answered in the context of the guard band between channels. Figure 4-1 shows a 7 nm guard band between the adjacent channels 1591 nm and 1611 nm and for illustration purposes, an imaginary CWDM channel at 1631 nm is shown. The key assumption is that excessive drift, which is significantly outside the ±6.5 nm central wavelength deviation can be defined for the purpose here, as drift which places a CWDM channel in the middle of the guard band, where a channel is prohibited from operating in the CWDM specifications. Figure nm 1591 nm and 1611 nm ITU-T G Channels with an imaginary channel at 1631 nm for illustration purposes only Thus, from Figure 4-1, although the 1611 nm channel does not have an adjacent channel at an even higher wavelength (see Figure 4-1 and the 1631 nm imaginary channel for illustration only), a wavelength monitor s range should allow measurement of a wavelength drift of +10 nm, halfway into the guard band between the 1611 nm and the 90
109 imaginary 1631 nm channels. That is, 1611 nm +6.5 nm plus an additional 3.5 nm. Under normal operation, it is highly unlikely that a CWDM channel will drift by more than this amount. In any event, a CWDM channel experiencing this level of drift will suffer significant attenuation due to the demultiplexer s filter roll-off which could result in a catastrophic degradation of the BER, on all but the very shortest links. Using this reasoning it is considered that a wavelength monitor should have a total wavelength range of 1261 nm to 1621 nm. Wavelength resolution a definition of resolution is Resolution - the smallest amount of input signal change that the instrument can detect reliably. This term is determined by the instrument noise (either circuit or quantization noise) [51]. The wavelength monitor under consideration monitors changes in wavelength drift within ± 6.5 nm of a channels nominal wavelength and in particular a change in wavelength outside this range that will cause an unacceptable degradation of the BER. Considering this, a resolution that is many times better than the accuracy will not contribute anything further to this key goal. Hence one can conclude that a minimum value for resolution must be at least equal to the value of the accuracy of nm. It should be noted that increasing an instrument resolution can give a false impression of greater accuracy and can also cause undesirable display instability [52]. Absolute wavelength accuracy In Chapter 3 an acceptable value of wavelength accuracy for a CWDM wavelength monitor was calculated as nm. To reiterate, using the logic that an engineer will accept that a BERT that is returning a bit error rate of 1x10-12 with a 95% confidence level could potentially have a BER value that is as high as 2.0x This level of doubt regarding the BER value is accepted by the engineer and by implication it is 91
110 asserted that a wavelength measurement inaccuracy up to nm is also acceptable since it also results in, under the condition discussed, the same BER of 2.0x In the context of this thesis, the wavelength accuracy is the possible error in wavelength when the device reports a measurement of wavelength in comparison to the true value of the wavelength. As will be discussed in more detail later, of the CWDM instruments surveyed (wavelength meters, optical spectrum analysers and wavelength monitors) the accuracy with which wavelength is measured varies from 50 pm to greater than 5 nm with some devices not specifying accuracy at all. This work found that instruments are typically calibrated against a known standard to maximise the agreement between the measured value and the known standard. Hence, this work concludes that wavelength accuracy ultimately depends on the engineering of a device and the calibration process used. Therefore, it is assumed that a wavelength measurement technique that can measure wavelength with a resolution equal to or better than the required wavelength accuracy can with appropriate calibration and engineering measure wavelength with the required accuracy. Power range per channel this specification seeks to identify the maximum and minimum input powers that will arise at the input to a wavelength monitor operating from an active CWDM source. This data can easily be extracted from ITU-T G.695. The wavelength monitor will experience maximum input power when it is placed close to the optical transmitter. Looking at all application codes in ITU-T G.695 the highest maximum mean channel input power is +5 dbm, hence this is the maximum value of the power range per channel selected for the specification. The wavelength monitor will 92
111 experience minimum input power when it is placed at the optical receiver end of a system, where the maximum fibre span is in use. Again, considering all application codes in ITU-T G.695 the lowest minimum receiver sensitivity is -28 dbm, hence this is the minimum value of the power range per channel. In summary, the wavelength monitor must be capable of measuring the wavelengths of channels with optical powers ranging from -28 dbm to +5 dbm. Channel power accuracy, resolution and repeatability Since the instrument being considered is a wavelength monitor for use in CWDM systems, specifically for the measurement of wavelength drift, of the wavelength measurement and channel analyser type instruments surveyed, all are capable of measuring optical power and as already discussed in Table 4-1 this has been deemed an additional but essential feature of a wavelength monitor. The accuracy, resolution and repeatability with which optical power can be measured in these instruments are usually a function of the wavelength measurement technique. However, the primary purpose of the instrument is to monitor wavelength, therefore the accuracy of wavelength measurement is preeminent and takes priority over parameters related to power measurement. For these reasons the channel power accuracy, resolution and repeatability are defined as desirable parameters. That is, a power measurement feature will be implemented on the wavelength monitor with a goal of achieving the specifications below but with the final power meter specifications being a function of the wavelength measurement technique. Of the CWDM wavelength measurement instruments surveyed the accuracy; resolution and repeatability are typically 1 db, 0.1 db and 0.3 db respectively. If the wavelength measurement technique does not support power measurement to the above specification further 93
112 engineering will not be carried out to achieve the goal as it is an additional feature and not the primary function of the meter. Environmental operating temperature As discussed in Section 2.5, it can be assumed that CWDM sources and modules will typically be operated in temperature controlled environments and can be expected to operate over a temperature range of 5 C to 45 C, typical of modern telecommunications and computing equipment. It follows that an instrument that can carry out long-term wavelength monitoring of CWDM equipment must be capable of long-term operation over the same temperature range. Relative humidity This is being defined as a key parameter as it is expected that the instrument will be monitoring wavelength in situ for long periods of time and must operate reliably in a typical CWDM environment. In addition, there is the possibility that CWDM systems will be deployed in unexpected environments. To identify a reasonable value of relative humidity first one must consider that CWDM is typically being placed in data centre type, controlled environments, and one would not consider that there are likely to be extremes of relative humidity. As previously discussed in Section 2.5 The American Society of Heating, Refrigerating and Air-Conditioning Engineers (ASHRAE) publishes thermal guidelines for data processing environments. Its guidelines for relative humidity vary over a number of environmental classes with classes A1, A2, A3 & A4 being applicable to datacentres with varying levels of environmental control from tightly controlled to some control. As Class A4 has the widest range of allowable relative humidity of 8% to 90% the key parameter, relative humidity is chosen to meet these values. 94
113 Measurement time Of the instruments surveyed the length of time to take a measurement (or to scan a WDM signal) varies from 20 ms to 1 minute with the instruments for use on a single wavelength channel taking less than a second. This difference in measurement times is a function of the basic measurement principle (passive technique or an active technique with moving mechanical parts) or the electronics involved (for example are measurement signals integrated or averaged to improve accuracy or is a large amount of signal post-processing carried out on measurements). When considering the length of time a wavelength measurement should take for a wavelength drift monitor, the causes of wavelength drift and their time constants must be considered. For example, are the likely changes in wavelength slow gradual changes taking many seconds or minutes to occur or does the wavelength change occur very rapidly, in the order of tens of ms? Wavelength drift due to changes in temperature, of necessity involves time constants in the order of seconds and minutes, given the likely sources of temperature change and the thermal time constants of the components and devices involved. Failure modes of laser diodes also need to be considered and the timescales that they happen over. Failures of laser diodes can be generally defined as either random failures or wear-out failures. Random failures can be characterised by a lasers performance rapidly deteriorating and are typically the result of catastrophic optical damage to the laser s facet or serious deterioration of the heat sink or bonds, that results in permanent system failure [53]. Random failures could in principle involve rapid changes in wavelength, which could persist until overall device failure takes place. Wear-out failures are usually the result of growth defects of the laser's active region and failures due to dislocation growth and metal diffusion, amongst others, that can lead to 95
114 shortening or lengthening of a laser diodes wavelength [54]. Lasers affected by wearout failures will exhibit a slow degradation in their performance and consequently will exhibit a slow change in their operating wavelength, over many weeks months and years. In conclusion, while random failures could involve the fastest changes in wavelength, their occurrence is associated with system failure. Since system failure will be detected by other means, a wavelength monitor for use in monitoring wavelength drift need not be capable of measuring the rapid wavelength changes that may be associated with random, catastrophic and near instant failures. A wavelength monitor should be capable of measurement speeds consistent with wear-out failures and failures caused by thermal drift. The single channel measurement instruments surveyed typically can take a measurement in less than 1 second. Changes in wavelength due to thermal drift and wear-out failure modes envisaged have time scales of the same order. Since it is not possible to define the measurement speed more reliably, pragmatically it makes sense to let the limit on the measurement speed achievable be a function of the wavelength measurement technology used, with the caveat that there is no point in striving to achieve high speed at the expense of complexity or cost. Hence the measurement time will be considered a desirable parameter with a target measuring speed circa 1 second. EMC (Electromagnetic compatibility) The European Commission s EMC Directive 2014/30/EU includes EN61326, the EMC standard for Electrical equipment for measurement, control and laboratory use [55]. EN determines the requirements for emissions and immunity regarding electromagnetic compatibility for electrical 96
115 equipment that operates from a supply, battery or circuit being measured [56]. As a directive of the European Commission, this is a Key parameter that must be met Additional parameters Other parameters commonly specified for optical components include polarisation dependent loss (PDL) and return loss. Polarisation dependent loss (PDL) ITU-T G.695 does not specify a maximum PDL for CWDM systems but stipulates a maximum channel insertion loss. The multiplexers and demultiplexers in CWDM systems are known to be polarisation dependent. From the perspective of a wavelength monitor, PDL need only be considered in the context of its effect on the wavelength monitors wavelength accuracy. For this reason, the PDL has not been specified. Return Loss ITU-T G.695 specifies the optical return loss of a CWDM system as being measured at point SS (single-channel reference point, see Figure 1-3) and defines return loss as the ratio of the incident optical power to the total returned optical power from the entire fibre plant. Across the different application codes in ITU-T G.695, the tightest specification for return loss is 24 db. A CWDM wavelength monitor will contribute to the total return loss being measured at point Ss. A cursory examination of wavelength measurement instruments would indicate that their return loss is typically specified as db, 11 db better that 24 db. Therefore, it is likely that the return loss of a CWDM monitor will also be significantly better than the 24 db required. For this reason, the return loss will not be considered further. 97
116 4.4.3 Final specification In conclusion, Table 4-3 consolidates the key parameters and essential features discussed above. The next Section will consider different wavelength measurement techniques and their appropriateness with regard to these key parameters and essential features. Table 4-3 Specification of the attributes of a CWDM wavelength monitor Attributes Key Parameter Absolute wavelength range Absolute wavelength accuracy Wavelength resolution Specification 1261 nm to 1621 nm nm Better than nm Power range per channel Environmental operating temperature -28 dbm to +5 dbm 5 C to 45 C Relative humidity 8% to 90% EMC capability EN61326 Essential Features Capable of measuring the optical power of a CWDM channel. High reliability No moving parts. Handheld device e.g. Compact and lightweight design for maximum portability in the field. Compliant to ITU-T G and or ITU-T G
117 4.5 Identifying an appropriate wavelength measurement approach The purpose of this Section is to consider and compare a range of technologies for wavelength measurement with the aim of extracting a candidate technology which has the potential to form the core of a wavelength monitor system which can achieve the specifications developed in the previous Section as summarised in Table 4-3. As outlined in Chapter 1, one of the candidate technologies will be selected for a proof of principle implementation described in Chapter 5. The measurement of an unknown optical wavelength in an optical fibre is a common measurement for many systems, either for test purposes or as an integral part of the operation of the system. Examples include the measurement of wavelength in a multichannel Dense Wavelength Division Multiplexing (DWDM) optical communication system [57]; Fibre Bragg Grating (FBG) based optical sensing system [58] [59] and the characterisation of laser wavelength versus drive current during the manufacturing process [60]. For DWDM optical communications, wavelength measurement is indispensable in the accurate setting and maintaining of the transmitter s wavelength. For an FBG based optical sensing system, a cost-effective wavelength measurement scheme is very important in the successful commercialisation of fibre Bragg grating based sensors. Many different techniques for the measurement of wavelength in an optical fibre exist. In general, these techniques can be divided into passive wavelength measurement schemes and active wavelength measurement schemes. Most of the existing passive schemes, employ optical devices that have a well-defined and repeatable wavelength spectral response. Passive schemes typically have a simple configuration and offer high- 99
118 speed measurement, but can suffer from problems associated with the use of bulk-optic filters, collimation components and associated alignment stability or a limited wavelength range due to the spectral characteristics of the employed optical devices. Active schemes, mainly using wavelength-scanning technologies, can achieve high resolution, but require much more complicated configurations and typically have a low measurement speed, due to the presence of mechanical components, as compared to passive schemes. For example, the classic commercial technique for measuring an optical sources wavelength uses an interferometer or a monochromator; both suffer from complexity, vibration sensitivity and inherently slow measurement speed due to the mechanical motion involved. Two general purpose wavelength measurement instruments, the wavelength meter and the optical spectrum analyser serve the optical communications market. The wavelength meter is similar to the optical power meter in that it returns the numerical wavelength value of an input optical signal. A standard wavelength meter cannot function correctly where the input consists of several wavelength multiplexed signals. The optical spectrum analyser, on the other hand, is capable of simultaneously displaying the spectrum of a multiplexed input signal and in principle is capable of extracting a lot more information than a wavelength meter. The inherent wavelength accuracies for standard wavelength meters and optical spectrum analyser vary from 0.3 pm to >20 pm with the wavelength meter usually being more accurate as this is its principle function. Table 4-4 shows two commercial instruments and their main parameters for comparison. Both these types of instruments are based on one of the two following methods, an interferometer or a diffraction grating. These methods allow very accurate wavelength measurement over wide wavelength ranges. However, both have moving parts that affect their robustness, vibration sensitivity and temperature sensitivity. 100
119 Table 4-4 Commercial wavelength measurement instruments Instrument Spectral Accuracy range ± 0.3pm 1270 nm to 1650 nm ± 20pm 600 nm to 1750 nm Technique Michelson interferometer Keysight 86122C multiwavelength meter Anritsu MS9740A optical spectrum analyser Diffractiongrating-based spectrometer Temperature +15 to +35 C +5 to +45 C Operating principle of a CWDM wavelength monitor In the literature, many wavelength measurement techniques exist covering an array of specific applications across multiple disciplines, based on a variety of operating principles. Table 4-5 sets out a range of operating principles and in each case, identifies several sample techniques that implement a particular principle. Table 4-5 also provides a brief description of each sample technique and an evaluation of the technique against a number of the key parameters and features of a wavelength monitor as listed in the previous Section in Table 4-3. In this way, an overall assessment of the suitability of an operating principle as a basis for a CWDM wavelength monitor can be established. Table 4-5 also provides extra information in each case, as appropriate, in the column labelled Comment. With one exception, of the specific techniques listed in Table 4-5, only the commercial instruments specify actual wavelength accuracies. Accuracy is a qualitative term that defines the agreement between a measured value and its true value. Instruments are typically calibrated against a known standard to maximise the 101
120 agreement between the measured value and the known standard. A wavelength measurement instrument s accuracy can be defined as, what is the maximum error between the instrument s measured wavelength and the true wavelength?. In Table 4-5, the non-commercial techniques presented in research papers typically only consider the resolution and do not specify the accuracy of the measurement approach presented. This is because accuracy ultimately may depend on the engineering of a prototype and the calibration process used. Ultimately then, the achieved accuracy of a measurement technique is a matter of calibration. Beyond achievable accuracy at the point of calibration what is equally important is how the accuracy will change with time after calibration. Once an instrument is calibrated against a known standard its accuracy becomes a function of how stable that calibration is with time, temperature, vibration etc. In effect, what is needed is not just accuracy at the time of calibration, but an achievable long term stable accuracy. Thus, where possible in Table 4-5, where a research paper alludes to accuracy, for example, the factors that might influence long term accuracy such as temperature drift, this is mentioned in the comments. 102
121 Table 4-5 Wavelength measurement operating principles with a sample of specific techniques and their key parameters and features Wavelength measurement operating principle Specific technique implementing an operating principle Attributes that the wavelength measurement operating principle is being evaluated against for use in a CWDM wavelength monitor (blank indicates attribute not mentioned) Absolute wavelength range Absolute wavelength accuracy Wavelength resolution Power range per channel Physical simplicity or complexity Low-temperature sensitivity Comment Ratiometric technique using a wavelength dependent glass filter [58] nm See Note 1. 1% No moving parts. Values are dependent on filter type chosen in this case. Proposes use of a highly wavelength dependent splitter as the wavelength filter in lieu of an independent filter. Note 1: Not cited, would depend on calibration. Author does note that the system sensitivity can be increased with the use of a second filter with the opposite slope. Ratiometric technique using an optical splitter and a wavelength selective edge filter with an optical amplifier to increase sensitivity [61]. 10 nm (set by filter) See Note 2. As low as -60 dbm No moving parts. This technique has applications in Bragg grating sensing and utilises an optical amplifier to increase sensitivity as the wavelengths under test have low optical powers. Note 2: The author notes that a smaller measurement range increases accuracy due to the reduced EDFA ASE at the detectors. 103
122 Ratiometric Faraday rotation effect using a specially designed fibre magneto-optic device and a wavelength sensitive filter [62]. All fibre macrobending edge filter [63] nm nm See Note 3. See Note pm 10 pm Strong vibration resistance, compact size. Robust and no mechanical movement. The magnetooptic device is temperature controlled. Macro-bending edge filters are temperature sensitive [64]. Uses ratiometric technique in conjunction with a custom fibre magneto-optic device. Note 3: Authors state that further work will include the use of a reference He-Ne laser to improve stability and precision. Uses a ratiometric power measurement system with a multi-turn SMF28 fibre macro bend loss edge filter. Note 4: Further work by the authors [64] acknowledges that wavelength measurement accuracy is impacted by the temperature dependence of the macro-bending edge filter. 104
123 Fabry-Perot interferometer with a reference DFB source [65]. Circa 1550 nm See Note fm Built completely from optical fibre or connectorised components. DFB laser requires temperature control. Reasonably complex device requiring a temperature controlled reference source to reach full resolution. Although it does not have moving parts relies on a Fabry-Perot interferometer. Note 5: The interferometric free spectral range (FSR) varied by about 50 khz over 24 h meaning that the interferometer requires frequent recalibration. Interferometric Michelson interferometer with a frequency-stabilized master DFB laser [66]. Commercial wavelength meter using a Michelson interferometer [67]. Commercial wavelength meter using a Fizeau Interferometer [68] & 1550 nm bands nm nm 27 pm ± 3pm 40 MHz ( nm) 0.1 pm 10 MHz ( nm) +10 to -22 dbm Moving parts for the Michelson interferometer. Moving parts for the Michelson interferometer. Has Solid-State, Non-Moving Optics. DFB laser requires temperature control. Operational temperature 15 to 35 C. Temperature and pressure compensated. Highly complex device demanding free space optics, piezoelectric devices and a temperature controlled DFB laser. Highly complex device with mechanically aligned components. Includes a built-in HeNe laser wavelength standard. High-speed measurements up to 600 Hz. Requires internal calibration using stabilised reference lasers with wavelengths known to better than 1 MHz [69]. Commercial spectral sensor using a monolithic MEMS Michelson interferometer chip [70] nm 1.5 nm Robust and permanently aligned. Operational temperature -5 to 40 C. Operational temperature range can be configured to higher ranges upon request. 105
124 Commercial optical spectrum analyser using a Diffractiongrating based Spectrometer [71] nm ± 20 pm +23 dbm Moving parts for the Diffractiongrating. Wavelength accuracy when at stable room temperature. Accuracy when internal light source for wavelength calibration installed. Spectrographic MEMS scanning diffraction grating spectrometer [72]. A torsional mirror MEMS device diffraction grating in a Czerny-Turner setup [73] nm nm See Note 6. See Note nm 3 nm Free space optics. MEMS device shows extreme shock resistivity. Low resolution due to the use of a low-quality MEMS diffraction grating. Note 6: This paper makes no reference to the system s accuracy. It does note that the CCD is mounted 23.4 cm from the grating. Apart from physical size, this distance could also mean that accuracy could be influenced by mechanical disturbance. Wavelength range and resolution a function of the diffraction grating. Note 7: This paper makes no reference to the system s accuracy but notes that development of a more efficient diffraction grating is necessary. Commercial miniaturised MEMS grating spectrometer [74] nm See Note nm Uses rotation of the MEMS grating Requires fabrication via state of the art ultra-precision micromachining. Note 8: The brochure of this commercial OEM MEMS spectrometer does not specify its wavelength accuracy. 106
125 Stimulated Brillouin scattering Based on stimulated Brillouin scattering between a swept-tuned laser and a test optical signal [75]. Based on the narrowband Brillouin gain process in optical fibres [76]. Commercial OSA using stimulated Brillouin scattering [77]. Circa 1550 nm. Range set by tunable laser. 1 nm circa 1538 nm C+L band (1530 to 1625 nm) See Note 9. See Note pm 0.08 pm Femtometer range 80 fm 75 db dynamic range 80 db dynamic range External cavity fast tunable laser, which is precisely monitored with a physical standard wavelength reference. Requires a temperature controlled tunable source. Temperature controlled DFB laser. Wavelength range determined by internal swept wavelength source. By measuring the stimulated Brillouin scattering due to the interaction of the test signal and a swept-tuned pump laser the test signals wavelength can be identified. Note 9: Although wavelength accuracy is not directly mentioned it is expected to be a function of the accuracy of the tunable pump source. Complex device including an EDFA. Using a temperature controlled DFB laser as a pump source, its wavelength can be modulated using its diode injection current and its output power stabilised using an EDFA in automatic power control mode. Note 10: Although wavelength accuracy is not directly mentioned it is expected to be a function of the accuracy of the tunable pump source. Stimulated Brillouin scattering (SBS) is a non-linear optical effect produced by narrow-linewidth high-power light propagating through an optical fiber. By sweeping an external cavity tunable laser source (TLS) SBS is initiated at the wavelength under test giving a highresolution optical spectrum [77]. 107
126 Uses thermal tuning of a micro-ring resonators resonance [78] nm range circa 1574 nm See Note fm Complex device requiring precise mechanical alignment. Resonator requires temperature tuning. Ring resonator is an Si structure with two waveguides buried in SiO 2 and a micro-heater on top. Note 11: Author is concerned with the measurement of a wavelength shift and not absolute wavelength accuracy. Tunable filter Uses an Acousto-optic tunable filter to interrogate fibre Bragg grating sensors [79]. A Liquid Crystal- Based Fourier Optical Spectrum Analyzer [80] nm nm See Note 12. See Note nm Acousto-optic filter is a complex device. Uses a sevenstage static liquid crystal interference filter. Uses a voltage controlled local oscillator and feedback from the acousto-optic tunable filter to monitor the wavelength. Note 12: This paper makes no reference to the system s accuracy. The resolution if a direct function of the AOTF line width. The technique can currently resolve the profiles of an EDFA gain spectrum or a DWDM signal. It currently cannot resolve the individual DWDM wavelengths. Note 13: Neither the potential resolution or accuracy are stated. Tunable filter based on a dynamic Bragg grating in iron doped indium phosphide [81] nm See Note nm Min -3 dbm Requires a tunable laser diode. Wavelength range is a function of the tunable laser. Note 14: Although it does not discuss the systems wavelength accuracy, a knowledge of the wavelength of the systems tunable source is required. Therefore. its accuracy will play a role in defining the overall system accuracy. 108
127 Heterodyne detection Uses a wavelength swept laser source and balanced coherent receivers [82]. Uses a wavelength swept laser source, etalon and MEMs technology [83]. Commercial OSA using heterodyne detection [84]. Circa 1550 nm nm 1440 to 1640 nm See Note 15. ± 5 pm 1.5 pm < 11 MHz ( nm) ± 2 pm 1 MHz (0.008pm) 70 db dynamic range 52 db dynamic range MEMs scanning mirror. Includes a tunable source. Although not specified swept source is likely temperature controlled. LD, etalon and scanning mirror are temperature controlled. The signal under test is mixed with a local oscillator (tunable swept wavelength source). Using s pair of balanced coherent receivers an optical spectrum can be generated that is a function of the optical mixing [82]. Note 15: Wavelength accuracy not specified in this paper. Using the same technique [82], the addition of a mode hop free rapidly swept wavelength source increases measurement speed (160 Hz). Swept wavelength source is implemented using MEMS technology and an etalon. The 83453B is a fully calibrated and integrated system based on optical heterodyne techniques. 109
128 From Table 4-5 it is evident that for a given operating principle, the implementation, as evidenced by the sample techniques presented, will have an impact on the key parameters such as their wavelength ranges and achievable long-term accuracies. This can be due to the nature of the specific technique employed or enhancements implemented to address the specific nature of the application in question. Overall, however, the performance achieved in practice will be determined by the underlying operating principle and by the long-term stability of the system calibration Assessment strategy used to identify appropriate operating principle for use in a CWDM wavelength monitor This Section will first consider the methodology used to assess the potential of an operating principle (as listed in column one of Table 4-5), which can underpin the CWDM wavelength monitor in question in this thesis. Following this, an operating principle is selected for a proof of principle implementation in Chapter 5. Table 4-6 assesses each operating principle against the two following criteria: Attributes: For each operating principle, assess the potential of achieving the key parameter values and the essential features set out in Table 4-3. The attributes (columns 3 to 8 in green) of the sample specific techniques set out in Table 4-5 are used as an indicator of the attainable performance. A particular focus will be made on achieving the required wavelength accuracy. Complexity: Furthermore, a solution that is least complex in essential; that is, the solution that has the lowest potential cost and does not burden one with undue complexity. It must also be realised that in many cases there is a trade-off between the potential to achieve key parameter values and the complexity incurred. 110
129 Table 4-6 Assessment of operating principles for use in a CWDM monitor Operating Principle Ratiometric Interferometric 12 Can the attributes be achieved? Although the specific techniques referenced do not meet the required absolute wavelength range demanded here the operating principles absolute wavelength range is a function of the filter used and thus there is the potential to meet the wavelength range needed. There is not enough information presented in the references to make an assessment of the wavelength accuracy, but as discussed accuracy will be a matter for calibration. Using this operating principle, it is clear from Table 4-5 that it is possible to meet the key parameters. Many interferometric implementations require moving parts and precise mechanical alignment and calibration. Other fixed (no moving parts) implementations will however still require precise mechanical alignment and the use of a detector array. Some specific implementations require temperature control of reference sources. Physical simplicity or complexity Assuming, for example, the use of a wavelength dependent optical splitter [58] as the optical filter, the number of components will be minimal. The system will be robust and does not require moving parts. The wavelength accuracy and resolution will be a function of the stability of the filter and the specifications of the ratiometric power meters. It is not envisioned that temperature control will be required. However, temperature monitoring could compensate for the influence of the thermal dependence of key components on long-term calibration. Interferometers are typically complex devices requiring careful mechanical alignment. For example, the Michelson interferometer relies on a scanning moving arm that is sensitive to temperature and mechanical imperfections, but the inclusion of a stabilised reference source can largely account for these errors. Other configurations such as the Fizeau Interferometer, with a static implementation, require the use of a CCD array [85]. 12 There are related interferometric techniques that utilise multimode interference based on fibre heterostructures. Fundamentally however these devices are used as edge filters and are an example of a ratiometric principle [96]. 111
130 Spectrographic Stimulated Brillouin scattering Heterodyne detection Tunable filter Using this operating principle, it is clear from Table 4-5 that it is possible to meet the key parameters using specific implementations. More robust implementations using commercial MEMS have reached sub-nm resolutions. Using this operating principle, it will be possible to meet all the key parameters. However, to meet the wavelength range requires a swept wavelength source that can be tuned across the entire range. Using this operating principle, it will be possible to meet all the key parameters. However, to meet the wavelength range requires a local oscillator, a swept wavelength source that can be tuned across the entire range. The balanced coherent receivers minimise noise in the system which results in large dynamic power ranges. Of the specific techniques studied using this operating principle, achieving the required values for the key parameters will not be possible. The techniques typically have poor wavelength resolution or restricted wavelength ranges. Spectrometers are typically complex devices requiring careful mechanical alignment. A scanning spectrometer that operates by moving a diffraction grating uses a single detector e.g. a photodiode. A non-scanning spectrometer that is mechanically more robust requires the use of a CCD camera chip [86]. Due to the nature of the swept wavelength source, this is a complex and costly operating principle. Due to the nature of the swept wavelength source, this is a complex and costly operating principle. The additional need for a coherent receiver will also very significantly increase system complexity and cost. There are two broad categories that optical filters can be classified into, those that use optical interference and those that use diffraction [87]. Unlike the interferometric and spectrographic operating principles that share the same underlying theory tunable filters are more compact devices. This is not to suggest that they are not a complex, in practice, many tunable filters may require precision alignment [78] [79], multiple optical layers [80] or complex electronics [78] [79] [80]. 112
131 Reflecting on Table 4-6, the interferometric and spectrographic operating principles offer the most certainty in achieving the key parameters of a CWDM wavelength monitor. However, their high levels of accuracy come at the expense of significant complexity, both mechanical and electrical. Both the stimulated Brillouin scattering and the heterodyne detection operating principles offer exceptional performance easily meeting the key parameters but over restricted wavelength ranges. Moreover, due to their complexity, these operating principles are typically used in niche, specialised high-end OSAs and would not be suitable for a CWDM wavelength monitor. Tunable filters play an important role in dynamic or reconfigurable multi-channel optical communications systems, with a typical application involving dropping an individual WDM channel out of a multiplexed group in a tunable WDM demultiplexer [88]. The many implementations of tunable filters such as the liquid crystal, acoustooptic, Fourier transform spectrometer, linear variable and Fabry-Perot tunable filters contain complex systems of lenses and moving parts, and hence are bulky, fragile and expensive [89]. Furthermore, an accumulation of power from wideband spectral components, due to the non-ideal spectral response of the filter, may degrade the power accuracy and hence the wavelength resolution will be impacted. For high-performance measurement, a filter requires a steep spectral response [90]. In conclusion, the implementation of a wavelength monitor, with the required wavelength accuracy, will be a challenging complex solution. From the data available and the analysis in Table 4.6, the ratiometric operating principle offers a potential solution. Wavelength resolutions in the order of picometers are reported with the wavelength range being a function of the optical filter. There is not enough information available from authors to make an assessment of the wavelength 113
132 accuracy, but as mentioned above wavelength accuracy is a matter of calibration. Once an instrument is calibrated against a known standard its long-term accuracy in service becomes a function of how stable the calibration is with time, temperature, vibration etc. Thus, ease of calibration must also be considered, as a system that requires complex and time-consuming calibration will be uneconomical. In conclusion, based on the analysis above, a ratiometric operating principle offers the best potential for a robust optically passive system to underpin a proof of principle CWDM wavelength monitor. In comparison to the other operating principles, a ratiometric wavelength monitor is the least complex solution with some implementations being robust all fibre systems. 4.6 Summary Following a survey of instruments marketed to the CWDM industry, a set of attributes that are representative of the different types of instruments available was made. These attributes were categorised into parameters and features. Each parameter and feature was considered in the context of a wavelength monitor for use in CWDM systems with a subsequent reclassification of the attributes into essential features and key parameters, hence the attributes of a CWDM wavelength monitor were specified. An in-depth investigation of wavelength measurement operating principles was carried out with the aim of identifying a suitable technology to implement a CWDM wavelength monitor. The ratiometric wavelength measurement operating principle was chosen to implement a proof of principle CWDM wavelength monitor as it offers the best potential to meet the required specification with a least complex solution. 114
133 5 Proof of principle implementation of ratiometric operating principle 5.1 Introduction In the previous Chapter, the required attributes of a CWDM wavelength monitor were examined and a candidate wavelength measurement operating principle was selected for the implementation of a proof of principle CWDM wavelength monitor. This Chapter will first examine the operation of the ratiometric operating principle. The filter discrimination limit and hence wavelength resolution limit of the ratiometric technique due to the limited Signal-to-Noise-Ratio (SNR) of the CWDM laser source will then be considered. It is concluded that the ratiometric technique will not achieve the desired wavelength resolution due to the limited SNRs of typical CWDM sources. A solution that allows the required wavelength resolution to be achieved is proposed that places the ratiometric power monitor at the Rs reference point (the receiver) so that the signal under test passes through a multiplexer and demultiplexer, improving the effective SNR. The use of a WDM splitter as an optical discriminator (wavelength dependent optical filter) is investigated with the arms of the splitter effectively providing a pair of filters with opposite wavelength response slopes. Finally, a proof of principle experiment is described that confirms that the required wavelength resolution is achievable but with the condition that the wavelength monitor is placed at the Rs reference point. 115

134 5.2 Overview of a ratiometric wavelength measurement system This Section will look at the characteristics of a system based on the ratiometric operating principle. Figure 5-1 illustrates a block diagram of a generic ratiometric wavelength measurement system. Figure 5-1 Block diagram of a generic ratiometric wavelength measurement system An optical signal whose wavelength is to be measured is split using a wavelength flat optical coupler/splitter 13 between two paths, one filtered and the other direct or unfiltered. The combination of the two optical paths forms a simple wavelength 13 A three-port optical coupler can be configured as either a one to two port splitter or a two to one port combiner. In this Chapter, for simplicity, the component will be referred to an optical splitter as this is how it will be configured. 116
135 discriminator. The optical output of the two paths, one filtered and the other direct, is converted to an electrical equivalent by two photodetectors. Because of the filter, the ratio of the optical signal intensity at the photodetectors is a function of wavelength and thus the ratio of the electrical output of the photodetectors is a function of wavelength [91]. Assuming a suitable filter response and calibration, the power ratio value can be used to determine the wavelength [58]. The wavelength dependent optical filter is often referred to as an edge filter in the literature [92] and employs the transition region between the stopband and passband of the filters transmission response [91]. The potential speed of the system is very fast, limited only by the speed of the ratiometric power measurement system [91] [93]. In addition, a further advantage is that the measurement of wavelength is independent of the source optical power level. The spectral response of the filter path of the discriminator is shown in an ideal form in Figure 5-2. A filter response with a large discrimination attenuation, Adisc, between the end points of the measurement band L and H, will maximise resolution, while ensuring the lowest baseline attenuation, Abase, will allow the highest possible detected power levels at Optical to Electronic (OE) conversion point, to preserve power measurement accuracy and maintain power measurement speed. The next sub-section provides a brief worked example to help illustrate how a system could measure wavelength over the CWDM range. 117
136 Figure 5-2 Spectral response of a generic wavelength discriminator (optical filter) Worked example of a ratiometric wavelength measurement scheme A sample wavelength discriminator with a spectral response suitable for the CWDM range shown in Figure 5-3, offering a discrimination of 20 db. Figure 5-3 Spectral response of a sample wavelength discriminator (optical filter) 118
137 Table 5-1 illustrates power budgets for the optical paths in the system at three sample wavelengths: two wavelengths at the measurement extremes of the CWDM wavelength monitor (1261 nm and 1621 nm) and one wavelength in the centre of the range (1441 nm). An optical source with an input power into the wavelength measurement system of 0 dbm is assumed. The ratio of the powers detected at the photodetectors is calculated for each wavelength. Table 5-1 Optical powers at various points in a ratiometric wavelength measurement system for an optical signal with 0 dbm and (-7 dbm) input optical power and three different CWDM wavelengths Optical signal under test with an input power of 0 dbm and (-7 dbm) Units Sample Wavelength nm 50/50 Optical splitter insertion loss db Power at outputs of 50/50 Optical (-10.5) (-10.5) (-10.5) (-10.5) (-10.5) (-10.5) splitter dbm Path to power meter is direct or Direct Filtered Direct Filtered Direct Filtered filtered Insertion loss of path db Power detected at photodetectors -3.5 (-10.5) -5.5 (-12.5) -3.5 (-10.5) (-22.5) -3.5 (-10.5) (-32.5) dbm Ratio of detected powers 2 (2) 12 (12) 22 (22) db There is a clear correlation between measurable power ratio and wavelength so that with a suitable calibration, a lookup table can be used to convert the ratio of the powers detected at the photodetectors to a wavelength. Furthermore, in Table 5-1 illustrates power budgets for the optical paths in the system at three sample wavelengths: two 119
138 wavelengths at the measurement extremes of the CWDM wavelength monitor (1261 nm and 1621 nm) and one wavelength in the centre of the range (1441 nm). An optical source with an input power into the wavelength measurement system of 0 dbm is assumed. The ratio of the powers detected at the photodetectors is calculated for each wavelength. Table 5-1 in red are the equivalent powers for an input power of -7 dbm. It can be seen that the final ratio of the detected powers remains unchanged for a changing input optical power. This shows that as expected small variations and drift in a source s optical power will not impact the measurement of its wavelength. It should be noted that the spectral response of the wavelength discriminator, i.e. the attenuation response of the optical filter, must either be monotonically increasing or monotonically decreasing with wavelength. An optical filter that attenuates two different wavelengths by the same amount will result in the two wavelengths having the same power ratio at the photodetectors and thus measurement ambiguity. 5.3 Resolution of a Ratiometric System Given the emphasis in this thesis on achieving a specified accuracy, it is important to understand the limitations of a ratiometric wavelength measurement system, in particular in regard to accuracy and resolution. There are a number of simple factors that impact the resolution with which wavelength can be measured. From Figure 5-3, it can be concluded that if the discrimination is reduced, the resolution of the conversion of a measured power ratio to a known wavelength will be degraded. Likewise, the actual optical power measurement resolution of the photodetectors and subsequent processing system will also limit the effective wavelength measurement resolution. 120
139 This can be put in perspective for the system under consideration here as follows. The ratiometric wavelength measurement system being considered will require a wavelength dependent optical filter that discriminates over the 1261 nm to 1621 nm wavelength range. As an example, assume a discrimination of 20 db and an optical power measurement resolution of 0.01 db at the output of the two paths (this resolution is routinely achieved in power meters). An estimation of the systems wavelength resolution can be calculated based on the simple geometry of Figure 5-3. By dividing the discrimination of the filter by the resolution of the power measurement system the total number of distinct individual powers that can be measured is calculated, which equals the total number of distinct ratios that can be measured. Dividing the wavelength range by the number of measurable ratios gives the smallest variation in wavelength that can be measured, as illustrated in the Equation 8 below: Equation 8 Ratiometric technique wavelength resolution λ H λ L A disc power meter resolution = wavelength resolution 1621nm 1261nm 20 db 0.01dB = 0.18 nm Therefore, as the wavelength range for any particular application is fixed (e.g. DWDM or CWDM) to increase the wavelength measurement systems resolution, either the optical filters discrimination must be increased or the resolution of the optical power measurement must be improved or both. The wavelength measurement system being considered in this thesis requires a wavelength measurement accuracy of nm. A first step in achieving this accuracy is a system that can measure wavelength with this resolution. Rearranging Equation 8 it 121
140 can be seen that if the resolution with which power is measured is maintained at 0.01 db then a filter with a wavelength discrimination of db would be required. (λ H λ L ) power meter resolution wavelength resolution = A disc (1621nm 1261nm) 0.01dB = db nm 5.4 Filter discrimination limits in a ratiometric system In practice, there are limits on the effective discrimination of the filter, due not to the optical design of the filter, but rather to the wide-band noise of the optical source under test. This was investigated in previous work [91] by Q. Wang et al, which investigated the response of the wavelength discriminator where the source is a non-ideal source. As expected [91] confirms that for an ideal noise-free optical source that a straightforward approach to increasing a ratiometric wavelength measurement system s resolution is to increase the discrimination of the optical filter. However, this approach to increasing resolutions does not work if one considers the optimal transmission response of the optical filter in the context of the limited signal to noise ratio (SNR) of the signal source. For a real laser source, although a great deal of the optical power lies within the narrowband portion of the source s spectrum, there is a measurable power due to the spontaneous emission of the laser, even far from the central wavelength. Figure 5-4 shows the intensity distribution of a tunable laser, at a number of different centre wavelengths and its associated wideband noise. 122
141 Figure 5-4 Intensity distribution of a typical tunable laser source in the wavelength region 1500 nm to 1600 nm. Reproduced from [91]. In [91] it is shown that for increasing values of discrimination, both the calculated and experimental power ratios detected at the photodetectors diverge from the actual transmission response of the wavelength discriminator. This divergence is shown to be due to the limited SNR of the laser source under test. Reusing the model 14 previously developed in [91], Figure 5-5 shows over a wavelength range of 1500 nm to 1600 nm the transmission response of six different wavelength discriminators (note that the SNR of the source modelled in Figure 5-5 has a noise floor of 55 db with a random variation of up to 1 db). For each of the discriminators the attenuation the signal undergoes at 1500 nm is 0 db, with the attenuation at 1600 nm increasing from 10 db through to 14 Given the importance of the model specified, the source paper is reproduced in Appendix A Q. Wang, G. Farrell and T. Freir, Study of Transmission Response of Edge Filters Employed in Wavelength Measurements, Applied Optics, vol. 44, no. 36, p. 7789,

142 60 db in steps of 10 db (The 60, 50 and 40 db discriminator transmission responses are labelled in Figure 5-5 for clarity). As can be seen, the transmission response increases linearly with wavelength as expected. Furthermore, in Figure 5-5 the associated power ratio is also plotted for each discriminator transmission response. The power ratio is the ratio of the signals from the two paths, one filtered and the other direct or unfiltered, detected at the photodetectors. Under ideal circumstances for a noise free source, the ratio and the transmission response lines should be equal but as can be seen for a given slope, as the discrimination of the filtered path increases the actual ratio diverges from the expected value. This is due to the wideband noise of the signal under test. As can be seen in Figure 5-5 the power ratio associated with the 60 db discriminator diverges away considerably from the transmission response. As the discrimination is reduced, 50 db, 40 db and lower, the divergence away from the ideal (ratio and the transmission response lines equal) is reduced. Figure 5-5 Transmission response of wavelength discriminator and the associated power ratio at the photodetectors from model in [91]. Source has an SNR of 55 db with a random component < 1 db 124
143 A physical explanation for this is as follows: using the 60 db discriminator a signal source with a peak signal power of 0 dbm at 1500 nm will undergo 0 db attenuation, with the sources wideband noise undergoing increased attenuation across the range from 1500 nm to 1600 nm. Hence the peak signal power will be transmitted without change (0 dbm) but the wideband noise will be attenuated by up to 60 db at 1600nm. However, in contrast, a signal source with a peak power of 0 dbm at 1600 nm will undergo 60 db attenuation, but the sources wideband noise from 1600 nm down to 1500 nm will undergo ever decreasing attenuation. Hence, the peak signal power will have been attenuated to by 60 db to -60 dbm but with some of the wideband noise undergoing no attenuation. It is concluded that as the wavelength increases (and hence undergoes higher discrimination) there is an effective degradation of the SNR of the source under test. From Figure 5-5, it can be seen that the effect of this degradation of the SNR of the source has a more pronounced effect on the ratio as the filters discrimination is increased. It can also be shown using this model that if a source with a poorer signal to noise ratio is used the divergence is more pronounced. It is worthwhile considering in more detail the divergence between an ideal response and a response compromised by a source with a finite SNR. Assume the difference between the actual transmission response and the ratio detected at the photodetectors is denoted by ΔT. Again, using a source with an SNR of 55 db, Figure 5-6 plots ΔT against a varying maximum transmission response of the discriminator at a fixed wavelength of 1600 nm nm is used here, as this is where the maximum value of ΔT occurs. It can be observed that as the discrimination of the filter increases, the value of ΔT also increases. In addition, the larger the discrimination, the greater the effect the sources wideband 125

144 noise plays in the ratio detected at the maximum wavelength of 1600 nm. The result is that the ratio detected varies from measurement to measurement due to the random nature of the noise. If a discriminator is being used to measure wavelength, with the need to meet a given resolution specification, then a maximum value of ΔT must be considered, ensuring the ratio detected is as close to ideal as possible following the transmission response. From knowledge of the maximum ΔT, for a given source SNR, a maximum value of discrimination can be determined. For example, as a starting point if ΔT is required to be within 0.01 db (comparable with the resolution of the power detectors, as before), then any small fluctuations in the power ratio detected due to the random nature of the wide-band noise must be smaller than the resolution of the power detectors. Using this logic, Figure 5-6 shows that for ΔT 0.01 db and a source SNR of 55 db, a maximum value for the discrimination is found to be about 11.5 db. Figure 5-6 Difference between transmission response and output ratio at 1600 nm for a source SNR of 55 db. Using an 11.5 db discriminator and assuming a power measurement resolution of 0.01 db, a wavelength resolution of nm over this wavelength range is achievable. 126
145 Further work has shown that as the SNR of the source degrades the maximum acceptable value for the discrimination will be reduced and hence the resolution with which the system can measure wavelength is further reduced. 5.5 Implications for a CWDM wavelength monitoring system The results discussed in Section 5.4 considered a discriminator operating over the 1500 nm to 1600 nm range and the impact of the sources wideband noise on a ratiometric wavelength measurement system. One important parameter is the SNR of actual CWDM sources. ITU-T G.957 specifies SDH optical interfaces for use with DWDM and CWDM systems. Although it specifies limits on spectral width and the minimum side mode suppression ratio of sources, it does not set a minimum value on the intensity of the wideband power generated by the source due to spontaneous emission. As CWDM is a lower cost and less complex technology than DWDM, the sources do not meet the high-performance characteristics of DWDM sources. In the absence of data from manufacturers or from the ITU-T, the impact the SNR of the CWDM source has on the maximum discrimination has been investigated over a range of SNR values. Thus, the model (from [91]) has been adapted for use over the 1261 nm to 1621 nm range for use in the CWDM wavelength monitoring system under consideration, with the SNR of the source set to 60, 50, 40 and 30 db. Using a discriminator with a db transmission response, as determined above, Figure 5-7 shows the modelled transmission response of the discriminator and diverging away from it the power ratio detected at the photodetectors as the SNR of the source is reduced in steps of 10, from 60 to 30 db. It can be seen in Figure 5-7 when the model above is run over a wider wavelength range, the maximum value of the discrimination will be reduced due to 127

146 increased wideband noise from the source and further reduced by the reduction of the source s SNR, hence the resolution of the system will be degraded further. Figure 5-7 Modelled transmission response of a db wavelength discriminator and the ratio at the photodetectors for sources with an SNR of 60, 50, 40 & 30 db. From the results in Figure 5-7, it is clear that due to a combination of the large discrimination required and the effect of the wideband noise power that the required resolution will not be achievable using a ratiometric power measurement system in its current configuration. In considering that the main cause of the divergence of the ratio at the photodetectors from the ideal is due to the wideband noise of the source laser, filtering of this noise can be considered as means to improve the effective SNR. Before adding complexity to the ratiometric wavelength measurement system to achieve this, a real CWDM system should be considered. Figure 5-8 shows in red the optical path of a 1511 nm CWDM signal. As the signal passes through the multiplexer it is passing through an optical filter, as discussed in Section 3.5.1, with a 0.5 db passband of 13 nm and an adjacent 128
147 channel isolation of 30 db. Furthermore, when the signal passes through the demultiplexer it passes through a second identical filter. Figure 5-8 Block diagram of optical path from Tx1 to Rx1 in a sample CWDM system Thus, it can be assumed that any signal detected at the receiving end of a CWDM system, known as interface point Rs as discussed in Section 1.6 will have passed through two optical bandpass filters, significantly attenuating the sources wideband noise. Adjusting the model to simulate a ratiometric wavelength measurement system placed at the Rs reference point at the receiver and a signal source with an SNR of 30 db the results in Figure 5-9 are obtained. 129

148 Figure 5-9 Difference between transmission response and output ratio at 1621 nm with a source SNR of 30 db, measured at Rs. It can be seen in Figure 5-9 that even with a large discrimination, > 25 db, and a poor source SNR of 30 db, that ΔT is an order of magnitude smaller that the limit of 0.01 db set in the last Section. This shows that when the system connection point is at a CWDM receiver, the ratio at the photodetectors of such a ratiometric wavelength measurement system will follow the transmission response of the discriminator with minimal error and will then be able to resolve changes in wavelength of nm as required. The next Section will consider a suitable wavelength discriminator for use in a proof of principle experiment to validate these results. 5.6 Wavelength-dependent optical filter When considering an optical filter for use as a wavelength discriminator in a ratiometric wavelength measurement system the following requirements must be considered in the first instance. 130
149 Does it operate over the correct wavelength range? Does it have the required discrimination? Is the transmission response monotonically increasing or decreasing? Is it easily connectorised? The literature proposes a number of candidate wavelength dependent optical filters including a wavelength dependent glass filter [58]; a thin film filter [62] and an all fibre macro-bending edge filter [63]. An alternative implementation, Figure 5-10, proposed in the literature, is to use a highly wavelength dependent optical splitter in lieu of the optical filter and the wavelength flat 50/50 optical splitter [58]. This also has the advantage that it simplifies the implementation by reducing the number of optical components required to one and as explained later allows for both paths to be wavelength dependent improving the discrimination. Figure 5-10 Block diagram of a ratiometric wavelength measurement system using a wavelength dependent filter Optical splitters routinely couple two different wavelengths into one fibre or split two different wavelengths from one fibre into two. Such splitters are often used for WDM 131
150 applications or in Erbium-Doped Fibre Amplifiers (EDFAs). Figure 5-12 shows a generic wavelength response of the proposed commercial splitter shown in Figure The insertion loss of ports 1 to 3 has a minimum at λ1 (near 0 db) with the insertion loss increasing monotonically to a maximum (greater than 20 db) as the wavelength approaches λ2. Conversely, the insertion loss of ports 1 to 2 has a minimum at λ2 (near 0 db) with the insertion loss increasing monotonically to a maximum (greater than 20 db) as the wavelength approaches λ1. Such an optical splitter offers a large discrimination for use in a ratiometric wavelength meter. Furthermore, when considering a proof of principle implementation, the type of splitter available has values of λ1 and λ2 equal to 1310 nm and 1625 nm respectively. It is accepted this range does not match the range demanded by the system under consideration here, however for a proof of principle experiment around 1531 nm this is an acceptable limitation, furthermore, while it is beyond the scope of the proof of principle experiment described here, it should be noted that customised couplers can be manufactured with values of λ1 and λ2 such that the required wavelength range (1261 nm to 1611 nm) lies in the monotonically increasing section of the response. Figure 5-11 Three port generic WDM optical splitter, reproduced from Newport.com 132
151 Figure 5-12 Wavelength response of generic Newport WDM optical splitters, reproduced from Newport.com [94] WDM splitters are not in themselves optical filters but can be utilised as such in this work. A key advantage of using a WDM splitter is that the arms of the splitter effectively can provide a pair of filters with opposite response slopes. Taken together this feature can be used to good effect to increase the effective discrimination, as shown in [95] and thus the wavelength resolution of the ratiometric wavelength measurement system can be improved. For WDM splitters in general, the term isolation is used to define the ability of a splitter to reject an unwanted wavelength at an output port. For example, in the case of port 1 to 3 in Figure 5-12, the isolation is the difference in insertion loss of λ1 (0 db) versus λ2 (20 db). This gives an isolation value of 20 db (0 db 20 db). In turn, when viewed as filter, this isolation can be interpreted as the optical filters discrimination. A brief survey of WDM splitters shows that each output port has an isolation that is typically specified as having a minimum value better that 20 db. Hence, with both the splitter s outputs having an isolation of 20 db and opposite wavelength response slopes, the splitters discrimination is in effect doubled to 40 db [95]. This is made clear in Figure 5-13 which shows how a wavelength dependent 133

152 splitter can be replaced by way of illustration by a combination of a wavelength independent splitter and two wavelength dependent filters, with opposite response slopes. Figure 5-13 Wavelength dependent splitter and equivalent wavelength flat splitter and filter combination A comparison to Figure 5-1 confirms that the ratio at the photodetectors in Figure 5-13 is influenced by two filters, not one, hence the increase in the discrimination. Hence, using Equation 8 Ratiometric technique wavelength resolution and a discrimination of 40 db, a wavelength resolution of 0.09 nm can be achieved, which is better than the specification required. 5.7 Proof of principle wavelength discrimination In this Section, a proof of principle wavelength discriminator will be implemented with the aim of demonstrating the minimum wavelength resolution of nm can be achieved using a ratiometric wavelength measurement scheme, but with the caveat that the ratiometric wavelength monitor is placed at the RS reference point (near the CWDM receiver). In addition, a comparison will be made demonstrating the improvement in the techniques performance when the sources wideband noise is filtered by the multiplexer and demultiplexer. 134
 is used to replicated a CWDM source experiencing wavelength drift.")
153 Figure 5-14 shows the block diagram of the experimental setup replicating the placement of a ratiometric power meter at the Ss reference point (near the CWDM transmitter). A NetTest OSICS tunable ECL (External Cavity Laser) is used to replicated a CWDM source experiencing wavelength drift. A dbm Optics Model 4100 dual channel optical power meter is used to implement a ratiometric power meter. A high isolation WDM splitter from Laser 2000 with operating wavelength of 1310 nm and 1625 nm, typically used for CATV applications, is repurposed for use as a wavelength dependent optical filter. Note that manufacturers and suppliers of WDM splitters do not typically supply detailed data on the spectral response of the components outside the specific wavelengths of interest, in this case 1310 nm and 1625 nm, hence that the selection of this specific component was carried out in the absence of data on its spectral response over the complete CWDM range. This is because data on other wavelengths is typically not relevant in the applications the splitters are designed for. Figure 5-14 Block diagram of the experimental setup replicating the placement of a ratiometric power meter at the Ss reference point (near the CWDM transmitter) The tunable laser's wavelength is set to 1531 nm and the ratio of the detected powers at the dual-channel power meter is measured every 10 ms. Using a technique by Q. Wang & T. Freir et al, that demonstrates the minimum detectable change in the wavelength, a 135
154 Ratio in db step change in the tunable lasers wavelength of 0.1 nm is made and the resulting change in the detected power ratio will be measured [63]. Figure 5-15 clearly shows a step change in the ratio detected when the input wavelength is changed Ratiometric power meter at the Ss reference point Measurement Number Figure 5-15 Ratio detected by ratiometric power meter with a step input change in wavelength of 0.1 nm, system input connected at the Ss reference point As discussed in Section 3.5.1, multiplexers and demultiplexers can be modelled using optical splitters and optical filters, as in Figure Using CWDM filters that have the same wavelength response as the multiplexer and demultiplexer replicates the effect of the wavelength being measured passing through a links multiplexer and demultiplexer. 136

. Figure 5-16 Components and subsystems of the Multiplexer and Demultiplexer models.")
155 Therefore, in place of a multiplexer and demultiplexer the signal from the source passes through two identical CWDM optical filters, Laser LAS , with ±6.5 nm passbands centered around 1531 nm. Figure 5-17 shows the block diagram of the experimental setup which in effect replicates the placement of a ratiometric power meter at the Rs reference point (near the CWDM receiver). Figure 5-16 Components and subsystems of the Multiplexer and Demultiplexer models. Reproduced from OptiSystem component library Figure 5-17 Block diagram of the experimental setup replicating the placement of a ratiometric power meter at the Rs reference point (near the CWDM receiver) 137
156 Ratio in db The experiment described above is repeated and the results in Figure 5-18 again clearly shows a step change in the ratio detected when the input wavelength is changed Ratiometric power meter at the Rs reference point Measurement Number Figure 5-18 Ratio detected by ratiometric power meter with a step input change in wavelength of 0.1 nm, system input connected at the Rs reference point For a comparative analysis Figure 5-15 and Figure 5-18 have been placed side by side in Figure On the right-hand side, showing the ratio detected at the Rs reference point, two green lines have been placed showing the clear margin in the ratio detected when the wavelength makes a step change of 0.1 nm. On the left-hand side, showing the ratio detected at the Ss reference point, the same two green lines have been placed for comparison. This shows that the margin in the ratio detected when the wavelength makes a step change of 0.1 nm is not as clear. 138
157 Ratio in db Ratio in db Ratiometric power meter at the Ss reference point Ratiometric power meter at the Rs reference point Measurement Number Measurement Number Figure 5-19 Comparison of Figure 5-15 and Figure 5-18 The results in Figure 5-19 confirm that by placing the CWDM wavelength monitor at the Rs reference point that the wide band noise from the source will be significantly attenuated resulting in the wavelength discriminators wavelength response following close to the ideal as opposed to diverging away as discussed in Section 5.4. Furthermore, it confirms that under these limited circumstances that a wavelength change of 0.1 nm can be detected and hence with suitable engineering and calibration a wavelength accuracy of 0.1 nm can be achieved. 139
158 It should be noted that a number of improvements can be made to the experiment to strengthen the conclusions. For example, the source used is a continuous wave (unmodulated) ECL with an SNR of 47 db. It is expected that a source with poorer SNR would produce a step change in ratio, at the Ss reference point, with a less clear margin than that in Figure 5-15 due to the additional wide band noise in the source. A similar result to that in Figure 5-18 is expected when measured at the Rs reference point as a large proportion of the additional noise would be filtered by the CWDM filters. Furthermore, given the components available the experiment was not carried out at a wavelength that undergoes maximum discrimination. As shown in Section 5.4 the negative effect of the signal SNR on the ratio detected is at the wavelength that undergoes the greatest discrimination, hence an experiment carried out at this wavelength would show more contrasting results than those in Figure Finally, averaging of the powers detected would reduce the fluctuations in the ratios detected especially in the context of a signal source with a poorer SNR. 5.8 Summary The Chapter opened with an overview of the operation of a ratiometric wavelength measurement scheme and its ability to resolve wavelength. Furthermore, the broad wavelength range and the limited discrimination of the optical filter as limiting factors in the scheme s ability to resolve wavelength were also considered. Further analysis of the filters discrimination and the impact of the optical source s SNR on the achievable wavelength resolution was modelled. The results of the model showed that the desired wavelength resolution is only achievable when measurements are made at the Rs system reference point. A proof of principle experiment is carried out using a 1x2 WDM 140
159 splitter with operating wavelengths 1310 nm and 1625 nm, in place of a wavelength flat splitter and optical filter. The benefits of this arrangement were discussed, followed by two experiments showing the achievable wavelength resolution at both the Ss and Rs reference points. The experiment confirmed that by placing a wavelength monitoring system based on the ratiometric principle at the Rs interface point that the wavelength resolution is improved, achieving the required resolution, due to the filtering of the source s wideband noise by the multiplexer and demultiplexer within the link. 141
160 6 Conclusions 6.1 Summary of work This thesis investigates CWDM wavelength monitoring, the accuracy with which CWDM wavelengths must be measured and the implementation of a wavelength monitor capable of reaching the desired accuracy. A summary of the work is as follows: The relevant CWDM and the ITU-T standards and the need for long term wavelength monitoring have been discussed. After a detailed analysis of wavelength drift in CWDM systems an overview of a model to determine its impact is considered. Using industry best practice in measuring BER the following is assumed; when a links BER is measured and returns a value of 1x10-12, it can be said that the BER is better than 1x10-12 with a confidence level of 95%. Using this assumption, a worst-case BER is calculated. A detailed argument is developed linking this calculated worst-case BER to the wavelength drift that causes an equivalent degradation in a links BER. A CWDM system model is then tested and validated. Using the system model the wavelength drift that causes an equivalent degradation of a links BER is determined, hence this value of wavelength drift is taken as the wavelength meter s minimum wavelength accuracy. Following this a CWDM wavelength monitor is specified with a view to identifying a suitable candidate technology for implementation as a proof of principle. The wavelength resolution limits of the proposed candidate technology are investigated followed by a proof of principle experiment to demonstrate that the desired resolution is achievable. 142
161 6.2 Thesis conclusions The conclusions in this section are drawn from across the thesis and are divided into a number of distinct areas. Conclusions regarding CWDM and wavelength drift: A CWDM system model based in ITU-T G.695 application code S-C4L1-1D2, that simulates how a CWDM source undergoing wavelength drift impacts the links BER under worst case conditions, was developed in OptiSystem using data from ITU-T recommendations and commercial datasheets. Using the CWDM system model, it was verified that when a source s wavelength drift was within the of ±6.5 nm, maximum central wavelength deviation, as specified in ITU-T G.695, that the drifts impact on attenuation and dispersion is marginal. This marginal change is due, in part, to the wavelength dependence of attenuation and dispersion in an optical fibre and also the insertion loss ripple in the systems multiplexer and demultiplexer. When the source s wavelength drifts beyond the ±6.5 nm limit, the links attenuation is impacted rapidly due to the concatenated impact of the optical filters roll-off in both the multiplexer and demultiplexer. The system model was tested and validated using worst case values, ensuring the individual components behaved as expected with particular attention paid to the multiplexer and demultiplexer due to their strong wavelength dependence. Conclusions regarding wavelength accuracy: It was found that the accuracy and resolution parameters of test and measurement equipment are often incorrectly used as interchangeable. 143
162 This work found that instruments are typically calibrated against a known standard to maximise the agreement between the measured value and the known standard. Hence, this work concludes that wavelength accuracy ultimately depends on the engineering of a device and the calibration process used. Therefore, a wavelength measurement technique that can measure wavelength with a minimum resolution of nm can with appropriate calibration and engineering measure wavelength with the same accuracy. The accuracy of wavelength measurement instruments for CWDM does not appear to be set by any particular test and measurement requirement or industry standard but by the limitations of the technology employed to measure wavelength or the need to get a particular competitive specification advantage over a rival instrument manufacturer. The thesis developed a successful analytic approach in determining the required wavelength accuracy of a wavelength monitor for CWDM systems independent of the implementation approach. The approach used examined how wavelength drift impacts the most important system parameter in CWDM systems, specifically error performance. To implement the analytical approach a source of data was required. It was found that statistical confidence levels of BER measurements taken by typical industry test and measurement equipment could be used for this purpose. Thus, the wavelength drift in excess of ± 6.5 nm that gave an equivalent degradation of the worst-case BER was calculated. It was concluded that if the accuracy of the wavelength monitor is better than nm, the value of the excess wavelength drift, then the confidence with which drift can be measured is comparable to the confidence which engineers and designers accept in measuring BER. 144
163 Conclusions regarding ratiometric wavelength measurement: It was found that the use of a ratiometric technique in wavelength measurement offers many benefits including: a relatively simple design, the potential to use all-fibre components, the use of well-established wavelength measurement techniques, its immunity to source power fluctuations, its speed of measurement limited only by the power measurement electronics and its potentially mechanically robust nature. A significant disadvantage of using a ratiometric wavelength measurement technique is that it cannot measure the wavelength of multiplexed signals. Therefore, strictly speaking, the wavelength monitor being proposed may only be suitable for black link type system interfaces as defined by the ITU-T. However, this is not a significant limitation as many black box implementations use individual transponder cards patched to a multiplexer, hence access to non-multiplexed signals is possible. State of the art ratiometric wavelength techniques demonstrate picometers wavelength resolutions (2 pm to 10 pm) over limited wavelength ranges (50 to 60 nm). This thesis has shown, by using a basic model and worst-case assumptions regarding a laser s SNR that the required wavelength resolution of nm cannot be met using a basic ratiometric technique. The analysis of the model s results shows that the limitations of the wavelength meter s accuracy are due to a combination of the large filter discrimination required, the wide wavelength range and the limited SNR of CWDM sources. By adapting the model to simulate placing such a wavelength measurement system at the RS reference point, it was shown that the optical power due to the 145
164 sources wideband noise would be significantly reduced as the signal under test will pass through two narrowband optical filters (in the multiplexer and demultiplexer). Analysis showed that by placing the wavelength measurement system at the RS reference point, the ratiometric wavelength measurement system s wavelength resolution would exceed the desired nm. It was concluded that such a wavelength measurement system based on this technique and with suitable engineering and calibration, if placed at the RS reference point, has the potential to have a wavelength accuracy better than nm. Conclusions regarding proof of principle experiment: It was concluded that a wavelength change of 0.1 nm can be detected by a CWDM wavelength monitor using a ratiometric technique when the monitor is placed at the Rs reference point and hence, with suitable engineering and calibration an accuracy of 0.1 nm can be achieved. It was concluded that the results of the proof of principle experiment show that by placing the CWDM wavelength monitor at the Rs reference point that the wide band noise from the source will be significantly attenuated, resulting in the wavelength discriminators wavelength response following close to the ideal as opposed to diverging away. 146
165 6.3 Future work In Chapters 2 & 3, using Optisystem, the work developed a worst-case CWDM model and hence calculated a wavelength measurement system s minimum wavelength accuracy. The model was based on ITU-T G.695 application code S-C4L1-1D2, a unidirectional, four-channel, 2.5 Gbit/s link. This is one of many possible CWDM implementations with others having more channels, different target lengths, different bit rates and bidirectional operation. Future work can include, using the same rational, calculating the minimum wavelength accuracy for other ITU-T G.695 application codes. In Chapter 5, a simple model, developed by Q. Wang et al [91], of the transmission response of an optical discriminator and the ratio of the optical power detected was used to investigate the limitations of the ratiometric technique. The model was expanded for use over the CWDM range and further adapted to simulate the addition of the optical bandpass filters in the multiplexer and demultiplexer. This simple model made a number of assumptions; The filter response is linear, for example the discrimination increases at 0.1 db per nm. The wide-band noise, due to the spontaneous emission of the laser, is constant over the full wavelength measurement range of the system. Future work should consider adapting the filter response to accurately represent the discriminator being used, in this case a WDM coupler. As can be seen in Figure 5-12 the response of a WDM coupler is not linear. In addition, the model can be adapted to better represent the spectral response and wide band noise of a real CWDM laser. To achieve the required wavelength accuracy, it has been concluded that the wavelength measurement system must be placed at the RS reference point. It should be noted that the worst-case optical power researching the wavelength monitors detectors is approximately -68 dbm assuming a worst-case receiver sensitivity of -28 dbm (across all ITU-T G.695 application codes), a 1% tap (~20 db) and a maximum discrimination 147
166 of 20 db. Future work should consider power measurement at such a level and its impact on ratiometric power measurement, with power averaging a common technique used to minimise noise. The proof of principle was carried out using a 1x2 WDM splitter with operating wavelengths 1310 nm and 1625 nm. As discussed in Section 5.6, this splitter does not cover the required wavelength range for use in a CWDM monitor. Future work should consider having a custom splitter manufactured such that the required wavelength range (1261 nm to 1611 nm) lies in the monotonically increasing section of the response, with an optimised discrimination. 148
167 7 Bibliography [1] I. T. U. ITU-T, G Spectral grids for WDM applications: CWDM wavelength grid, [2] Corning, Corning SMR-28e+ Optical Fiber - Product Information, July [Online]. Available: [Accessed ]. [3] Proximion AB, [Online]. Available: b02c194ef15116/ / d-ldo-wistom-white-paper- Optical-Layer-Monitoring-web.pdf. [Accessed 23 November 2015]. [4] International Telecommunication Union - Telecommunication Standardization Sector, ITU-T in brief, [Online]. Available: T/about/Pages/default.aspx. [Accessed ]. [5] International Telecommunication Union - Telecommunication Standardization Sector, ITU Manual Optical fibers, cables and systems, ITU, [6] Ciena: the network specialist, What is WDM, [Online]. Available: [Accessed ]. [7] I. T. U. ITU-T, G Optical interfaces for coarse wavelength division multiplexing applications, [8] J. Hect, Great leaps of light, IEEE Spectrum, vol. Feb, pp , Feb
168 [9] M. N. Hans Jorg Thiele, Coarse Wavelength Division Multiplexing: Technologies and Applications (Optical Science and Engineering), CRC Press, [10] I. T. U. ITU-T, G Optical interfaces for multichannel systems with optical amplifiers, [11] Nebeling, Marcus; Fiber Network Engineering, CWDM: lower cost for more capacity in the short-haul, 03 July [Online]. Available: [Accessed ]. [12] C. Henry, Theory of the Linewidth of Semiconductor Lasers, IEEE Journal of Quantum Electronics, vol. 18, no. 2, pp , [13] R. A. Linke, Modulation Induced Transient Chirping in Single Frequency Laser, IEEE Journal of Quantum Electronics, vol. 21, no. 6, pp , [14] RP Photonics, RP Photonics Encyclopedia - Self phase modulation, [Online]. Available: [Accessed ]. [15] J. C. Whitaker, The Electronics Handbook, CRC Press, [16] Cypress Semiconductor Corporation, AN Understanding Temperature Specifications: An Introduction, [Online]. Available: [Accessed ]. [17] P. McCluskey, C. O'Connor and K. Nathan, Evaluating the Performance and Reliability of Embedded Computer Systems for Use in Industrial and Automotive Temperature Ranges, CALCE Electronic Products and Systems Center, University of Maryland, [Online]. Available: [Accessed ]. 150
169 [18] D. Manners, Auto IC Sales Only 7.4% Of Semi Market, ElectronicsWeekly.com, [Online]. Available: 05/. [Accessed ]. [19] ASHRAE Technical Committee (TC) 9.9, Standards, Research & Technology - TC Mission Critical Facilities, Data Centers, Technology Spaces and Electronic Equipment, American Society of Heating, Refrigerating, and Air- Conditioning Engineers, [Online]. Available: [Accessed ]. [20] American Society of Heating, Refrigerating, and Air-Conditioning Engineers, ASHRAE TC Thermal Guidelines for Data Processing Environments Expanded Data Center Classes and Usage Guidance, ASHRAE Technical Committee 9.9, [21] D. Yevick, A Short Course in Computational Science and Engineering - C++, Java and Octave Numerical Programming with Free Software Tools, Cambridge University Press, [22] D. S. H. S. Al-Bazzaz, Simulation of Single Mode Fiber Optics and Optical Communication Components Using VC++, International Journal of Computer Science and Network Security, vol. 8, no. 2, pp , [23] D. N. L. a. V. Iakhnine, Optical waveguides: numerical modeling, [Online]. Available: [Accessed ]. 151
170 [24] Optiwave Systems Inc., Access Networks, [Online]. Available: [Accessed ]. [25] K. Ismail, P. S. Menon, H. A. Bakarman, A. A. A. Bakar and N. Arsad, Performance of 18 channel CWDM system with inline Semiconductor Optical Amplifier, in 2012 IEEE 3rd International Conference on Photonics, Penang, [26] M. T. M. Y. Mohammad Syuhaimi Ab-Rahman, OXADM restoration schemes in CWDM metropolitan ring network, in th IFIP International Conference on Wireless and Optical Communications Networks, Surabaya, [27] Optiwave Systems Inc, Optical Communication System and Amplifier Design Software, [Online]. Available: [Accessed ]. [28] I. T. U. ITU-T, ITU-T, G Optical interfaces for equipments and systems relating to the synchronous digital hierarchy (SDH), [29] I. T. U. ITU-T, ITU-T, G.955 Digital line systems based on the 1544 kbit/s and the 2048 kbit/s hierarchy on optical fibre cables, [30] I. T. U. ITU-T, ITU-T, G Transmission characteristics of optical components and subsystems, [31] Fiber Optic Mania, G.652D Low water peak Optical fiber characteristics and applications, [Online]. Available: [Accessed ]. 152
171 [32] 1. E. A GEA, Optical Fiber and 10 Gigabit Ethernet, [Online]. Available: [Accessed ]. [33] P.-K. Lau and T. Makino, Effects of Laser Diode Parameters on Power Penalty in 10 Gb/s Optical Fiber Transmission Systems, Journal of Lightwave Technology, vol. 15, no. 9, pp , [34] M. R. A. G. H. a. M. Z. M. S. M. Jahangir Alam, Bit Error Rate Optimization in Fiber Optic Communications, International Journal of Machine Learning and Computing, vol. 1, no. 5, pp , [35] M. Y. J. John M. Senior, Optical Fiber Communications: Principles and Practice, Pearson Education, [36] Maxim, Technical Article HFTA Statistical Confidence Levels for Estimating Error Probability, [Online]. Available: [Accessed ]. [37] M. G.. E. Design, Bit-Error-Rate Testers Face Ethernet Speed Challenges, Electronic Design, [Online]. Available: [Accessed ]. [38] Keysight Technologies, How do I measure Bit Error Rate (BER) to a given confidence level on N490xA/B Serial BERTs?, Keysight Technologies, [Online]. Available: nid= &id= [Accessed ]. 153
172 [39] Michael Fleischer Reumann - Agilent Technologies, BER measurements for 100GbE, in IEEE Higher Speed Study Group - interim meeting Monterey, Monterey, [40] I. T. U. ITU-T, Series G Supplement 39 - Optical system design and engineering consideration, International Telecommunications Union, [41] HyperPhysics, Binomial Distribution Function, [Online]. Available: [Accessed ]. [42] Maxim Integrated, Technical Article HFTA Physical Layer Performance: Testing the Bit Error Ratio (BER), [Online]. Available: [Accessed ]. [43] Yale University - Department of Statistics, The Binomial Distribution, [Online]. Available: [Accessed ]. [44] M. M. Dennis Derickson, BER measurement as a binomial process, in Digital Communications Test and Measurement: High-Speed Physical Layer Characterization, Boston, Pearson Education, [45] A. Papoulis, Probability, Random Variables, and Stochastic Processes, McGraw-Hill, [46] G. E. Obarski and J. D. Splett, Measurement Assurance Program for the spectral density of relative intensity noise of optical fibre sources near 1550 nm, National Institute of Standards and Technology - Special Publication , p. 5. [47] OptiWave Systems Inc., OptiSystem Component Library - Optical Communication System Design Software, vol. Version
173 [48] G. P. Agrawal, Fiber Optic Communication Systems, New York: John Wiley & Sons, [49] J. C. Cartledge and G. S. Burley, The Effect of Laser Chirping on Lightwave System Performance, Journal of Lightwave Technology, vol. 7, no. 3, pp , [50] D. Derickson, Fiber Optic Test and Measurement, New Jersey: Prentice Hall, [51] National Instruments, Understanding Instrument Specifications -- How to Make Sense Out of the Jargon, [Online]. Available: [Accessed ]. [52] Applied Meaurements Ltd., Aldermaston, Reading, UK, Accuracy vs. Resolution Differences Explained, [Online]. Available: [Accessed ]. [53] L. A. Johnson, Laser diode burn-in and reliability testing, IEEE Communications Magazine, vol. 44, no. 2, pp. 4-7, [54] M. Fukuda, Materials and reliability handbook for semiconductor optical and electron devices, S. J. Pearton and O. Ueda, Eds., New York: Springer Science & Business Media, [55] European Commission, Electromagnetic Compatibility (EMC) Directive 2014/30/EU, [Online]. Available: [Accessed ]. [56] Keystone Compliance, EN Testing, [Online]. Available: [Accessed ]. 155
174 [57] S.-L. Lee, C.-T. Pien and Y.-Y. Hsu, Wavelength monitoring in DWDM networks using low cost semiconductor laser diode/amplifiers, in Optical Fiber Communication Conference, Baltimore, MD, USA, [58] S. M. Melle, K. Liu and R. M. Measures, A passive wavelength demodulation system for guided-wave Bragg grating sensors, IEEE Photonics Technology Letters, vol. 4, no. 5, pp , [59] A. Ribeiro, L. A. Ferreira, M. Tsvetkov and J. L. Santos, All-fibre interrogation technique for fibre Bragg sensors using a biconical fibre filter, Electronics Letters, vol. 32, no. 4, pp , [60] M. H. Hu, X. Liu, C. Caneau, Y. Li, R. Bhat, K. Song and C.-E. Zah, Testing of High-Power Semiconductor Laser Bars, JOURNAL OF LIGHTWAVE TECHNOLOGY, vol. 23, no. 2, pp , [61] D. Cooper and P. Smith, Simple and highly sensitive method for wavelength measurement of low-power time-multiplexed signals using optical amplifiers, Journal of Lightwave Technology, vol. 21, no. 7, pp , [62] E. Shan, Y. Li, B. Xu, C. Shen, C. Zhao and X. Dong, All fiber real-time laser wavelength measurement method based on Faraday rotation effect, IEEE Photonics Technology Letters, vol. 27, no. 21, pp , IEEE Photonics Technology Letters. [63] Q. Wang, G. Farrell, T. Freir, G. Rajan and P. Wang, Low-cost wavelength measurement based on a macrobending single-mode fiber, Optics Letters, vol. 31, no. 12, p. 1785, [64] P. Wang, Y. Semenova and G. Farrell, Temperature dependence of macrobending loss in all-fiber bend loss edge filter, Optics Communications, vol. 281, no. 17, pp ,
175 [65] T. Parker and M. Farhadiroushan, Femtometer resolution optical wavelength meter, IEEE Photonics Technology Letters, vol. 13, no. 4, pp , [66] M. Guy, B. Villeneuve, C. Latrasse and M. Tetu, Simultaneous absolute frequency control of laser transmitters in both 1.3 and 1.55 μm bands for multiwavelength communication systems, Journal of Lightwave Technology, vol. 14, no. 6, pp , [67] Keysight Technologies (Formally Agilent electronics), 86122C Multi- Wavelength Meter - Manual, [Online]. Available: [Accessed ]. [68] HighFinesse laser and electronic systems, High Precision Wavelength Meter, [Online]. Available: [Accessed ]. [69] Laser Focus World, WAVELENGTH METERS: How to select a wavelength meter, [Online]. Available: 8/features/wavelength-meters-how-to-select-a-wavelength-meter.html. [Accessed ]. [70] Neospectra SI-WARE SYSTEMS, About NeoSpectra modules, [Online]. Available: [Accessed ]. [71] Anritsu, Optical spectrum analyser, MS 9740A operations manual, [Online]. Available: 157
176 measurement/files/manuals/operation- Manual/MS9740A_Operation_Manual_e_15_0.pdf. [Accessed ]. [72] B. Kim, J. Sinibaldi and G. Karunasiri, MEMS Scanning Diffraction Grating Spectrometer, in IEEE/LEOS International Conference on Optical MEMS and Their Applications Conference, Big Sky, Montana, [73] A. Kenda, W. Scherf, R. Hauser, H. Grüger and H. Schenk, A Compact Spectrometer based on a Micromachined Torsional Mirror Device, in Proceeding of IEEE Sensors 2004 Third IEEE International Conference on Sensors, Vienna, [74] Fraunhofer Institute for Photonic Microsystems, Miniaturized MEMS grating spectrometer, [Online]. Available: laettersensorik/ipms/englisch/miniaturized%20mems%20grating%20spectr ometer_en.pdf. [Accessed ]. [75] J. Domingo, J. Pelayo, F. Villuendas, C. Heras and E. Pellejer, Very high resolution optical spectrometry by stimulated Brillouin scattering, IEEE Photonics Technology Letters, vol. 17, no. 4, pp , [76] K.-U. Lauterbach, T. Schneider, R. Henker, M. J. Ammann and A. T. Schwarzbacher, Fast and simple high resolution optical spectrum analyzer, in The Optical Society of America - Conference on Lasers and Electro-Optics 2008, San Jose. [77] Aragon Photonics, Technology - Brillouin high-resolution spectroscopy, [Online]. Available: [Accessed ]. 158
177 [78] G. R. Vargas and R. R. Panepucci, Wavelength monitoring using a thermally tuned micro-ring resonator, in 10th International Conference on Numerical Simulation of Optoelectronic Devices, Atlanta, [79] M. Xu, H. Geiger, J. Archambault, L. Reekie and J. Dakin, Novel interrogating system for fibre Bragg grating sensors using an acousto-optic tunable filter, Electronics Letters, vol. 29, no. 17, p. 1510, [80] Y.-Q. Lu, C. Wong and S.-T. Wu, A liquid crystal-based Fourier optical spectrum analyzer, IEEE Photonics Technology Letters, vol. 16, no. 3, pp , [81] D. Herve, J. E. Viallet, S. Salaun, A. Le Corre, F. Delorme and B. Mainguet, Tunable narrowband optical filter in photorefractive InGaAsP:Fe/InP:Fe singlemode waveguide, in International Conference on Indium Phosphide and Related Materials, Cape Cod, MA, USA, [82] D. Baney, B. Szafraniec and A. Motamedi, Coherent optical spectrum analyzer, IEEE Photonics Technology Letters, vol. 14, no. 3, pp , [83] H. Furukawa, T. Saitoh, K. Nakamura, K. Kawakita, M. Koshihara and H. Shimotahira, Fast-Sweep, High-Resolution Optical Spectrum Analyzer, in 18th OptoElectronics and Communications Conference held jointly with 2013 International Conference on Photonics in Switching, Kyoto, [84] Keysight Technologies, 83453B High Resolution Spectrometer, [Online]. Available: [Accessed ]. 159
178 [85] RP Photonics, RP Photonics Encyclopedia - Wavemeters, [Online]. Available: [Accessed ]. [86] RP Photonics, RP Photonics Encyclopedia Spectrometers, [Online]. Available: [Accessed ]. [87] G. P. Agrawal, Lightwave Technology - Components and Devices, New Jersey: John Wiley and Sons Inc., [88] S. Mohan, V. Arjunan and S. P. Jose, Fiber Optics and Optoelectronic Devices, Morgan James Publishing, [89] T. Li and T. Liu, Outlook and Challenges of Nano Devices, Sensors, and MEMS, Springer International Publishing, [90] H. Hosaka, Y. Katagiri, T. Hirota and K. Itao, Micro-Optomechatronics, CRC Press, [91] Q. Wang, G. Farrell and T. Freir, Study of Transmission Response of Edge Filters Employed in Wavelength Measurements, Applied Optics, vol. 44, no. 36, p. 7789, [92] A. Reichelt, H. Michel and W. Rauscher, Wavelength-division multi demultiplexers for two-channel single-mode transmission systems, Journal of Lightwave Technology, vol. 2, no. 5, pp , [93] P. Wang, M. Ding, G. Brambilla, Y. Semenova, Q. Wu and G. Farrell, Resolution improvement of a ratiometric wavelength measurement system by using an optical microfibre coupler, in Photonics and Optoelectronics - Symposium on Photonics and Optoelectronics, Shanghai,
179 [94] Newport, WDM (Wavelength Division Multiplexer) and EDFA Tap Coupler, [Online]. Available: [Accessed ]. [95] A. M. Hatta, G. Farrell, Q. Wang, G. Rajan, P. Wang and Y. Semenova, Ratiometric wavelength monitor based on singlemode-multimode-singlemode fiber structure, Microwave and Optical Technology Letters, vol. 50, no. 20, pp , [96] A. Hatta, G. Rajan, Y. Semenova and G. Farrell, SMS Fibre Structure for Temperature Measurement Using a Simple Intensity-Based Interrogation System, Electronics Letters, vol. 45, no. 21, pp ,
180 Appendix A 162
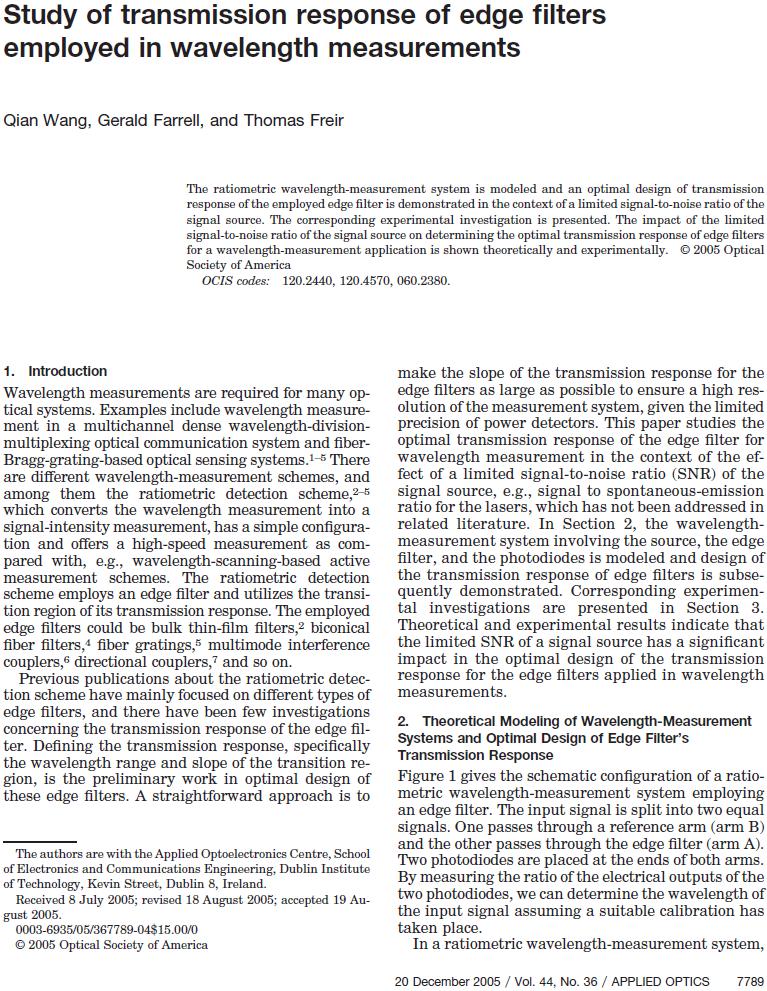
181 163
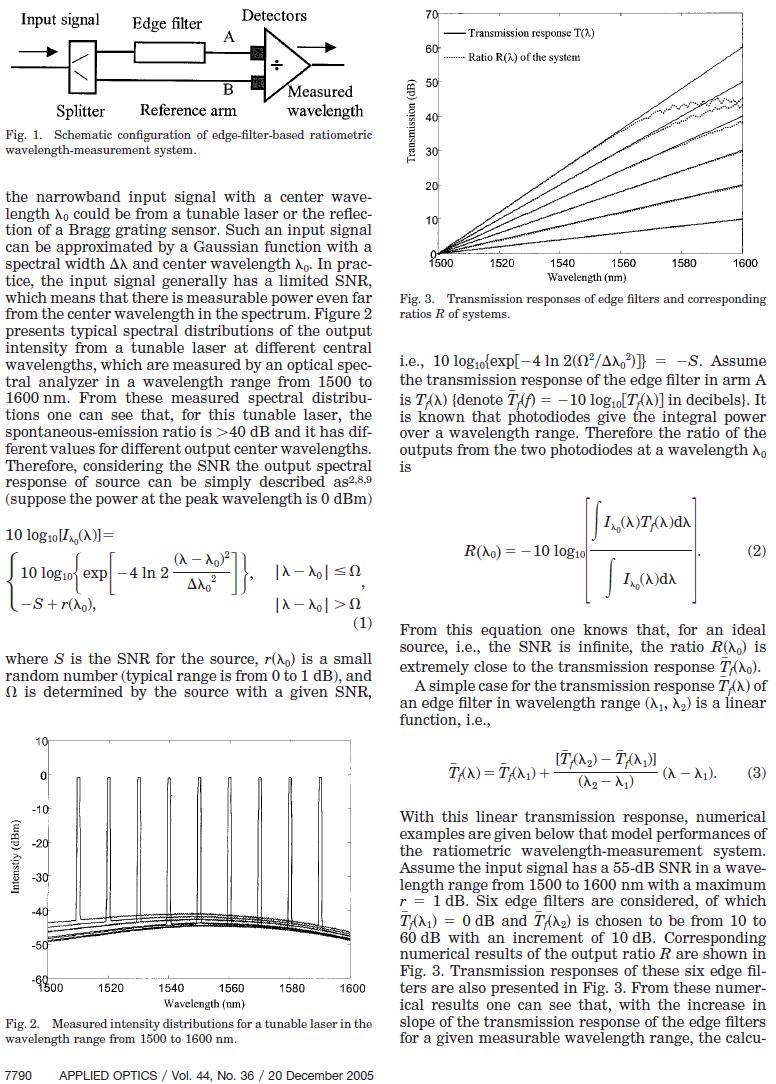
182 164
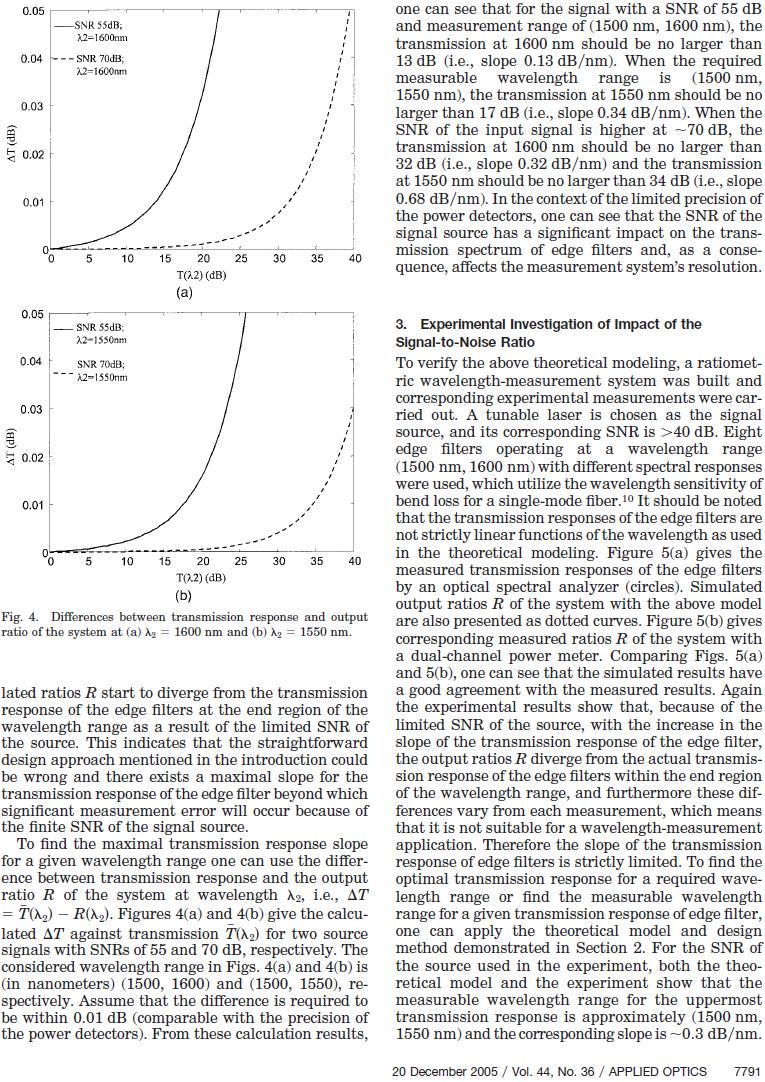
183 165
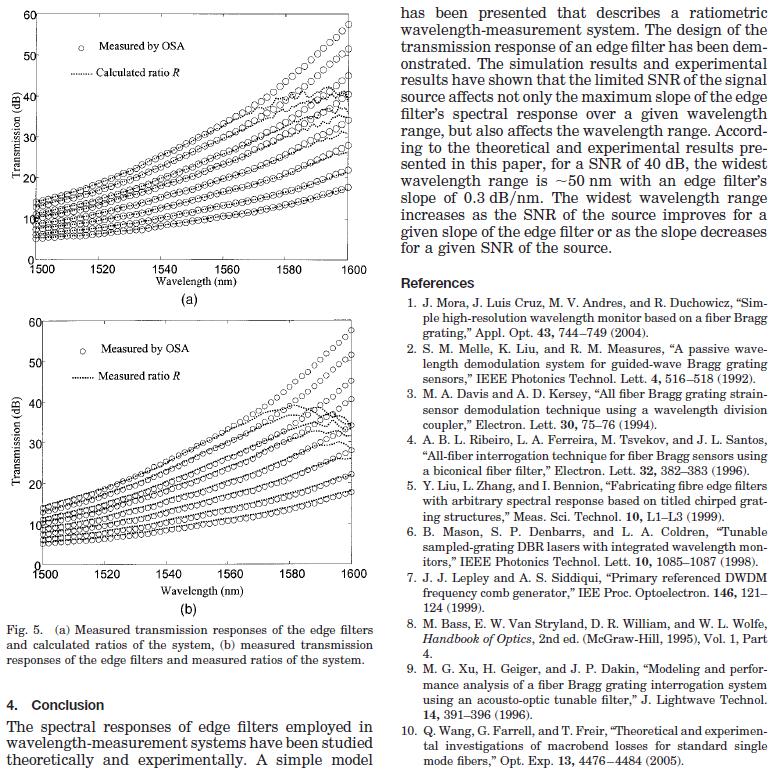
184 166
ITU-T G.695. Optical interfaces for coarse wavelength division multiplexing applications
 International Telecommunication Union ITU-T G.695 TELECOMMUNICATION STANDARDIZATION SECTOR OF ITU (10/2010) SERIES G: TRANSMISSION SYSTEMS AND MEDIA, DIGITAL SYSTEMS AND NETWORKS Transmission media and
Effect of SNR of Input Signal on the Accuracy of a Ratiometric Wavelength Measurement System
 Dublin Institute of Technology ARROW@DIT Articles School of Electrical and Electronic Engineering 2007-05-01 Effect of SNR of Input Signal on the Accuracy of a Ratiometric Wavelength Measurement System
Dr. Monir Hossen ECE, KUET
 Dr. Monir Hossen ECE, KUET 1 Outlines of the Class Principles of WDM DWDM, CWDM, Bidirectional WDM Components of WDM AWG, filter Problems with WDM Four-wave mixing Stimulated Brillouin scattering WDM Network
ITU-T G (11/2009) Multichannel DWDM applications with single-channel optical interfaces
 Multichannel DWDM applications with single-channel optical interfaces") International Telecommunication Union ITU-T TELECOMMUNICATION STANDARDIZATION SECTOR OF ITU G.698.1 (11/2009) SERIES G: TRANSMISSION SYSTEMS AND MEDIA, DIGITAL SYSTEMS AND NETWORKS Transmission media and
International Telecommunication Union ITU-T TELECOMMUNICATION STANDARDIZATION SECTOR OF ITU G.698.1 (11/2009) SERIES G: TRANSMISSION SYSTEMS AND MEDIA, DIGITAL SYSTEMS AND NETWORKS Transmission media and
Multichannel DWDM applications with single channel optical interfaces for repeaterless optical fibre submarine cable systems
 International Telecommunication Union ITU-T TELECOMMUNICATION STANDARDIZATION SECTOR OF ITU G.973.2 (04/2011) SERIES G: TRANSMISSION SYSTEMS AND MEDIA, DIGITAL SYSTEMS AND NETWORKS Digital sections and
ITU-T G (07/2007) Amplified multichannel DWDM applications with single channel optical interfaces
 Amplified multichannel DWDM applications with single channel optical interfaces") International Telecommunication Union ITU-T TELECOMMUNICATION STANDARDIZATION SECTOR OF ITU G.698.2 (07/2007) SERIES G: TRANSMISSION SYSTEMS AND MEDIA, DIGITAL SYSTEMS AND NETWORKS Transmission media and
International Telecommunication Union ITU-T TELECOMMUNICATION STANDARDIZATION SECTOR OF ITU G.698.2 (07/2007) SERIES G: TRANSMISSION SYSTEMS AND MEDIA, DIGITAL SYSTEMS AND NETWORKS Transmission media and
Elements of Optical Networking
 Bruckner Elements of Optical Networking Basics and practice of optical data communication With 217 Figures, 13 Tables and 93 Exercises Translated by Patricia Joliet VIEWEG+ TEUBNER VII Content Preface
Analysis of four channel CWDM Transceiver Modules based on Extinction Ratio and with the use of EDFA
 Analysis of four channel CWDM Transceiver Modules based on Extinction Ratio and with the use of EDFA P.P. Hema [1], Prof. A.Sangeetha [2] School of Electronics Engineering [SENSE], VIT University, Vellore
Ratiometric Wavelength Monitor Based on Singlemode-Multimode-Singlemode Fiber Structure
 Dublin Institute of Technology ARROW@DIT Articles School of Electrical and Electronic Engineering 8-1-1 Ratiometric Wavelength Monitor Based on Singlemode-Multimode-Singlemode Fiber Structure Agus Hatta
Mixing TrueWave RS Fiber with Other Single-Mode Fiber Designs Within a Network
 Mixing TrueWave RS Fiber with Other Single-Mode Fiber Designs Within a Network INTRODUCTION A variety of single-mode fiber types can be found in today s installed networks. Standards bodies, such as the
Fiber-Optic Communication Systems
 Fiber-Optic Communication Systems Second Edition GOVIND P. AGRAWAL The Institute of Optics University of Rochester Rochester, NY A WILEY-iNTERSCIENCE PUBLICATION JOHN WILEY & SONS, INC. NEW YORK / CHICHESTER
11.1 Gbit/s Pluggable Small Form Factor DWDM Optical Transceiver Module
 INFORMATION & COMMUNICATIONS 11.1 Gbit/s Pluggable Small Form Factor DWDM Transceiver Module Yoji SHIMADA*, Shingo INOUE, Shimako ANZAI, Hiroshi KAWAMURA, Shogo AMARI and Kenji OTOBE We have developed
S Optical Networks Course Lecture 4: Transmission System Engineering
 S-72.3340 Optical Networks Course Lecture 4: Transmission System Engineering Edward Mutafungwa Communications Laboratory, Helsinki University of Technology, P. O. Box 2300, FIN-02015 TKK, Finland Tel:
Advanced Test Equipment Rentals ATEC (2832)
") Established 1981 Advanced Test Equipment Rentals www.atecorp.com 800-404-ATEC (2832) BN 8000 May 2000 Profile Optische Systeme GmbH Gauss Str. 11 D - 85757 Karlsfeld / Germany Tel + 49 8131 5956-0 Fax
Established 1981 Advanced Test Equipment Rentals www.atecorp.com 800-404-ATEC (2832) BN 8000 May 2000 Profile Optische Systeme GmbH Gauss Str. 11 D - 85757 Karlsfeld / Germany Tel + 49 8131 5956-0 Fax
Performance Evaluation of 32 Channel DWDM System Using Dispersion Compensation Unit at Different Bit Rates
 Performance Evaluation of 32 Channel DWDM System Using Dispersion Compensation Unit at Different Bit Rates Simarpreet Kaur Gill 1, Gurinder Kaur 2 1Mtech Student, ECE Department, Rayat- Bahra University,
VePAL UX400 Universal Test Platform
 CWDM and DWDM Testing VePAL UX400 Universal Test Platform Optical Spectrum/Channel Analyzer for CWDM and DWDM Networks Using superior micro-optic design and MEMS tuning technology, the UX400 OSA module
Module 19 : WDM Components
 Module 19 : WDM Components Lecture : WDM Components - I Part - I Objectives In this lecture you will learn the following WDM Components Optical Couplers Optical Amplifiers Multiplexers (MUX) Insertion
Chirped Bragg Grating Dispersion Compensation in Dense Wavelength Division Multiplexing Optical Long-Haul Networks
 363 Chirped Bragg Grating Dispersion Compensation in Dense Wavelength Division Multiplexing Optical Long-Haul Networks CHAOUI Fahd 3, HAJAJI Anas 1, AGHZOUT Otman 2,4, CHAKKOUR Mounia 3, EL YAKHLOUFI Mounir
Multiplexing. Timeline. Multiplexing. Types. Optically
 Multiplexing Multiplexing a process where multiple analog message signals or digital data streams are combined into one signal over a shared medium Types Time division multiplexing Frequency division multiplexing
Implementation of Dense Wavelength Division Multiplexing FBG
 AUSTRALIAN JOURNAL OF BASIC AND APPLIED SCIENCES ISSN:1991-8178 EISSN: 2309-8414 Journal home page: www.ajbasweb.com Implementation of Dense Wavelength Division Multiplexing Network with FBG 1 J. Sharmila
WDM. Coarse WDM. Nortel's WDM System
 WDM wavelength-division multiplexing (WDM) is a technology which multiplexes a number of optical carrier signals onto a single optical fiber by using different wavelengths (i.e. colors) of laser light.
RXT-1200 Modular Test Platform
 CWDM and DWDM Testing RXT-1200 Modular Test Platform Optical Spectrum/Channel Analyzer for CWDM and DWDM Networks Using superior micro-optic design and MEMS tuning technology, the RXT-4500 OSA module measures
CWDM Cisco CWDM wavelengths (nm)
") Cisco Enhanced Wavelength Division Multiplexing Product Line The Cisco enhanced wavelength-division multiplexing (EWDM) product line allows users to scale the speed and capacity of the services offered
Cisco Enhanced Wavelength Division Multiplexing Product Line The Cisco enhanced wavelength-division multiplexing (EWDM) product line allows users to scale the speed and capacity of the services offered
DWDM Mux/Demux product range
 DWDM Mux/Demux product range passively athermal DWDM & Ultra DWDM Polarization Maintaining DWDM tunable Mux/Demux range rev 1. mics athermal DWDM Mux / Demux benefits no temperature control required optical
Optical Transport Tutorial
 Optical Transport Tutorial 4 February 2015 2015 OpticalCloudInfra Proprietary 1 Content Optical Transport Basics Assessment of Optical Communication Quality Bit Error Rate and Q Factor Wavelength Division
Agilent 83430A Lightwave Digital Source Product Overview
 Agilent Lightwave Digital Source Product Overview SDH/SONET Compliant DFB laser source for digital, WDM, and analog test up to 2.5 Gb/s 52 Mb/s STM-0/OC-1 155 Mb/s STM-1/OC-3 622 Mb/s STM-4/OC-12 2488
Semiconductor Optical Amplifiers (SOAs) as Power Boosters. Applications Note No. 0001
 as Power Boosters. Applications Note No. 0001") Semiconductor Optical Amplifiers (s) as Power Boosters Applications Note No. 0001 Semiconductor Optical Amplifiers (s) as Power Boosters There is a growing need to manage the increase in loss budgets associated
Semiconductor Optical Amplifiers (s) as Power Boosters Applications Note No. 0001 Semiconductor Optical Amplifiers (s) as Power Boosters There is a growing need to manage the increase in loss budgets associated
Contents for this Presentation. Multi-Service Transport
 Contents for this Presentation SDH/DWDM based Multi-Service Transport Platform by Khurram Shahzad ad Brief Contents Description for this of Presentation the Project Development of a Unified Transport Platform
Long-Haul DWDM RF Fiber Optic Link System
 EMCORE Corporation - Broadband Division, Alhambra, CA, USA ABSTRACT EMCORE s vertically integrated ISO-9001 facility, staffed with our optics/rf engineering team, has been successfully designing and manufacturing
ITU-T G.656. Characteristics of a fibre and cable with non-zero dispersion for wideband optical transport
 International Telecommunication Union ITU-T G.656 TELECOMMUNICATION STANDARDIZATION SECTOR OF ITU (12/2006) SERIES G: TRANSMISSION SYSTEMS AND MEDIA, DIGITAL SYSTEMS AND NETWORKS Transmission media characteristics
An Amplified WDM-PON Using Broadband Light Source Seeded Optical Sources and a Novel Bidirectional Reach Extender
 Journal of the Optical Society of Korea Vol. 15, No. 3, September 2011, pp. 222-226 DOI: http://dx.doi.org/10.3807/josk.2011.15.3.222 An Amplified WDM-PON Using Broadband Light Source Seeded Optical Sources
Improved Analysis of Hybrid Optical Amplifier in CWDM System
 Improved Analysis of Hybrid Optical Amplifier in CWDM System 1 Bandana Mallick, 2 Reeta Kumari, 3 Anirban Mukherjee, 4 Kunwar Parakram 1. Asst Proffesor in Dept. of ECE, GIET Gunupur 2, 3,4. Student in
Optical Wavelength Ratiometric Monitoring System for Data Centre CWDM Applications
 Dublin Institute of Technology ARROW@DIT Conference papers School of Electrical and Electronic Engineering 2016-09-06 Optical Wavelength Ratiometric Monitoring System for Data Centre CWDM Applications
Optical Transport Technologies and Trends
 Optical Transport Technologies and Trends A Network Planning Perspective Sept 1, 2014 Dion Leung, Director of Solutions and Sales Engineering dleung@btisystem.com About BTI Customers 380+ worldwide in
UNIT - 7 WDM CONCEPTS AND COMPONENTS
 UNIT - 7 WDM CONCEPTS AND COMPONENTS WDM concepts, overview of WDM operation principles, WDM standards, Mach-Zehender interferometer, multiplexer, Isolators and circulators, direct thin film filters, active
Why Using Fiber for transmission
 Why Using Fiber for transmission Why Using Fiber for transmission Optical fibers are widely used in fiber-optic communications, where they permit transmission over long distances and at very high bandwidths.
Optical Communications and Networks - Review and Evolution (OPTI 500) Massoud Karbassian
 Massoud Karbassian") Optical Communications and Networks - Review and Evolution (OPTI 500) Massoud Karbassian m.karbassian@arizona.edu Contents Optical Communications: Review Optical Communications and Photonics Why Photonics?
Optical Communications and Networks - Review and Evolution (OPTI 500) Massoud Karbassian m.karbassian@arizona.edu Contents Optical Communications: Review Optical Communications and Photonics Why Photonics?
SERIES G: TRANSMISSION SYSTEMS AND MEDIA, DIGITAL SYSTEMS AND NETWORKS Digital sections and digital line system Digital line systems
 International Telecommunication Union ITU-T TELECOMMUNICATION STANDARDIZATION SECTOR OF ITU G.959.1 (11/2009) SERIES G: TRANSMISSION SYSTEMS AND MEDIA, DIGITAL SYSTEMS AND NETWORKS Digital sections and
Performance Comparison of Pre-, Post-, and Symmetrical Dispersion Compensation for 96 x 40 Gb/s DWDM System using DCF
 Performance Comparison of Pre-, Post-, and Symmetrical Dispersion Compensation for 96 x 40 Gb/s DWDM System using Sabina #1, Manpreet Kaur *2 # M.Tech(Scholar) & Department of Electronics & Communication
Photonics (OPTI 510R 2017) - Final exam. (May 8, 10:30am-12:30pm, R307)
 - Final exam. (May 8, 10:30am-12:30pm, R307)") Photonics (OPTI 510R 2017) - Final exam (May 8, 10:30am-12:30pm, R307) Problem 1: (30pts) You are tasked with building a high speed fiber communication link between San Francisco and Tokyo (Japan) which
Photonics (OPTI 510R 2017) - Final exam (May 8, 10:30am-12:30pm, R307) Problem 1: (30pts) You are tasked with building a high speed fiber communication link between San Francisco and Tokyo (Japan) which
Optical Fibre Amplifiers Continued
 1 Optical Fibre Amplifiers Continued Stavros Iezekiel Department of Electrical and Computer Engineering University of Cyprus ECE 445 Lecture 09 Fall Semester 2016 2 ERBIUM-DOPED FIBRE AMPLIFIERS BASIC
Performance Analysis of Gb/s DWDM Metropolitan Area Network using SMF-28 and MetroCor Optical Fibres
 Research Cell: An International Journal of Engineering Sciences ISSN: 2229-6913 Issue Sept 2011, Vol. 4 11 Performance Analysis of 32 2.5 Gb/s DWDM Metropolitan Area Network using SMF-28 and MetroCor Optical
Design of an Optical Submarine Network With Longer Range And Higher Bandwidth
 Design of an Optical Submarine Network With Longer Range And Higher Bandwidth Yashas Joshi 1, Smridh Malhotra 2 1,2School of Electronics Engineering (SENSE) Vellore Institute of Technology Vellore, India
WDM Concept and Components. EE 8114 Course Notes
 WDM Concept and Components EE 8114 Course Notes Part 1: WDM Concept Evolution of the Technology Why WDM? Capacity upgrade of existing fiber networks (without adding fibers) Transparency:Each optical channel
OPTICAL NETWORKS. Building Blocks. A. Gençata İTÜ, Dept. Computer Engineering 2005
 OPTICAL NETWORKS Building Blocks A. Gençata İTÜ, Dept. Computer Engineering 2005 Introduction An introduction to WDM devices. optical fiber optical couplers optical receivers optical filters optical amplifiers
Product Specification. 10Gb/s 200km Telecom CML TM 13pin-GPO Butterfly Transmitter DM /1/2
 Product Specification 10Gb/s 200km Telecom CML TM 13pin-GPO Butterfly Transmitter DM200-01-0/1/2 PRODUCT FEATURES High Performance CML TM Supports multi-bit-rate application, from 9.95Gb/s to 11.1Gb/s
Ph.D. Course Spring Wireless Communications. Wirebound Communications
 Ph.D. Course Spring 2005 Danyo Danev associate professor Div. Data Transmission, Dept. Electrical Engineering Linköping University SWEDEN Wireless Communications Radio transmissions Mobile telephony Satellite
Optical Communications and Networks - Review and Evolution (OPTI 500) Massoud Karbassian
 Massoud Karbassian") Optical Communications and Networks - Review and Evolution (OPTI 500) Massoud Karbassian m.karbassian@arizona.edu Contents Optical Communications: Review Optical Communications and Photonics Why Photonics?
Optical Communications and Networks - Review and Evolution (OPTI 500) Massoud Karbassian m.karbassian@arizona.edu Contents Optical Communications: Review Optical Communications and Photonics Why Photonics?
Testing of DWDM + CWDM high speed systems. Christian Till Technical Sales Engineer, EXFO
 Testing of DWDM + CWDM high speed systems Christian Till Technical Sales Engineer, EXFO Need more bandwidth? xwdm - Class of WDM Devices Wavelength Division Multiplexing (WDM) : Access 2 channels 1310nm,
Reference Distribution
 EPAC 08, Genoa, Italy RF Reference Signal Distribution System for FAIR M. Bousonville, GSI, Darmstadt, Germany P. Meissner, Technical University Darmstadt, Germany Dipl.-Ing. Michael Bousonville Page 1
Spectral Response of FWM in EDFA for Long-haul Optical Communication
 Spectral Response of FWM in EDFA for Long-haul Optical Communication Lekshmi.S.R 1, Sindhu.N 2 1 P.G.Scholar, Govt. Engineering College, Wayanad, Kerala, India 2 Assistant Professor, Govt. Engineering
Photonics and Optical Communication Spring 2005
 Photonics and Optical Communication Spring 2005 Final Exam Instructor: Dr. Dietmar Knipp, Assistant Professor of Electrical Engineering Name: Mat. -Nr.: Guidelines: Duration of the Final Exam: 2 hour You
Optical networking. Emilie CAMISARD GIP RENATER Optical technologies engineer Advanced IP Services
 Optical networking Emilie CAMISARD GIP RENATER Optical technologies engineer Advanced IP Services Agenda Optical fibre principle Time Division Multiplexing (TDM) Wavelength Division Multiplexing (WDM)
S Optical Networks Course Lecture 2: Essential Building Blocks
 S-72.3340 Optical Networks Course Lecture 2: Essential Building Blocks Edward Mutafungwa Communications Laboratory, Helsinki University of Technology, P. O. Box 2300, FIN-02015 TKK, Finland Tel: +358 9
PERFORMANCE ANALYSIS OF 4 CHANNEL WDM_EDFA SYSTEM WITH GAIN EQUALISATION
 PERFORMANCE ANALYSIS OF 4 CHANNEL WDM_EDFA SYSTEM WITH GAIN EQUALISATION S.Hemalatha 1, M.Methini 2 M.E.Student, Department Of ECE, Sri Sairam Engineering College,Chennai,India1 Assistant professsor,department
DWDM Theory. ZTE Corporation Transmission Course Team. ZTE University
 DWDM Theory ZTE Corporation Transmission Course Team DWDM Overview Multiplexing Technology WDM TDM SDM What is DWDM? Gas Station High Way Prowl Car Definition l 1 l 2 l N l 1 l 2 l 1 l 2 l N OA l N OMU
INTERNATIONAL TELECOMMUNICATION UNION TRANSMISSION MEDIA CHARACTERISTICS CHARACTERISTICS OF A DISPERSION-SHIFTED SINGLE-MODE OPTICAL FIBRE CABLE
 INTERNATIONAL TELECOMMUNICATION UNION ITU-T G.653 TELECOMMUNICATION (03/93) STANDARDIZATION SECTOR OF ITU TRANSMISSION MEDIA CHARACTERISTICS CHARACTERISTICS OF A DISPERSION-SHIFTED SINGLE-MODE OPTICAL
Global Consumer Internet Traffic
 Evolving Optical Transport Networks to 100G Lambdas and Beyond Gaylord Hart Infinera Abstract The cable industry is beginning to migrate to 100G core optical transport waves, which greatly improve fiber
OFS AllWave non-dispersion shifted single-mode optical fiber
 The New Standard for Single-Mode Fiber! Product Description OFS AllWave non-dispersion shifted single-mode optical fiber (NDSF) is the industry s first Full-Spectrum fiber designed for optical transmission
Advanced Fibre Testing: Paving the Way for High-Speed Networks. Trevor Nord Application Specialist JDSU (UK) Ltd
 Ltd") Advanced Fibre Testing: Paving the Way for High-Speed Networks Trevor Nord Application Specialist JDSU (UK) Ltd Fibre Review Singlemode Optical Fibre Elements of Loss Fibre Attenuation - Caused by scattering
Advanced Fibre Testing: Paving the Way for High-Speed Networks Trevor Nord Application Specialist JDSU (UK) Ltd Fibre Review Singlemode Optical Fibre Elements of Loss Fibre Attenuation - Caused by scattering
FIBER OPTIC COMMUNICATION LINK LOSS, OSNR AND FEC PERFORMANCE
 Tallinn University of Technology Laboratory exercise 2 of Fiber Optical Communication course FIBER OPTIC COMMUNICATION LINK LOSS, OSNR AND FEC PERFORMANCE Tallinn 2016 Please note that the OSA (Optical
Polarization Dependence of an Edge Filter Based on Singlemode-Multimode-Singlemode Fibre
 Dublin Institute of Technology ARROW@DIT Articles School of Electrical and Electronic Engineering 21-1-1 Polarization Dependence of an Edge Filter Based on Singlemode-Multimode-Singlemode Fibre Agus Hatta
Performance Limitations of WDM Optical Transmission System Due to Cross-Phase Modulation in Presence of Chromatic Dispersion
 Performance Limitations of WDM Optical Transmission System Due to Cross-Phase Modulation in Presence of Chromatic Dispersion M. A. Khayer Azad and M. S. Islam Institute of Information and Communication
Downstream Transmission in a WDM-PON System Using a Multiwavelength SOA-Based Fiber Ring Laser Source
 JOURNAL OF L A TEX CLASS FILES, VOL. X, NO. XX, XXXX XXX 1 Downstream Transmission in a WDM-PON System Using a Multiwavelength SOA-Based Fiber Ring Laser Source Jérôme Vasseur, Jianjun Yu Senior Member,
OFC SYSTEM: Design Considerations. BC Choudhary, Professor NITTTR, Sector 26, Chandigarh.
 OFC SYSTEM: Design Considerations BC Choudhary, Professor NITTTR, Sector 26, Chandigarh. OFC point-to-point Link Transmitter Electrical to Optical Conversion Coupler Optical Fiber Coupler Optical to Electrical
Simulation of Negative Influences on the CWDM Signal Transmission in the Optical Transmission Media
 Simulation of Negative Influences on the CWDM Signal Transmission in the Optical Transmission Media Rastislav Róka, Martin Mokráň and Pavol Šalík Abstract This lecture is devoted to the simulation of negative
Physics 464/564. Research Project: AWG Technology in DWDM System. By: Andre Y. Ma Date:
 Physics 464/564 Research Project: AWG Technology in DWDM System By: Andre Y. Ma Date: 2-28-03 Abstract: The ever-increasing demand for bandwidth poses a serious limitation for the existing telecommunication
OFC SYSTEMS Performance & Simulations. BC Choudhary NITTTR, Sector 26, Chandigarh
 OFC SYSTEMS Performance & Simulations BC Choudhary NITTTR, Sector 26, Chandigarh High Capacity DWDM OFC Link Capacity of carrying enormous rates of information in THz 1.1 Tb/s over 150 km ; 55 wavelengths
Optical Amplifiers Photonics and Integrated Optics (ELEC-E3240) Zhipei Sun Photonics Group Department of Micro- and Nanosciences Aalto University
 Zhipei Sun Photonics Group Department of Micro- and Nanosciences Aalto University") Photonics Group Department of Micro- and Nanosciences Aalto University Optical Amplifiers Photonics and Integrated Optics (ELEC-E3240) Zhipei Sun Last Lecture Topics Course introduction Ray optics & optical
Photonics Group Department of Micro- and Nanosciences Aalto University Optical Amplifiers Photonics and Integrated Optics (ELEC-E3240) Zhipei Sun Last Lecture Topics Course introduction Ray optics & optical
ITU-T G (09/2007) Gigabit-capable Passive Optical Networks (G-PON): Enhancement band
 Gigabit-capable Passive Optical Networks (G-PON): Enhancement band") International Telecommunication Union ITU-T TELECOMMUNICATION STANDARDIZATION SECTOR OF ITU G.984.5 (09/2007) SERIES G: TRANSMISSION SYSTEMS AND MEDIA, DIGITAL SYSTEMS AND NETWORKS Digital sections and
International Telecommunication Union ITU-T TELECOMMUNICATION STANDARDIZATION SECTOR OF ITU G.984.5 (09/2007) SERIES G: TRANSMISSION SYSTEMS AND MEDIA, DIGITAL SYSTEMS AND NETWORKS Digital sections and
Colorless Amplified WDM-PON Employing Broadband Light Source Seeded Optical Sources and Channel-by-Channel Dispersion Compensators for >100 km Reach
 Journal of the Optical Society of Korea Vol. 18, No. 5, October 014, pp. 46-441 ISSN: 16-4776(Print) / ISSN: 09-6885(Online) DOI: http://dx.doi.org/10.807/josk.014.18.5.46 Colorless Amplified WDM-PON Employing
CONTROLLABLE WAVELENGTH CHANNELS FOR MULTIWAVELENGTH BRILLOUIN BISMUTH/ERBIUM BAS-ED FIBER LASER
 Progress In Electromagnetics Research Letters, Vol. 9, 9 18, 29 CONTROLLABLE WAVELENGTH CHANNELS FOR MULTIWAVELENGTH BRILLOUIN BISMUTH/ERBIUM BAS-ED FIBER LASER H. Ahmad, M. Z. Zulkifli, S. F. Norizan,
Polarization Mode Dispersion compensation in WDM system using dispersion compensating fibre
 Polarization Mode Dispersion compensation in WDM system using dispersion compensating fibre AMANDEEP KAUR (Assist. Prof.) ECE department GIMET Amritsar Abstract: In this paper, the polarization mode dispersion
International Journal of Advanced Research in Computer Science and Software Engineering
 ISSN: 2277 128X International Journal of Advanced Research in Computer Science and Software Engineering Research Paper Available online at: Performance Analysis of WDM/SCM System Using EDFA Mukesh Kumar
Optical Local Area Networking
 Optical Local Area Networking Richard Penty and Ian White Cambridge University Engineering Department Trumpington Street, Cambridge, CB2 1PZ, UK Tel: +44 1223 767029, Fax: +44 1223 767032, e-mail:rvp11@eng.cam.ac.uk
UNIVERSITY OF TORONTO FACULTY OF APPLIED SCIENCE AND ENGINEERING. FINAL EXAMINATION, April 2017 DURATION: 2.5 hours
 UNIVERSITY OF TORONTO FACULTY OF APPLIED SCIENCE AND ENGINEERING ECE4691-111 S - FINAL EXAMINATION, April 2017 DURATION: 2.5 hours Optical Communication and Networks Calculator Type: 2 Exam Type: X Examiner:
AC : FIBER OPTICS COURSE FOR UNDERGRADUATE ELECTRICAL ENGINEERING STUDENTS
 AC 2009-385: FIBER OPTICS COURSE FOR UNDERGRADUATE ELECTRICAL ENGINEERING STUDENTS Lihong (Heidi) Jiao, Grand Valley State University American Society for Engineering Education, 2009 Page 14.630.1 Fiber
Highly Reliable 40-mW 25-GHz 20-ch Thermally Tunable DFB Laser Module, Integrated with Wavelength Monitor
 Highly Reliable 4-mW 2-GHz 2-ch Thermally Tunable DFB Laser Module, Integrated with Wavelength Monitor by Tatsuya Kimoto *, Tatsushi Shinagawa *, Toshikazu Mukaihara *, Hideyuki Nasu *, Shuichi Tamura
TD 505 Rev.1 (PLEN/15)
") INTERNATIONAL TELECOMMUNICATION UNION STUDY GROUP 15 TELECOMMUNICATION STANDARDIZATION SECTOR STUDY PERIOD 2009-2012 English only Original: English Question(s): 6/15 Geneva, 5-16 December 2011 Source:
INTERNATIONAL TELECOMMUNICATION UNION STUDY GROUP 15 TELECOMMUNICATION STANDARDIZATION SECTOR STUDY PERIOD 2009-2012 English only Original: English Question(s): 6/15 Geneva, 5-16 December 2011 Source:
from ocean to cloud SEAMLESS OADM FUNCTIONALITY FOR SUBMARINE BU
 SEAMLESS OADM FUNCTIONALITY FOR SUBMARINE BU Shigui Zhang, Yan Wang, Hongbo Sun, Wendou Zhang and Liping Ma sigurd.zhang@huaweimarine.com Huawei Marine Networks, Hai-Dian District, Beijing, P.R. China,
ITU-T G.693. Optical interfaces for intra-office systems
 INTERNATIONAL TELECOMMUNICATION UNION ITU-T G.693 TELECOMMUNICATION STANDARDIZATION SECTOR OF ITU (12/2003) SERIES G: TRANSMISSION SYSTEMS AND MEDIA, DIGITAL SYSTEMS AND NETWORKS Transmission media characteristics
EDFA-WDM Optical Network Analysis
 EDFA-WDM Optical Network Analysis Narruvala Lokesh, kranthi Kumar Katam,Prof. Jabeena A Vellore Institute of Technology VIT University, Vellore, India Abstract : Optical network that apply wavelength division
Suppression of Stimulated Brillouin Scattering
 Suppression of Stimulated Brillouin Scattering 42 2 5 W i de l y T u n a b l e L a s e r T ra n s m i t te r www.lumentum.com Technical Note Introduction This technical note discusses the phenomenon and
Fiber Bragg Grating Dispersion Compensation Enables Cost-Efficient Submarine Optical Transport
 Fiber Bragg Grating Dispersion Compensation Enables Cost-Efficient Submarine Optical Transport By Fredrik Sjostrom, Proximion Fiber Systems Undersea optical transport is an important part of the infrastructure
Pass Cisco Exam
 Pass Cisco 642-321 Exam Number: 642-321 Passing Score: 800 Time Limit: 120 min File Version: 38.8 http://www.gratisexam.com/ Pass Cisco 642-321 Exam Exam Name : Cisco Optical SDH Exam (SDH) Braindumps
Analyzing the Non-Linear Effects in DWDM Optical Network Using MDRZ Modulation Format
 Analyzing the Non-Linear Effects in DWDM Optical Network Using MDRZ Modulation Format Ami R. Lavingia Electronics & Communication Dept. SAL Institute of Technology & Engineering Research Gujarat Technological
Nortel Networks OPTera Long Haul 1600 Optical Line System. 1600G Amplifier Optical Layer Applications Guide
 NTY315DX Nortel Networks OPTera Long Haul 1600 Optical Line System 1600G Amplifier Optical Layer Applications Guide Standard Rel 3 Issue 2 October 2000 What s inside... Introduction Optical layer building
Performance Evaluation of Hybrid (Raman+EDFA) Optical Amplifiers in Dense Wavelength Division Multiplexed Optical Transmission System
 Optical Amplifiers in Dense Wavelength Division Multiplexed Optical Transmission System") Performance Evaluation of Hybrid (Raman+EDFA) Optical Amplifiers in Dense Wavelength Division Multiplexed Optical Transmission System Gagandeep Singh Walia 1, Kulwinder Singh 2, Manjit Singh Bhamrah 3
Performance Evaluation of Hybrid (Raman+EDFA) Optical Amplifiers in Dense Wavelength Division Multiplexed Optical Transmission System Gagandeep Singh Walia 1, Kulwinder Singh 2, Manjit Singh Bhamrah 3
Simulative Analysis of 40 Gbps DWDM System Using Combination of Hybrid Modulators and Optical Filters for Suppression of Four-Wave Mixing
 Vol.9, No.7 (2016), pp.213-220 http://dx.doi.org/10.14257/ijsip.2016.9.7.18 Simulative Analysis of 40 Gbps DWDM System Using Combination of Hybrid Modulators and Optical Filters for Suppression of Four-Wave
40Gb/s Optical Transmission System Testbed
 The University of Kansas Technical Report 40Gb/s Optical Transmission System Testbed Ron Hui, Sen Zhang, Ashvini Ganesh, Chris Allen and Ken Demarest ITTC-FY2004-TR-22738-01 January 2004 Sponsor: Sprint
Radio over Fiber technology for 5G Cloud Radio Access Network Fronthaul
 Radio over Fiber technology for 5G Cloud Radio Access Network Fronthaul Using a highly linear fiber optic transceiver with IIP3 > 35 dbm, operating at noise level of -160dB/Hz, we demonstrate 71 km RF
International Journal of Advanced Research in Computer Science and Software Engineering
 Volume 3, Issue 4, April 2013 ISSN: 2277 128X International Journal of Advanced Research in Computer Science and Software Engineering Research Paper Available online at: www.ijarcsse.com Design and Performance
Introduction to BER testing of WDM systems
 Introduction to BER testing of WDM systems Application note 1299 Wavelength division multiplexing (WDM) is a new and exciting technology for migrating the core optical transmission network to higher bandwidths.
Long-wavelength VCSELs ready to benefit 40/100-GbE modules
 Long-wavelength VCSELs ready to benefit 40/100-GbE modules Process technology advances now enable long-wavelength VCSELs to demonstrate the reliability needed to fulfill their promise for high-speed module
Evolution from TDM-PONs to Next-Generation PONs
 Evolution from TDM-PONs to Next-Generation PONs Ki-Man Choi, Jong-Hoon Lee, and Chang-Hee Lee Department of Electrical Engineering and Computer Science, Korea Advanced Institute of Science and Technology,
Mahendra Kumar1 Navneet Agrawal2
 International Journal of Scientific & Engineering Research, Volume 6, Issue 9, September-2015 1202 Performance Enhancement of DCF Based Wavelength Division Multiplexed Passive Optical Network (WDM-PON)
Study of Multiwavelength Fiber Laser in a Highly Nonlinear Fiber
 Study of Multiwavelength Fiber Laser in a Highly Nonlinear Fiber I. H. M. Nadzar 1 and N. A.Awang 1* 1 Faculty of Science, Technology and Human Development, Universiti Tun Hussein Onn Malaysia, Johor,
Chapter 3 Metro Network Simulation
 Chapter 3 Metro Network Simulation 3.1 Photonic Simulation Tools Simulation of photonic system has become a necessity due to the complex interactions within and between components. Tools have evolved from
Total care for networks. Introduction to Dispersion
 Introduction to Dispersion Introduction to PMD Version1.0- June 01, 2000 Copyright GN Nettest 2000 Introduction To Dispersion Contents Definition of Dispersion Chromatic Dispersion Polarization Mode Dispersion
Network Challenges for Coherent Systems. Mike Harrop Technical Sales Engineering, EXFO
 Network Challenges for Coherent Systems Mike Harrop Technical Sales Engineering, EXFO Agenda 1. 100G Transmission Technology 2. Non Linear effects 3. RAMAN Amplification 1. Optimsing gain 2. Keeping It