Journal of Asian Scientific Research SIGNALS SPECTRAL ANALYSIS AND DISTORTION MEASUREMENTS USING AN OSCILLOSCOPE, A CAMERA AND A PC. A. A.
|
|
|
- Albert Moore
- 6 years ago
- Views:
Transcription


1 Journal of Asian Scientific Research journal homepage: SIGNALS SPECTRAL ANALYSIS AND DISTORTION MEASUREMENTS USING AN OSCILLOSCOPE, A CAMERA AND A PC A. A. Azooz Department of Physics, College of Science, Mosul University Mosul Iraq S. K. Talal Department of Physics, College of Education, Zakho University, Zakho Iraq ABSTRACT This work describes a relatively simple yet effective method for analyzing harmonic distortions and spectral analysis of electronic signals up to the MHz range. The method involves the use a suitable analog or digital oscilloscopes to present the signal, taking a digital picture of the oscilloscope screen, converting the oscilloscope trace to numerical data and performing fast Fourier transform on the data. All MATLAB based software needed for the procedure is given. The results involve the spectrum analysis plot, the overall distortion, and all frequencies up to the tenth harmonic together with their relative amplitudes with respect to that of the fundamental frequency. The program provides for any user s selected frequency band analysis to be presented. Keywords: Radio frequency, Spectral analysis, Distortion meter, signal processing, Image processing, oscilloscope. PACS No: Pj 1. INTRODUCTION The problems related to estimating, measuring and trying to eliminate distortions present in many types of electronic signals are of importance to electronics and signal processing engineers [1, 2]. Distortion meters, and spectrum analyzers have become essential tools for anyone working in this field. These devices have reached a high level of sophistication. This has come at a material price [3]. Consequently, and although many private enterprises in the fields of power transmission, audio industry and radio communications are able to afford having these measuring equipments, under many circumstances, life may not be that easy else where. Field workers and many undergraduate labs in developing countries are just two examples of such situations. This is particularly true when working with frequencies in the MHz up range. From electronic engineering point of view, most signal analysis and distortion measurements lab experiments are performed in the audio frequency range. This is due to the fact that audio frequency analyzers are much less 112
2 expensive. However, distortions and inter-modulation problems associated with high frequency distortion can on many situations be different in causes, nature and consequences from those at audio frequencies. For these reasons, it would be useful to have a cheap, yet effective method to analyze these distortions and harmonics on both teaching and application levels. All undergraduate physics and electronics engineering labs do indeed have, and use oscilloscopes. Typical analog or digital oscilloscopes now days can handle signals of few MHz at least. A 100 MHz signal will produce a ten wave s trace on a 10 MHz oscilloscope. Many modern digital oscilloscopes have the facility to digitize these traces. However, these again may not be affordable in many developing countries. Computers on the other hand, have become an integral part of most laboratories. Digital camera equipped cell phones have also become an integral part of every student s life. Motivated by these realities of life, one is encouraged to design experiments related to frequency analysis and distortion measurements at both audio and radio frequencies. 2. EXPERIMENTAL PROCEDURE, MEASUREMENTS AND RESULTS The experimental procedure for this analysis is simple. The signal to be analyzed is connected to the oscilloscope and a stable trace of few full waves is produced. A snapshot with the digital or cell phone camera is taken for each signal to be analyzed. Care should be taken to avoid shadows and reflections on the oscilloscope screen. The camera must be stable and parallel to the screen. An adjustable holder is useful for the purpose. Once the pictures are taken, they can be transferred to a PC which has MATLAB program installed. The use of MATLAB should not be of much concern. This is because most physics and engineering student do indeed take MATLAB courses at some stage or another, and the following analysis and software presented here are made user friendly to a high degree. The main issue now is to convert the trace in each picture to a reasonable number of experimental data points. Software named oscilloscope written by the one of authors can be freely downloaded and used from the MATLAB file exchange library for this purpose [4, 5]. The software is easy to use. The downloaded zip file contains full step by step instructions on how to use the program to convert digital pictures to numerical data with a high degree of accuracy. Figure (1) shows few examples of such conversions for several wave forms. Alternatively, and if one is at the luxury of having a digital data logging oscilloscope, data can be directly saved on the hard drive and the previous steps of acquiring data from screen pictures can be skipped. 113
- Plot of 999 retrieved data from the trace in a.")
 written for this purpose. The software can be freely downloaded from the MATLAB file exchange website [6].")
3 (a) (b) (c) (d) Figure (1) Two sample results of converting oscilloscope traces to numerical data using the software oscilloscope (a) an 800x600 pixel screen photo of a 200 Hz 3.3 Vpp triangular signal (b)- Plot of 999 retrieved data from the trace in a. (c) picture of rectangular signal trace, (d) plot of 512 data points retrieved from (c) Once numerical data of each wave form are obtained, fast Fourier analysis of the signal can be carried out. Software named Spectrum_Analyser (time, voltage, f1, f2, delta) written for this purpose. The software can be freely downloaded from the MATLAB file exchange website [6]. The input arguments to the software are the time t and signal voltage variable v. The accurate scaling of v is not important because the program needs to analyze the signal shape only. The input parameters f1, and f2 are the upper and lower frequency limits defining the bandwidth of the spectrum that will appear. The input parameter delta is a measure of the output data spacing. It can range between and 0.1. Using lower values of delta produces more smooth plots but at the expense of CPU time and RAM memory. The Spectrum Analyzer software can be copied, pasted to a new MATLAB M-file and saved in the MATLAB work directory (This is where MATLAB saves all user data and program files by default). The previously mentioned Oscilloscope software should also be saved there together with all digital pictures. 114
4 Once the program is activated by entering the statement, Spectrum Analyzer (t, v, 0, 10^7, 0.001) for example, the program will automatically produce the following outputs: 1- A spectrum analysis plot with bandwidth between f1 and f2 showing all relative amplitudes of all frequency contents in the original signal. 2- Numerical output of frequencies and relative amplitudes of first ten most prominent peaks in the spectrum. 3- The over all percentage distortion of the signal. The overall distortion D is calculated using the equation 2 1/ 2 A n n2 D 2 (1) An n1 The software structure and the function of each step are described in the non executable comments statements (These are in green fonts) within the program. These are intended for interested MATLAB programmer or developer and to skip reading them and treating the software as a black box will not in any away affect the ordinary user. In order to test the robustness of the software s ability to analyze signals, few known simulated signals were generated mathematically, and then analyzed by the program. The first test involved the computer generation of 10 MHz pure sinusoidal signal, v sin( t). This test is used to asses the accuracy of automatic fundamental frequency estimation facility contained in the program and the effect of the number of complete wave cycles involved on the sharpness of the spectral lines. The numbers of cycles considered are 2, 10, 25, and 50. The results are shown in figure (2-a) Figure (2) (a) Spectrum of a 10 MHz signal using different number of complete cycles. (b) Variation of FWHM derived from (a) with number of complete cycles analyzed. It is clear from this figure that the software is successful in fully estimating the correct frequency in all cases. The value of the distortion obtained is practically zero. However, using small number of cycles is obviously associated with larger lines bandwidths. Even so, the bandwidth seems to drop almost exponentially as the number of cycles is increased. A value of FWHM = f / f 510% can be achieved using between 10 and 25 cycles. This range of 115
 (b) With the above point in mind, a computer generated 10 MHz saw-tooth signal is analyzed.")
5 cycle numbers is easily distinguishable on an oscilloscope screen. Narrower lines can be obtained when numerical data logging is used instead of analyzing oscilloscope pictures. (a) (b) With the above point in mind, a computer generated 10 MHz saw-tooth signal is analyzed. This is carried out for the purpose of testing the software s ability to find the correct harmonic structure of this signal. The number of cycles used in the analysis is twenty five. It is known from analytical Fourier theory that a saw-tooth signal of angular frequency can be represented as F( t) (cos t cos 2t cos 3t cos(4t ) cos(5 t)...) (2) is the slope of the rising part of the signal. Figure(3) shows the frequency spectrum obtained. (a) (b) 116
 that the program is very much successful in obtaining all the harmonics at the correct positions and with the correct amplitudes.")
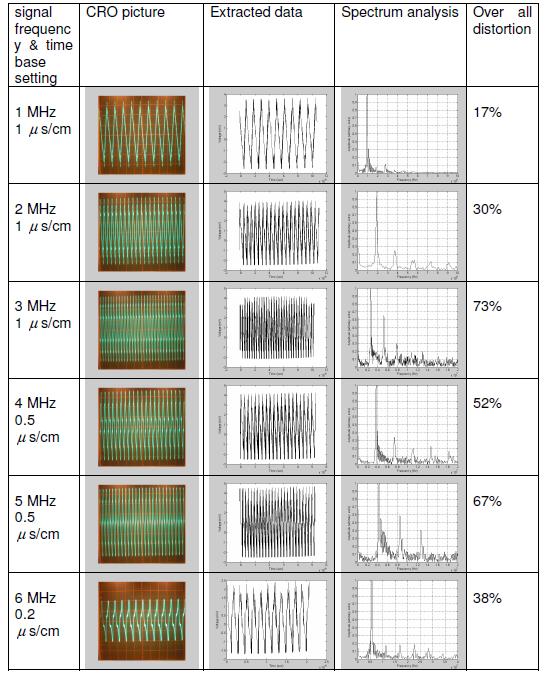
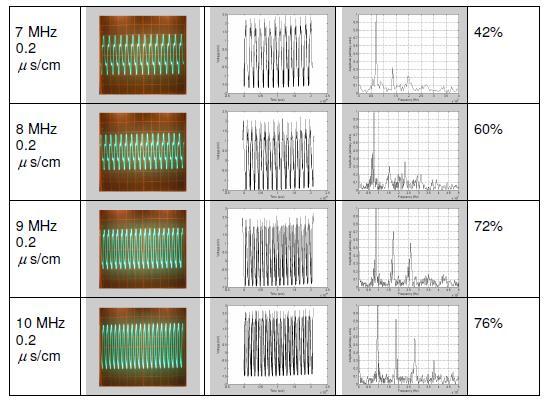
6 Figure (3) (a) simulated 10 MHz saw-tooth signal. (b) Frequency analysis spectrum obtained using the software showing only the first ten harmonics. It is clear from figure (3-b) that the program is very much successful in obtaining all the harmonics at the correct positions and with the correct amplitudes. The value of the distortion obtained is 59.6%. This is in good agreement with the theoretical value of 62% if one considers the first 100 terms of equation (2). From the above simulation one may conclude that correct signal spectral analysis of data extracted from oscilloscope pictures similar to that of figure (3-a) can be performed if one can obtain relatively clear digital pictures from the oscilloscope screen of any signal at any frequency provided that the picture represents over twenty five full cycles of the fundamental frequency. Several experimental test signals have been studied using this method. Signals are obtained from a 10 MHz Hung Chang model G305 sweep function generator connected to a Hung Chang 100 MHz model 5510 oscilloscope. Tests have shown that the generator is usually capable of producing up to 1 MHz sinusoidal, triangular or rectangular signals with only relatively small distortions. However and as one tries to gets into the higher frequency range, the generator tend to produce significantly more distorted signals. Signals in the 1-10 MHz frequency range are used as test signals. Two types of signals are analyzed. These are the sinusoidal and the triangular signals. Results of analysis are presented in tables (1) and (2) respectively. Table- 1. Results of analysis of sinusoidal signals between 1 and 10 MHz 117
7 118
8 3. DISCUSSION As it may appear from tables (1) and (2), the sweep generator produces distorted signals even at 1 MHz. However, and although the overall distortion is frequency dependent, this dependence tend to assume changing values as the frequency is increased. One point worth noticing is that the over all distortion of a triangular wave at 1 MHz is about 17% which is not much higher that the theoretical value of 12%. This indicates that the generator has a better performance at 1 MHz triangular wave than with sinusoidal. The approximately 1/10 third harmonic amplitude is another indication to the system reliability. Tables also indicate that the results of analysis and the number of harmonics produced are directly related to the visual distortion of waves noted on the oscilloscope screen. 4. CONCLUSIONS From above one may conclude that the system suggested can perform well in spite of the fact that it is a simple one. The MHz frequency range used here is not binding by any mean. These frequency values are selected for the simple reason that they are the highest available to us. The same analysis can be performed at any frequency provided that the oscilloscope can handle these frequencies. REFERENCES [1] M. S. Sarma, Introduction to electrical engineering: Oxford University Press, [2] National Instruments, "Harmonic distortion measurement, tutorial document Sep 6," [3] [4] A. Azooz, Instruments and Experimental Techniques, vol. 54, pp , [5] [6] 119
ECE 4670 Spring 2014 Lab 1 Linear System Characteristics
 ECE 4670 Spring 2014 Lab 1 Linear System Characteristics 1 Linear System Characteristics The first part of this experiment will serve as an introduction to the use of the spectrum analyzer in making absolute
Sampling and Reconstruction
 Experiment 10 Sampling and Reconstruction In this experiment we shall learn how an analog signal can be sampled in the time domain and then how the same samples can be used to reconstruct the original
ELG3175 INTRODUCTION TO COMMUNICATION SYSTEMS
 ELG3175 INTRODUCTION TO COMMUNICATION SYSTEMS Introduction: LABORATORY I: Signals, Systems and Spectra In this lab, students will familiarize themselves with the lab instruments and equipment, will generate
Introduction. In the frequency domain, complex signals are separated into their frequency components, and the level at each frequency is displayed
 SPECTRUM ANALYZER Introduction A spectrum analyzer measures the amplitude of an input signal versus frequency within the full frequency range of the instrument The spectrum analyzer is to the frequency
ECE 440L. Experiment 1: Signals and Noise (1 week)
") ECE 440L Experiment 1: Signals and Noise (1 week) I. OBJECTIVES Upon completion of this experiment, you should be able to: 1. Use the signal generators and filters in the lab to generate and filter noise
ECE 440L Experiment 1: Signals and Noise (1 week) I. OBJECTIVES Upon completion of this experiment, you should be able to: 1. Use the signal generators and filters in the lab to generate and filter noise
Linear Time-Invariant Systems
 Linear Time-Invariant Systems Modules: Wideband True RMS Meter, Audio Oscillator, Utilities, Digital Utilities, Twin Pulse Generator, Tuneable LPF, 100-kHz Channel Filters, Phase Shifter, Quadrature Phase
MASSACHUSETTS INSTITUTE OF TECHNOLOGY /6.071 Introduction to Electronics, Signals and Measurement Spring 2006
 MASSACHUSETTS INSTITUTE OF TECHNOLOGY.071/6.071 Introduction to Electronics, Signals and Measurement Spring 006 Lab. Introduction to signals. Goals for this Lab: Further explore the lab hardware. The oscilloscope
Laboratory Exercise 6 THE OSCILLOSCOPE
 Introduction Laboratory Exercise 6 THE OSCILLOSCOPE The aim of this exercise is to introduce you to the oscilloscope (often just called a scope), the most versatile and ubiquitous laboratory measuring
UNIVERSITY OF NORTH CAROLINA AT CHARLOTTE Department of Electrical and Computer Engineering
 UNIVERSITY OF NORTH CAROLINA AT CHARLOTTE Department of Electrical and Computer Engineering EXPERIMENT 5 GAIN-BANDWIDTH PRODUCT AND SLEW RATE OBJECTIVES In this experiment the student will explore two
EET 223 RF COMMUNICATIONS LABORATORY EXPERIMENTS
 EET 223 RF COMMUNICATIONS LABORATORY EXPERIMENTS Experimental Goals A good technician needs to make accurate measurements, keep good records and know the proper usage and limitations of the instruments
Laboratory Experiment #1 Introduction to Spectral Analysis
 J.B.Francis College of Engineering Mechanical Engineering Department 22-403 Laboratory Experiment #1 Introduction to Spectral Analysis Introduction The quantification of electrical energy can be accomplished
User-friendly Matlab tool for easy ADC testing
 User-friendly Matlab tool for easy ADC testing Tamás Virosztek, István Kollár Budapest University of Technology and Economics, Department of Measurement and Information Systems Budapest, Hungary, H-1521,
Real Analog - Circuits 1 Chapter 11: Lab Projects
 Real Analog - Circuits 1 Chapter 11: Lab Projects 11.2.1: Signals with Multiple Frequency Components Overview: In this lab project, we will calculate the magnitude response of an electrical circuit and
ENGR 210 Lab 12: Sampling and Aliasing
 ENGR 21 Lab 12: Sampling and Aliasing In the previous lab you examined how A/D converters actually work. In this lab we will consider some of the consequences of how fast you sample and of the signal processing
Department of Electronic Engineering NED University of Engineering & Technology. LABORATORY WORKBOOK For the Course SIGNALS & SYSTEMS (TC-202)
") Department of Electronic Engineering NED University of Engineering & Technology LABORATORY WORKBOOK For the Course SIGNALS & SYSTEMS (TC-202) Instructor Name: Student Name: Roll Number: Semester: Batch:
Department of Electronic Engineering NED University of Engineering & Technology LABORATORY WORKBOOK For the Course SIGNALS & SYSTEMS (TC-202) Instructor Name: Student Name: Roll Number: Semester: Batch:
Fourier Signal Analysis
 Part 1B Experimental Engineering Integrated Coursework Location: Baker Building South Wing Mechanics Lab Experiment A4 Signal Processing Fourier Signal Analysis Please bring the lab sheet from 1A experiment
Michael F. Toner, et. al.. "Distortion Measurement." Copyright 2000 CRC Press LLC. <
 Michael F. Toner, et. al.. "Distortion Measurement." Copyright CRC Press LLC. . Distortion Measurement Michael F. Toner Nortel Networks Gordon W. Roberts McGill University 53.1
Lab 0: Introduction to TIMS AND MATLAB
 TELE3013 TELECOMMUNICATION SYSTEMS 1 Lab 0: Introduction to TIMS AND MATLAB 1. INTRODUCTION The TIMS (Telecommunication Instructional Modelling System) system was first developed by Tim Hooper, then a
Definitions. Spectrum Analyzer
 SIGNAL ANALYZERS Spectrum Analyzer Definitions A spectrum analyzer measures the magnitude of an input signal versus frequency within the full frequency range of the instrument. The primary use is to measure
Discrete Fourier Transform (DFT)
") Amplitude Amplitude Discrete Fourier Transform (DFT) DFT transforms the time domain signal samples to the frequency domain components. DFT Signal Spectrum Time Frequency DFT is often used to do frequency
Amplitude Amplitude Discrete Fourier Transform (DFT) DFT transforms the time domain signal samples to the frequency domain components. DFT Signal Spectrum Time Frequency DFT is often used to do frequency
Operational Amplifiers: Part II
 1. Introduction Operational Amplifiers: Part II The name "operational amplifier" comes from this amplifier's ability to perform mathematical operations. Three good examples of this are the summing amplifier,
Analog Arts SG985 SG884 SG834 SG814 Product Specifications [1]
![Analog Arts SG985 SG884 SG834 SG814 Product Specifications [1]](/thumbs/94/122371203.jpg "Analog Arts SG985 SG884 SG834 SG814 Product Specifications [1]") www.analogarts.com Analog Arts SG985 SG884 SG834 SG814 Product Specifications [1] 1. These models include: an oscilloscope, a spectrum analyzer, a data recorder, a frequency & phase meter, and an arbitrary
www.analogarts.com Analog Arts SG985 SG884 SG834 SG814 Product Specifications [1] 1. These models include: an oscilloscope, a spectrum analyzer, a data recorder, a frequency & phase meter, and an arbitrary
LAB #7: Digital Signal Processing
 LAB #7: Digital Signal Processing Equipment: Pentium PC with NI PCI-MIO-16E-4 data-acquisition board NI BNC 2120 Accessory Box VirtualBench Instrument Library version 2.6 Function Generator (Tektronix
Series and Parallel Resonance
 School of Engineering Department of Electrical and Computer Engineering 33:4 Principles of Electrical Engineering II aboratory Experiment 1 Series and Parallel esonance 1 Introduction Objectives To introduce
SIGNALS AND SYSTEMS LABORATORY 13: Digital Communication
 SIGNALS AND SYSTEMS LABORATORY 13: Digital Communication INTRODUCTION Digital Communication refers to the transmission of binary, or digital, information over analog channels. In this laboratory you will
Analog Arts SF900 SF650 SF610 Product Specifications
 www.analogarts.com Analog Arts SF900 SF650 SF610 Product Specifications Analog Arts reserves the right to change, modify, add or delete portions of any one of its specifications at any time, without prior
Lab Assignment 1 Spectrum Analyzers
 THE UNIVERSITY OF BRITISH COLUMBIA Department of Electrical and Computer Engineering ELEC 391 Electrical Engineering Design Studio II Lab Assignment 1 Spectrum Analyzers 1 Objectives This lab consists
ECE 6416 Low-Noise Electronics Orientation Experiment
 ECE 6416 Low-Noise Electronics Orientation Experiment Object The object of this experiment is to become familiar with the instruments used in the low noise laboratory. Parts The following parts are required
RLC Frequency Response
 1. Introduction RLC Frequency Response The student will analyze the frequency response of an RLC circuit excited by a sinusoid. Amplitude and phase shift of circuit components will be analyzed at different
Experiment No. 2 Pre-Lab Signal Mixing and Amplitude Modulation
 Experiment No. 2 Pre-Lab Signal Mixing and Amplitude Modulation Read the information presented in this pre-lab and answer the questions given. Submit the answers to your lab instructor before the experimental
ELEC3104: Digital Signal Processing Session 1, 2013
 ELEC3104: Digital Signal Processing Session 1, 2013 The University of New South Wales School of Electrical Engineering and Telecommunications LABORATORY 1: INTRODUCTION TO TIMS AND MATLAB INTRODUCTION
IEEE 802.3aq Task Force Dynamic Channel Model Ad Hoc Task 2 - Time variation & modal noise 10/13/2004 con-call
 IEEE 802.3aq Task Force Dynamic Channel Model Ad Hoc Task 2 - Time variation & modal noise 10/13/2004 con-call Time variance in MMF links Further test results Rob Coenen Overview Based on the formulation
STATION NUMBER: LAB SECTION: Filters. LAB 6: Filters ELECTRICAL ENGINEERING 43/100 INTRODUCTION TO MICROELECTRONIC CIRCUITS
 Lab 6: Filters YOUR EE43/100 NAME: Spring 2013 YOUR PARTNER S NAME: YOUR SID: YOUR PARTNER S SID: STATION NUMBER: LAB SECTION: Filters LAB 6: Filters Pre- Lab GSI Sign- Off: Pre- Lab: /40 Lab: /60 Total:
Signals & Systems for Speech & Hearing. Week 6. Practical spectral analysis. Bandpass filters & filterbanks. Try this out on an old friend
 Signals & Systems for Speech & Hearing Week 6 Bandpass filters & filterbanks Practical spectral analysis Most analogue signals of interest are not easily mathematically specified so applying a Fourier
Laboratory Exercises for Analog Circuits and Electronics as Hardware Homework with Student Laptop Computer Instrumentation
 Laboratory Exercises for Analog Circuits and Electronics as Hardware Homework with Student Laptop Computer Instrumentation Marion O. Hagler Department of Electrical and Computer Engineering Mississippi
EE 233 Circuit Theory Lab 2: Amplifiers
 EE 233 Circuit Theory Lab 2: Amplifiers Table of Contents 1 Introduction... 1 2 Precautions... 1 3 Prelab Exercises... 2 3.1 LM348N Op-amp Parameters... 2 3.2 Voltage Follower Circuit Analysis... 2 3.2.1
YEDITEPE UNIVERSITY ENGINEERING FACULTY COMMUNICATION SYSTEMS LABORATORY EE 354 COMMUNICATION SYSTEMS
 YEDITEPE UNIVERSITY ENGINEERING FACULTY COMMUNICATION SYSTEMS LABORATORY EE 354 COMMUNICATION SYSTEMS EXPERIMENT 3: SAMPLING & TIME DIVISION MULTIPLEX (TDM) Objective: Experimental verification of the
Lab 2: Capacitors. Integrator and Differentiator Circuits
 Lab 2: Capacitors Topics: Differentiator Integrator Low-Pass Filter High-Pass Filter Band-Pass Filter Integrator and Differentiator Circuits The simple RC circuits that you built in a previous section
Analog Arts SL987 SL957 SL937 SL917 Product Specifications [1]
![Analog Arts SL987 SL957 SL937 SL917 Product Specifications [1]](/thumbs/95/126095980.jpg "Analog Arts SL987 SL957 SL937 SL917 Product Specifications [1]") www.analogarts.com Analog Arts SL987 SL957 SL937 SL917 Product Specifications [1] 1. These models include: an oscilloscope, a spectrum analyzer, a data recorder, a frequency & phase meter, an arbitrary
www.analogarts.com Analog Arts SL987 SL957 SL937 SL917 Product Specifications [1] 1. These models include: an oscilloscope, a spectrum analyzer, a data recorder, a frequency & phase meter, an arbitrary
EE 210: CIRCUITS AND DEVICES
 EE 210: CIRCUITS AND DEVICES LAB #3: VOLTAGE AND CURRENT MEASUREMENTS This lab features a tutorial on the instrumentation that you will be using throughout the semester. More specifically, you will see
DELTA MODULATION. PREPARATION principle of operation slope overload and granularity...124
 DELTA MODULATION PREPARATION...122 principle of operation...122 block diagram...122 step size calculation...124 slope overload and granularity...124 slope overload...124 granular noise...125 noise and
ELEC3242 Communications Engineering Laboratory Amplitude Modulation (AM)
") ELEC3242 Communications Engineering Laboratory 1 ---- Amplitude Modulation (AM) 1. Objectives 1.1 Through this the laboratory experiment, you will investigate demodulation of an amplitude modulated (AM)
ELEC3242 Communications Engineering Laboratory 1 ---- Amplitude Modulation (AM) 1. Objectives 1.1 Through this the laboratory experiment, you will investigate demodulation of an amplitude modulated (AM)
Analog Arts SF990 SF880 SF830 Product Specifications
 1 www.analogarts.com Analog Arts SF990 SF880 SF830 Product Specifications Analog Arts reserves the right to change, modify, add or delete portions of any one of its specifications at any time, without
Lab Assignment 1 Spectrum Analyzers
 1 Objectives THE UNIVERSITY OF BRITISH COLUMBIA Department of Electrical and Computer Engineering ELEC 391 Electrical Engineering Design Studio II Lab Assignment 1 Spectrum Analyzers This lab consists
Design of Low-Cost Multi- Waveforms Signal Generator Using Operational Amplifier
 Ali S. Aziz Al-Hussain University College, Karbala Province, IRAQ aliaziz@huciraq.edu.iq Design of Low-Cost Multi- Waveforms Signal Generator Using Operational Amplifier Function signal generator has a
HAMEG Programmable Measuring Instruments Series 8100
 HAMEG Programmable Measuring Instruments Series 8100 HAMEG Programmable Measuring Instruments Series 8100 are ideally suited for test installations in production and automated tests in laboratories. They
RTTY: an FSK decoder program for Linux. Jesús Arias (EB1DIX)
") RTTY: an FSK decoder program for Linux. Jesús Arias (EB1DIX) June 15, 2001 Contents 1 rtty-2.0 Program Description. 2 1.1 What is RTTY........................................... 2 1.1.1 The RTTY transmissions.................................
RTTY: an FSK decoder program for Linux. Jesús Arias (EB1DIX) June 15, 2001 Contents 1 rtty-2.0 Program Description. 2 1.1 What is RTTY........................................... 2 1.1.1 The RTTY transmissions.................................
Technical note. Impedance analysis techniques
 Impedance analysis techniques Brian Sayers Solartron Analytical, Farnborough, UK. Technical Note: TNMTS01 1. Introduction The frequency response analyzer developed for the ModuLab MTS materials test system
Frequency and Time Domain Representation of Sinusoidal Signals
 Frequency and Time Domain Representation of Sinusoidal Signals By: Larry Dunleavy Wireless and Microwave Instruments University of South Florida Objectives 1. To review representations of sinusoidal signals
Class #16: Experiment Matlab and Data Analysis
 Class #16: Experiment Matlab and Data Analysis Purpose: The objective of this experiment is to add to our Matlab skill set so that data can be easily plotted and analyzed with simple tools. Background:
EE 422G - Signals and Systems Laboratory
 EE 422G - Signals and Systems Laboratory Lab 3 FIR Filters Written by Kevin D. Donohue Department of Electrical and Computer Engineering University of Kentucky Lexington, KY 40506 September 19, 2015 Objectives:
UNIT-3. Electronic Measurements & Instrumentation
 UNIT-3 1. Draw the Block Schematic of AF Wave analyzer and explain its principle and Working? ANS: The wave analyzer consists of a very narrow pass-band filter section which can Be tuned to a particular
Experiment One: Generating Frequency Modulation (FM) Using Voltage Controlled Oscillator (VCO)
 Using Voltage Controlled Oscillator (VCO)") Experiment One: Generating Frequency Modulation (FM) Using Voltage Controlled Oscillator (VCO) Modified from original TIMS Manual experiment by Mr. Faisel Tubbal. Objectives 1) Learn about VCO and how
Experiment One: Generating Frequency Modulation (FM) Using Voltage Controlled Oscillator (VCO) Modified from original TIMS Manual experiment by Mr. Faisel Tubbal. Objectives 1) Learn about VCO and how
The object of this experiment is to become familiar with the instruments used in the low noise laboratory.
 0. ORIENTATION 0.1 Object The object of this experiment is to become familiar with the instruments used in the low noise laboratory. 0.2 Parts The following parts are required for this experiment: 1. A
The Signals and Systems Toolbox: Comparing Theory, Simulation and Implementation using MATLAB and Programmable Instruments
 Session 222, ASEE 23 The Signals and Systems Toolbox: Comparing Theory, Simulation and Implementation using MATLAB and Programmable Instruments John M. Spinelli Union College Abstract A software system
Signal Processing for Digitizers
 Signal Processing for Digitizers Modular digitizers allow accurate, high resolution data acquisition that can be quickly transferred to a host computer. Signal processing functions, applied in the digitizer
Basics Of The Spectrum Analyzer
 Basics Of The Spectrum Analyzer 1 / 6 2 / 6 3 / 6 Basics Of The Spectrum Analyzer Remember that the spectrum analyzers User's Guides are also located in the lab. Like an oscilloscope, a spectrum analyzer
High-resolution ADC operation up to 19.6 GHz clock frequency
 INSTITUTE OF PHYSICS PUBLISHING Supercond. Sci. Technol. 14 (2001) 1065 1070 High-resolution ADC operation up to 19.6 GHz clock frequency SUPERCONDUCTOR SCIENCE AND TECHNOLOGY PII: S0953-2048(01)27387-4
The information carrying capacity of a channel
 Chapter 8 The information carrying capacity of a channel 8.1 Signals look like noise! One of the most important practical questions which arises when we are designing and using an information transmission
Step Response of RC Circuits
 EE 233 Laboratory-1 Step Response of RC Circuits 1 Objectives Measure the internal resistance of a signal source (eg an arbitrary waveform generator) Measure the output waveform of simple RC circuits excited
The Fundamentals of Mixed Signal Testing
 The Fundamentals of Mixed Signal Testing Course Information The Fundamentals of Mixed Signal Testing course is designed to provide the foundation of knowledge that is required for testing modern mixed
ME scope Application Note 01 The FFT, Leakage, and Windowing
 INTRODUCTION ME scope Application Note 01 The FFT, Leakage, and Windowing NOTE: The steps in this Application Note can be duplicated using any Package that includes the VES-3600 Advanced Signal Processing
EE-4022 Experiment 3 Frequency Modulation (FM)
") EE-4022 MILWAUKEE SCHOOL OF ENGINEERING 2015 Page 3-1 Student Objectives: EE-4022 Experiment 3 Frequency Modulation (FM) In this experiment the student will use laboratory modules including a Voltage-Controlled
EE-4022 MILWAUKEE SCHOOL OF ENGINEERING 2015 Page 3-1 Student Objectives: EE-4022 Experiment 3 Frequency Modulation (FM) In this experiment the student will use laboratory modules including a Voltage-Controlled
CHAPTER 6 INTRODUCTION TO SYSTEM IDENTIFICATION
 CHAPTER 6 INTRODUCTION TO SYSTEM IDENTIFICATION Broadly speaking, system identification is the art and science of using measurements obtained from a system to characterize the system. The characterization
Current Rebuilding Concept Applied to Boost CCM for PF Correction
 Current Rebuilding Concept Applied to Boost CCM for PF Correction Sindhu.K.S 1, B. Devi Vighneshwari 2 1, 2 Department of Electrical & Electronics Engineering, The Oxford College of Engineering, Bangalore-560068,
Experiment Guide: RC/RLC Filters and LabVIEW
 Description and ackground Experiment Guide: RC/RLC Filters and LabIEW In this lab you will (a) manipulate instruments manually to determine the input-output characteristics of an RC filter, and then (b)
Intermediate and Advanced Labs PHY3802L/PHY4822L
 Intermediate and Advanced Labs PHY3802L/PHY4822L Torsional Oscillator and Torque Magnetometry Lab manual and related literature The torsional oscillator and torque magnetometry 1. Purpose Study the torsional
Experiment 2: Transients and Oscillations in RLC Circuits
 Experiment 2: Transients and Oscillations in RLC Circuits Will Chemelewski Partner: Brian Enders TA: Nielsen See laboratory book #1 pages 5-7, data taken September 1, 2009 September 7, 2009 Abstract Transient
Transmit filter designs for ADSL modems
 EE 233 Laboratory-4 1. Objectives Transmit filter designs for ADSL modems Design a filter from a given topology and specifications. Analyze the characteristics of the designed filter. Use SPICE to verify
14 fasttest. Multitone Audio Analyzer. Multitone and Synchronous FFT Concepts
 Multitone Audio Analyzer The Multitone Audio Analyzer (FASTTEST.AZ2) is an FFT-based analysis program furnished with System Two for use with both analog and digital audio signals. Multitone and Synchronous
CHAPTER. delta-sigma modulators 1.0
 CHAPTER 1 CHAPTER Conventional delta-sigma modulators 1.0 This Chapter presents the traditional first- and second-order DSM. The main sources for non-ideal operation are described together with some commonly
Spectrum analyzer for frequency bands of 8-12, and MHz
 EE389 Electronic Design Lab Project Report, EE Dept, IIT Bombay, November 2006 Spectrum analyzer for frequency bands of 8-12, 12-16 and 16-20 MHz Group No. D-13 Paras Choudhary (03d07012)
EE-4022 Experiment 2 Amplitude Modulation (AM)
") EE-4022 MILWAUKEE SCHOOL OF ENGINEERING 2015 Page 2-1 Student objectives: EE-4022 Experiment 2 Amplitude Modulation (AM) In this experiment the student will use laboratory modules to implement operations
EE-4022 MILWAUKEE SCHOOL OF ENGINEERING 2015 Page 2-1 Student objectives: EE-4022 Experiment 2 Amplitude Modulation (AM) In this experiment the student will use laboratory modules to implement operations
Knowledge Integration Module 2 Fall 2016
 Knowledge Integration Module 2 Fall 2016 1 Basic Information: The knowledge integration module 2 or KI-2 is a vehicle to help you better grasp the commonality and correlations between concepts covered
Experiment Five: The Noisy Channel Model
 Experiment Five: The Noisy Channel Model Modified from original TIMS Manual experiment by Mr. Faisel Tubbal. Objectives 1) Study and understand the use of marco CHANNEL MODEL module to generate and add
PHYSICS 330 LAB Operational Amplifier Frequency Response
 PHYSICS 330 LAB Operational Amplifier Frequency Response Objectives: To measure and plot the frequency response of an operational amplifier circuit. History: Operational amplifiers are among the most widely
A Low-Cost Programmable Arbitrary Function Generator for Educational Environment
 Paper ID #5740 A Low-Cost Programmable Arbitrary Function Generator for Educational Environment Mr. Mani Dargahi Fadaei, Azad University Mani Dargahi Fadaei received B.S. in electrical engineering from
Question 1 Draw a block diagram to illustrate how the data was acquired. Be sure to include important parameter values
 Data acquisition Question 1 Draw a block diagram to illustrate how the data was acquired. Be sure to include important parameter values The block diagram illustrating how the signal was acquired is shown
UNIVERSITY OF NORTH CAROLINA AT CHARLOTTE Department of Electrical and Computer Engineering
 UNIVERSITY OF NORTH CAROLINA AT CHARLOTTE Department of Electrical and Computer Engineering EXPERIMENT 8 AMPLITUDE MODULATION AND DEMODULATION OBJECTIVES The focus of this lab is to familiarize the student
ECE3042 Lab Report and Homework Guidelines. Homework. Lab Report
 ECE3042 Lab Report and Homework Guidelines Homework The first page of the homework is a cover sheet in the specified format. Homework is due in lab at the beginning of the period. Label all figures/graphs
Technical Notes from Laplace Instruments Ltd. EMC Emissions measurement. Pre selectors... what, why and when?
 Technical Notes from Laplace Instruments Ltd EMC Emissions measurement. Pre selectors... what, why and when? Most of us working in EMC will have heard comments about pre-selectors. This article sets out
EXPERIMENT NUMBER 2 BASIC OSCILLOSCOPE OPERATIONS
 1 EXPERIMENT NUMBER 2 BASIC OSCILLOSCOPE OPERATIONS The oscilloscope is the most versatile and most important tool in this lab and is probably the best tool an electrical engineer uses. This outline guides
Application Note #5 Direct Digital Synthesis Impact on Function Generator Design
 Impact on Function Generator Design Introduction Function generators have been around for a long while. Over time, these instruments have accumulated a long list of features. Starting with just a few knobs
Lecture 6. Angle Modulation and Demodulation
 Lecture 6 and Demodulation Agenda Introduction to and Demodulation Frequency and Phase Modulation Angle Demodulation FM Applications Introduction The other two parameters (frequency and phase) of the carrier
Basic Electronics Learning by doing Prof. T.S. Natarajan Department of Physics Indian Institute of Technology, Madras
 Basic Electronics Learning by doing Prof. T.S. Natarajan Department of Physics Indian Institute of Technology, Madras Lecture 26 Mathematical operations Hello everybody! In our series of lectures on basic
Communication Engineering Prof. Surendra Prasad Department of Electrical Engineering Indian Institute of Technology, Delhi
 Communication Engineering Prof. Surendra Prasad Department of Electrical Engineering Indian Institute of Technology, Delhi Lecture - 23 The Phase Locked Loop (Contd.) We will now continue our discussion
ENGR 210 Lab 6 Use of the Function Generator & Oscilloscope
 ENGR 210 Lab 6 Use of the Function Generator & Oscilloscope In this laboratory you will learn to use two additional instruments in the laboratory, namely the function/arbitrary waveform generator, which
Frequency Selective Circuits
 Lab 15 Frequency Selective Circuits Names Objectives in this lab you will Measure the frequency response of a circuit Determine the Q of a resonant circuit Build a filter and apply it to an audio signal
ECEN Network Analysis Section 3. Laboratory Manual
 ECEN 3714----Network Analysis Section 3 Laboratory Manual LAB 07: Active Low Pass Filter Oklahoma State University School of Electrical and Computer Engineering. Section 3 Laboratory manual - 1 - Spring
Operational Amplifier
 Operational Amplifier Joshua Webster Partners: Billy Day & Josh Kendrick PHY 3802L 10/16/2013 Abstract: The purpose of this lab is to provide insight about operational amplifiers and to understand the
Time Matters How Power Meters Measure Fast Signals
 Time Matters How Power Meters Measure Fast Signals By Wolfgang Damm, Product Management Director, Wireless Telecom Group Power Measurements Modern wireless and cable transmission technologies, as well
Integrators, differentiators, and simple filters
 BEE 233 Laboratory-4 Integrators, differentiators, and simple filters 1. Objectives Analyze and measure characteristics of circuits built with opamps. Design and test circuits with opamps. Plot gain vs.
LABORATORY #3 QUARTZ CRYSTAL OSCILLATOR DESIGN
 LABORATORY #3 QUARTZ CRYSTAL OSCILLATOR DESIGN OBJECTIVES 1. To design and DC bias the JFET transistor oscillator for a 9.545 MHz sinusoidal signal. 2. To simulate JFET transistor oscillator using MicroCap
A Temperature Modulation Circuit for Metal Oxide Semiconductor Gas Sensor
 Indian Journal of Science and Technology, Vol 8(13), DOI: 10.17485/ijst/2015/v8i13/52888, July 2015 ISSN (Print) : 0974-6846 ISSN (Online) : 0974-5645 A Temperature Modulation Circuit for Metal Oxide Semiconductor
Notes on Experiment #1
 Notes on Experiment #1 Bring graph paper (cm cm is best) From this week on, be sure to print a copy of each experiment and bring it with you to lab. There will not be any experiment copies available in
Mechatronics. Analog and Digital Electronics: Studio Exercises 1 & 2
 Mechatronics Analog and Digital Electronics: Studio Exercises 1 & 2 There is an electronics revolution taking place in the industrialized world. Electronics pervades all activities. Perhaps the most important
Impedance 50 (75 connectors via adapters)
") VECTOR NETWORK ANALYZER PLANAR 304/1 DATA SHEET Frequency range: 300 khz to 3.2 GHz Measured parameters: S11, S21, S12, S22 Dynamic range of transmission measurement magnitude: 135 db Measurement time
VECTOR NETWORK ANALYZER PLANAR 304/1 DATA SHEET Frequency range: 300 khz to 3.2 GHz Measured parameters: S11, S21, S12, S22 Dynamic range of transmission measurement magnitude: 135 db Measurement time
Rigol DSA705 Spectrum Analyzer Reviewed by Phil Salas AD5X
 Rigol DSA705 Spectrum Analyzer Reviewed by Phil Salas AD5X ad5x@arrl.net Today s state-of-the-art test equipment is becoming more and more affordable. Spectrum analyzers, however, have stayed above the
Signal Characteristics
 Data Transmission The successful transmission of data depends upon two factors:» The quality of the transmission signal» The characteristics of the transmission medium Some type of transmission medium
Precalculations Individual Portion Introductory Lab: Basic Operation of Common Laboratory Instruments
 Name: Date of lab: Section number: M E 345. Lab 1 Precalculations Individual Portion Introductory Lab: Basic Operation of Common Laboratory Instruments Precalculations Score (for instructor or TA use only):