MODEL 8405A VECTOR VOLTMETER
|
|
|
- Joella Newman
- 6 years ago
- Views:
Transcription
1

2 MODEL 8405A VECTOR VOLTMETER
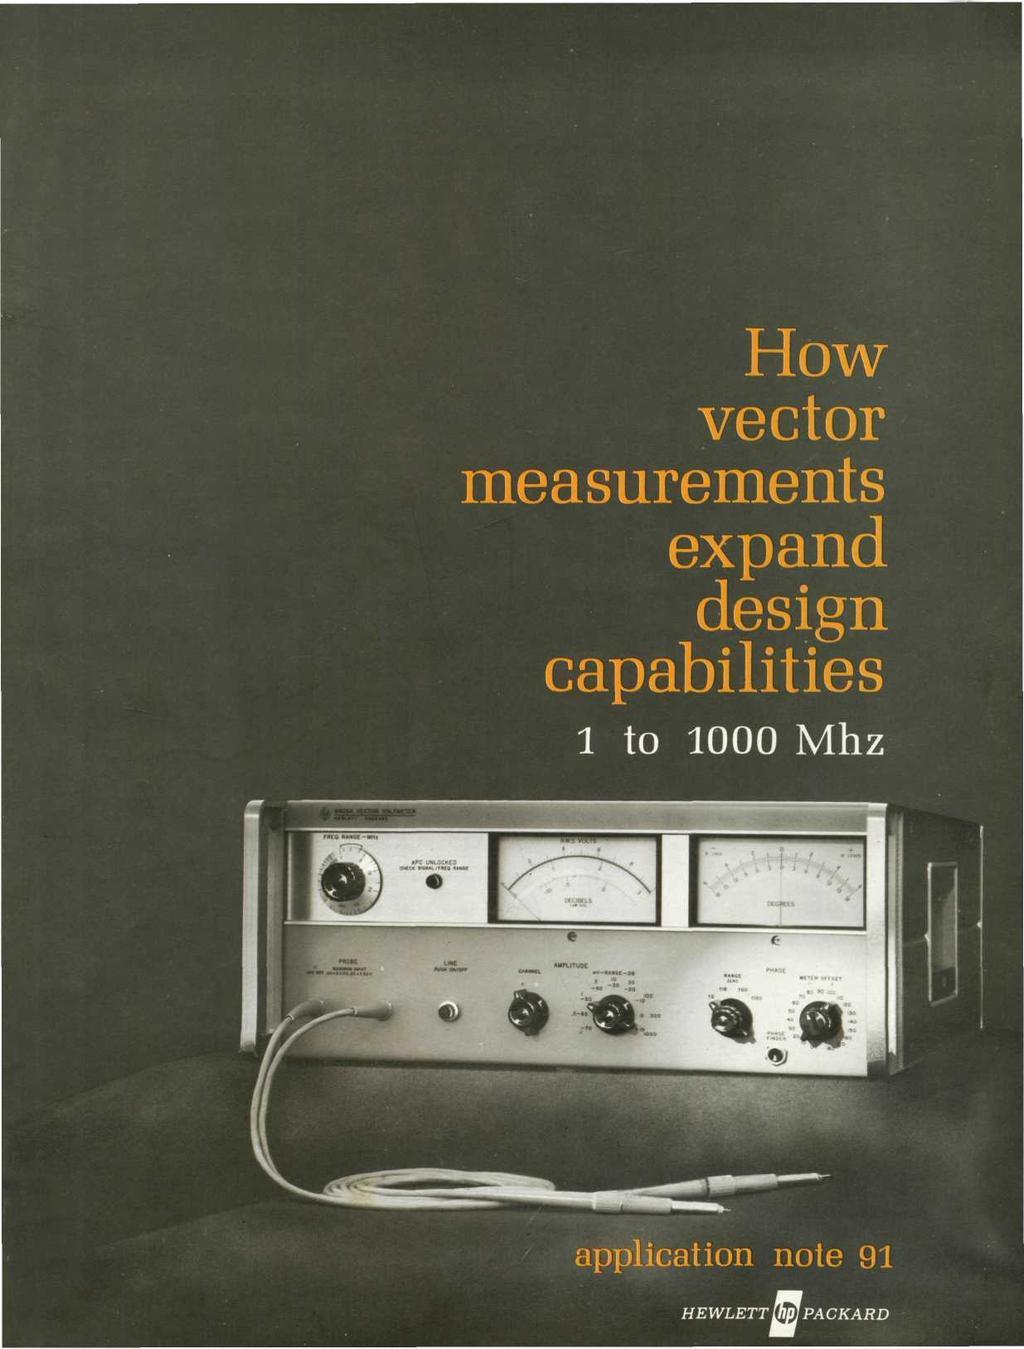
3 APPLICATION NOTE 91 HOW VECTOR MEASUREMENTS EXPAND DESIGN CAPABILITIES -1 to 1,000 MHz JANUARY 1968 TABLE OF CONTENTS PAGE Introduction Feedback Amplifiers.. 2 Transmission Line Electrical Length 4 Matching Cable Electrical Length 6 Group Delay. 8 Resonance 12 Automatically Tuned Voltmeter 14 Amplitude Modulation Measurement 15 1 to 1000 MHz Appendix I Appendix II 18

4 MODEL 8405A VECTOR VOLTMETER FREQ RANGE Tunes over octave bands automatically. PHASE RANGE SWITCH ±6 full scale APC UNLOCKED Light goes out when 8405A is "locked 1 PHASE FINDER Returns PHASE RANGE to ±180 and METER OFFSET to 0 for direct readout of phase regardless of the position of these controls. CHANNEL SELECTOR SWITCH 4. AMPLITUDE RANGE SWITCH 100 /j.volts full scale sensitivity 90 db range 8. PHASE METER OFFSET ±180 in 10 steps HIGH IMPEDANCE PROBES IF OUTPUT Reconstructs RF to 20 khz for analysis with lowfrequency instruments.

5 Introduction Vector measurements can add a new dimension to design information. "Vector" refers to the capability of defining two voltages not only by their magnitude but by the phase difference between them. Presented in simple graphical form (Figure 1), these parameters are magnitudes "A" and "B" and the angle "SAB" between them. This note presents a variety of commonly encountered situations where vector measurements can provide important insight into device and circuit behavior. The techniques for making these vector measurements involve the use of the Hewlett-Packard 8405A Vector Voltmeter, a two-channel RF millivoltmeter/phasemeter covering the 1- to 1,000-MHz frequency range. The instrument uses phase-locked coherent sampling to translate the RF signals to 20-kHz signals that retain the same wave shapes and the same amplitude and phase relationships as the original RF. Thus, the vector voltmeter can be considered much like an RF receiver, and the resultant performance characteristics are related to those you might find in a precision laboratory receiver. The various applications presented in this note draw upon the receiver-like properties of the vector voltmeter; for this reason, the salient characteristics of the instrument will be discussed briefly. * A Figure 1. Measurement of voltage ratios are, in reality, "vector" measurements since a phase angle always exists in addition to magnitude information. Wide Frequency Coverage. The frequency range of the vector voltmeter is 1 to 1,000 MHz, a part of the spectrum where vector information is often required yet historically has been difficult to obtain. Signal tuning of the instrument is simple and noncritical because the 8405A phase-locks itself to the fundamental of the incoming signal with only a coarse front-panel adjustment covering octave or greater spans. It can then follow slowly drifting signals automatically. High Sensitivity. Like a receiver, the vector voltmeter is a sensitive instrument, measuring down to 100 pv full scale (residual noise is less than 10 /tv), and maximum input is 10 V full scale with a 10:1 divider. Thus, readings can be taken over a 90- to 100-dB range useful for measuring filters in both pass and rejection bands as well as other high loss or high gain devices. High Selectivity. Although the sampling system employed in the 8405A results in wide frequency coverage, the actual measurement bandwidth in the 20-kHz IF preceding the voltage and phase measuring sections is only about 1 khz, affording high selectivity. As a result, measurements are free from errors that might be encountered with a wideband system if signal harmonics or other spurious outputs were present. The illustration opposite page 1 shows the 8405A Vector Voltmeter with the major operating controls described. In addition to the applications presented in this note, the vector voltmeter has proven to be immensely useful for measuring variables such as transistor parameters 1, frequency drift 2, complex impedance 3, RF leakage, antenna characteristics 4, and many other applications. 1 HP Application Note 77-1, Transistor Parameter Measurements. 2 HP Application Note 77-2, Precision Frequency Comparison. 3 HP Application Note 77-3, Complex Impedance Measurements, 1 to 1,000 MHz. 4 "The RF Vector Voltmeter An Important New Instrument For Amplitude and Phase Measurements from 1 MHz to 1,000 MHz." HP Journal, May 1966, pages (Copies of these are available, at no charge, from your local HP Sales Office or from Hewlett-Packard, Palo Alto.) Page 1
. See Figure 2a.")
6 Feedback Amplifiers Feedback has considerable effect on the characteristics of an amplifier. For example, when ft times the output of an amplifier is fed back into the input of an amplifier with gain G, the overall amplifier gain, K, becomes K = G/(l + /3G). See Figure 2a. The open-loop gain, /?G, however, is frequency-sensitive and varies in both phase and magnitude with changes in frequency. When [3G has unity magnitude (0 db) and a phase angle of 180 degrees, the amplifier becomes unstable and starts to oscillate. GAIN AND PHASE MARGIN An indication of the stability of a feedback amplifier is given by the phase margin and gain margin. Phase margin is the difference between 180 degrees and the phase of /?G at the frequency for which the open-loop gain is 0 db. Gain margin is the open-loop gain at the frequency where the phase of /3G is 180 degrees. Typical gain and phase margins are 10 to 40 db and 20 to 50 degrees, respectively, for stable amplifier operation. MEASUREMENT The vector voltmeter is ideally suited for high-frequency feedback amplifier analysis. The open-loop gain and phase can be read simultaneously over the frequency range from 1 to 1,000 MHz and over a 90-dB dynamic range. The configuration for making open-loop gain measurements is given in Figure 2b. A procedure for making open-loop gain measurements is as follows: 1. Break the circuit at the summing junction (point where the output is fed back into the input as indicated in Figure 2a for an ideal feedback amplifier). 2. Terminate the open-loop with impedances equal to the closed-loop impedances seen at the summing junction of the closed-loop amplifier. See Figure 2b. 3. Set the signal generator at frequency of interest and secure probe A of the vector voltmeter near the input of the circuit. Probe A is used to keep the vector voltmeter in phase-lock and must have an input of at least 1.5 mv, 1 10 MHz; 300 /./.V, MHz; 500 //.V, 500 1,000 MHz. 4. Measurements are made with channel B of the vector voltmeter. Either the HP 11576A 10:1 Divider or the HP 10216A Isolator should be used on the 8405A probes to prevent errors due INPUT TERMINATIONS FOR OPEN-LOOP GAIN MEASUREMENTS GAIN = Figure 2a. Schematic Diagram of Typical Feedback Circuit. Figure 2b. Test Setup for Making Open-Loop Gain and Phase Margin Measurements. Page 2
7 to variations in test point impedances. Place probe B at test point 1 as indicated in Figure 2b. Using the phase zero control, adjust the 8405A for a convenient phasemeter reference (preferably 0 degrees]. Note phase and amplitude readings. 5. Place probe B at test point 2 as indicated in Figure 2b. Note amplitude and phasemeter readings. The difference between these readings and those of step 4 will give the open-loop gain of the feedback amplifier. 6. Increase the frequency of the signal generator until the phase difference indicated by the vector voltmeter is ±180 degrees. The gain indicated at this frequency is the open-loop gain margin. 7. Increase signal generator frequency until the gain indicated by the vector voltmeter is 0 db. Subtract 180 degrees from the phase indicated at this frequency for the open-loop phase-margin. EXAMPLE Figure 3 shows the open-loop phase and gain for a transistor amplifier circuit as measured with the vector voltmeter. The amplifier was unstable, as gain and phase margins indicate. ACCURACY There are three accuracy considerations when making open-loop gain measurements with the 8405A; 1) basic instrument accuracy, 2) test point impedance variation, and 3] open-loop gain terminations. The procedure described above makes voltage ratio and phase difference measurements. The accuracy of the 8405A is best for this type of measurement. Since both input and output measurements are made with channel B, the absolute voltage and phase errors tend to cancel out. Voltage ratio can be measured within ±0.2 db and phase difference within ±1.5 to ±6 degrees over a 0- to 70-dB dynamic range. Test point impedance is another source of error. For instance, amplitude and phase measurement errors are about 2 percent and 10 degrees, respectively, with a test point impedance variation of 25 to 1,000 ohms. These errors, however, are eliminated by using the HP 10216A Isolators or 11576A 10:1 Dividers on the probes for measurements up to approximately 100 MHz. Above 100 MHz, where circuits behave more like transmission lines (and impedance levels are more related to the transmission line characteristic impedance), use of the HP 11536A 50n Probe Tee is especially desirable. If terminations for the open-loop amplifier do not duplicate the closed-loop summing junction impedance, the amplifier characteristics will change, thus causing incorrect measurements. If the necessary impedance cannot be determined by inspection or simple calculation, it can be measured with the HP 4815A RF Impedance Meter (500 khz 108 MHz) to ensure accurate impedance duplication V If -I in g-250 Q. 300 FREQ (MHz) Figure 3. Phase and gain responses are plotted for a transistor feedback amplifier from 1 to 40 MHz. Note that data indicates amplifier is unstable. Page 3

8 Transmission Line Electrical Length Transmission lines have a vital role in all RF and pulse systems. Although they are designed primarily for minimum SWR and attenuation, it is becoming more and more important to determine their electrical length. The electrical length of a transmission line is critical in many applications. Some of these are: Feed lines for phased-array antennas Cable for pulsed RF systems Pulse compression radars Computers It is also convenient to know the electrical length of a device which has considerable phase shift, particularly when the device is relatively narrow band in nature. Typical examples of such devices are cascaded IF amplifiers, distributed amplifiers, or crystal filters. Time domain reflectometry 5 is one way to measure electrical length. However, in cases where both ends of the transmission line are available, a method employing phase measurements with the 8405A Vector Voltmeter offers an important advantage the ability to measure electrical length as a function of frequency with high accuracy and resolution. Electrical length, I, is given by 6 10 s A0 where Af = 2 - fi fi (Hz) = an arbitrary frequency 2 (Hz) = a frequency above f i A0 (degrees) = phase shift when the frequency is changed from fj to f2 Determining electrical length using this equation becomes easy because the unknowns, A0 and Af, can readily be measured with the vector voltmeter and a frequency 5 Hewlett-Packard Application Notes 62, 67 and 75 cover time domain reflectometry in a comprehensive manner. Copies of these notes are available without charge from your nearest HP Sales Office, or from Hewlett-Packard Co., Palo Alto, Calif. counter, respectively. The electrical length is simply the constant, 10 8 /1.2, times the slope of phase versus frequency, A0/Af. Thus, changes of electrical length with frequency are indicated by nonlinearities in the phaseversus-frequency plot. See Figure 4. FREQUENCY Figure 4. Nonlinearity of phase versus frequency indicates that electrical length is a function of frequency according 10 8 A0, to the relationship 1 =T^ ' TT ( cm )' MEASUREMENT The measurement setup for such a length determination is shown in Figure 5. When the frequency range of interest is narrow with respect to the center frequency, accurate measurement of the frequency change requires high stability in the source and good resolution in the frequency measurements. Therefore, the use of a phaselocked signal source and a high-stability frequency counter is recommended. The procedure is as follows: 1. To calibrate, zero the phase with the range switch in the ±6 position over the frequency range of interest. In Figure 5, the electrical lengths from the signal source to channels A and B are practically identical. Change the frequency from fi to fz and note the net phase shift, if any, to check this. 2. Insert the unknown as shown. 6 See Appendix I for derivation. Page 4
9 608 F SIGNAL GENERATOR 8405A VECTOR VOLTMETER II549A 849IA POWER 849IA lodb SPLITTER IOdB Figure 5. Test Setup for Measuring Electrical Length by Determining Phase Shift versus Frequency of Test Device. 3. Note the phase shift at fi and measure this frequency. Use the phase offset and the ±6 scale for highest phase resolution. 4. Change to frequency 2 and measure it. The frequency increment should be small, or consistent with the accuracy of measuring f2-fi, in order to obtain a good approximation of the phase slope at a given frequency. Again, use the phase offset and the ±6 range to read phase. Calculate A0 and Af from steps 3 and 4 after subtracting any phase shift noted in step 1 from A0. ACCURACY Equation (1) shows that the accuracy in measuring electrical length is a function of the error in measuring the quantities A0 and Af. The error in A0 is ~ 0.2 degree for A0 = 10 degrees or about 2 percent when the phase shift is within the 12 degree single-phase range of the 8405A Vector Voltmeter. If the phase shift is greater than 12 degrees, the error in phase is typically no greater than 1.5 degrees over a 360 degree range for low loss (<20 db) devices. Thus, the error, in this case, is a function of the measured phase shift. Frequency increments should be small to keep A0 less than 12 degrees. In addition, accurate measurements of electrical length at a given frequency point are possible with small frequency increments. It is assumed that a synchronized or stabilized signal source is used to eliminate frequency drift errors. Accuracy of Af depends upon the resolution and accuracy of the frequency counter used. The resolution and accuracy required will depend upon the phase-versus-frequency slope, or electrical length, of the device. Counters are available that provide resolutions and accuracies to a few cycles. Consequently, the error in electrical length is usually limited to the vector voltmeter phase error of about ±0.2 degree for A0 <12 degrees, or approximately ±2 percent. Page 5

10 Matching Cable Electrical Length A common measurement requirement is matching two devices, such as cables, to have the same electrical length. It is not sufficient for the device to have the exact mechanical length. Small variations in propagation velocity between the two will result in different electrical lengths even though the mechanical dimensions are the same. A difficulty arises in the fabrication of matched cables for electrical length. Once the connectors have been attached, it is time consuming to remove the connector and re-trim the cables if the electrical lengths are not the same. The method described here matches the cables before the connectors are attached. 5246L/5253B COUNTER The 8405A Vector Voltmeter measures the phase shift between the incident wave on a cable and the wave reflected from the open-circuited end of the cable. When the electrical length of two cables is the same, the phase shift will be the same. The lengths could differ by an integral number of wavelengths, but in the 1- to 1,000- MHz frequency range of the vector voltmeter this difference is usually apparent by inspection. MEASUREMENT The test configuration appears in Figure 6. Note the use of the dual directional coupler for separating the incident and reflected waves. The test frequency is not 8405A VECTOR VOLTMETER Figure 6. Test Setup using Directional Couplers to Measure Phase Shift and, thus, Match Electrical Length of Two Cables Very Precisely. Page 6
11 necessarily limited by the range of the dual directional coupler, for it will operate well below the stated frequency range. Coupling factor increases as frequency is lowered (at a 6 db/octave rate), and signal levels become smaller. This seldom limits measurement range because the vector voltmeter has high sensitivity and wide dynamic range. By stabilizing the signal generator with the synchronizer, the measurement is more precise. Stabilization is not usually required except at the higher frequencies and where the length of the cable is an appreciable part of a wavelength. The procedure for matching electrical lengths is as follows: 1. Set up the instrument as shown in Figure Cut the cables to the approximate length desired. You can use time domain reflectometry for this purpose (see HP Application Note 67). 3. Connect the shorter cable to the coupler and set an arbitrary phase reference. 4. Replace the shorter cable with the longer and trim the longer cable until the phase readings are the same. Install the connectors with care to preserve the equality of the electrical length. EXAMPLE Two pieces of RG214/U cable about 2% feet long are to be made equal in electrical length. The first cable is connected to the coupler. Using the phase offset and ±6 scale, the phase is zeroed. The first cable is replaced by the second and a degree phase shift is noted. (Note the phase will always be leading for the longer line.) The longer cable is carefully trimmed until the phase shift is zero, i.e., matches the reference phase shift. The two cables are now matched with about ±0.2 mm precision. ACCURACY The conditions of this test allow maximum phase accuracy. The signal amplitude is approximately the same in both channels and the 8405A probes are both in 50Q line. Furthermore, in the final stages of trimming the longer cables, the phase range and the phase offset switches will remain in the same position for both cables. Under these conditions, the accuracy depends upon the resolution, repeatability, and short-term drift of the system, which is approximately ±0.2-degree. With the above phase resolution and repeatability, the accuracy to which lengths can be matched is about 0.2 -A = ' 4 A 360 At a frequency of 1,000 MHz, the signal wavelength will be ~30 cm and so accuracy will be about 0.2 mm. The frequency drift of the source must be kept within ±0.1 percent. The HP 606, 608, and 612 Signal Generators all have less than this amount of drift after a 10-minute warmup. The drift can be monitored with a counter. The 8708A Synchronizer, available for both the 606B and 608F Signal Generators, provides for frequency stability of a few parts in Page 7

12 Group Delay A device may introduce two types of distortion. The first type is due to a frequency-sensitive amplitude response. The second type occurs from nonlinear phase variations and may be a significant source of distortion even when the amplitude response is flat. Related to the second type is a phenomenon called "group delay," which is the transit time of signals through a device. Group delay is defined as Group Delay = to =3 [s) do) It is proportional to the slope of phase versus frequency. When the transit time or group delay is not constant with frequency (phase versus frequency is nonlinear), phase relationships of the signal components change, and distortion results. Group delay measurements are important in audio- and video-frequency amplifiers and networks. In transmission systems with complex waveforms, such as TV or carrier systems, a linear phase characteristic is necessary to prevent waveshape degradation. 7 The 8405A Vector Voltmeter is well suited for group delay measurements. The frequency range of the vector voltmeter is 1 to 1,000 MHz, which includes many of the communications systems frequency allocations. The phase offset control of the instrument permits a ±6 fullscale phase reading for high resolution measurements. MEASUREMENT To measure the group delay of an amplifier or other network, first set up the test equipment as in Figure 7. The 8708A Synchronizer will help achieve greater precision by stabilizing the signal generator. The procedure is as follows: 1. With the test equipment in the configuration of Figure 7, zero the phase shift with the range switch on ±6. 2. Insert the test network as in Figure 8. 7 S. Goldman, Frequency Analysis, Modulation and Noise, McGraw-Hill, P (2) 3. Vary the frequency over the frequencies of interest and note the phase shift. 4. Calculate the group delay. d<t> (rad) ~ (deg) 360 Af (Hz) ' For convenience, choose Af to be some power of 10 times Hz. (The number, is related to the reciprocal of 360 which, therefore, converts phase in degrees directly into time units.) For example, if Af is MHz, = A0 (deg) _ = t D (ns) = A< 10' 9 (s) or Thus, when Af = MHz, the phase meter units are nanoseconds instead of degrees. In general, group delay can be determined by changing input frequency in increments of " khz and determining delay from corresponding phase meter changes with scale factor of 10' n jus/deg, where n = 0, ±1, ±2,... EXAMPLE The device under test in this example was a broadband amplifier. The test equipment was set up in the configuration of Figure 8. The frequency was varied in MHz steps. Thus, the phase change in degrees represented the group delay in nanoseconds for that frequency increment. The results of this test are plotted in Figure 9. REFERENCE DELAY LINE It is much easier to evaluate a device for phase nonlinearity, or changes in group delay, if the mean slope of the phase-versus-frequency curve is as close to zero as possible so that the changes in slope become deviations from a near 0-degree phase reference. This can be done by inserting into the reference channel a line with (3) Page 8
13 L. _j I536A TEE 5246L/ 5253B COUNTER 608 F SIGNAL GENERATOR 8405A VECTOR VOLTMETER Figure 7. Equipment Connections for Calibrating Vector Voltmeter for Group Delay Measurements. 608 F SIGNAL GENERATOR 8405A VECTOR VOLTMETER PROBE II549A DEVICE UNDER TEST 11 POWFR, 1 U 908A 50n TERM HXXWJ167" Figure 8. Measurement of Group Delay on Device Inserted in Setup of Figure 7. Page 9

14 o c_) LjJ _i LU Q FREQUENCY (MHz) 200 Figure 9. Group delay of a CATV amplifier is plotted directly from measurements of phase shift in degrees with frequency in MHz steps. Group delay in nano-seconds is thus read directly from phase meter scale in degrees. an equivalent delay equal to the mean slope of phase versus frequency. Figures 10 and 11 show phase-versusfrequency curves before and after a delay line is inserted in the A or reference channel between the power splitter and the probe tee. With the delay line in the reference channel, any phase change with frequency indicates the difference between the delay of the reference line and the delay of the device under test. You can determine the electrical length of the reference delay line by using the method described in the section on measuring electrical length. The length can also be approximated by noting that 1 foot of delay line (f =1.0) is roughly equivalent to 1 nanosecond of delay. Including a line stretcher as part of the delay line is convenient for fine tuning. Higher accuracy for making relative delay measurements is possible by using a reference delay line because it is PHASE not necessary to change the phase range setting on the vector voltmeter. In fact, when the setting is not changed, the phase accuracy of the vector voltmeter will be better than ±0.2-degree or ±0.2 nanosecond in the case of MHz steps. Absolute group delay accuracy will depend, of course, on the accuracy of measuring the electrical length of the reference delay line. SWEPT-FREQUENCY DISPLAY OF GROUP DELAY Many group delay measurements require a swept-frequency display to observe instantaneous changes in group delay over a frequency band while adjustments are being made on the device being tested. For example, devices such as filters and equalizers must be adjusted for constant group delay or linear phase response over given pass bands to minimize distortion. A unique method for making this kind of qualitative measurement with the vector voltmeter has been devised that requires only a slight modification to the instrument. An additional benefit to this technique is the ability to use the vector voltmeter phase offset control as a delay line to set the display for a phase reference anywhere in the band of interest. This is particularly advantageous when adjusting multi-order pole filters where the group delay may be as long as 1 microsecond. A delay line (e = 1) about 1000 feet long would be necessary to cancel out the linear phase component of devices with this order of group delay. THEORY OF OPERATION The test setup for this measurement is shown in Figure 12. Because the RF circuitry of the 8405A cannot follow fast sweeps and stay "locked" or tuned to the signal frequency, the RF section of the instrument is bypassed and only the 20-kHz IF section of the vector voltmeter is used in this application. Thus the need for the signal source frequency to be amplitude-modulated at a 20-kHz frequency through the double balanced mixer. The power supply provides the dc necessary to bias the mixer properly. The modulated, swept RF is fed through an attenuator to the device to be tested, then detected, amplified, and fed to the 20-kHz section of the vector voltmeter. This I 355D ATTEN I f UNDER TEST Figure 10. Phase Response versus Frequency for Device with Large Electrical Length. GROUP DELAY to ^EQUENCY Figure 11. Phase response of device tested in Figure 10 has delay line or line stretcher inserted in reference channel. This allows higher phase resolution and accuracy in making relative group delay measurements. HORIZ \N I ^ \N2 140 SCOPE F 201' osc 200 CD 465A AMP f * [ F OUTPUTS 8405A VECTOR VOLTMETER ^AMPLITUDE a PHASE OUTPUTS Figure 12. Test Setup for Making Swept-frequency Displays for Group Delay Adjustments. Page 10

15 section measures the phase difference between the detected 20-kHz signal and the 20-kHz modulating or reference signal. In this case, the demodulated 20-kHz signal has the same phase relationship to the reference 20-kHz signal as the phase-shifted carrier frequency has to the reference RF signal applied to the device. The ±180 phase offset switch of the 8405A is conveniently used as a variable phase shifter, or delay line, to present an easily readable display on an oscilloscope. It is usually desirable to balance out the linear phase component of the phase-versus-frequency response so that the nonlinear effects can be displayed against the horizontal graticule lines of the oscilloscope. This allows for expansion of the display with the oscilloscope sensitivity controls and for calibration, if desired, of the display in units of group delay per centimeter. The inputs to the vector voltmeter are to the rear panel terminals labeled "20 khz IF output." Circuit boards A3, A4, A10 must be removed to disable certain circuitry when using this method. The phase and amplitude outputs of the vector voltmeter are fed into the vertical inputs of a dual-trace oscilloscope, which is horizontally swept by the sweep generator. The phase range switch of the Vector Voltmeter is then adjusted so that the group delay trace is flat at center frequency. Effects of filter adjustments on the phase response can then be monitored continuously on the oscilloscope. EXAMPLE The device under test in this case was a 5th order Bessell function filter in the 10.7-MHz IF section of an FM tuner. Oscilloscope traces for three different degrees of alignment are shown in Figures 13,14, and 15. The upper curve in each case is amplitude. In Figure 13, both the amplitude and group delay curves show that the filter is improperly aligned. Figure 14 shows the case where amplitude response would indicate proper alignment, although the group delay is still slightly nonlinear in the mid-frequency range. When the IF strip has been properly tuned, the group delay appears flat as in Figure 15. Figure 13. Top Trace: Amplitude Response of IF Passband of FM Receiver. Bottom Trace: Group Delay. Note that filter in receiver is out of alignment. Figure 14. Same as Figure 13 but filter is adjusted for optimum amplitude response, although phase, or group delay, is still slightly nonlinear. Figure 15. Same as Figure 13 and 14 with IF strip properly adjusted for flat group delay over passband. Page 11

16 Resonance The 8405A Vector Voltmeter can be used to determine the resonant frequency of tuned circuits, filters, oscillators and other circuits in the frequency range from 1 to 1,000 MHz. With the 8405A, one can locate the resonant frequency by detecting the zero-degree phase crossover. Historically, the technique has been to locate a maximum or minimum of the amplitude response. The phase detection method is a much more accurate and sensitive method because phase is usually changing very rapidly near resonance, while the amplitude response curve in this region is often essentially flat. MEASUREMENT A typical measurement setup is shown in Figure 5. (The 8708A Synchronizer is used to phase-lock the signal generator for greater stability.) The measurement procedure is as follows: 1. Set up the test configuration as in Figure 5, leaving out the test device and connecting the B channel 11536A Probe Tee directly to the power splitter. 2. Zero the phase meter. 3. Insert the test device. 4. Read phase shift versus frequency. range), the amplitude variation is imperceptible. It is the extreme phase sensitivity that allows the resonant frequency to be determined with very high resolution. m-20- D z 0_ UJ -80 MAGNITUDE I KHz fo I KHz Figure 16. Amplitude and Phase Response of Narrow Band 20-MHz Crystal Filter. Resonance is defined as the frequency at which the phase shift through the device equals the 0-degree phase reference set during Step 2. The circuit is purely resistive at the 0-degree phase crossover point, the reactive components having canceled out, and is thus resonant. To distinguish between a series or parallel-type resonance, note whether the amplitude response has peaked to a maximum or minimum. EXAMPLE The test device for this example was an HP 8442A 20- MHz narrow band Crystal Filter. Its amplitude and phase characteristics are plotted in Figure 16. The expanded scale of Figure 17 shows the curves in greater detail near resonance. Note that as the phase varies from +6 to 6 (full scale on the most sensitive phase fo 100 Hz Figure 17. Plot of crystal filter of Figure 16 is greatly expanded near resonant frequency. Note the high phase versus frequency sensitivity which allows determination of resonant frequency with exceptional resolution. Page 12
17 The Q of the filter can also be obtained from this test. The Q is equal to the resonant frequency divided by the 3-dB bandwidth. The Q was about 9100 for the HP 8442A Filter. ACCURACY This technique assumes that the electrical length at resonance of the device under test is negligible. A possible source of error, however, is the shift in phase from the 0-degree resonance phase point due to the electrical length added by the physical length of the device. The device is assumed to resonate at the center plane of its physical configuration. The physical length is composed of transmission lines carrying the signal to the resonant structure. This effect upon accuracy will depend upon (1) the resonant frequency wavelength (2) the slope of the phase-versus-frequency curve of the network near resonance (3) and the physical length of the device. You can estimate the effect of the electrical length phase shift on the resonant frequency determination by measuring the physical length of the device, converting this to phase shift at the resonant frequency, and by noting how much this phase shift would affect frequency accuracy. In this example, the wavelength is about 1500 cm at 20 MHz, the electrical length is approximately 15 cm, and the phase slope is about 15 Hz/deg. This results in a frequency accuracy of deg 15 Hz/deg = ±54 Hz = ' Note that the very high sensitivity of the phase response (=15 Hz/deg) as compared to the amplitude response accounts for the capability to determine the resonant frequency accurately. Page 13

18 Automatically Tuned Voltmeter Several of the 8405A Vector Voltmeter design features combine to make it an exceptionally easy-to-use tuned voltmeter over its frequency range from 1 to 1,000 MHz. Channel A locks on the largest input signal to the vector voltmeter. Channel B responds to signals only at the frequency to which channel A is locked. The 3-dB bandwidth is 1 khz. The vector voltmeter also has a broad three-decade frequency range and greater than 90 db dynamic range. With the combination of automatic signal tuning and high measurement selectivity, measurements are made easily and accurately. An example of its use to measure a notch filter is discussed below. Measurement with the vector voltmeter is then compared with a broadband voltmeter. The comparison shows the erroneous results that can be obtained because the broadband voltmeter responds to harmonics of the signal source output. harmonic content to cause considerable error in measurements of this type unless a tuned voltmeter such as the 8405A is used. The vector voltmeter shows that the true rejection is approximately 50 db. The test configuration for this example is the same as Figure 8. The operation of the vector voltmeter to obtain this data was extremely simple. It was only necessary to set the frequency range switch to the proper octave setting, tune the signal source through the band, and change the amplitude range switch as necessary. The vector voltmeter automatically locked to the signal source and measured the response at that frequency only. EXAMPLE The filter used in this example is a notch filter designed to reject a 21.6-MHz signal. It is used to suppress the second harmonic of a signal generator. Its precise frequency response, especially at the rejection frequency, must be known in this application. o BROADBAND VOLTMETER For a comparison, the frequency response of the filter was plotted using both a broadband voltmeter and the vector voltmeter. Since the broadband voltmeter would respond to signal source frequencies other than the fundamental, it was expected to show an incorrect picture of the rejection of the filter. This was found to be the case. S i6h z o t- 2 z Ul I- 32- H 40- VECTOR VOLTMETER The two frequency response curves are plotted in Figure 18. The lower curve is the data plotted using the vector voltmeter; the upper, the broadband voltmeter. At the maximum rejection frequency of about 21.6 MHz, the amplitude response as measured by the broadband voltmeter was approximately 17 db in error. The broadband voltmeter was also measuring the response of the filter at 43.2 and 64.8 MHz, i.e., the 2nd and 3rd harmonics of the signal source. Most signal generators have enough FREQUENCY (MHz) Figure 18. Plot of magnitude response of filter using 1 khz bandwidth vector voltmeter and general purpose broadband voltmeter. Difference is due to response of broadband voltmeter to harmonics of unsufficiently filtered signal source. Page 14

19 I Amplitude Modulation The 8405A Vector Voltmeter allows convenient, direct measurement of peak amplitude modulation on signals from 1 to 1,000 MHz on a low frequency (20 khz), high input impedance oscilloscope. It translates signals in this 3-decade RF range down to 20 khz. In translation, the relation of the sidebands to the carrier is preserved for sideband frequencies up to about 10 khz. This method of measuring AM offers several advantages over other methods in this frequency range. It is quickly and easily made. AM is displayed on a low-frequency oscilloscope even at frequencies as high as 1,000 MHz. Other methods, such as using crystal detectors to demodulate, require working in the square-law range, (requiring mathematical conversions), or in the linear range where selection of crystals with wide dynamic range is difficult. The vector voltmeter is, in essence, a broadband receiver with wide dynamic range that can display AM on any carrier from 1 to 1,000 MHz through its 20-kHz output. 608 F 200 CD Amplitude modulation on weak carrier signals (100 /J.V] can be measured with it because of its high sensitivity. In addition, as a receiver, the vector voltmeter automatically tunes to the signal source through a phaselock feedback circuit and, thus, does not require manual retuning to follow any drift in the signal source. Percent modulation can be conveniently determined as follows: 1. Connect the instruments as in Figure Calibrate the oscilloscope trace with the unmodulated carrier. The peak magnitude corresponds to 100 percent AM. For example, if the peak carrier voltage were 10 cm, the percent modulation would be 10%/cm. I40A OSCILLOSCOPE «9 w m 8405A VECTOR VOLTMETER Figure 19. Test setup is used to check percent AM modulation of signal generators from 1 to 1,000 MHz by displaying 20-kHz IF signal of vector voltmeter on oscilloscope. Page 15

20 3. Offset the peak of the unmodulated carrier to the lowest graticule line of the oscilloscope. The offset capabilities of most oscilloscopes will limit the full scale amplitude to 100 percent AM full scale. 4. Modulate the carrier and read percent modulation from the oscilloscope trace. By this procedure, the percent modulation of the trace in Figure 20 can be read directly as 50 percent in Figure 21. LOW LEVEL MODULATION For very low levels of modulation it is possible to increase the resolution to a few percent. This requires the use of the Hewlett-Packard 1406A Differential Amplifier plug-in for the 140 HP/or 141 Oscilloscope. This plug-in has the dc offset capability required to position the expanded modulating signal on the oscilloscope. It also has dc stabilization, which eliminates any dc drift of the trace. The following steps briefly outline the method. 1. Set up the instruments as shown in Figure 19 using the 1406A Differential Amplifier. 2. Set the peak magnitude of the CW signal to full scale on the oscilloscope. 3. Increase the vertical sensitivity of the oscilloscope by the desired multiple (e. g., if the calibration was 10% AM per cm, a sensitivity change from 10 mv/cm to 1 mv/cm on the oscilloscope would result in 1% AM/cm.) 4. Using the positioning adjustment, offset the trace until the peak of the unmodulated carrier is at the center graticule line. 5. Modulate the carrier and note the percent modulation. Figure 22 shows about 1 percent modulation, illustrating the sensitivity of the method Figure % AM on 400-MHz carrier is observed on line frequency oscilloscope. 400-MHz carrier is reconstructed to 20-kHz output signal. Figure 21. Oscilloscope offset technique allows percent AM to be read directly off oscilloscope graticule. t %AM I 1% Figure 22. Low levels of AM modulation are observed with use of sensitive differential amplifier scope plug-in with dc offset capability. Page 16
; then I = = electrical length (2) Solving for A0 360 (3) (9) But (4) Since 1 = ni A0 I = 360 ^ -1 where 300 10 6.")
21 Appendix I Derivation of the formula for determining electrical length. and = number of wavelengths at frequency fj A fl (8) (meters); then I = = electrical length (2) Solving for A0 360 (3) (9) But (4) Since 1 = ni A0 I = 360 ^ -1 where A 2 ~ 7 (meters) (10) f 2 being the next higher frequency above fi which causes a phase change of A0. From (3) and (4) A0 ni + A0 360 A! f 2 ~" A 2 " fl (5) (6] (7) Substituting (2) into (10) 1 = A A0-1 fl 360 fl (11) 1 = 108 A0 10 s A0 1.2 ' f 2 -fi ' 1.2 ' Af (cm). (12) Page 17
. Tuning: Automatic within each band.")
22 Appendix II SPECIFICATIONS INPUT CHARACTERISTICS GENERAL Instrument Type: Two-channel sampling RF millivoltmeter-phasemeter which measures voltage of two signals and simultaneously displays the phase angle between the two signals. Frequency Range: 1 MHz to 1 GHz in 21 overlapping octave bands (lowest band covers two octaves). Tuning: Automatic within each band. Automatic phase control (ARC) circuit responds to the Channel A input signal. Search and lock time, approximately 10 millisec. Voltage Range Channel A: 1 to 10 MHz : 1.5 mv to 1 V rms. 10 to 500 MHz: 300 /*V to 1 V rms. 500 to 1,000 MHz : 500 /iv to 1 V rms. Can be extended by a factor of 10 with 11576A 10:1 Divider. 20 khz IF Output (each channel): Reconstructed signals, with 20 khz fundamental components, having the same amplitude, waveform, and phase relationship as the input signals. Output impedance, 1,000 ohms in series with 2,000 pf; BNC female connectors. Recorder Output: Amplitude: 0 to + 1 V dc ± 6% open circuit, proportional to voltmeter reading in volts. Output tracks voltage reading within ± 0.5% of full scale. Output impedance, 1,000 ohms; BNC female connector. Phase: 0 to ± 0.5 V dc ± 6%, proportional to phasemeter reading. External load greater than 10,000 ohms affects recorder output and meter reading less than 1%. Output tracks meter reading within ± 1.5% of end scale; BNC female connector. Channel B: 100 /iv to 1 V rms full scale (input to Channel A required); can be extended by a factor of 10 with 11576A 10:1 Divider. Input Impedance (nominal): 0.1 megohm shunted by approximately 2.5 pf; 1 megohm shunted by approximately 2 pf when 11576A 10:1 Divider is used; 0.1 megohm shunted by approximately 5 pf when 10216A Isolator is used. AC coupled. Isolation Between Channels: 1 to 300 MHz-, greater than 100 db. 300 to 1,000 MHz: greater than 80 db. Maximum AC Input: 2 V peak. Maximum DC Input: ± 50 V. RFI: Conducted and radiated leakage limits are below those specified in MIL-I-6181D and MIL-I-16910C except for pulses emitted from probes. Spectral intensity of these pulses is approximately 60 /W/ MHz; spectrum extends to approximately 2 GHz. Pulse rate varies from 1 to 2 MHz. Power: 115 or 230 V ± 10%, 50 to 400 Hz, 35 watts. Weight: Net, 30 Ib (13,5 kg). Shipping, 35 Ib (15,8 kg). Dimensions: 18% x 7 x 16% in. (467 x 177 x 425 mm). Page 18

23 VOLTMETER CHARACTERISTICS PHASEMETER CHARACTERISTICS Meter Ranges: 100 ^V to 1 V rms full scale in 10-dB steps. Meter indicates amplitude of the fundamental component of the input signal. Voltage Accuracy: When accessories are used on one or both probes. Phase Range: 360, indicated on zero-center meter with end-scale ranges of ± 180, ± 60, ± 18, and ± 6. Meter indicates phase difference between the fundamental components of the input signals. Resolution: 0.1 at any phase angle. Accessory Impedance Frequency Accuracy Meter Offset: ± 180 in 10 steps. HP 11536A SOn Feedthrough Tee HP 11576A 10:1 Divider Freq MHz MHz 50! 1 SWR <1.15 < M«f" 1 2 pf I I on anini/ fn 7 * >rt T(MHl) from MHz MHz MHz MHz MHz ±2% of full scale ±6% of f.s. ± 12% of f.s.* + 6% of f.s. Phase Accuracy: At single frequency 1.5 (equal signal levels at Channel A and B). Phase accuracy vs. frequency and signal level. Accessory HP 11536A 50" Feedthrough Tee Frequency MHz MHz Voltage Range Channel A or B 100 /W to 300 mv 100 /iv to 100 mv Phase Accuracy ±3 ~+~ 3 HP 10216A Isolator lookfif"! 5pF l 132 T(MHz) from MHz MHz ±6% of f.s. HP A 10:1 Divider HP 10216A Isolator MHz MHz 1 mv to 3 V 100 MV to 300 mv ±4 ±6 * Above 300 mv and 800 MHz add + 5%. Voltage Ratio Accuracy: 0.2 (IB. Residual Noise: Less than 10 ^V as indicated on the meter. Bandwidth: 1 khz. Phase Jitter vs. Channel B Input Level Greater than 700 ifl-. Typically less than 0.1 p-p. 125 to 700 /iv: Typically less than 0.5 p-p. 20 to 125 ^V: Typically less than 2 p-p. Page 19

24 PRINTED IN U.S.A. HEWLETT [ho] PACKARD
100 Hz to 22. HP 8566B Spectrum Analyzer. Discontinued Product Support Information Only. Outstanding Precision and Capability
 Discontinued Product Support Information Only This literature was published years prior to the establishment of Agilent Technologies as a company independent from Hewlett-Packard and describes products
HP 8901B Modulation Analyzer. HP 11722A Sensor Module. 150 khz MHz. 100 khz MHz. Technical Specifications. Four Instruments In One
 HP 8901B Modulation Analyzer 150 khz - 1300 MHz HP 11722A Sensor Module 100 khz - 2600 MHz Technical Specifications Four Instruments In One RF Power: ±0.02 db instrumentation accuracy RF Frequency: 10
HF Receivers, Part 2
 HF Receivers, Part 2 Superhet building blocks: AM, SSB/CW, FM receivers Adam Farson VA7OJ View an excellent tutorial on receivers NSARC HF Operators HF Receivers 2 1 The RF Amplifier (Preamp)! Typical
FREQUENCY AGILE FM MODULATOR INSTRUCTION BOOK IB
 FMT615C FREQUENCY AGILE FM MODULATOR INSTRUCTION BOOK IB1215-02 TABLE OF CONTENTS SECTION SUBJECT 1.0 Introduction 2.0 Installation & Operating Instructions 3.0 Specification 4.0 Functional Description
87415A microwave system amplifier A microwave. system amplifier A microwave system amplifier A microwave.
 20 Amplifiers 83020A microwave 875A microwave 8308A microwave 8307A microwave 83006A microwave 8705C preamplifier 8705B preamplifier 83050/5A microwave The Agilent 83006/07/08/020/050/05A test s offer
Model 4402B. Ultra-Pure Sinewave Oscillator 1Hz to 110kHz Typical Distortion of % Serial No. Operating Manual
 Model 4402B Ultra-Pure Sinewave Oscillator 1Hz to 110kHz Typical Distortion of 0.0005% Serial No. Operating Manual 15 Jonathan Drive, Unit 4, Brockton, MA 02301 U.S.A. Tel: (508) 580-1660; Fax: (508) 583-8989
UNIT-3. Electronic Measurements & Instrumentation
 UNIT-3 1. Draw the Block Schematic of AF Wave analyzer and explain its principle and Working? ANS: The wave analyzer consists of a very narrow pass-band filter section which can Be tuned to a particular
Understanding Mixers Terms Defined, and Measuring Performance
 Understanding Mixers Terms Defined, and Measuring Performance Mixer Terms Defined Statistical Processing Applied to Mixers Today's stringent demands for precise electronic systems place a heavy burden
This section lists the specications for the Agilent 8360 B-Series. generators, Agilent Technologies has made changes to this product
 2c Specifications This section lists the specications for the Agilent 8360 B-Series swept signal generator. In a eort to improve these swept signal generators, Agilent Technologies has made changes to
HP Archive. This vintage Hewlett Packard document was preserved and distributed by www. hparchive.com Please visit us on the web!
 HP Archive This vintage Hewlett Packard document was preserved and distributed by www. hparchive.com Please visit us on the web! On-line curator: Glenn Robb This document is for FREE distribution only!
FMR622S DUAL NARROW BAND SLIDING DE-EMPHASIS DEMODULATOR INSTRUCTION BOOK IB
 FMR622S DUAL NARROW BAND SLIDING DE-EMPHASIS DEMODULATOR INSTRUCTION BOOK IB 1222-22 TABLE OF CONTENTS SECTION 1.0 INTRODUCTION 2.0 INSTALLATION & OPERATING INSTRUCTIONS 3.0 SPECIFICATIONS 4.0 FUNCTIONAL
ECE 4670 Spring 2014 Lab 1 Linear System Characteristics
 ECE 4670 Spring 2014 Lab 1 Linear System Characteristics 1 Linear System Characteristics The first part of this experiment will serve as an introduction to the use of the spectrum analyzer in making absolute
< 15% (< 30% for 3-MHz bandwidth)
") MODEL 8559A GENERAL INFORMATION TABLE 1-1. HP MODEL8569ASPECIFICATIONS(1OF 4) SPECIFICATIONS FREQUENCY SPECIFICATIONS FREQUENCY RANGE 10 MHz to 21 GHz, covered in six pushbuttonselectable ranges: Band
MODEL 8559A GENERAL INFORMATION TABLE 1-1. HP MODEL8569ASPECIFICATIONS(1OF 4) SPECIFICATIONS FREQUENCY SPECIFICATIONS FREQUENCY RANGE 10 MHz to 21 GHz, covered in six pushbuttonselectable ranges: Band
Measurement Procedure & Test Equipment Used
 Measurement Procedure & Test Equipment Used Except where otherwise stated, all measurements are made following the Electronic Industries Association (EIA) Minimum Standard for Portable/Personal Land Mobile
Agilent Technologies PSA Series Spectrum Analyzers Test and Adjustment Software
 Test System Overview Agilent Technologies PSA Series Spectrum Analyzers Test and Adjustment Software Test System Overview The Agilent Technologies test system is designed to verify the performance of the
Keysight Technologies Making Accurate Intermodulation Distortion Measurements with the PNA-X Network Analyzer, 10 MHz to 26.5 GHz
 Keysight Technologies Making Accurate Intermodulation Distortion Measurements with the PNA-X Network Analyzer, 10 MHz to 26.5 GHz Application Note Overview This application note describes accuracy considerations
Agilent 8902A Measuring Receiver
 Agilent 8902A Measuring Receiver Technical Specifications Agilent 11722A Sensor Module Agilent 11792A Sensor Module Agilent 11793A Microwave Converter Agilent 11812A Verification Kit The Agilent Technologies
The Discussion of this exercise covers the following points:
 Exercise 3-2 Frequency-Modulated CW Radar EXERCISE OBJECTIVE When you have completed this exercise, you will be familiar with FM ranging using frequency-modulated continuous-wave (FM-CW) radar. DISCUSSION
Experiment 1: Instrument Familiarization
 Electrical Measurement Issues Experiment 1: Instrument Familiarization Electrical measurements are only as meaningful as the quality of the measurement techniques and the instrumentation applied to the
Testing Power Sources for Stability
 Keywords Venable, frequency response analyzer, oscillator, power source, stability testing, feedback loop, error amplifier compensation, impedance, output voltage, transfer function, gain crossover, bode
CAVITY TUNING. July written by Gary Moore Telewave, Inc. 660 Giguere Court, San Jose, CA Phone:
 CAVITY TUNING July 2017 -written by Gary Moore Telewave, Inc 660 Giguere Court, San Jose, CA 95133 Phone: 408-929-4400 1 P a g e Introduction Resonant coaxial cavities are the building blocks of modern
Experiment 1: Instrument Familiarization (8/28/06)
") Electrical Measurement Issues Experiment 1: Instrument Familiarization (8/28/06) Electrical measurements are only as meaningful as the quality of the measurement techniques and the instrumentation applied
Electrical Measurement Issues Experiment 1: Instrument Familiarization (8/28/06) Electrical measurements are only as meaningful as the quality of the measurement techniques and the instrumentation applied
VHF LAND MOBILE SERVICE
 RFS21 December 1991 (Issue 1) SPECIFICATION FOR RADIO APPARATUS: VHF LAND MOBILE SERVICE USING AMPLITUDE MODULATION WITH 12.5 khz CARRIER FREQUENCY SEPARATION Communications Division Ministry of Commerce
Agilent 8360B Series Synthesized Swept Signal Generators 8360L Series Synthesized Swept CW Generators Data Sheet
 Agilent 8360B Series Synthesized Swept Signal Generators 8360L Series Synthesized Swept CW Generators Data Sheet 10 MHz to 110 GHz Specifications apply after full user calibration, and in coupled attenuator
Glossary of VCO terms
 Glossary of VCO terms VOLTAGE CONTROLLED OSCILLATOR (VCO): This is an oscillator designed so the output frequency can be changed by applying a voltage to its control port or tuning port. FREQUENCY TUNING
Antenna Measurements using Modulated Signals
 Antenna Measurements using Modulated Signals Roger Dygert MI Technologies, 1125 Satellite Boulevard, Suite 100 Suwanee, GA 30024-4629 Abstract Antenna test engineers are faced with testing increasingly
PXA Configuration. Frequency range
 Keysight Technologies Making Wideband Measurements Using the Keysight PXA Signal Analyzer as a Down Converter with Infiniium Oscilloscopes and 89600 VSA Software Application Note Introduction Many applications
Sampling and Reconstruction
 Experiment 10 Sampling and Reconstruction In this experiment we shall learn how an analog signal can be sampled in the time domain and then how the same samples can be used to reconstruct the original
MAKING TRANSIENT ANTENNA MEASUREMENTS
 MAKING TRANSIENT ANTENNA MEASUREMENTS Roger Dygert, Steven R. Nichols MI Technologies, 1125 Satellite Boulevard, Suite 100 Suwanee, GA 30024-4629 ABSTRACT In addition to steady state performance, antennas
There is a twenty db improvement in the reflection measurements when the port match errors are removed.
 ABSTRACT Many improvements have occurred in microwave error correction techniques the past few years. The various error sources which degrade calibration accuracy is better understood. Standards have been
Models 900CT & 900BT. Tunable Active Single Channel Certified Filter Instrument
 Tunable Active Single Channel Certified Filter Instrument Description Frequency Devices instruments are single channel; 8-pole low-pass or high-pass, front panel tunable filter instruments. The controls
Model 7000 Low Noise Differential Preamplifier
 Model 7000 Low Noise Differential Preamplifier Operating Manual Service and Warranty Krohn-Hite Instruments are designed and manufactured in accordance with sound engineering practices and should give
DISCRETE DIFFERENTIAL AMPLIFIER
 DISCRETE DIFFERENTIAL AMPLIFIER This differential amplifier was specially designed for use in my VK-1 audio oscillator and VK-2 distortion meter where the requirements of ultra-low distortion and ultra-low
UNIT 2. Q.1) Describe the functioning of standard signal generator. Ans. Electronic Measurements & Instrumentation
 Describe the functioning of standard signal generator. Ans. Electronic Measurements & Instrumentation") UNIT 2 Q.1) Describe the functioning of standard signal generator Ans. STANDARD SIGNAL GENERATOR A standard signal generator produces known and controllable voltages. It is used as power source for the
UNIT 2 Q.1) Describe the functioning of standard signal generator Ans. STANDARD SIGNAL GENERATOR A standard signal generator produces known and controllable voltages. It is used as power source for the
Lab 4. Crystal Oscillator
 Lab 4. Crystal Oscillator Modeling the Piezo Electric Quartz Crystal Most oscillators employed for RF and microwave applications use a resonator to set the frequency of oscillation. It is desirable to
Measurements 2: Network Analysis
 Measurements 2: Network Analysis Fritz Caspers CAS, Aarhus, June 2010 Contents Scalar network analysis Vector network analysis Early concepts Modern instrumentation Calibration methods Time domain (synthetic
Keysight Technologies 8 Hints for Making Better Measurements Using RF Signal Generators. Application Note
 Keysight Technologies 8 Hints for Making Better Measurements Using RF Signal Generators Application Note 02 Keysight 8 Hints for Making Better Measurements Using RF Signal Generators - Application Note
PN9000 PULSED CARRIER MEASUREMENTS
 The specialist of Phase noise Measurements PN9000 PULSED CARRIER MEASUREMENTS Carrier frequency: 2.7 GHz - PRF: 5 khz Duty cycle: 1% Page 1 / 12 Introduction When measuring a pulse modulated signal the
Operational Amplifiers
 Operational Amplifiers Table of contents 1. Design 1.1. The Differential Amplifier 1.2. Level Shifter 1.3. Power Amplifier 2. Characteristics 3. The Opamp without NFB 4. Linear Amplifiers 4.1. The Non-Inverting
A HILBERT TRANSFORM BASED RECEIVER POST PROCESSOR
 A HILBERT TRANSFORM BASED RECEIVER POST PROCESSOR 1991 Antenna Measurement Techniques Association Conference D. Slater Nearfield Systems Inc. 1330 E. 223 rd Street Bldg. 524 Carson, CA 90745 310-518-4277
Measurement and Analysis for Switchmode Power Design
 Measurement and Analysis for Switchmode Power Design Switched Mode Power Supply Measurements AC Input Power measurements Safe operating area Harmonics and compliance Efficiency Switching Transistor Losses
Title: New High Efficiency Intermodulation Cancellation Technique for Single Stage Amplifiers.
 Title: New High Efficiency Intermodulation Cancellation Technique for Single Stage Amplifiers. By: Ray Gutierrez Micronda LLC email: ray@micronda.com February 12, 2008. Introduction: This article provides
FS5000 COMSTRON. The Leader In High Speed Frequency Synthesizers. An Ideal Source for: Agile Radar and Radar Simulators.
 FS5000 F R E Q U E N C Y S Y N T H E S I Z E R S Ultra-fast Switching < 200 nsec Wide & Narrow Band Exceptionally Clean An Ideal Source for: Agile Radar and Radar Simulators Radar Upgrades Fast Antenna
note application Measurement of Frequency Stability and Phase Noise by David Owen
 application Measurement of Frequency Stability and Phase Noise note by David Owen The stability of an RF source is often a critical parameter for many applications. Performance varies considerably with
SIGNAL RECOVERY. Model 7265 DSP Lock-in Amplifier
 Model 7265 DSP Lock-in Amplifier FEATURES 0.001 Hz to 250 khz operation Voltage and current mode inputs Direct digital demodulation without down-conversion 10 µs to 100 ks output time constants Quartz
Keysight Technologies N9320B RF Spectrum Analyzer
 Keysight Technologies N9320B RF Spectrum Analyzer 9 khz to 3.0 GHz Data Sheet Definitions and Conditions The spectrum analyzer will meet its specifications when: It is within its calibration cycle It has
Agilent N9320B RF Spectrum Analyzer
 Agilent N9320B RF Spectrum Analyzer 9 khz to 3.0 GHz Data Sheet Definitions and Conditions The spectrum analyzer will meet its specifications when: It is within its calibration cycle It has been turned
Model Hz to 10MHz Precision Phasemeter. Operating Manual
 Model 6610 1Hz to 10MHz Precision Phasemeter Operating Manual Service and Warranty Krohn-Hite Instruments are designed and manufactured in accordance with sound engineering practices and should give long
Using Frequency Diversity to Improve Measurement Speed Roger Dygert MI Technologies, 1125 Satellite Blvd., Suite 100 Suwanee, GA 30024
 Using Frequency Diversity to Improve Measurement Speed Roger Dygert MI Technologies, 1125 Satellite Blvd., Suite 1 Suwanee, GA 324 ABSTRACT Conventional antenna measurement systems use a multiplexer or
Basic Communication Laboratory Manual. Shimshon Levy&Harael Mualem
 Basic Communication Laboratory Manual Shimshon Levy&Harael Mualem September 2006 CONTENTS 1 The oscilloscope 2 1.1 Objectives... 2 1.2 Prelab... 2 1.3 Background Theory- Analog Oscilloscope...... 3 1.4
Agilent 8657A/8657B Signal Generators
 Agilent / Signal Generators Profile Spectral performance for general-purpose test Overview The Agilent Technologies and signal generators are designed to test AM, FM, and pulsed receivers as well as components.
Keysight Technologies PNA-X Series Microwave Network Analyzers
 Keysight Technologies PNA-X Series Microwave Network Analyzers Active-Device Characterization in Pulsed Operation Using the PNA-X Application Note Introduction Vector network analyzers (VNA) are the common
HP 8901B Modulation Analyzer. HP 11722A Sensor Module. 150 khz MHz. 100 khz MHz. Technical Specifications. Four Instruments In One
 HP 8901B Modulation Analyzer 150 khz - 1300 MHz HP 11722A Sensor Module 100 khz - 2600 MHz Technical Specifications Four Instruments In One RF Power: ±0.02 db instrumentation accuracy RF Frequency: 10
MEASUREMENT PROCEDURE AND TEST EQUIPMENT USED
 MEASUREMENT PROCEDURE AND TEST EQUIPMENT USED Except where otherwise stated, all measurements are made following the Electronic Industries Association (EIA) Minimum Standard for Portable/Personal Land
DSTS-3B DEPTHSOUNDER TEST SET OPERATOR S MANUAL
 Page 1 1.0 INTRODUCTION DSTS-3B DEPTHSOUNDER TEST SET OPERATOR S MANUAL The DSTS-3B is a full-featured test set designed for use with all types of echo sounders from small flashers to large commercial
An Introduction to Spectrum Analyzer. An Introduction to Spectrum Analyzer
 1 An Introduction to Spectrum Analyzer 2 Chapter 1. Introduction As a result of rapidly advancement in communication technology, all the mobile technology of applications has significantly and profoundly
4. Digital Measurement of Electrical Quantities
 4.1. Concept of Digital Systems Concept A digital system is a combination of devices designed for manipulating physical quantities or information represented in digital from, i.e. they can take only discrete
Keysight Technologies Pulsed Antenna Measurements Using PNA Network Analyzers
 Keysight Technologies Pulsed Antenna Measurements Using PNA Network Analyzers White Paper Abstract This paper presents advances in the instrumentation techniques that can be used for the measurement and
EXHIBIT 3 : FCC (c) (TEST DATA) AND FCC (MEASUREMENT PROCEDURES) INTRODUCTION TO TRANSMITTER MEASUREMENTS, Part 2.
 (TEST DATA) AND FCC (MEASUREMENT PROCEDURES) INTRODUCTION TO TRANSMITTER MEASUREMENTS, Part 2.") EXHIBIT 3 : FCC 2.1033(c) (TEST DATA) AND FCC 2.1041 (MEASUREMENT PROCEDURES) INTRODUCTION TO TRANSMITTER MEASUREMENTS, Part 2.1033(c)(14) Exhibits 4 through 9 on the following pages present the required
EXHIBIT 3 : FCC 2.1033(c) (TEST DATA) AND FCC 2.1041 (MEASUREMENT PROCEDURES) INTRODUCTION TO TRANSMITTER MEASUREMENTS, Part 2.1033(c)(14) Exhibits 4 through 9 on the following pages present the required
LIMITATIONS IN MAKING AUDIO BANDWIDTH MEASUREMENTS IN THE PRESENCE OF SIGNIFICANT OUT-OF-BAND NOISE
 LIMITATIONS IN MAKING AUDIO BANDWIDTH MEASUREMENTS IN THE PRESENCE OF SIGNIFICANT OUT-OF-BAND NOISE Bruce E. Hofer AUDIO PRECISION, INC. August 2005 Introduction There once was a time (before the 1980s)
1. Explain how Doppler direction is identified with FMCW radar. Fig Block diagram of FM-CW radar. f b (up) = f r - f d. f b (down) = f r + f d
 = f r - f d. f b (down) = f r + f d") 1. Explain how Doppler direction is identified with FMCW radar. A block diagram illustrating the principle of the FM-CW radar is shown in Fig. 4.1.1 A portion of the transmitter signal acts as the reference
1. Explain how Doppler direction is identified with FMCW radar. A block diagram illustrating the principle of the FM-CW radar is shown in Fig. 4.1.1 A portion of the transmitter signal acts as the reference
Keysight Technologies Network Analyzer Measurements: Filter and Amplifier Examples. Application Note
 Keysight Technologies Network Analyzer Measurements: Filter and Amplifier Examples Application Note Introduction Both the magnitude and phase behavior of a component are critical to the performance of
Model 745 Series. Berkeley Nucleonics Test, Measurement and Nuclear Instrumentation since Model 845-HP Datasheet BNC
 Model 845-HP Datasheet Model 745 Series Portable 20+ GHz Microwave Signal Generator High Power +23dBM Power Output 250 fs Digital Delay Generator BNC Berkeley Nucleonics Test, Measurement and Nuclear Instrumentation
Direct-Conversion I-Q Modulator Simulation by Andy Howard, Applications Engineer Agilent EEsof EDA
 Direct-Conversion I-Q Modulator Simulation by Andy Howard, Applications Engineer Agilent EEsof EDA Introduction This article covers an Agilent EEsof ADS example that shows the simulation of a directconversion,
SWEEP OSCILLATORS B Model 8620 Series: 10 MHz to 22 GHz rj.~
 SWEEP OSCILLATORS B Model 8620 Series: 10 MHz to 22 GHz rj~ Single-band straddle-band and External phase-lock capability broadbandplug-ins >10 mw to 22 GHz HP 8620C with HP 862228, 862908 HP 8620 System
LBI-30398N. MAINTENANCE MANUAL MHz PHASE LOCK LOOP EXCITER 19D423249G1 & G2 DESCRIPTION TABLE OF CONTENTS. Page. DESCRIPTION...
 MAINTENANCE MANUAL 138-174 MHz PHASE LOCK LOOP EXCITER 19D423249G1 & G2 LBI-30398N TABLE OF CONTENTS DESCRIPTION...Front Cover CIRCUIT ANALYSIS... 1 MODIFICATION INSTRUCTIONS... 4 PARTS LIST AND PRODUCTION
2 Gain Variation from the Receiver Output through the IF Path
 EVLA Memo #185 Bandwidth- and Frequency-Dependent Effects in the T34 Total Power Detector Keith Morris September 17, 214 1 Introduction The EVLA Intermediate Frequency (IF) system employs a system of power
SC5307A/SC5308A 100 khz to 6 GHz RF Downconverter. Datasheet SignalCore, Inc.
 SC5307A/SC5308A 100 khz to 6 GHz RF Downconverter Datasheet 2017 SignalCore, Inc. support@signalcore.com P RODUCT S PECIFICATIONS Definition of Terms The following terms are used throughout this datasheet
Type Ordering Code Package TDA Q67000-A5168 P-DIP-18-5
 Video Modulator for FM-Audio TDA 5666-5 Preliminary Data Bipolar IC Features FM-audio modulator Sync level clamping of video input signal Controlling of peak white value Continuous adjustment of modulation
Agilent 8360B/8360L Series Synthesized Swept Signal/CW Generators 10 MHz to 110 GHz
 Agilent 8360B/8360L Series Synthesized Swept Signal/CW Generators 10 MHz to 110 GHz ity. l i t a ers V. n isio c e r P. y t i l i ib Flex 2 Agilent 8360 Synthesized Swept Signal and CW Generator Family
OPERATING AND MAINTENANCE MANUAL
 5Hz to 1MHz WIDE RANGE FULLY AUTOMATIC DISTORTION ANALYZER MODEL 6900B SERIAL NO. OPERATING AND MAINTENANCE MANUAL Unit 4, 15 Jonathan Drive, Brockton, MA 02301-5566 Tel: (508) 580-1660; Fax: (508) 583-8989
ERICSSONZ LBI-30398P. MAINTENANCE MANUAL MHz PHASE LOCKED LOOP EXCITER 19D423249G1 & G2 DESCRIPTION TABLE OF CONTENTS
 MAINTENANCE MANUAL 138-174 MHz PHASE LOCKED LOOP EXCITER 19D423249G1 & G2 TABLE OF CONTENTS Page DESCRIPTION... Front Cover CIRCUIT ANALYSIS...1 MODIFICATION INSTRUCTIONS...4 PARTS LIST...5 PRODUCTION
Testing and Stabilizing Feedback Loops in Today s Power Supplies
 Keywords Venable, frequency response analyzer, impedance, injection transformer, oscillator, feedback loop, Bode Plot, power supply design, open loop transfer function, voltage loop gain, error amplifier,
A Guide to Calibrating Your Spectrum Analyzer
 A Guide to Calibrating Your Application Note Introduction As a technician or engineer who works with electronics, you rely on your spectrum analyzer to verify that the devices you design, manufacture,
10 GHz Microwave Link
 10 GHz Microwave Link Project Project Objectives System System Functionality Testing Testing Procedures Cautions and Warnings Problems Encountered Recommendations Conclusion PROJECT OBJECTIVES Implement
Efficiently simulating a direct-conversion I-Q modulator
 Efficiently simulating a direct-conversion I-Q modulator Andy Howard Applications Engineer Agilent Eesof EDA Overview An I-Q or vector modulator is a commonly used integrated circuit in communication systems.
Model 7000 Series Phase Noise Test System
 Established 1981 Advanced Test Equipment Rentals www.atecorp.com 800-404-ATEC (2832) Model 7000 Series Phase Noise Test System Fully Integrated System Cross-Correlation Signal Analysis to 26.5 GHz Additive
EE-4022 Experiment 2 Amplitude Modulation (AM)
") EE-4022 MILWAUKEE SCHOOL OF ENGINEERING 2015 Page 2-1 Student objectives: EE-4022 Experiment 2 Amplitude Modulation (AM) In this experiment the student will use laboratory modules to implement operations
EE-4022 MILWAUKEE SCHOOL OF ENGINEERING 2015 Page 2-1 Student objectives: EE-4022 Experiment 2 Amplitude Modulation (AM) In this experiment the student will use laboratory modules to implement operations
SIGNAL GENERATORS. MG3633A 10 khz to 2700 MHz SYNTHESIZED SIGNAL GENERATOR GPIB
 SYNTHESIZED SIGNAL GENERATOR MG3633A GPIB For Evaluating of Quasi-Microwaves and Measuring High-Performance Receivers The MG3633A has excellent resolution, switching speed, signal purity, and a high output
Advanced Test Equipment Rentals ATEC (2832)
") Established 1981 Advanced Test Equipment Rentals www.atecorp.com 800-404-ATEC (2832) INSTRUCTION MANUAL MODEL 960 SERIES MICRO SWEEP 1 TO 18.0 GHz MICROWAVE GENERATORS 1985 Wavetek THIS DOCUMENT CONTAINS
Established 1981 Advanced Test Equipment Rentals www.atecorp.com 800-404-ATEC (2832) INSTRUCTION MANUAL MODEL 960 SERIES MICRO SWEEP 1 TO 18.0 GHz MICROWAVE GENERATORS 1985 Wavetek THIS DOCUMENT CONTAINS
MICROWAVE MICROWAVE TRAINING BENCH COMPONENT SPECIFICATIONS:
 Microwave section consists of Basic Microwave Training Bench, Advance Microwave Training Bench and Microwave Communication Training System. Microwave Training System is used to study all the concepts of
WESTREX RA-1712 PHOTOGRAPHIC SOUND RECORD ELECTRONICS
 INTRODUCTION The RA-1712 solid state Record Electronics is an integrated system for recording photographic sound tracks on a Westrex photographic sound recorder. It accepts a 600Ω input signal level from
Spectrum Analyzers R3132/3132N/3162 R3132/3132N/3162. Low cost, high performance. General-Purpose Spectrum Analyzer Adaptable to Various Applications
 Frequency band R3132 9 khz to 3 GHz R3132N:9 khz to 3 GHz R3162: 9 khz to 8 GHz High signal purity: -105 dbc (20 khz offset) Total level accuracy: ±1.5 db High speed GPIB useful for high speed productions
Single Conversion LF Upconverter Andy Talbot G4JNT Jan 2009
 Single Conversion LF Upconverter Andy Talbot G4JNT Jan 2009 Mark 2 Version Oct 2010, see Appendix, Page 8 This upconverter is designed to directly translate the output from a soundcard from a PC running
GAO-SAU-105 Spectrum Analyzer with Wide Frequency Range
 GAO-SAU-105 Spectrum Analyzer with Wide Frequency Range GAOTek Spectrum Analyzer with Wide Frequency Range has excellent performance to test dynamic range, phase noise, amplitude accuracy and test speed.
Exercise 2: FM Detection With a PLL
 Phase-Locked Loop Analog Communications Exercise 2: FM Detection With a PLL EXERCISE OBJECTIVE When you have completed this exercise, you will be able to explain how the phase detector s input frequencies
SC5407A/SC5408A 100 khz to 6 GHz RF Upconverter. Datasheet. Rev SignalCore, Inc.
 SC5407A/SC5408A 100 khz to 6 GHz RF Upconverter Datasheet Rev 1.2 2017 SignalCore, Inc. support@signalcore.com P R O D U C T S P E C I F I C A T I O N S Definition of Terms The following terms are used
Chapter 2. The Fundamentals of Electronics: A Review
 Chapter 2 The Fundamentals of Electronics: A Review Topics Covered 2-1: Gain, Attenuation, and Decibels 2-2: Tuned Circuits 2-3: Filters 2-4: Fourier Theory 2-1: Gain, Attenuation, and Decibels Most circuits
Agilent 8560 E-Series Spectrum Analyzers
 Agilent 8560 E-Series Spectrum Analyzers Data Sheet 8560E 30 Hz to 2.9 GHz 8561E 30 Hz to 6.5 GHz 8562E 30 Hz to 13.2 GHz 8563E 30 Hz to 26.5 GHz 8564E 30 Hz to 40 GHz 8565E 30 Hz to 50 GHz 8565E SPECTRUM
Reconfigurable 6 GHz Vector Signal Transceiver with I/Q Interface
 SPECIFICATIONS PXIe-5645 Reconfigurable 6 GHz Vector Signal Transceiver with I/Q Interface Contents Definitions...2 Conditions... 3 Frequency...4 Frequency Settling Time... 4 Internal Frequency Reference...
772D coaxial dual-directional coupler 773D coaxial directional coupler. 775D coaxial dual-directional coupler 776D coaxial dual-directional coupler
 72 772D coaxial dual-directional coupler 773D coaxial directional coupler 775D coaxial dual-directional coupler 776D coaxial dual-directional coupler 777D coaxial dual-directional coupler 778D coaxial
Agilent 8560 EC Series Spectrum Analyzers Data Sheet
 Agilent 8560 EC Series Spectrum Analyzers Data Sheet Agilent 8560EC 30 Hz to 2.9 GHz Agilent 8561EC 30 Hz to 6.5 GHz 1 Agilent 8562EC 30 Hz to 13.2 GHz Agilent 8563EC 30 Hz to 26.5 GHz Agilent 8564EC 30
Multi-function Gain-Phase Analyzer (Frequency Response Analyzer) Model 2505
 Model 2505") OTHER PRODUCTS.. Multi-function Gain-Phase Analyzer ( Response Analyzer) Model 2505 Standard Configurations Gain phase analyzer response analyzer Phase Angle Voltmeter (PAV) Fast dual channel wide-band
OTHER PRODUCTS.. Multi-function Gain-Phase Analyzer ( Response Analyzer) Model 2505 Standard Configurations Gain phase analyzer response analyzer Phase Angle Voltmeter (PAV) Fast dual channel wide-band
Microwave Circuit Design and Measurements Lab. INTRODUCTION TO MICROWAVE MEASUREMENTS: DETECTION OF RF POWER AND STANDING WAVES Lab #2
 EE 458/558 Microwave Circuit Design and Measurements Lab INTRODUCTION TO MICROWAVE MEASUREMENTS: DETECTION OF RF POWER AND STANDING WAVES Lab #2 The purpose of this lab is to gain a basic understanding
APPH6040B / APPH20G-B Specification V2.0
 APPH6040B / APPH20G-B Specification V2.0 (July 2014, Serial XXX-XX33XXXXX-XXXX or higher) A fully integrated high-performance cross-correlation signal source analyzer for to 7 or 26 GHz 1 Introduction
MAHALAKSHMI ENGINEERING COLLEGE TIRUCHIRAPALLI UNIT III TUNED AMPLIFIERS PART A (2 Marks)
") MAHALAKSHMI ENGINEERING COLLEGE TIRUCHIRAPALLI-621213. UNIT III TUNED AMPLIFIERS PART A (2 Marks) 1. What is meant by tuned amplifiers? Tuned amplifiers are amplifiers that are designed to reject a certain
MAHALAKSHMI ENGINEERING COLLEGE TIRUCHIRAPALLI-621213. UNIT III TUNED AMPLIFIERS PART A (2 Marks) 1. What is meant by tuned amplifiers? Tuned amplifiers are amplifiers that are designed to reject a certain
Phase-locked loop PIN CONFIGURATIONS
 NE/SE DESCRIPTION The NE/SE is a versatile, high guaranteed frequency phase-locked loop designed for operation up to 0MHz. As shown in the Block Diagram, the NE/SE consists of a VCO, limiter, phase comparator,
Definitions. Spectrum Analyzer
 SIGNAL ANALYZERS Spectrum Analyzer Definitions A spectrum analyzer measures the magnitude of an input signal versus frequency within the full frequency range of the instrument. The primary use is to measure
Improving Amplitude Accuracy with Next-Generation Signal Generators
 Improving Amplitude Accuracy with Next-Generation Signal Generators Generate True Performance Signal generators offer precise and highly stable test signals for a variety of components and systems test
9 Hints for Making Better Measurements Using RF Signal Generators. Application Note 1390
 9 Hints for Making Better Measurements Using RF Signal Generators Application Note 1390 Signal sources provide precise, highly stable test signals for a variety of component and system test applications.