PLASMA LINE STUDIES IN RELATION TO NATURALLY ENHANCED ION ACOUSTIC LINES (NEIALS)
|
|
|
- Mary Harvey
- 6 years ago
- Views:
Transcription
 Joachim S.")
1 FYS-3931 MASTER S THESIS IN SPACE PHYSICS PLASMA LINE STUDIES IN RELATION TO NATURALLY ENHANCED ION ACOUSTIC LINES (NEIALS) Joachim S. Knutsen JUNE, 2008 FACULTY OF SCIENCE Department of Physics and Technology University of Tromsø
2
3 FYS-3931 MASTER S THESIS IN SPACE PHYSICS PLASMA LINE STUDIES IN RELATION TO NATURALLY ENHANCED ION ACOUSTIC LINES (NEIALS) Joachim S. Knutsen June, 2008
4
5 i Acknowledgements First and foremost, a very special thanks to my advisor, Unni Pia Løvhaug, for all your insights, criticisms, praise and for giving me a truly intriguing project. Your enthusiasm for this subject has definitely rubbed off on me, and I hope I get many more opportunities to pursue this new passion of mine. Again, thank you. I also have to thank Ingemar Häggström at EISCAT for taking the time to lend me technical support when I struggled with the software. Without you this project would never have even gotten started. Magnar, thank you for seemingly dropping whatever you are doing and providing me with graphs, plots and general support whenever I've needed it. Primarily with my initial project work, but also to some extent on this thesis. Knowing you are nothing more than an away has been an added security. And last, but certainly not least, a big thank you to my office-mate, Lene, for the laughs, your blatant mockery and the interesting and rewarding discussions on anything from actual relevant physical topics to grammatical syntax. Without you I probably would have finished this thesis a lot sooner, but it would not have been nearly half as fun.
6 ii
7 iii Abstract New to the ESR common programmes is the inclusion of plasma lines along with the standard ion power density spectrum. Using data from the IPY common programme, a programme that has been run all through the International Polar Year, we have gone through large amounts of analysed data trying to find periods in time that fulfils the known criteria for finding Naturally Enhanced Ion Acoustic Lines (NEIALs), i.e. increased electron densities and penetration depth, a high electron temperature (>3000K) that is simultaneously equal to or greater than three times the ion temperature (Te>3Ti) and an increase in ion outflow velocities. Our primary focus has been on the parts of the year where conditions allow simultaneous runs of the Meridian Scanning Photometer (MSP) instrument over Svalbard, i.e. the dark winter months of December, January and February of 2007/2008. We get several results indicating field-aligned currents going both away and towards the radar simultaneously as well as several NEIALs occurring at altitudes that are normally considered to be too low with regards to some of the leading theories on the subject. Where such are observed, NEIALs are presented along with the corresponding plasma lines, as well as MSP plots, magnetometer data and the parameters of the solar wind taken by the ACE satellite to try and find more information regarding NEIALs and the underlying processes that cause them. A brief description of the leading theories regarding NEIALs is also included so we can argue whether or not our observations either strengthens or weakens these theories.
8 iv
9 v Contents Acknowledgements Abstract i iii Table of contents v 1 Genera Introduction EISCAT and the ESR radar The incoherent scatter spectra Plasma lines NEIALs The Current driven instability Ion-Ion Two-Stream instability Parametric decay of Langmuir waves 13 Observations December January December Discussion 45 5 Conclusions 49 Bibliography 51
10 vi
11 1 Chapter 1 General Introduction The topmost part of Earth's atmosphere becomes partly ionized through interactions with the plasma of the solar wind, and is labelled as the ionosphere. This is where events such as auroral emissions are observed, making understanding the ionosphere and the processes that take place there an interesting and important field of study. At very high or low latitudes ( ) the Earth's magnetic dipole field lines are open to direct injections of auroral particles and thus functions as windows into the ionosphere and the interactions between the Earth's and the interplanetary magnetic field. For this reason, instruments studying the ionosphere are placed either at, or as close as possible, to these latitudes. 1.1 EISCAT and the ESR radar The European Incoherent Scatter (EISCAT) Scientific Association is an international research organisation, operating several radar and receiver stations in northern Scandinavia and in Svalbard. At present the system consists of a VHF (Very High Frequency) and a UHF (Ultra High Frequency) radar situated just outside of Tromsø, Norway, and operating at 224 MHz and ~930 MHz, respectively. In addition, receiver stations are situated in Kiruna, Sweden, and Sodankylä, Finland. In the 1990's the system was expanded to include two more radars on Svalbard, an archipelago north of the Norwegian mainland (see figure 1).

12 Figure 1: A map of the EISCAT radar sites The EISCAT Svalbard Radar (ESR) consists of two antennas with one transmitter, operating at 500 MHz. In 1994, the first of the two antennas was completed, a 32 m in diameter parabolic dish antenna that is fully steerable. The second radar, completed in 1999, is a fixed 42 m dish, aimed directly along the magnetic field. Both radars are referred to as the 32 m and the 42 m ESR radars, or just the 32 m and the 42 m, respectively (see figure 2). Figure 2: The ESR 32 m (right) and 42 m (left) antennas 2
, most famously is perhaps the northern lights phenomenon.")
13 3 The positions of the EISCAT antennas close to where we know magnetic field lines are open to interplanetary space makes them ideally situated for studies concerning the ionosphere, its interactions with the solar wind and the interplanetary magnetic field (IMF), most famously is perhaps the northern lights phenomenon. Placed at about 780 N and 160 E (Geographical latitude and longitude) the ESR radar lies within the dayside auroral cusp region (see figure 3a) and the polar cap, while at 700 N and 190 E (also geographical coordinates) the Tromsø VHF and UHF radars are placed right in the middle of the night-side auroral oval (see figure 3b) Figure 3: a) Auroral oval over Svalbard at day. b) Auroral oval over northern Scandinavia at night 1.2 The incoherent scatter spectra The incoherent scatter spectra are derived from scattering electrons in the Earth's ionosphere that are excited by high frequency electromagnetic waves. These particles then emits radiation in all spherical directions, and a small portion of this radiation is detected by the ground installations and then interpreted to give the parameters of the plasma in the ionosphere; plasma density, the electron and ion temperatures, and the bulk plasma motion being among the most common and important ones. From these basic parameters, further computations could yield more information about the upper atmosphere. Cited from the EISCAT Scientific Associations own summary of incoherent scattering, these parameters include ion composition, electric field strength, conductivity and currents, Joule and particle heating rates, neutral air temperature, composition and wind speed, fluxes of heat and plasma along the Earth's magnetic field lines and, with additional information from the plasma lines, electric

14 4 current density in the direction of the magnetic field and part of the spectrum of supra-thermal electrons. Due to their high mass and inertia, relative to the electrons, ions are not good scatterers, but still have a profound impact on the incoherent scatter spectrum. The received power will follow a distribution determined by the ions and their dispersion relation (see compendium: Lecture notes in AGF-304 Radar diagnostics of space plasma by Noralv Bjørnå. eq. 53 and 54). This is due to the plasma property of shielding out electric potential (Debye shielding) and so, ions tend to repel other ions and attract electrons. If we then acknowledge the fact that the ions are most likely not stationary relative to the radar ground station, but rather drift, it stands to reason that the ions drag the much lighter electrons along. It is therefore the motion of the ions, which is reflected in the ion line in the incoherent scatter spectrum, as seen in figure 4. Figure 4: Standard shape of the ion density spectrum Figure 5: Actual ion density spectrum from the ESR 42 m radar The two peaks in the density profile can be explained as the radar seeing ions travelling away and towards the radar. This preferred ion motion is called ion-acoustic waves or ion-sound waves and propagate through the plasma with a frequency of the order of khz. If the waves were left to propagate through the plasma undisturbed, the spectrum would simply consist of two lines at -ω and ω, however, the waves are subjected to landau damping1 and thus, the lines are broadened to include all frequencies observed by the radar, in addition to the frequencies that carry the most effect, i.e. -ω and ω. 1 Although the subject of landau damping is a fascinating one, it is not a main topic for this thesis. Interested readers are instead referred to Chen, chapter for a more detailed analysis.
15 5 Figure 5 is an example of an actual ion density spectrum, taken from the ESR 42 m radar. The traditional double-humped spectrum is clearly visible, although not as «clean» as the example in figure 4. The reason why the spectrum is seemingly centred at 0 Hz is just a convenient way of presenting the data. The spectrum is actually centred around the transmittance frequency, i.e. for this example 500 MHz, this is also what is meant when we say the radar only see waves travelling at the same frequency as it transmits, namely waves with a k-vector that matches that of the radar. This is in fact a coherent scattering spectra, but due to the original theories, it was assumed that the individual electrons would be «free» and thus produce a power density spectrum where the width was determined by the electron thermal velocity, a much broader spectrum than what we normally get. In fact, this broad spectrum of «true» incoherent scattering is only possible to obtain if the radar wavelength is shorter than the ionospheric Debye length, making the radar see each individual particle instead of both the ions and their shielding electron cloud. As already mentioned, four basic parameters of the ionosphere can be determined by incoherent scatter radars (electron density, electron and ion temperatures and ion outflow). The total returned power to the system depends on the number of electrons scattering, i.e. a stronger return signal means more electrons or a greater electron density. The width of the spectrum corresponds to the ratio between the ion temperature and the ion mass and the ion outflow is correlated with the general Doppler shift of the ion lines. Finally, the shape of the ion density spectra is determined by the electron to ion temperature ratio. A weak landau damping (Te>>Ti) will result in narrower peaks around ± ω and thus a deeper dump between the two peaks. A strong dampening (Te Ti) will result in a much more shallow dump. One ion density spectrum is fairly similar to another, but a close analysis of the raw data may show that on some occasions, one or both of the ion acoustic shoulders are enhanced many orders of magnitude. It is the study of these Naturally Enhanced Ion Acoustic Lines (NEIALs) this thesis will focus on.

16 6 1.3 Plasma lines New to the common program experiments at EISCAT are the plasma lines. Found on either side of the normal ion density spectrum, these lines correspond to the upshifted and downshifted plasma frequency and are a signature of the Langmuir waves travelling towards and away from the radar, respectively. The electron plasma frequency is given by ωp = (nee2/ε0me)1/2 rad/sec where ne is the electron density and me is the electron mass. The actual wave frequency for the Langmuir waves is given by ω = (ωp2 + 3k2vth2)1/2 rad/sec where k is the wave number and vth is the thermal velocity of the electrons. vth = (σte/me)1/2 σ is Boltzmann's constant and Te is the electron temperature. Usually the second term in the wave frequency is small, compared to the electron plasma frequency, so the plasma lines are normally said to correspond to ωp, but if the frequency can be measured, we can find the electron density and temperature independently from the ion density spectrum. The width of the plasma lines are determined by the dampening of the Langmuir waves just as for the ion lines and are more closely explained by Bjørnå (Lecture notes AGF-304 Radar diagnostics of space plasma) and Chen (Chapter 4.3 and 4.4). Figure 6: Actual plasma line spectrum from the ESR 32 m radar
17 7 The real time graph used to plot the plasma lines are shown in figure 6. Plotting both lines in the same frame would not be practical as the upshifted and downshifted lines are far out to either side of the ion density spectrum. As they will be presented here, the topmost images (Figures 6 a1 and 6 a2) represent the upshifted plasma line, i.e. Langmuir waves travelling towards the radar, while the lower images (6 b1 and 6 b2) are the downshifted line, representing waves travelling away from the radar (information given by van Eyken, private communication). Also, figures 6 a1 and 6 b1 are density spectra, equivalent to the ion density spectrum (figures 4 and 5), just for the electrons. Figures 6 a2 and 6 b2 are the integrated power over all altitudes. A smooth normal distribution-like curve suggest a calm state. Any intensifications of the plasma lines will appear as spikes at the exact frequencies that are intensified. This will be shown in several of the observed spectra later in this thesis, as plasma lines will be presented taken from the same times, or as close to the same times as possible, as when we see NEIALs, so that an argument as to whether or not they are intensified along with the ion acoustic waves can be made. In theory, the Doppler shift in these intensified plasma lines together with the Doppler shift in the ion acoustic lines, could be used to calculate the currents involved and thus provide strong indications as to the field strength. However, here we run into problems as the plasma lines are just images ( snap-shots ) of their shape at the specific point in time, and not actual raw data. If future experiments were to give more detailed information on this point one might be able to do these calculations, but for now, this is not possible with a reasonable level of accuracy. Another method to retrieve the actual values is to do an image-conversion, but that is beyond the scope of this thesis.
18 8
19 9 Chapter 2 NEIALs Since they where first discovered in the incoherent scatter spectra in the late 80's early 90's (Foster et al. 1988; Rietveld et al. 1991; Collis et al. 1991), Naturally Enhanced Ion Acoustic Lines (NEIALs) have sparked a series of articles, trying to explain the underlying physical properties that generate these burst-like events. Already as early as 1962, Rosenbluth and Rostoker predicted enhancements of the ion acoustic shoulders in scatter spectra caused by field-aligned currents, but this were never confirmed with observations, as the required currents were considered unrealistically high. Initially considered to be nothing more than satellite echoes, NEIALs have more recently been established as a more common phenomenon primarily in the ionospheric F-layer. Burst-like in nature, these events can be hard to detect, and even if a data dump of a few seconds does show an enhanced ion acoustic shoulder, the event could be over by the time the next data dump is ready, making it somewhat difficult to track these enhancements in time. In fact Grydeland et. al. (2003) suggests NEIAL events can happen on time scales as short as a few tenths of a second. Why NEIALs occur is still somewhat of a mystery, however, the most prominent theories are i) Current driven instabilities (Foster et. al., 1988; Collis et. al. 1991; Rietveld et. al. 1991), ii) Ion-Ion Two-Stream Instability (Wahlund et. al., 1992b) and iii) Parametric decay of Langmuir waves (Forme 1993 and 1999). All of the theories have their strong sides and weak points and research into this field is still going on which might one day yield further explanations to why NEIALs occur, but for this paper, these are the three theories the arguments will be focused against. Many articles have been presented trying to explain the underlying driving forces of the enhanced spectra. The current driven instability, or ion-electron instability, based on the initial predictions of Rosenbluth and Rostoker; explain the enhancements with large thermal electron drifts relative to the ions. In the ion-ion two-stream instability, it is the relative drift between two ion populations that cause the enhancements (Wahlund et. al., 1992). Both of these theories rely on charged particles propagating along the magnetic field lines. Thus, they exclude NEIALs as being anything but
20 10 bound by the magnetic field, or at the very least, not likely to be detected at large angles to the magnetic field. Some observations however, might disprove this fact (Foster et. al., 1988; Knutsen, 2007). Last, but not least, the Parametric decay of Langmuir waves, proposed by Forme (1993, 1999), is perhaps the only theory that does not struggle to explain several of the more common features of NEIALs such as simultaneous enhancements of the ion acoustic shoulders or waves propagating in either direction, however, much work remains until all aspects of NEIALs are fully explained. This thesis will try to shed some new light as to what causes NEIALs and make some arguments for and against the leading theories on the subject. In addition, as of 2007, plots of the plasma lines were included in the common programme experiments. They will be presented alongside clear occurrences of NEIALs, so the added information these plots provide also can be taken into consideration. 2.1 Current Driven Instability As early as the 1960's, Rosenbluth and Rostoker (1962 and references therein) predicted that the power spectra from incoherent scatter radars could be enhanced as a result of field-aligned currents. The predictions were never verified however, as the field-aligned current density requirements where considered to be unrealistically high (~ 1 ma/m2). However, Foster et. al. (1988) reported seeing spectra that they interpreted as being due to such strong currents and later on, some measurements from the Ørsted satellite do lend credence to such a claim (Neubert and Christiansen, 2003). In the current driven instability theory, also known as ion-electron two-stream instability, ion acoustic instability is driven by thermal electron drifts. The large field-aligned current densities needed could be produced by parallel electric fields in theory, either by precipitating particles or horizontal conductivity. Rietveld et. al. (1991) gives a brief explanation as to why it so intuitively «feels» right to accept that strong differential flows between thermal ions and electrons yields enhanced ion acoustic spectra: A difference in the electron and ion drifts means that more electrons scatter radar waves on one side of the ion velocity distribution than the other. Also, a detectable asymmetry implies that the electrons are drifting at a notable fraction of their own thermal speed.
21 11 This again would require large current densities, but Rietveld et. al. (1991) takes this as verification as to why enhanced spectra are so uncommon. It should here be noted however, that their assumptions are based on observations from the EISCAT UHF radar in Tromsø, transmitting at 933 MHz. More recent observations with the ESR system (500 MHz) and the VHF radar (224 MHz) suggest that NEIALs are more commonly seen in radars using lower frequencies (Strømme, 2004; Knutsen, 2007). Which shoulder that is enhanced is said to be a measure of which way the thermal electrons are propagating (in relation to the ions). An enhancement in the positive frequency range means the electrons are travelling towards the radar, i.e. a downward field-aligned motion. An enhancement in the negative frequency range implies the opposite. This causes a problem for the current driven instability theory when enhancements in both shoulders occur simultaneously. Both Rietveld et. al. (1991) and Collis et. al. (1991) address this problem by suggesting that the data dumps where simultaneously enhancement occur, see a reversement of the strong field-aligned current within the radar integration times and that the enhancement in fact does not occur simultaneously, but rather is a result of inadequate temporal resolutions. Grydeland et. al. (2003) however seems to discredit this argument, observing what appears to be continuous growth and decay of the enhancements on a time scale of 0.2 seconds, and that on even these short time scales, some cases show simultaneous enhancements in both shoulders. Strong field-aligned currents, both away and towards the radar, occupying the same latitudinal area defined by the width of the radar beam, have long been thought to be impossible. Another possibility mentioned by Rietveld et. al. (1991) is that we are observing very narrow spatial structures in latitude. 2.2 Ion-Ion Two-Stream Instability Wahlund et. al. (1992b, references therein) argues that the strong field-aligned current densities needed for the ion-electron interactions of the current driven instabilities, have never truly been observed to occur, either independently or in correlation with an enhanced spectrum. Instead, Wahlund et. al. chooses to focus on strong field-aligned bulk ion outflows, which have been observed by the EISCAT system at the same time as NEIALs. The argument is that the ion-ion acoustic instability occurs as a result of a relative drift between two ion populations. As an example, H+ and O+ are mentioned to be the likely culprits at high ionospheric altitudes in the F-layer, with NO+-O+ instability a
22 12 possible process at lower altitudes. The densities of one of the ion populations are assumed to be much higher than the other. Although acceleration of H+ in the high ionosphere is possible (Løvhaug et. al., 2001), no process for accelerating O+ or NO+ at lower altitudes are proposed, in fact, the theory states that NEIALs occurring at lower altitudes is unlikely as the relative ion drifts required are thought to be too high in the lower regions of the ionosphere, where collisions between ions and neutrals begin to make an effect. The theory also assumes that the electrons have zero drift velocity, but Wahlund et. al. (1992b) makes a point of the fact that adjusting the electron drift velocity so that the final current density becomes zero, makes little change in the final results of their calculations. It is noted that large densities of electrons are observed in regions with enhanced ion acoustic turbulence (Wahlund et. al. operates with 1 x 10¹¹ m-3), calculating the required current for enhancement to occur according to the theory of ion-electron instability, would require a current density of about 670 μa m-2. This is one order below the minimum current density required to initiate enhancement of the ion lines, but for the ion-ion instability theory however, asymmetrical enhancements of a shoulder is already obtained for drifts around the thermal velocity and so has no problems with NEIALs occurring even if the currents present are not strong enough. Enhancement of one of the ion lines can occur as long as the relative drift velocity is of the order of the ion species thermal velocity, drifts larger than twice the ion thermal speed is said to produce enhancements of 1-2 orders of magnitude, i.e. density fluctuations approach the strong turbulence regime. At greater drifts one starts to leave the instability regime and the density fluctuations will decrease back to normal thermal levels. Exactly where this instability finally collapses is beyond the scope of this thesis to determine, but it should be mentioned that Wahlund et. al. observed enhancements in both shoulders for very large drifts (a factor of 4 or greater). The Ion-Ion Two-Stream Instability theory thus has its strong arguments, while some claims certainly needs more research, also as the enhancements involve charged particles, the theory assumes NEIALs are bound by the magnetic field lines, but certain observations suggests NEIALs can be seen with a large angle to the magnetic field lines (Foster, 1988; Knutsen, 2007).
23 Parametric decay of Langmuir waves Finding both the current driven and Ion-Ion instability theories to have problems explaining some of the characteristics of NEIALs, Forme (1993, 1999 and references therein) proposes a new possible theory as to what causes enhancements in the power spectra. He considers a beam of electrons with a certain density and field-aligned velocity, streaming through a background plasma with a different density. The total distribution function is then called a «bump-on-tail» distribution and is unstable to the beam instability so that electrostatic waves with a frequency close to the plasma frequency are excited. He goes on to state that the most important type of non-linear interaction responsible for parametric instabilities is the three-waves interaction, were Langmuir waves cause the growth of secondary Langmuir waves and ion-acoustic waves. This theory requires no strong field-aligned currents or large relative ion drift velocities. In addition, enhancement can occur without problems in both directions and therefore in both lines simultaneously. Upward propagating acoustic waves are predicted to be a result of large fluxes of backscattered and secondary electrons, while downward propagating waves are caused by precipitating particles. It does however, require the precipitating electrons to be of low energy, typically between ev, favouring Type II ion outflow2. This implies that NEIALs are not likely to occur during more energetic precipitation, unless a «soft» electron component is present. Also, with soft particles being the main trigger, this theory could have difficulties explaining NEIALs below the region where soft precipitation is usually deposited (around 300 km 400 km altitude). Harder electrons could penetrate further down into the ionosphere, loosing energy along the way until they finally reach the energy levels this theory require to enhance the ion acoustic lines, however, later examples will present NEIALs as far down as 150 km altitude, with little if any hard electron precipitation present. 2 Strømme (2004, references therein) mentions that a large Magnetosphere-Ionosphere (MI) coupling is the outflow of ionospheric plasma along open and closed field lines at high latitudes. EISCAT UHF and VHF observations have revealed periods of large field-aligned bulk ion outflow, referred to as Type I and Type II ion outflow. Type I is related to strong perpendicular electric fields, enhanced and anisotropic ion temperatures and low electron density below 300km, indicating small amounts of auroral precipitation. Type II is related to auroral arcs and enhanced electron temperatures, with no corresponding enhancement in the ion temperature.
24 14
25 15 Chapter 3 Observations The EISCAT IPY common programme used to generate the raw data presented in this text, is among the first programmes to incorporate both the plasma lines and the power density spectrum allowing us to observe the plasma lines in correlation with NEIALs. A major drawback for our studies however, is that the experiment only reaches to 500 km altitude. Given the limited altitude range of the ipy common programme, the periods we can identify as having NEIALs, with a reasonable level of certainty, are few and far between. That does not mean NEIALs do not occur, but, as previous examinations have showed (Strømme, 2004; Knutsen, 2007), NEIALs seen by the EISCAT ESR 42m radar are normally spotted at an altitude of 500 km and above. This does not mean that NEIALs do not occur further down in the ionosphere, but that the ESR radar preferably sees enhancements above this altitude due to its transmitter frequency and the energy of the precipitating particles in the cusp. This requires that whatever mechanism triggers NEIALs, need to be intensive enough to cause enhancements on ESR frequencies below 500 km altitude. Of all the hours of raw data analysed for this thesis, only two days contained data that we could reasonably assume were NEIALs, namely December and January In addition raw data from December are presented, as they show interesting enhancements in the plasma lines, but not the ion acoustic lines. Supplementing these raw data are msp plots, magnetometer data for Svalbard at the times in question and measurements from the ACE satellite on the interplanetary magnetic field (IMF).

26 3.1 December Figure 7: Plot of the analyzed raw data from the ESR 42m radar December
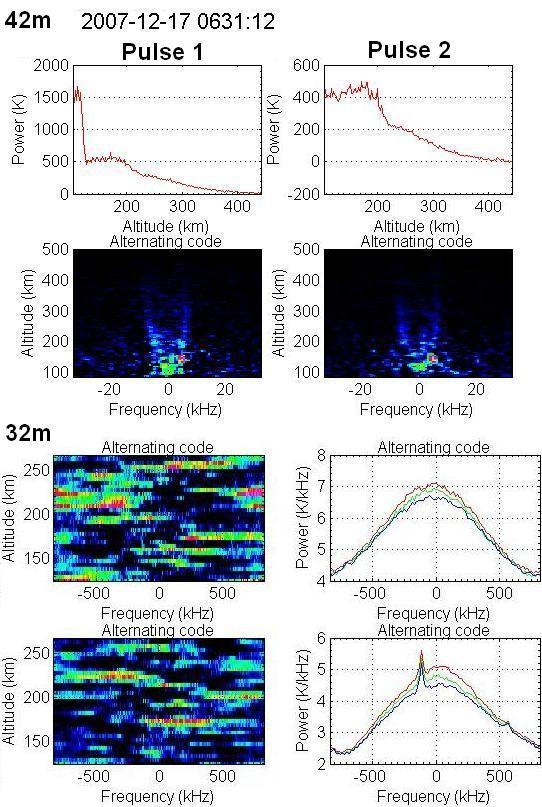
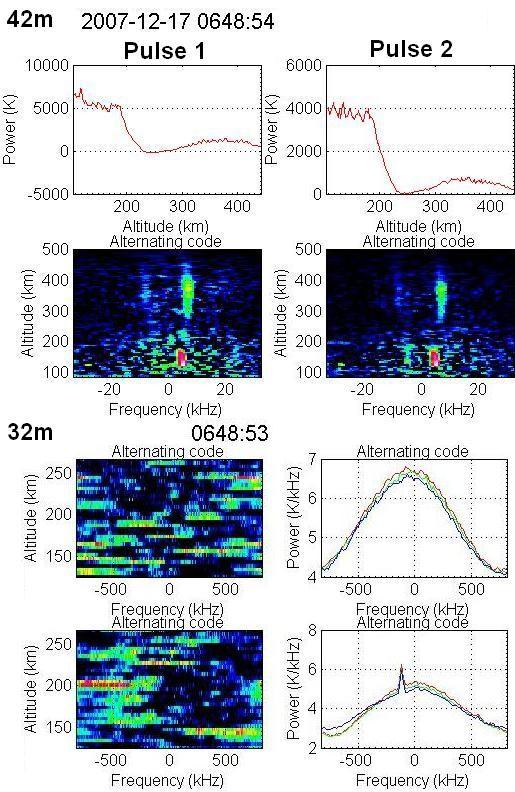
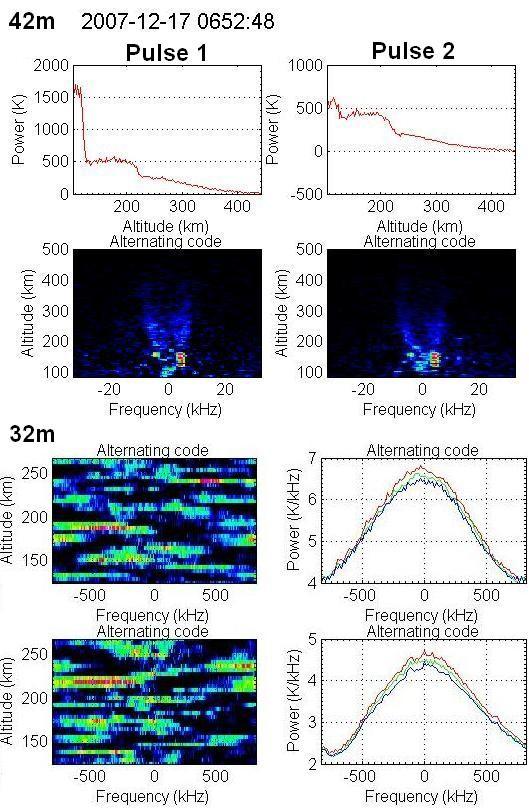
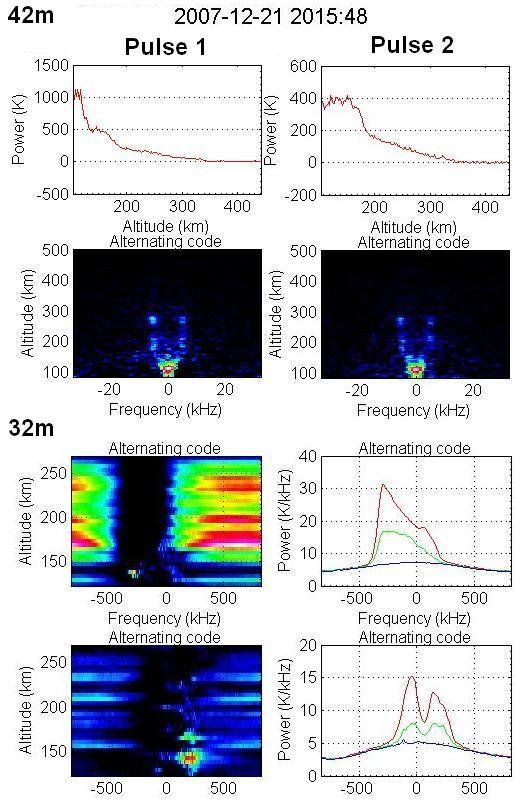
27 17 Figure 7 shows the properties of the ionosphere during December , when we first note NEIALs in the raw data. Presented is the electron density, electron and ion temperature and fieldaligned velocity as a function of altitude and universal time (UT) from top to bottom, respectively. The registered NEIALs occur between 06:30 UT and 07:00 UT and corresponds nicely to the massive event marked as 1 in the figure. Electron densities remain high throughout the early morning, but the electron temperature doesn't really increase until 05:00 UT. It then remains very high for the entirety of our registered events. As already mentioned, the experiment only reaches to 500km altitude. And NEIALs may in fact occur all through the event from about 05:00 UT to 07:00 UT, but at altitudes beyond the reach of the radar. Certainly the conditions for NEIALs to occur, namely an electron temperature about three times greater than the ion temperature (Te>3Ti) as well as above ~3000K, increased electron densities and penetration depth and an increase in ion outflow are all present simultaneously. We also see an increase in electron density and penetration depth between 16:00 UT and 17:00 UT (marked 2), but not nearly as strong an increase in temperatures and ion outflow. It is perhaps not surprising then, that no NEIALs were observed in this period, as not all the conditions required for enhancements to occur were present. Listed below are the actual ion density spectra and plasma line plots from the 42 m and 32 m respectively. The 42 m results are divided into the two pulses of the experiment, each pulse consisting of a density spectra (see figure 5) and a power profile, the latter is a plot showing received power as a function of altitude. During more calm periods the received power from the ionosphere declines as a function of altitude, as one would intuitively expect. However, during NEIAL events, one clearly see an enhancement not only in one or both of the ion acoustic shoulders in the density spectrum, but also in the power profile as can be clearly seen in the following images. The plasma lines are presented as described in section 1.3.
28 18
29 19
30 20
31 21

32 22
33 23
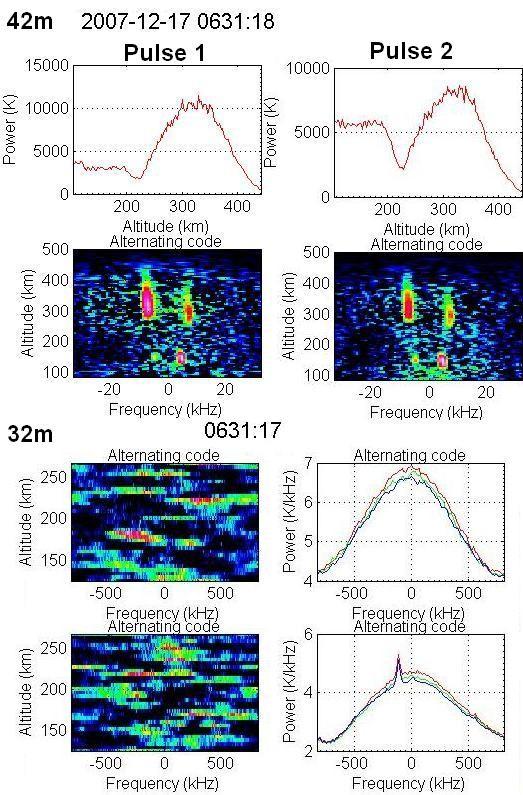
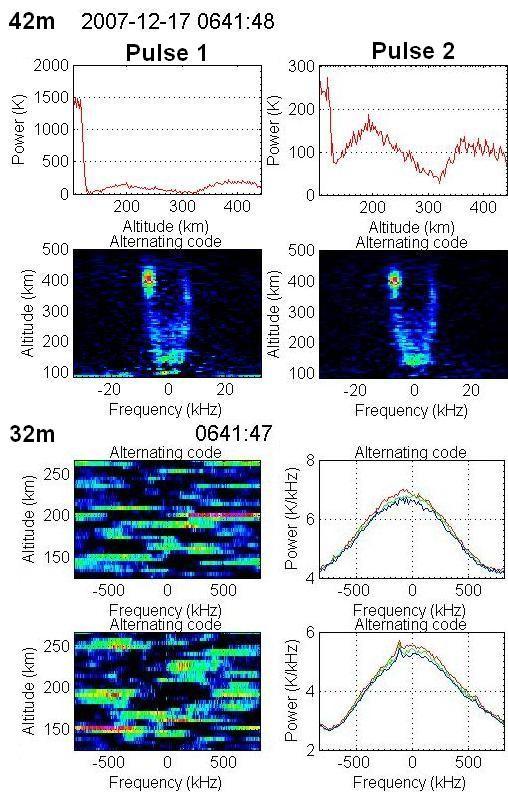
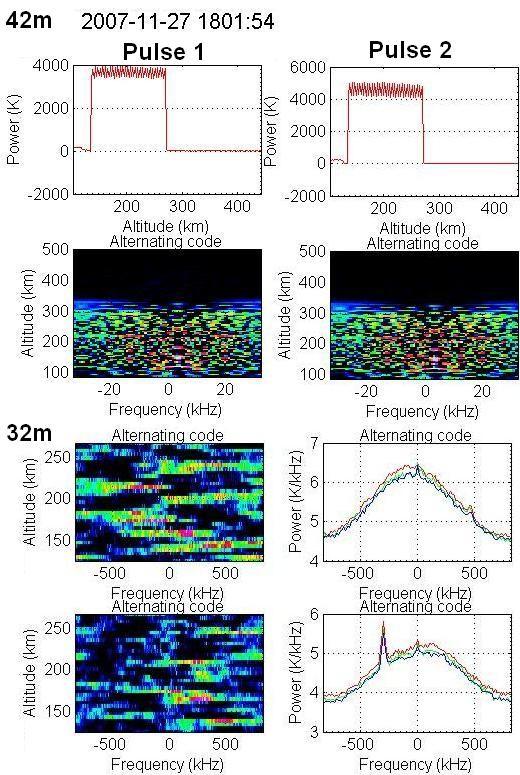
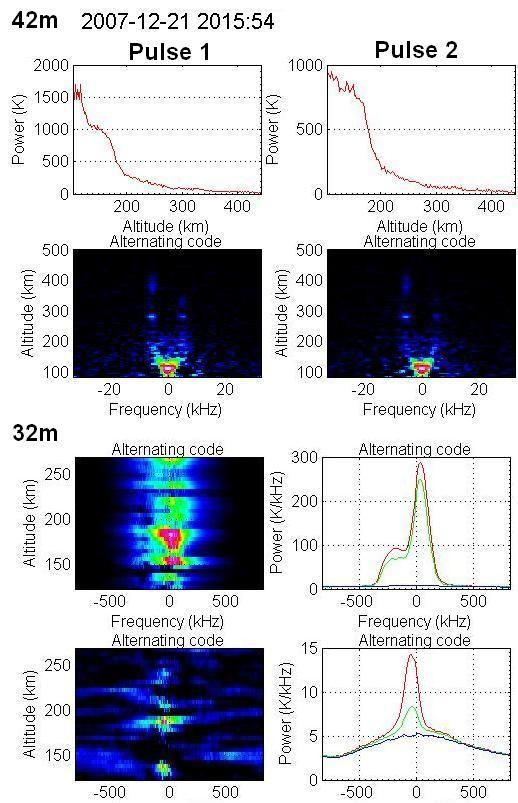
34 24 At 06:31:12 UT a slight blob in the upshifted shoulder can be seen in both pulses from the 42 m ESR radar. The corresponding plasma lines however show only a slight enhancement in the downshifted plasma line. It could be argued that the blobs seen in the raw data are not NEIALs at all, but rather a satellite echo or other objects such as space debris, caught in the beam. An example of how a satellite looks, both in the power profile and density spectrum is presented in the data dump in 18:01:54 UT from November Most satellites are not so clear as this example, but it does provide the basic signatures one look for when determining whether or not an enhancement is caused by natural means or man-made objects. Namely a boxcar shape in the power profile that usually, but not necessarily, gives a massive return signal to the radar from the altitude the object is located. In the density spectrum a satellite can be seen as anything from a great disturbance like the one in our example, to much smaller blobs or NEIAL-like structures. 06:31:18 UT on December clearly show NEIALs above 250 km where the upshifted shoulder is enhanced at a lower altitude than the downshifted one. This is a condition that is quite consistent in instances where both shoulders are enhanced simultaneously. Even when the enhancements are as strong as they are here, the plasma lines barely show any increase in intensity, in fact, the intensification of the plasma lines drop with respect to their levels in the previous dump. The reason for this could be that the timing of the plasma lines and the raw data is slightly off, the 32 m presenting its data a second before the 42m. It could be possible that the plots from the 32m data are done just before the massive event is recorded with the 42m. If such is the case however, the events recorded at 06:31:12 UT are probably not linked. No obvious NEIALs before this dump were visible, but it might be that 06:31:12 UT were the end of one event, and 06:31:18 UT was a brand new one. The observant reader might also note some peculiar enhancements in the same data dump below 250 km, but a closer inspection of the power profile clearly shows a more boxcar like signature that we normally associate with a satellite. However, the raw data seem to contain enhancements in both shoulders, with the downshifted ion line less intense than the upshifted one. This is not characteristic of a spectrum that is corrupted by a satellite, which usually only sees an enhancement in one of the shoulders when they are observed at this intensity level. 06:41:48 UT show much weaker NEIALs that the previous example, although the power profiles might look a little inconclusive. Especially pulse 2 shows a signature that could resemble a more square shape from about 350 km altitude and above, but Pulse 1 is clearly more rounded. This leads to a reasonable conclusion that the enhancement observed in this particular data dump, is in fact
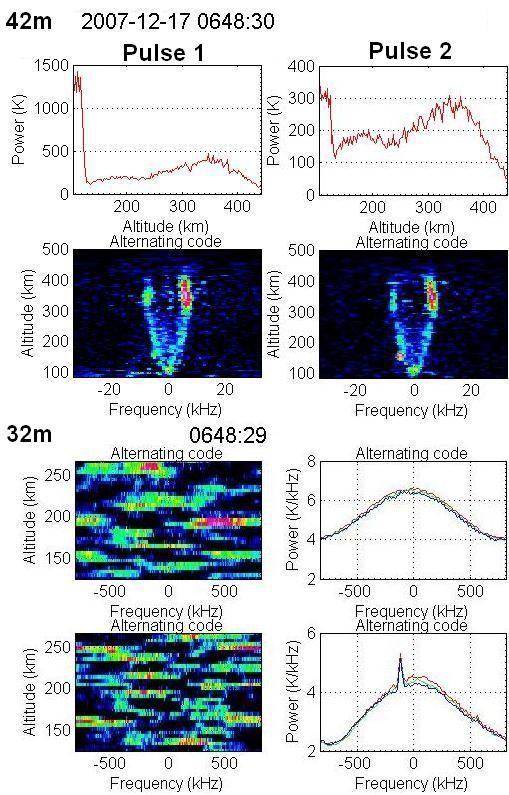
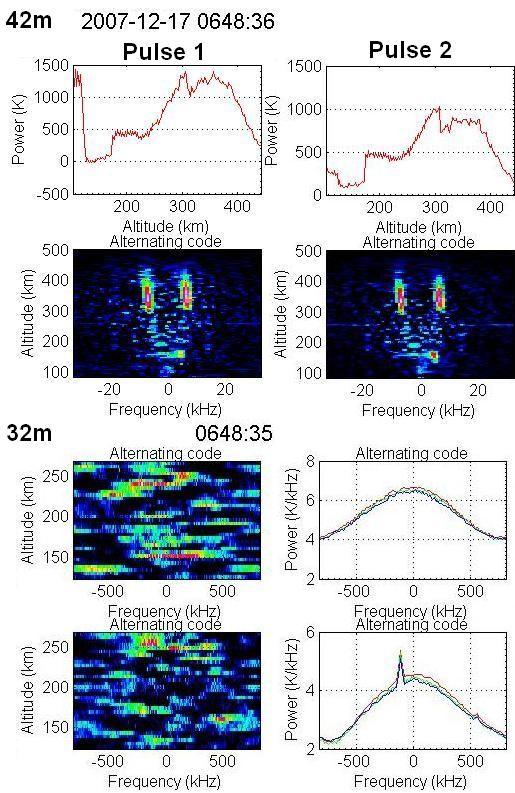
35 25 caused by some natural processes and again, an enhancement in the ion-acoustic spectra give little changes in the plasma lines. This time however, both the 42m and 32m register enhancements at the downshifted part of the spectrum, although the plasma line is barely present. At 06:48:30 UT however, nearly an opposite situation occur. The upshifted ion-acoustic shoulder is enhanced, but the plasma lines still show enhancement in the downshifted side. We can also see what appears to be a slight enhancement as far down as 150 km altitude without the power profiles for either of the two pulses showing any clear sign of satellites. Also, on a closer revisit of these last two dumps one can indeed see a slight bump in the positive frequency range of the lower plasma line plots, about 500 khz from the centre frequency, but it needs to be emphasised that these plots are presented with the upshifted plasma lines and their corresponding integrated power above, and the downshifted line and corresponding integrated power below. So even though these slight bumps are visible, they do in fact not imply an enhancement in the upshifted part of the spectrum. Enhancements of the plasma lines, in both the positive and negative frequency range are interesting, though, any attempt at interpreting their meaning would be purely speculative at this point, so they will not be discussed further. The very next data dump, 06:48:36 UT, shows a clear enhancement in both shoulders, and could be interpreted as a continuation of the NEIAL event we observed in the previous dump. Only this time the second shoulder seems to have been enhanced as well. We also note that the enhancement at 150 km altitude seems to have shifted from the downshifted, to the upshifted part of the spectrum. However, caution is advised in making such assumptions as a close inspection of the power profile in question shows a shape resembling a boxcar at the altitudes of 170km 230km. This could mean that we in fact do not see NEIALs at these low heights here, but the echoes of a satellite. In addition, a square shape also can be seen in the power profile at about 320 km altitude, perhaps most prominent in Pulse 2, but in this case, it could also just be a result of the instabilities in the ionosphere, especially since Pulse 1, although slightly jagged, do in fact resemble a more smooth curve. Whether or not the enhancements at the lower altitudes are in fact just satellites, one can with a reasonable level of security safely claim that we see NEIALs at the greater altitudes in these plots. The plasma lines follow their usual pattern of intensity, with only the downshifted line showing any activity. At 06:48:54 UT, we again see what can be interpreted as a box car shape in the initial altitudes of the power profile, and thus imply that the enhancements observed at these heights are in fact satellites. Above 250 km altitude however, we clearly see an enhancement in the upshifted shoulder.
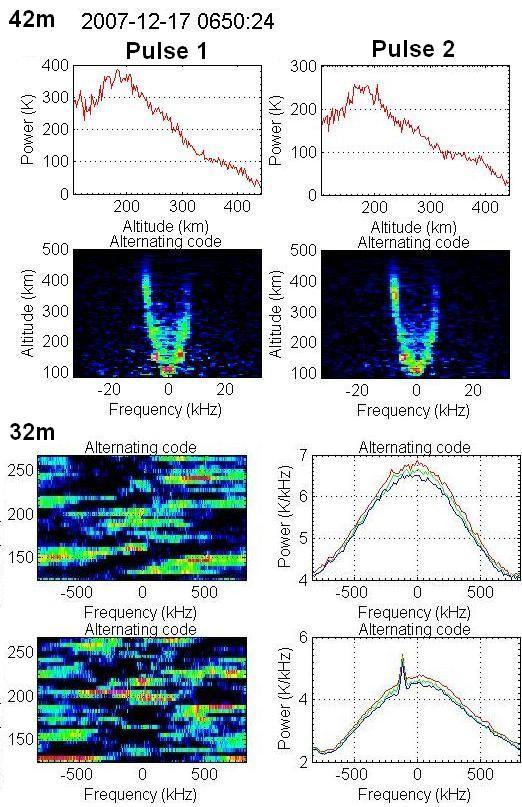
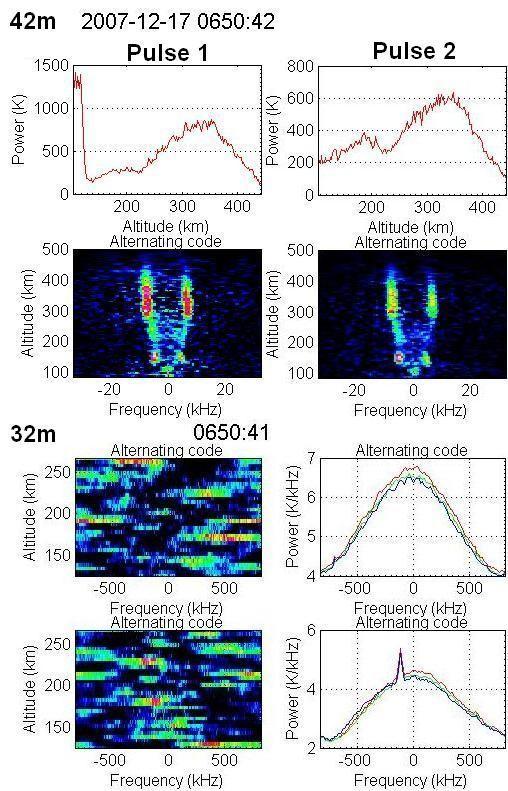
36 26 Although it appears less bright than its previous counterparts at 06:48:30 UT or 06:48:36 UT it might help to keep in mind that these intensifications are plotted in relation to all other intensities, i.e. the strong influence of satellites at lower altitudes disrupts the scaling process. If we observe the peak in the power profile, between 300 km and 400 km altitude, we see that the enhancement gives a returned power yield close to 1000K. This is about the same order of intensification as, for example, the previous case of NEIALs, at 06:48:36 UT. Again, nothing drastic seems to be happening to the plasma lines that have not already been discussed. The steady intensification in the downshifted line seems constant throughout the recorded events. The plots of data from 06:50:24 UT show a slight enhancement in the downshifted shoulder. A closer look at the power profile however shows that the level of enhancement is very low, compared to the other examples. What's interesting however are the slight blobs visible at low altitudes, both in the upshifted and downshifted plots of Pulse 1, and just the downshifted in Pulse 2 with no hint of a box car in the power profile, that certainly hints at the presence of naturally enhancements. However, no such conclusions should be made on account of the low levels shown in the power profile. The plasma line is steadily enhanced in the downshifted line. With respect to the low returned power signal of the previous dump, 06:50:42 UT show a much more interesting event with power levels nearly twice that of the 06:50:24 UT plot. Enhancement in both ion-acoustic shoulders, at roughly the same altitudes and at about the same level of intensity, both higher up in the ionosphere, from about 300 km, and as low as about 150 km altitude. Pulse 1 might show a slight flattening of its profile around 200km, but Pulse 2 does not seem to record anything of that kind. It might just be that the flattening in Pulse 1 is an optical illusion, caused by the massive peaks in the power profile at the beginning of each data dump in this pulse, either way, it is highly probable that the intensifications we see in this dump from 300 km altitude at least, are NEIALs. Whether or not the same conclusions can be made for the two blobs at around 150 km is more uncertain, but not crucial for this thesis. What is more interesting is the fact that the plasma lines show a steady intensification in the downshifted line, also in this dump. The last recorded event on December 17 was seen over two dumps at 06:52:48 UT and 06:52:54 UT. Again we are faced with the possibility of the enhancements observed at the lowest altitudes being nothing more than satellites, as indicated by the power profile. At least the raw data from 06:52:48 UT is probably a result of a foreign object getting inside the beam at the lowest altitudes. This probably also mean that the spectrum enhancements in 06:52:54 UT at the lowest
37 27 heights are a result of a satellite or perhaps even the same satellite as the spectra are quite similar below 300 km. Above this height however, we might see a natural enhancement in the last spectrum taken from this day. Pulse 1 at this time clearly consists of two flattened shapes, while Pulse 2 has a more rounded power profile. If the enhancements recorded at 06.52:54 UT is taken to be NEIALs, this is interesting since the corresponding plasma lines show the enhancement we have seen throughout this event in the downshifted line, while the plasma line from 06:52:48 UT show no enhancement in either of the lines. It is tantalising to draw the conclusion that since we have no NEIALs, the plasma lines show no enhancement either, but we have no way of being certain as to whether or not NEIALs do occur above the range of the radar. Figure 8: Properties of the interplanetary magnetic field (IMF) on December
38 28 As a way to try and explain the cause of these NEIALs, we have also observed the space weather for the time in question. Figure 8 is a plot of the measured interplanetary magnetic field (IMF) as seen by the ACE satellite. Situated in the L1 Lagrangian point, 1.5 x10⁶ km from Earth, it takes about an hour for the observed conditions of the IMF to reach the Earth's magnetosphere where interactions take place. Figure 9: Properties of the IMF delay on December Figure 9 is a more precise estimate of the delay between ACE and Earth and is calculated using the solar wind speed and the distance from L1 to Earth using the very simple formula T = S/V, where T is the delay in minutes, S is the distance and V is the solar wind speed. The delay is then plotted as a function of minutes with respect to the given hour during the day in UT. As we can clearly see in Figure 4, the delay all through the morning of December 17 is somewhere between 66 and 68 minutes. We therefore have to observe the IMF between 05:30 UT and 06:00 UT to find the data in question. The ACE data (figure 8) shows that the BX component of the IMF is small but steadily positive throughout the time interval in question. It dips from about 3nT to about 1nT for close to 15 minutes in the middle of the time period, but this component is not usually taken to be the most important in the complex interactions between the Earth's and the interplanetary magnetic field, so this is probably not too important, of more interest is the BY component. Neubert and Christiansen (2003) states that the field-aligned currents needed for the current driven instability argument to hold, are found throughout the auroral oval, but are most intense in the cusp and pre-noon cusp region. With a BY component that is negative through the entire interval in question, although with very low values, approaching 0 nt at the second half of the interval, it is reasonable to assume that the cusp is situated
 Noon MLT at Svalbard is about 08:50 UT so our NEIAL event can certainly be said to be in the pre-noon cusp region.")
39 29 very close to noon magnetic local time (MLT) or a little earlier, as described in chapter 2.4 (figure 2.5) in Dayside and Polar cap Aurora by Sandholt et. al. (2002) Noon MLT at Svalbard is about 08:50 UT so our NEIAL event can certainly be said to be in the pre-noon cusp region. The fact that BZ remains positive throughout the time in question can be taken in favour of strong field-aligned currents being possible, as Neubert and Christiansen (2003) argues such an alignment of the BZ component favours a concentration of the currents in the cusp region. A negative BZ would imply the currents being distributed over the dayside magnetopause and in the tail. Figure 10 is the magnetometer data taken from Longyearbyen at the time in question. Added here as an example of how the magnetic field, registered at ground level appears over Longyearbyen. Although December 17 seems to be an active day, no clear features can be related to the observed NEIALs. Figure 10: Magnetometer data from Longyearbyen December

40 30 Figure 11: MSP data from Longyearbyen December The MSP data from Longyearbyen from December 17 (figure 11), focuses on the times leading up to 07:00 UT. The image is quite blurred up until the point of ~ 06:15 UT, indicating an overcast sky, but around 06:20 UT the weather seems to clear up showing particle precipitation in both the green (557.7 nm) and red (630.0 nm) lines. The MSP instrument scans the overhead sky from north to south, 900 degrees is taken to be directly above the instrument and Longyearbyen. It should be mentioned that the nm line seems stretched at the expense of the nm green line. It is assumed that the data from the nm line only overwrites the affected green emission lines so that only data from 600 north and above is corrupted, and that the remaining data appear at the correct angels as seen by the instrument. This should mean that we can safely say the MSP data shows very little nm emissions directly above Longyearbyen between 06:30 UT and 07:00 UT. The nm red line emissions however show a massive brightening at around 06:30 UT. At first glance it could seem like
41 31 the MSP instrument has gotten blurred again, indicating less than optimal weather conditions, but then we would expect to see similar effects in the other emission lines, particularly the green nm line. Looking back, the ion density spectra for 06:31:18 UT and the two enhancements we observed at around 150 km altitude and how they might not be an indication of satellites due to the enhancement in both shoulders, could be more thoroughly explained by figure 11. If we observe MSP data from the time in question virtually no green line emissions are seen. The nm green line being an indicator as to how energetic the particle precipitation is, we would expect to see some intensification here as the blobs are enhanced at very low altitudes, usually implying the presence of more energetic particles. The fact that little if any emissions are observed could mean we are in fact seeing satellites in the 06:31:18 UT plot at around 150 km altitude, or if they in fact are NEIALs, it could mean the strong intensification of observed nm red line are able to propagate further down in the ionosphere than what is common.

42 3.2 January Figure 12: Plot of the analyzed raw data from the ESR 42 m radar January
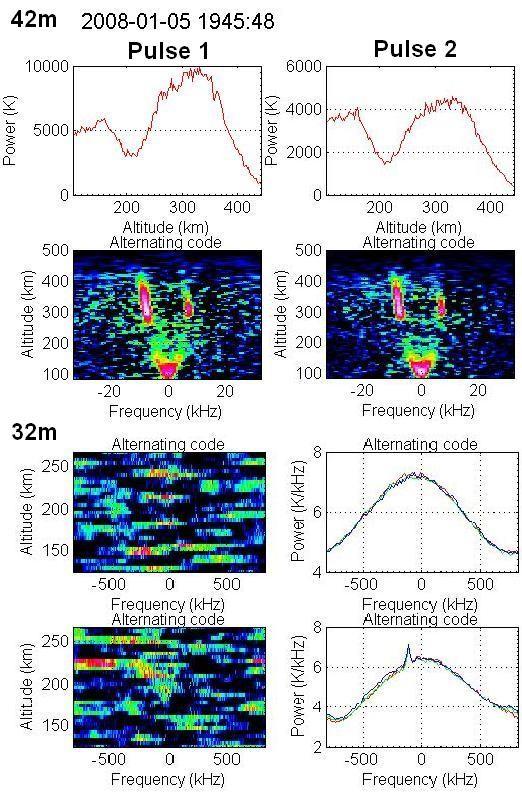
43 33 January contained several periods where the parameters needed for NEIALs were present (see figure 12). Most interesting is perhaps the period between 12:00 UT and 13:00 UT (marked 1 in the figure), which show a greatly increased electron density as well as high electron temperatures and an increased ion outflow. Also the point in time around 17:00 UT (marked 2 in figure 12) show an increase in electron temperature, and although the electron densities are not as intense as the previous period, this could also be a period of enhancements in the ion acoustic lines. Just before 20:00 UT (marked 3) we once again note a sharp increase in the electron densities as well as the greatest penetration depths recorded that day. We also see a sharp increase in electron temperatures, but not nearly as strong as the first incident we observed. A slight increase in ion outflow can also be deduced. Then finally, between 23:00 UT and 24:00 UT we register what seems to be the last time of interest this day (marked 4). A large increase in electron densities and penetration depth, although the electron temperature does not seem to be enhanced nearly as much as previous periods and an increase in the ion outflow also seems absent. Going through the raw data from these times of interest only yields one clear occurrence of NEIALs, namely one data dump at 19:45:48 UT, corresponding to the event marked 3 in figure 12. Again, whether or not NEIALs occur above the radar cut off region will only be purely speculative. Surely all the conditions for NEIALs are present during much more of the day than this one particular time, but we have no way of determine any such occurrences.
44 34
45 35 At 19:45:48 UT both of the ion acoustic lines are clearly enhanced, although the downshifted one is the most intensive. One could make the argument that the power profile subtly hints at a slightly square shape below 200 km altitude, but we see no indications of a foreign object in the density spectrum and that NEIALs are present from around 300 km and above seems certain. As we showed with the plasma lines on December , it yet again is the downshifted plasma line that is enhanced. Figure 13: Properties of the IMF delay on January Figure 13 shows that it takes the solar wind takes about 40 minutes to propagate from the ACE satellite to the Earth at the time of our recorded NEIAL. Observing the IMF components around 19:08 UT shows that the BX is about 7 nt, BY is about -5 nt and BZ is small, close to 0 nt, but negative (figure 14). The magnetometer data seems a bit more conclusive (Figure 15). Clearly changes in the Earth's magnetosphere take place at the same time as we observe an increase in the electron density and penetration depth (Figure 12 marked 3), indicating the onset of a substorm that we normally associate with auroral precipitation.

46 Figure 14: Properties of the interplanetary magnetic field (IMF) on January Figure 15: Magnetometer data from Longyearbyen January

47 37 If we concentrate on the findings of Neubert and Christiansen (2003) again, field-aligned currents on the night side is shown to occur. However, they state that these currents are distributed throughout the auroral oval, but primarily around the cusp and pre-midnight sector. Even though our observed NEIAL can certainly be said to occur in the pre-midnight sector, the night-time auroral oval lies primarily over northern Scandinavia, not Svalbard where our observations are made. The MSP images from January 5 however, does seem to indicate auroral precipitation during the time in question, indicating that the auroral oval covers Svalbard at this particular time (Figure 16). Both red and green line emissions are present although they can be said to be somewhat blurred. Clear structures can still be seen both before and after the event though, so it is reasonable to assume the weather conditions at the time consists of a clear night sky. Figure 16: MSP data from Longyearbyen January

48 3.3 December Figure 17: Plot of the analyzed raw data from the ESR 42 m radar December
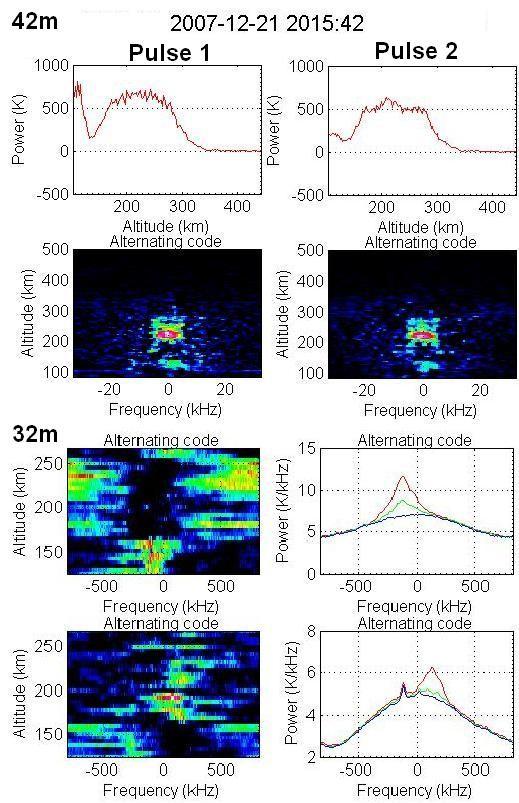
49 39 Several times during December showed potential for having NEIALs (marked 1, 2 and 3 in figure 17). The electron densities seems quite strong, penetrating far down into the ionosphere from about 18:30 UT to past 21:00 UT, with a short gap around 19:00 UT to 19:30 UT. Even though the electron temperatures stays low throughout the day, a slight increase in the ion outflow can be detected about 19:00 UT and at about 20:30 UT (marked 1 and 2). For this reason, the raw data covering these times of interest was checked, and although the search yielded no NEIALs, it did in fact yield something very interesting for this thesis, as the following spectra will show. Three consecutive data dumps are included, covering 20:15:42 UT, 20:15:48 UT and 20:15:54 UT.
50 40
51 41
52 42 The spectra show no NEIALs, at least not below 500 km altitude. A strong intensification between 200 km and 300 km altitude can be observed at 20:15:42 UT, but this enhancement seems quite evenly distributed, implying that the ion acoustic spectrum is quite symmetrical. The same argument can be made for both 20:15:48 UT and 20:15:54 UT although these plots show thin arcs shooting up through the ionosphere, they appear to be symmetrical. An enhancement in both lines simultaneously is of coarse a possibility, and perhaps strong NEIALs occur above 500 km, it is impossible to say, but what is possible to deduce is that both the upshifted and downshifted plasma line experience a massive simultaneous enhancement in all three dumps. Figure 18: Properties of the IMF delay on December
53 43 Figure 19: Properties of the interplanetary magnetic field (IMF) on December Taking the IMF delay of about 37 minutes into account (figure 18), the properties of the IMF spatial components can be deduced as follows (figure 19): BX about -7 nt, BY about 3 nt and BZ is small, but negative, approaching 0 nt from below. Again the IMF shows no drastic changes at the time in question, nor are any drastic changes present just before the event takes place and thus not yielding anything conclusive as to what can cause the strong enhancements in the plasma lines that we see. The magnetometer data however (figure 20) show a very active period. The H component makes a clear turn into negative ranges at a time that correlates with our observed spectra. The MSP plots for December 21 are shown in figure 21. Fine arcs of auroral precipitation in both the red and green line above Longyearbyen around 20:15 UT is surely present. The red line precipitations seem weaker than in the previous examples, however, this does not provide adequate explanation as to why we do not see any NEIALs in the 42 m data. NEIALs could in fact occur at higher latitudes than 500 km, we simply have no way of knowing for sure.


54 Figure 20: Magnetometer data from Longyearbyen December Figure 21: MSP data from Longyearbyen December
AGF-216. The Earth s Ionosphere & Radars on Svalbard
 AGF-216 The Earth s Ionosphere & Radars on Svalbard Katie Herlingshaw 07/02/2018 1 Overview Radar basics what, how, where, why? How do we use radars on Svalbard? What is EISCAT and what does it measure?
EISCAT Experiments. Anders Tjulin EISCAT Scientific Association 2nd March 2017
 EISCAT Experiments Anders Tjulin EISCAT Scientific Association 2nd March 2017 Contents 1 Introduction 3 2 Overview 3 2.1 The radar systems.......................... 3 2.2 Antenna scan patterns........................
Study of small scale plasma irregularities. Đorđe Stevanović
 Study of small scale plasma irregularities in the ionosphere Đorđe Stevanović Overview 1. Global Navigation Satellite Systems 2. Space weather 3. Ionosphere and its effects 4. Case study a. Instruments
The Effects of Pulsed Ionospheric Flows on EMIC Wave Behaviour
 The Effects of Pulsed Ionospheric Flows on EMIC Wave Behaviour S. C. Gane (1), D. M. Wright (1), T. Raita (2), ((1), (2) Sodankylä Geophysical Observatory) Continuous ULF Pulsations (Pc) Frequency band
Using the Radio Spectrum to Understand Space Weather
 Using the Radio Spectrum to Understand Space Weather Ray Greenwald Virginia Tech Topics to be Covered What is Space Weather? Origins and impacts Analogies with terrestrial weather Monitoring Space Weather
The EISCAT Heating Facility
 The EISCAT Heating Facility Michael Rietveld EISCAT Tromsø, Norway EISCAT radar school, 30 Aug-4 Sept, 2010, Sodankylä 1 Outline Description of the hardware Antenna beams Practical details- power levels
Beam-plasma interactions and Langmuir turbulence in the auroral ionosphere
 Boston University OpenBU Theses & Dissertations http://open.bu.edu Boston University Theses & Dissertations 2015 Beam-plasma interactions and Langmuir turbulence in the auroral ionosphere Akbari, Hassanali
Coupling between the ionosphere and the magnetosphere
 Chapter 6 Coupling between the ionosphere and the magnetosphere It s fair to say that the ionosphere of the Earth at all latitudes is affected by the magnetosphere and the space weather (whose origin is
Radar interferometric imaging for the EISCAT Svalbard Radar
 Radar interferometric imaging for the EISCAT Svalbard Radar Tom Grydeland 1,2 Jorge L. Chau 3 César La Hoz 1 1 Department of Physics, University of Tromsø 2 Currently at the University Centre on Svalbard
Enhanced incoherent scatter plasma lines
 Ann. Geophysicae 14, 1462 1472 (1996) EGS Springer-Verlag 1996 Enhanced incoherent scatter plasma lines H. Nilsson, S. Kirkwood, J. Lilensten, M. Galand Swedish Institute of Space Physics, Box 812, S-981
Measurements of doppler shifts during recent auroral backscatter events.
 Measurements of doppler shifts during recent auroral backscatter events. Graham Kimbell, G3TCT, 13 June 2003 Many amateurs have noticed that signals reflected from an aurora are doppler-shifted, and that
Existing and future networks of ionospheric radars in polar regions &
 Existing and future networks of ionospheric radars in polar regions & EoI#159:ISPAM EISCAT Scientific Association Existing networks SuperDarn Middle atmosphere radars Incoherent Scatter Radars SuperDARN
First Results from the 2014 Coordinated Measurements Campaign with HAARP and CASSIOPE/ePOP
 First Results from the 2014 Coordinated Measurements Campaign with HAARP and CASSIOPE/ePOP Carl L. Siefring, Paul A. Bernhardt, Stanley J. Briczinski, and Michael McCarrick Naval Research Laboratory Matthew
EISCAT_3D The next generation European Incoherent Scatter radar system Introduction and Brief Background
 EISCAT_3D The next generation European Incoherent Scatter radar system Introduction and Brief Background The high latitude environment is of increasing importance, not only for purely scientific studies,
Radio-induced incoherent scatter ion line enhancements with wide altitude extents in the high-latitude ionosphere
 GEOPHYSICAL RESEARCH LETTERS, VOL. 4, 6, doi:.2/grl.5272, 23 Radio-induced incoherent scatter ion line enhancements with wide altitude extents in the high-latitude ionosphere A. Senior, M. T. Rietveld,
The Earth s Atmosphere
 ESS 7 Lectures 15 and 16 May 5 and 7, 2010 The Atmosphere and Ionosphere The Earth s Atmosphere The Earth s upper atmosphere is important for groundbased and satellite radio communication and navigation.
ESS 7 Lectures 15 and 16 November 3 and 5, The Atmosphere and Ionosphere
 ESS 7 Lectures 15 and 16 November 3 and 5, 2008 The Atmosphere and Ionosphere The Earth s Atmosphere The Earth s upper atmosphere is important for groundbased and satellite radio communication and navigation.
Scientific Studies of the High-Latitude Ionosphere with the Ionosphere Dynamics and ElectroDynamics - Data Assimilation (IDED-DA) Model
 Model") DISTRIBUTION STATEMENT A. Approved for public release; distribution is unlimited. Scientific Studies of the High-Latitude Ionosphere with the Ionosphere Dynamics and ElectroDynamics - Data Assimilation
DISTRIBUTION STATEMENT A. Approved for public release; distribution is unlimited. Scientific Studies of the High-Latitude Ionosphere with the Ionosphere Dynamics and ElectroDynamics - Data Assimilation
Radar Reprinted from "Waves in Motion", McGourty and Rideout, RET 2005
 Radar Reprinted from "Waves in Motion", McGourty and Rideout, RET 2005 What is Radar? RADAR (Radio Detection And Ranging) is a way to detect and study far off targets by transmitting a radio pulse in the
Ionospheric Propagation
 Ionospheric Propagation Page 1 Ionospheric Propagation The ionosphere exists between about 90 and 1000 km above the earth s surface. Radiation from the sun ionizes atoms and molecules here, liberating
4/18/2012. Supplement T3. 3 Exam Questions, 3 Groups. Amateur Radio Technician Class
 Amateur Radio Technician Class Element 2 Course Presentation ti ELEMENT 2 SUB-ELEMENTS Technician Licensing Class Supplement T3 Radio Wave Characteristics 3 Exam Questions, 3 Groups T1 - FCC Rules, descriptions
The Ionosphere and Thermosphere: a Geospace Perspective
 The Ionosphere and Thermosphere: a Geospace Perspective John Foster, MIT Haystack Observatory CEDAR Student Workshop June 24, 2018 North America Introduction My Geospace Background (Who is the Lecturer?
Modification of the high latitude ionosphere F region by X-mode powerful HF radio waves: Experimental results from multiinstrument
 Modification of the high latitude ionosphere F region by X-mode powerful HF radio waves: Experimental results from multiinstrument diagnostics N. F. Blagoveshchenskaya 1, T. D. Borisova 1, T. K. Yeoman
SPACE WEATHER SIGNATURES ON VLF RADIO WAVES RECORDED IN BELGRADE
 Publ. Astron. Obs. Belgrade No. 80 (2006), 191-195 Contributed paper SPACE WEATHER SIGNATURES ON VLF RADIO WAVES RECORDED IN BELGRADE DESANKA ŠULIĆ1, VLADIMIR ČADEŽ2, DAVORKA GRUBOR 3 and VIDA ŽIGMAN4
SHEDDING NEW LIGHT ON SOLITARY WAVES OBSERVED IN SPACE
 University of Iowa SHEDDING NEW LIGHT ON SOLITARY WAVES OBSERVED IN SPACE J. S. Pickett, L.-J. Chen, D. A. Gurnett, J. M. Swanner, O. SantolRk P. M. E. Décréau, C. BJghin, D. Sundkvist, B. Lefebvre, M.
CHAPTER 1 INTRODUCTION
 CHAPTER 1 INTRODUCTION The dependence of society to technology increased in recent years as the technology has enhanced. increased. Moreover, in addition to technology, the dependence of society to nature
1. Terrestrial propagation
 Rec. ITU-R P.844-1 1 RECOMMENDATION ITU-R P.844-1 * IONOSPHERIC FACTORS AFFECTING FREQUENCY SHARING IN THE VHF AND UHF BANDS (30 MHz-3 GHz) (Question ITU-R 218/3) (1992-1994) Rec. ITU-R PI.844-1 The ITU
HF RADIO PROPAGATION AT HIGH LATITUDES: OBSERVATIONS AND PREDICTIONS FOR QUIET AND DISTURBED CONDITIONS
 HF RADIO PROPAGATION AT HIGH LATITUDES: OBSERVATIONS AND PREDICTIONS FOR QUIET AND DISTURBED CONDITIONS Bjorn Jacobsen and Vivianne Jodalen Norwegian Defence Research Establishment (FFI) P.O. Box 25, N-2027
J. Geomag. Geoelectr., 41, , 1989
 J. Geomag. Geoelectr., 41, 1025-1042, 1989 1026 T. OBARA and H. OYA However, detailed study on the spread F phenomena in the polar cap ionosphere has been deferred until very recently because of the lack
Technician License Course Chapter 4
 Technician License Course Chapter 4 Propagation, Basic Antennas, Feed lines & SWR K0NK 26 Jan 18 The Antenna System Antenna: Facilitates the sending of your signal to some distant station. Feed line: Connects
Space weather: A research grand challenge. Professor Jøran Moen (GCI-Cusp project scientist)
") Space weather: A research grand challenge Professor Jøran Moen (GCI-Cusp project scientist) Birkeland Space Weather Symposium 15 JUNE 2017 Outline: Space weather phenomena in cusp Research Grand Challenges
Space weather: A research grand challenge Professor Jøran Moen (GCI-Cusp project scientist) Birkeland Space Weather Symposium 15 JUNE 2017 Outline: Space weather phenomena in cusp Research Grand Challenges
Plasma in the Ionosphere Ionization and Recombination
 Plasma in the Ionosphere Ionization and Recombination Agabi E Oshiorenoya July, 2004 Space Physics 5P Umeå Universitet Department of Physics Umeå, Sweden Contents 1 Introduction 6 2 Ionization and Recombination
The Effect of Geomagnetic Storm in the Ionosphere using N-h Profiles.
 The Effect of Geomagnetic Storm in the Ionosphere using N-h Profiles. J.C. Morka * ; D.N. Nwachuku; and D.A. Ogwu. Physics Department, College of Education, Agbor, Nigeria E-mail: johnmorka84@gmail.com
SuperDARN (Super Dual Auroral Radar Network)
") SuperDARN (Super Dual Auroral Radar Network) What is it? How does it work? Judy Stephenson Sanae HF radar data manager, UKZN Ionospheric radars Incoherent Scatter radars AMISR Arecibo Observatory Sondrestrom
SuperDARN (Super Dual Auroral Radar Network) What is it? How does it work? Judy Stephenson Sanae HF radar data manager, UKZN Ionospheric radars Incoherent Scatter radars AMISR Arecibo Observatory Sondrestrom
MST radar observations of meteor showers and trail induced irregularities in the ionospheric E region
 Indian Journal of Radio & Space Physics Vol. 39, June 2010, pp. 138-143 MST radar observations of meteor showers and trail induced irregularities in the ionospheric E region N Rakesh Chandra 1,$,*, G Yellaiah
Magnetosphere Ionosphere Coupling and Substorms
 Chapter 10 Magnetosphere Ionosphere Coupling and Substorms 10.1 Magnetosphere-Ionosphere Coupling 10.1.1 Currents and Convection in the Ionosphere The coupling between the magnetosphere and the ionosphere
Dartmouth College SuperDARN Radars
 Dartmouth College SuperDARN Radars Under the guidance of Thayer School professor Simon Shepherd, a pair of backscatter radars were constructed in the desert of central Oregon over the Summer and Fall of
Ionospheric Hot Spot at High Latitudes
 DigitalCommons@USU All Physics Faculty Publications Physics 1982 Ionospheric Hot Spot at High Latitudes Robert W. Schunk Jan Josef Sojka Follow this and additional works at: https://digitalcommons.usu.edu/physics_facpub
Plasma in the ionosphere Ionization and Recombination
 Plasma in the ionosphere Ionization and Recombination Jamil Muhammad Supervisor: Professor kjell Rönnmark 1 Contents: 1. Introduction 3 1.1 History.3 1.2 What is the ionosphere?...4 2. Ionization and recombination.5
Regional ionospheric disturbances during magnetic storms. John Foster
 Regional ionospheric disturbances during magnetic storms John Foster Regional Ionospheric Disturbances John Foster MIT Haystack Observatory Regional Disturbances Meso-Scale (1000s km) Storm Enhanced Density
Chapter 6 Propagation
 Chapter 6 Propagation Al Penney VO1NO Objectives To become familiar with: Classification of waves wrt propagation; Factors that affect radio wave propagation; and Propagation characteristics of Amateur
New applications of the portable heater. Gennady Milikh, UMD-SPP group
 New applications of the portable heater Gennady Milikh, UMD-SPP group 1 Stabilization of equatorial spread F (ESF) by ion injection 2 ESF characterizes spreading in the height of F-region backscatter return
Microwave Remote Sensing
 Provide copy on a CD of the UCAR multi-media tutorial to all in class. Assign Ch-7 and Ch-9 (for two weeks) as reading material for this class. HW#4 (Due in two weeks) Problems 1,2,3 and 4 (Chapter 7)
Sw earth Dw Direct wave GRw Ground reflected wave Sw Surface wave
 WAVE PROPAGATION By Marcel H. De Canck, ON5AU Electromagnetic radio waves can propagate in three different ways between the transmitter and the receiver. 1- Ground waves 2- Troposphere waves 3- Sky waves
How the ionosphere of Mars works
 How the ionosphere of Mars works This hazy region contains the atmosphere and ionosphere of Mars Paul Withers Boston University (withers@bu.edu) Department Lecture Series, EAPS, MIT Wednesday 2012.02.08
Space Weather and Propagation JANUARY 14, 2017
 Space Weather and Propagation MARTIN BUEHRING -KB4MG ELEC T R ICAL ENGINEER, A M AT EUR EXTRA CLASS LICENSE HOLDER JANUARY 14, 2017 Why know about Space Weather? Our SUN has an enormous affect not only
Experiment 12: Microwaves
 MASSACHUSETTS INSTITUTE OF TECHNOLOGY Department of Physics 8.02 Spring 2005 OBJECTIVES Experiment 12: Microwaves To observe the polarization and angular dependence of radiation from a microwave generator
Broad Principles of Propagation 4C4
 Broad Principles of Propagation ledoyle@tcd.ie 4C4 Starting at the start All wireless systems use spectrum, radiowaves, electromagnetic waves to function It is the fundamental and basic ingredient of
Global Maps with Contoured Ionosphere Properties Some F-Layer Anomalies Revealed By Marcel H. De Canck, ON5AU. E Layer Critical Frequencies Maps
 Global Maps with Contoured Ionosphere Properties Some F-Layer Anomalies Revealed By Marcel H. De Canck, ON5AU In this column, I shall handle some possibilities given by PROPLAB-PRO to have information
Modelling the Ionosphere
 The recent long period of solar inactivity was spectacularly terminated by a series of X-ray flares during January 2010. One of these, an M-class, produced an intense Sudden Ionospheric Disturbance (SID)
Reading 28 PROPAGATION THE IONOSPHERE
 Reading 28 Ron Bertrand VK2DQ http://www.radioelectronicschool.com PROPAGATION THE IONOSPHERE The ionosphere is a region of the upper atmosphere extending from a height of about 60 km to greater than 500
RECOMMENDATION ITU-R P Prediction of sky-wave field strength at frequencies between about 150 and khz
 Rec. ITU-R P.1147-2 1 RECOMMENDATION ITU-R P.1147-2 Prediction of sky-wave field strength at frequencies between about 150 and 1 700 khz (Question ITU-R 225/3) (1995-1999-2003) The ITU Radiocommunication
A Study of the Effects of Sunrise and Sunset on the Ionosphere as Observed by VLF Wave Behavior
 A Study of the Effects of Sunrise and Sunset on the Ionosphere as Observed by VLF Wave Behavior By Leandra Merola South Side High School Rockville Centre, New York Abstract The purpose of this study was
The dayside ultraviolet aurora and convection responses to a southward turning of the interplanetary magnetic field
 Annales Geophysicae (2001) 19: 707 721 c European Geophysical Society 2001 Annales Geophysicae The dayside ultraviolet aurora and convection responses to a southward turning of the interplanetary magnetic
DYNAMIC POSITIONING CONFERENCE October 17 18, 2000 SENSORS. Space Weather and the Ionosphere. Grant Marshall Trimble Navigation Inc.
 DYNAMIC POSIIONING CONFERENCE October 17 18, 2000 SENSORS Space Weather and the Ionosphere Grant Marshall rimble Navigation Inc. Images shown here are part of an animated presentation and may not appear
HF AURORAL BACKSCATTER FROM THE E AND F REGIONS
 HF AURORAL BACKSCATTER FROM THE E AND F REGIONS A THESIS SUBMITTED TO THE COLLEGE OF GRADUATE STUDIES AND RESEARCH IN PARTIAL FULFILLMENT OF THE REQUIREMENTS FOR THE DEGREE OF DOCTOR OF PHILOSOPHY IN THE
Comparing the Low-- and Mid Latitude Ionosphere and Electrodynamics of TIE-GCM and the Coupled GIP TIE-GCM
 Comparing the Low-- and Mid Latitude Ionosphere and Electrodynamics of TIE-GCM and the Coupled GIP TIE-GCM Clarah Lelei Bryn Mawr College Mentors: Dr. Astrid Maute, Dr. Art Richmond and Dr. George Millward
SODAR- sonic detecting and ranging
 Active Remote Sensing of the PBL Immersed vs. remote sensors Active vs. passive sensors RADAR- radio detection and ranging WSR-88D TDWR wind profiler SODAR- sonic detecting and ranging minisodar RASS RADAR
[titlelscientific Studies of the High-Latitude Ionosphere with the Ionosphere Dynamics and Electrodynamics-Data Assimilation (IDED-DA) Model
 Model") [titlelscientific Studies of the High-Latitude Ionosphere with the Ionosphere Dynamics and Electrodynamics-Data Assimilation (IDED-DA) Model [awardnumberl]n00014-13-l-0267 [awardnumber2] [awardnumbermore]
[titlelscientific Studies of the High-Latitude Ionosphere with the Ionosphere Dynamics and Electrodynamics-Data Assimilation (IDED-DA) Model [awardnumberl]n00014-13-l-0267 [awardnumber2] [awardnumbermore]
The Cassini Radio and Plasma Wave Science Instrument
 The Cassini Radio and Plasma Wave Science Instrument Roger Karlsson Space Research Institute of the Austrian Academy of Sciences, Graz Graz in Space, September 7, 2006 The Cassini Radio and Plasma Wave
Currents, Electrojets and Instabilities. John D Sahr Electrical Engineering University of Washington 19 June 2016
 Currents, Electrojets and Instabilities John D Sahr Electrical Engineering University of Washington 19 June 2016 Outline The two main sources of large scale currents in the ionosphere: solar-wind/magnetosphere,
ATS 351 Lecture 9 Radar
 ATS 351 Lecture 9 Radar Radio Waves Electromagnetic Waves Consist of an electric field and a magnetic field Polarization: describes the orientation of the electric field. 1 Remote Sensing Passive vs Active
Ionospheric Propagation
 Ionospheric Nick Massey VA7NRM 1 Electromagnetic Spectrum Radio Waves are a form of Electromagnetic Radiation Visible Light is also a form of Electromagnetic Radiation Radio Waves behave a lot like light
RADIO WAVE PROPAGATION
 CHAPTER 2 RADIO WAVE PROPAGATION Radio direction finding (RDF) deals with the direction of arrival of radio waves. Therefore, it is necessary to understand the basic principles involved in the propagation
IONOSPHERIC SIGNATURES OF SEISMIC EVENTS AS OBSERVED BY THE DEMETER SATELLITE
 IONOSPHERIC SIGNATURES OF SEISMIC EVENTS AS OBSERVED BY THE DEMETER SATELLITE M. Parrot and F. Lefeuvre LPC2E/CNRS, 3 A Av Recherche Scientifique 45071 Orleans cedex 2 France lefeuvre@cnrs-orleans.fr URSI
Results of Ionospheric Heating Experiments Involving an Enhancement in Electron Density in the High Latitude Ionosphere
 Results of Ionospheric Heating Experiments Involving an Enhancement in Electron Density in the High Latitude Ionosphere WU Jun ( ) 1,2, WU Jian ( ) 1,2, XU Zhengwen ( ) 1,2 1 Key Lab for Electromagnetic
Storms in Earth s ionosphere
 Storms in Earth s ionosphere Archana Bhattacharyya Indian Institute of Geomagnetism IISF 2017, WSE Conclave; Anna University, Chennai Earth s Ionosphere Ionosphere is the region of the atmosphere in which
NON-TYPICAL SERIES OF QUASI-PERIODIC VLF EMISSIONS
 NON-TYPICAL SERIES OF QUASI-PERIODIC VLF EMISSIONS J. Manninen 1, N. Kleimenova 2, O. Kozyreva 2 1 Sodankylä Geophysical Observatory, Finland, e-mail: jyrki.manninen@sgo.fi; 2 Institute of Physics of the
Ionospheric Absorption
 Ionospheric Absorption Prepared by Forrest Foust Stanford University, Stanford, CA IHY Workshop on Advancing VLF through the Global AWESOME Network VLF Injection Into the Magnetosphere Earth-based VLF
CRITICAL FREQUENCY By Marcel H. De Canck, ON5AU
 CRITICAL FREQUENCY By Marcel H. De Canck, ON5AU Before reading onward, it would be good to refresh your knowledge about refraction rules in the section on Refraction of the earlier "Wave Propagation Direction
IONOSPHERE AND ATMOSPHERE RESEARCH WITH RADARS
 IONOSPHERE AND ATMOSPHERE RESEARCH WITH RADARS Jürgen Röttger, Max-Planck-Institut, Lindau, Germany published in UNESCO Encyclopedia of Life Support Systems (EOLSS), Geophysics and Geochemistry, 6.16.5.3,
Heart of the black auroras revealed by Cluster
 News 09-April-2015 13:46:46 Heart of the black auroras revealed by Cluster 09 April 2015 Most people have heard of auroras - more commonly known as the Northern and Southern Lights - but, except on rare
Special Thanks: M. Magoun, M. Moldwin, E. Zesta, C. Valladares, and AMBER, SCINDA, & C/NOFS teams
 Longitudinal Variability of Equatorial Electrodynamics E. Yizengaw 1, J. Retterer 1, B. Carter 1, K. Groves 1, and R. Caton 2 1 Institute for Scientific Research, Boston College 2 AFRL, Kirtland AFB, NM,
4/29/2012. General Class Element 3 Course Presentation. Radio Wave Propagation. Radio Wave Propagation. Radio Wave Propagation.
 General Class Element 3 Course Presentation ti ELEMENT 3 SUB ELEMENTS General Licensing Class Subelement G3 3 Exam Questions, 3 Groups G1 Commission s Rules G2 Operating Procedures G3 G4 Amateur Radio
VI. Signal Propagation Effects. Image courtesy of
 VI. Signal Propagation Effects Image courtesy of www.tpub.com 56 VI. Signal Propagation Effects Name Date Class At Home Assignment Tune to the most remote AM station you can find. You should attempt to
Rec. ITU-R F RECOMMENDATION ITU-R F *
 Rec. ITU-R F.162-3 1 RECOMMENDATION ITU-R F.162-3 * Rec. ITU-R F.162-3 USE OF DIRECTIONAL TRANSMITTING ANTENNAS IN THE FIXED SERVICE OPERATING IN BANDS BELOW ABOUT 30 MHz (Question 150/9) (1953-1956-1966-1970-1992)
ESA Contract 13945/99 Technical management by R. Jehn, ESOC. September 1, 2000
 MEASUREMENTS OF SMALL-SIZE DEBRIS WITH BACKSCATTER OF RADIO WAVES WP 1: Definition ofa Concept to Detect Small Size Debris Huuskonen A., Lehtinen M., and Markkanen J. Sodankylä Geophysical Observatory,
A generic description of planetary aurora
 A generic description of planetary aurora J. De Keyser, R. Maggiolo, and L. Maes Belgian Institute for Space Aeronomy, Brussels, Belgium Johan.DeKeyser@aeronomie.be Context We consider a rotating planetary
Satellite Navigation Science and Technology for Africa. 23 March - 9 April, Scintillation Impacts on GPS
 2025-29 Satellite Navigation Science and Technology for Africa 23 March - 9 April, 2009 Scintillation Impacts on GPS Groves Keith Air Force Research Lab. Hanscom MA 01731 U.S.A. Scintillation Impacts on
ATMOSPHERIC NUCLEAR EFFECTS
 EC3630 Radiowave Propagation ATMOSPHERIC NUCLEAR EFFECTS by Professor David Jenn (version 1.1) 1 Atmospheric Nuclear Effects (1) The effect of a nuclear blast on the atmosphere is a complicated function
Ionosphere- Thermosphere
 Ionosphere- Thermosphere Jan J Sojka Center for Atmospheric and Space Sciences Utah State University, Logan, Utah 84322 PART I: Local I/T processes (relevance for Homework Assignments) PART II: Terrestrial
New Synergistic Opportunities for Magnetosphere-Ionosphere-Thermosphere Coupling Investigations Using Swarm and CASSIOPE e-pop
 New Synergistic Opportunities for Magnetosphere-Ionosphere-Thermosphere Coupling Investigations Using Swarm and CASSIOPE e-pop Andrew W. Yau 1, R. Floberghagen 2, Leroy L. Cogger 1, Eelco N. Doornbos 3,
Jøran Moen University of Oslo Also at The University Centre in Svalbard
 The ICI series of Space Weather Rockets Jøran Moen University of Oslo Also at The University Centre in Svalbard GPS ERROR SOURCES Courtesy of Alfonsi IONOSPHERIC EFFECTS ON GPS SIGNALS L-band scintillations
Aurora - acceleration processes
 Aurora - acceleration processes S. L. G. Hess LATMOS IPSL/CNRS, Université Versailles St Quentin, France M. Kivelson's talk : Plasma moves in the magnetosphere. M. Galand's talk : This generates currents
Modeling and Subionospheric VLF perturbations caused by direct and indirect effects of lightning
 Modeling and Subionospheric VLF perturbations caused by direct and indirect effects of lightning Prepared by Benjamin Cotts Stanford University, Stanford, CA IHY Workshop on Advancing VLF through the Global
The USU-GAIM Data Assimilation Models for Ionospheric Specifications and Forecasts
 The USU-GAIM Data Assimilation Models for Ionospheric Specifications and Forecasts L. Scherliess, R. W. Schunk, L. C. Gardner, L. Zhu, J.V. Eccles and J.J Sojka Center for Atmospheric and Space Sciences
Width and brightness of auroral arcs driven by inertial Alfven waves
 JOURNAL OF GEOPHYSICAL RESEARCH, VOL. 108, NO. A2, 1091, doi:10.1029/2001ja007537, 2003 Width and brightness of auroral arcs driven by inertial Alfven waves C. C. Chaston, 1 L. M. Peticolas, 1 J. W. Bonnell,
 *CUP/T28411* ADVANCED SUBSIDIARY GCE 2861 PHYSICS B (ADVANCING PHYSICS) Understanding Processes FRIDAY 11 JANUARY 2008 Candidates answer on the question paper. Additional materials: Data, Formulae and
A COMPARISON OF ELECTRODE ARRAYS IN IP SURVEYING
 A COMPARISON OF ELECTRODE ARRAYS IN IP SURVEYING John S. Sumner Professor of Geophysics Laboratory of Geophysics and College of Mines University of Arizona Tucson, Arizona This paper is to be presented
An acousto-electromagnetic sensor for locating land mines
 An acousto-electromagnetic sensor for locating land mines Waymond R. Scott, Jr. a, Chistoph Schroeder a and James S. Martin b a School of Electrical and Computer Engineering b School of Mechanical Engineering
Study of the Ionosphere Irregularities Caused by Space Weather Activity on the Base of GNSS Measurements
 Study of the Ionosphere Irregularities Caused by Space Weather Activity on the Base of GNSS Measurements Iu. Cherniak 1, I. Zakharenkova 1,2, A. Krankowski 1 1 Space Radio Research Center,, University
Mapping ionospheric backscatter measured by the SuperDARN HF radars Part 1: A new empirical virtual height model
 Ann. Geophys., 26, 823 84, 2008 European Geosciences Union 2008 Annales Geophysicae Mapping ionospheric backscatter measured by the SuperDARN HF radars Part : A new empirical virtual height model G. Chisham,
General Classs Chapter 7
 General Classs Chapter 7 Radio Wave Propagation Bob KA9BHD Eric K9VIC Learning Objectives Teach you enough to get all the propagation questions right during the VE Session Learn a few things from you about
Variability in the response time of the high-latitude ionosphere to IMF and solar-wind variations
 Variability in the response time of the high-latitude ionosphere to IMF and solar-wind variations Murray L. Parkinson 1, Mike Pinnock 2, and Peter L. Dyson 1 (1) Department of Physics, La Trobe University,
Introduction To The Ionosphere
 Introduction To The Ionosphere John Bosco Habarulema Radar School 12 13 September 2015, SANSA, What is a radar? This being a radar school... RAdio Detection And Ranging To determine the range, R, R=Ct/2,
High Frequency Propagation (and a little about NVIS)
") High Frequency Propagation (and a little about NVIS) Tom McDermott, N5EG August 18, 2010 September 2, 2010 Updated: February 7, 2013 The problem Radio waves, like light waves, travel in ~straight lines.
High Frequency Propagation (and a little about NVIS) Tom McDermott, N5EG August 18, 2010 September 2, 2010 Updated: February 7, 2013 The problem Radio waves, like light waves, travel in ~straight lines.
SNIPE mission for Space Weather Research. CubeSat Developers Workshop 2017 Jaejin Lee (KASI)
") SNIPE mission for Space Weather Research CubeSat Developers Workshop 2017 Jaejin Lee (KASI) New Challenge with Nanosatellites In observing small-scale plasma structures, single satellite inherently suffers
SNIPE mission for Space Weather Research CubeSat Developers Workshop 2017 Jaejin Lee (KASI) New Challenge with Nanosatellites In observing small-scale plasma structures, single satellite inherently suffers
Plasma Turbulence of Non-Specular Trail Plasmas as Measured by a High Power Large Aperture Radar
 Space Environment and Satellite Systems Plasma Turbulence of Non-Specular Trail Plasmas as Measured by a High Power Large Aperture Radar Jonathan Yee and Sigrid Close Stanford University January 9, 2013
Chapter 7 HF Propagation. Ionosphere Solar Effects Scatter and NVIS
 Chapter 7 HF Propagation Ionosphere Solar Effects Scatter and NVIS Ionosphere and Layers Radio Waves Bent by the Ionosphere Daily variation of Ionosphere Layers Ionospheric Reflection Conduction by electrons
ionospheric satellite cluster scientific premises and proposed configuration
 ionospheric satellite cluster scientific premises and proposed configuration O. Fedorov, Institute of Space Research, Kyiv, Ukraine V. Korepanov, Lviv Centre of Institute of Space Research, Lviv, Ukraine