Vehicle Level Evaluation of Loop Detectors and the Remote Traffic Microwave Sensor
|
|
|
- Baldric Summers
- 6 years ago
- Views:
Transcription
1 TE/24/2328 Vehicle Level Evaluation of Loop Detectors and the Remote Traffic Microwave Sensor Benjamin, PhD Assistant Professor, Civil and Environmental Engineering and Geodetic Science Assistant Professor, Electrical and Computer Engineering Ohio State University 47 Hitchcock Hall 27 Neil Ave Columbus, OH (note, as of October 25, my rank will become associate professor in both departments)
2 TE/24/2328 ABSTRACT Traffic detectors support most traffic management applications, so it is important that a detector performs as expected. This study evaluates the performance of four loop sensor models and the Remote Traffic Microwave Sensor (RTMS), adding to the body of sensor performance knowledge through the use of new analytical techniques. The study collected contact closure data from all five of the detectors and concurrent video data. Each loop sensor was deployed following Caltrans guidelines for at least 24 hours across dual loop detectors in each lane of I-8, north of Oakland, CA. The research examined various distributions of the individual vehicle actuations from each of the detectors. This exercise found some of the loop sensors locked up and did not provide any data to the controller although they appeared fully functional from the front panel. The sensitivity appears to vary between the RTMS and the loop sensors, as well as from one loop sensor model to the next, which means the occupancy measurements will also change. Detailed analysis of the sensors used the video to manually validate each vehicle passage over extended periods, preselected at random, with the errors classified by type (e.g., non-detected vehicle) and source (e.g., due to a lane change maneuver). As presented herein, the RTMS exhibited problems due to occlusion and reflections, while two of the loop sensors exhibited non-negligible problems. Finally, the methodology used in this paper can easily be extended to validate other detectors and detection technologies. Subject Headings: Traffic Surveillance, Sensors, Evaluation, Traffic Management, Highways
3 TE/24/2328 INTRODUCTION Traffic detectors provide data to most traffic-responsive management applications. The data from a traffic detector need to be sufficiently accurate since any errors will propagate to decision-making and control actions. The detector cost should be balanced with the benefit it provides since it is impossible to eliminate all errors. But the cost function and performance varies from one detector to the next, so it is important that a detector performs as expected. To this end, there have been numerous studies comparing aggregate data from one detector against concurrent measurements from another detector (e.g., a loop detector versus an emerging detector technology) or manual validation, e.g., [1-4]. These studies typically average flow, occupancy and/or speed over fixed periods ranging between 3 sec and 15 min. The long sample periods greatly simplify calibration and comparison between concurrent measurements, but they also allow errors of omission to cancel errors of commission, e.g., within a given sample missed vehicle can cancel vehicles that are counted more than once. To address these problems, other studies have compared individual vehicle actuations at one detector against concurrent measurements from another detector, e.g., [5-6]. These studies examined concurrent measurements from two identical detectors, so any discrepancy would be indicative of a problem in that model. Based on these comparisons it was shown that there is a large variation from manufacturer to manufacturer in the performance of loop detector sensor units, the electronics that drive the loop detector. So the physical loop in the pavement will yield different results depending on which sensor unit is driving it. But those studies may not catch an error if both detectors exhibit it, e.g., if both detectors systematically "drop out" in the middle of semi-trailer trucks, and the tests cannot be used alone to compare concurrent measurements of different 1
4 TE/24/2328 detector models since questions would arise about which detector made an error whenever a discrepancy occurs. The present study sets out evaluate the performance of four loop sensor models and the Remote Traffic Microwave Sensor (RTMS) manufactured by Electronic Integrated Systems (EIS) [7-8] to facilitate comparison between the different detectors while addressing many of the shortcomings of the earlier studies. The loop sensors included the conventional Peek GP6 [9] and Reno A&E [1] Model 222 detectors, as well as the reportedly higher performance 3M [11] and IST [12] Model 222 detectors. Working in the Berkeley Highway Laboratory (BHL) [13], the study collected contact closure data from all five of the detectors, recording the state at 6 Hz, using controller software developed by Caltrans and previously deployed in [13-14]. Each loop sensor was deployed for at least 24 hours across dual loop detectors in each lane on I- 8, north of Oakland, CA, at the two detector stations shown in Figure 1A-B. Except for switching the sensor units, all of the other hardware remained unchanged throughout the data collection. The sensors were installed following Caltrans guidelines and care was taken to ensure that the operating frequency of adjacent sensors differed. Beyond verifying that the indicator lights flashed in correspondence to vehicle passages (replicating what a technician would do in the field), no further fine-tuning was conducted. (Note that the two stations were previously equipped with Peek sensors that had been meticulously calibrated using the tools presented in [5-6], these calibrated sensors were removed for the study of the loop sensors and the Peek GP6 sensors analyzed in this study were installed new out of the box they were shipped in from the manufacturer). The two stations are approximately 64 m apart, station 8 covers six eastbound lanes and station 7 covers five lanes in each direction. Both stations are visible from the rooftop of the 3 story Pacific Park Plaza building and approximately two hours of 2
5 TE/24/2328 concurrent video was collected from this vantage point for each sensor, spanning free flow and congested traffic conditions (in fact Figure 1A-B are frames from this video). Visible on the right hand side of Figure 1B is a closed circuit television (CCTV) camera on a 12 m pole. This camera was used to monitor lanes 1-4 eastbound in a close up view, as shown in Figure 1C, during the same periods the stations were filmed from the rooftop. The RTMS unit was mounted lower on the CCTV pole in late 1999 in accordance with the manufacturer's specifications and was operational throughout the entire data collection effort. The RTMS was hardwired to the controller input file. To ensure optimal RTMS performance, representatives of EIS aligned and calibrated the unit. They noted that the lack of median shoulders will degrade operation in the inside lane due to echoes off the concrete barrier. Since many urban freeways do not have median shoulders the results for lane 1 should be representative of these locations and the results are included for completeness. According to the EIS representatives, the RTMS delays the end of each pulse in the contact closure output by a fixed.15 sec to prevent erroneous dropouts. This delay was not subtracted from the measurements. The remainder of this paper examines the performance of each of the detectors, closing with a discussion and conclusions. ANALYSIS This section begins by examining various distributions of the individual vehicle actuations from each of the detectors over 24 hours. Next, the video was digitized and correlated with the detector data for manual validation of each vehicle passage during randomly sampled periods. As Figures 1C-D show, both the downstream loop detectors and the RTMS detection zone were 3
6 TE/24/2328 visible in the CCTV view. Although space constraints prevent the presentation, the detector data were also aggregated and used to evaluate the performance of each sensor under standard operation (see [15] for details). Distribution of Individual Vehicle Actuations When a vehicle enters the detection zone the detector turns on, and similarly when the vehicle leaves the detector turns off. The on-time of this pulse is simply duration that the detector is on for a given vehicle. At the microscopic scale, on_time = effective vehicle length velocity (1) where the effective vehicle length is the sum of the physical length of the vehicle and the length of the detection zone. On-time is related to occupancy via the following equation, on_times during sample occupancy = 1% (2) sample period As noted in [6], during free flow periods most vehicles will be traveling at roughly the same speed and thus, Equation 1 shows that the distribution of on-times should roughly be proportional to the distribution of effective vehicle lengths. Figures 2A-E show the cumulative distribution function (CDF) of the on-times from the four loop sensors (only data from the downstream loop is shown) and RTMS during free flow conditions between noon and midnight on the indicated day in the eastbound lanes at Station 7. To reduce the impact of transient errors, a moving median of 21 consecutive individual vehicle speeds was taken and the center vehicle is considered free flowing if the median is over 72 km/h. Note that two lanes do not have data for the 3M sensor due to the sensors locking up in these lanes and not providing any data. This error 4
7 TE/24/2328 should be easily fixed by adjusting the sensitivity levels on the sensor units, but the error was not identified until after the data collection effort, nonetheless, its occurrence is indicative of another detector error. A similar error occurred with the Peek sensors at two of the downstream loops at Station 8. In both cases, the front panel of the sensor did not show any indication of a fault. These plots show that for a given sensor, the median on-time is similar across all five lanes, except for the RTMS in lane 5, which differed significantly from the other lanes. However, the median on-time changes from one sensor to the next. The median on-time for the RTMS is almost twice as large as some of the loop sensors, indicating a significantly larger detection zone, which is consistent with the on-time extension provided by the RTMS in the contact closure data in absence of EIS Interface Cards. Similarly, the median on-time for IST is larger than the other loop sensors, presumably related to the sensitivity of the different sensors. Note that all five plots of on-time CDF have a vertical line at 11/6 sec for reference. This threshold was chosen because most passenger cars have an effective length of at least 6m and traveled at speeds below 12 km/h at this location. Any on-time below this threshold would either be indicative of a detection error (e.g., detecting a vehicle that is actually in another lane, so called splash-over) or vehicles with pair-wise effective length and speed that fall within the shaded region of Figure 2F, e.g., motorcycles. Figure 2G compares the number of samples below 11/6 sec across all lanes for each of the sensors. The trends are consistent with the median on-time, e.g., the 3M and RTMS curves exhibit virtually the largest difference between any two curves even though the data were collected concurrently at the same station on the same day. This process was repeated at Station 8 for both the upstream and downstream loops, as shown in [15]. Here, all four of the sensors exhibited significantly larger number of on-times below 11/6 sec, with IST climbing to about 1% and Reno climbing to 5% below the threshold. 5
8 TE/24/2328 Interestingly, both Peek and Reno exhibited a lower median on-time at Station 8 while IST and 3M median on-times were similar at the two stations. Of the four sensors, the IST exhibits the greatest similarity between the on-time distributions for the eastbound lanes at the two stations. The fact that the center of the on-time distribution changes from one sensor to the next means that occupancy measurement will also change across the sensors via Equation 2. The nature of this occupancy shift was not investigated in the present study, though as shown with the changes between the two stations, it is likely to include site-specific parameters. So rather than attempting to find a correction factor for a given sensor, it may prove more efficient to devise a calibration for occupancy based applications that can be applied individually to each detector station. Now consider the fact that most vehicles should actuate both loops in a dual loop detector, so an actuation at one detector should uniquely match an actuation at the other, whenever such a unique match does not exist either one loop failed to detect a vehicle, the other loop made a spurious detection, or a vehicle may have been changing lanes over the dual loop. Explicitly tallying how many unmatched pulses are observed at each dual loop for each sensor over the 19 hr long period between 14: and 9: the next day provides an indication of the sensors consistency. In this case, if N pulses are observed at one loop for a single pulse at the other loop it is tallied as N-1 unmatched pulses for the first loop. A lane change maneuvers over the dual loop is not an error and could result in an unmatched pulse, but such maneuvers are infrequent except in heavy weaving locations and in fact most vehicles that change lanes over a dual loop should still be detected by both of the loops given the close spacing between the loops. The test sites are not heavy weaving locations, and in any event, one would assume the number of lane change maneuvers to be similar across days, allowing for relative comparison between the 6
9 TE/24/2328 sensors. Figure 3 shows the percentage of pulses that were unmatched in each lane, at each station, both upstream and downstream loops, for each loop sensor unit. Each lane shown in this plot had over 1, vehicles during the observation period, with most lanes having between 2, and 3, vehicles. No results are reported for the lane if one of the loops in the dual loop did not provide data. IST exhibited the best performance on this test, followed by 3M. Peek and Reno exhibited poor performance in some of the lanes and good performance in others, which is consistent with our earlier efforts that were successful in manually fine-tune the performance of Peek sensors using [5-6]. Following the procedures of [5-6], during free flow conditions the vehicles move too fast for acceleration to cause a significant change in speed over the 6.1 m spanning the paired loops. Thus, via Equation 1, after matching pulses the on-times from both loops should be almost identical. Once more a moving median of 21 consecutive individual vehicle speeds was taken and the center vehicle is considered free flowing if the median is over 72 km/h. For each of these free flowing vehicles the difference between the on-times within the dual loop is calculated. Allowing an error of two sample periods, Figure 4 shows the percentage of all such on-time differences that are greater than 2/6 sec during the free flow periods in the data used for Figure 3. In fact the trends are similar in both figures, which would suggest that the source of the unmatched pulses is related to the bad on-time differences. For reference, see [15] for scatter plots of the on-times and distributions of the on-time differences. Manual Validation As noted previously, it is important that a detector performs as expected, the ideal detector should always turn on/off whenever a vehicle enters/exits the detection zone and only change states at these times. Practical detectors should approach the ideal, but fall within some level of 7
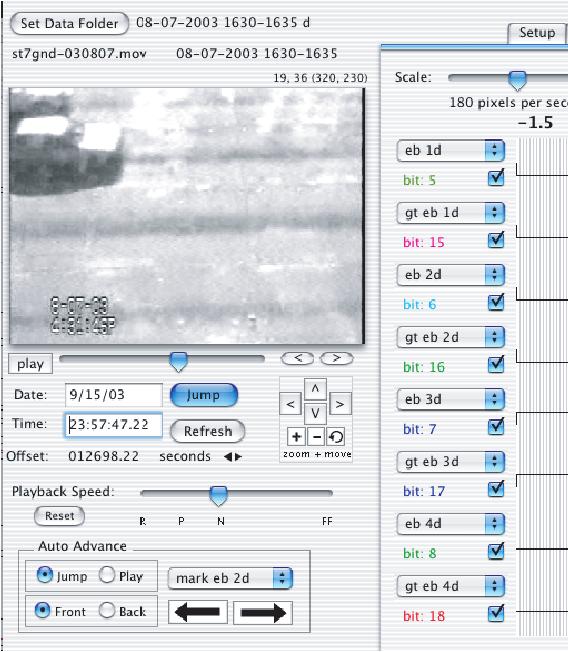
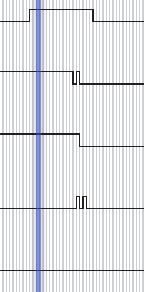
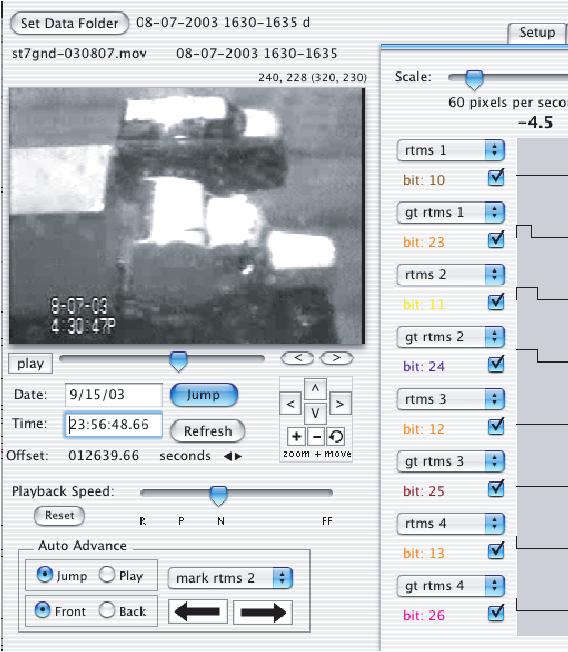
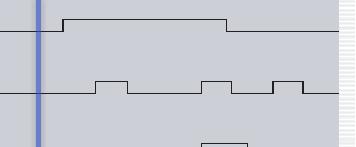
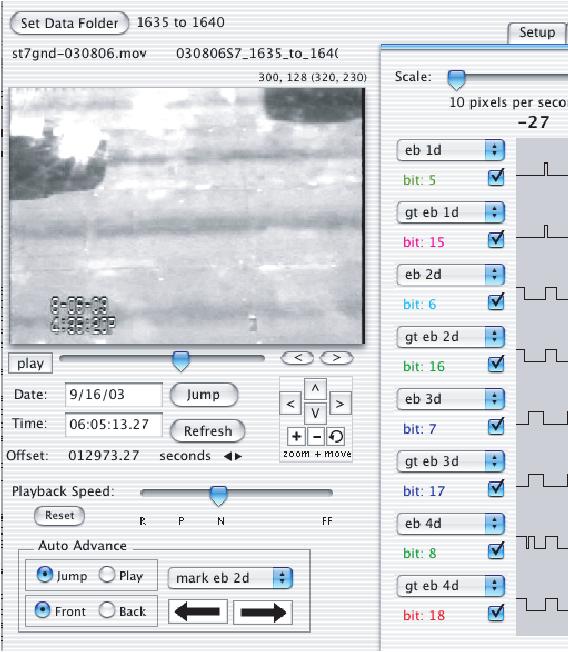
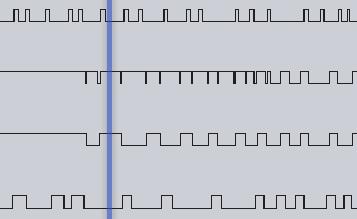
10 TE/24/2328 tolerance that may vary from application to application. To aid decision makers, this section quantifies just how close to ideal each of the detectors came in the study. Lanes 1-4 at Station 7 are used for this analysis because of the ease of precisely determining the timing of detection events from the CCTV view (Figure 1C) while also having the secondary view of the far lanes from the rooftop view (Figure 1B) whenever a truck occludes the CCTV. Three non-overlapping pairs of five minute long windows were selected for each sensor (one free flow and one congested within each pair), for a total of 3 min per sensor (including RTMS). Three students were assigned the task of synchronizing the video to detector data and generating ground truth vehicle passages, each processing a different pair of windows for each sensor, thereby reducing the chance that individual biases may influence the final results. The students were simply told that the loop detector data on different days came from different sensors and were not given any further background about the loop sensors. Out of necessity, they were told about the RTMS detection zone being slightly downstream of the loop detectors and when processing the pair of five minute windows for the RTMS they generated a separate set of ground truth data for it. The students used Videosync, a software package being developed by Caltrans Division of Research and Innovation, as the primary tool for this data reduction effort, allowing the direct comparison between concurrent detector and video data [16]. Figure 5 shows two screen shots from Videosync, in each, the upper left hand corner shows the current video frame, with navigation controls below. In the mode shown, the right hand side shows the time series of the traffic state on up to eight channels, where a channel may correspond to raw detector data or ground truth data (another mode, not shown in this paper, allows for manually inputting the ground truth data as vehicles enter and leave the detection zones). The center of the time series, 8
11 TE/24/2328 highlighted with a dark vertical line, corresponds to the instant of the video frame. In Figure 5A, the channels labeled "eb 1d" through "eb 4d" correspond respectively to the data recorded from the downstream loop detectors in lanes 1-4, respectively, while the channels prefaced with "gt" contain the manually generated ground truth for the same lanes. The downstream loops are on the left hand side of the video image (Figure 1C) and in Figure 5A one car is about halfway across the loop in lane 2 while another car has just entered the loop in lane 1, as evident by the pulses in the first four rows on the right side of the figure. The loops in the other two lanes are empty and time series show them as being off at this instant. Comparing the raw data to the ground truth, the two time series would be identical for an ideal sensor, but three errors are evident in Figure 5A: the loop in lane two flickers off for one sample as a vehicle leaves (Label i). Secondly, the loop in lane 3 twice erroneously flickers on for a single sample period (Label ii) concurrent with the error in lane 2. Similarly, Figure 5B shows a sample from the RTMS, once more the numeral in the channel name denotes the lane number, now however, the raw data is prefaced "RTMS" and the RTMS ground truth is prefaced "gt RTMS". Note that the time scale, indicated by "graph width" above the time series plot, is larger than the previous example. Several errors are apparent in the example. First, Label i highlights a splash-over, where a vehicle from an adjacent lane is also counted in lane 2. Label ii is concurrent with the video frame shown, the semi-trailer in lane 4 occludes a pickup truck in lane 2. Later, while the semi-trailer is still in front of the sensor a phantom vehicle is detected in lane 1, Label iii, while three vehicles eventually pass in that lane during and after this actuation. Another phantom vehicle is detected in lane 3, Label iv, also presumably due to the semi-trailer, which the RTMS briefly drops, Label v. Another phantom vehicle is later detected in lane 3, Label vi. 9
12 TE/24/2328 A Matlab program was written to quantify the differences between the raw and ground truth data across all three students. As a first step, Figure 6A shows the percentage of actuations that overlapped ground truth pulses, summed across all three students, the remaining actuations being clearly over-counting errors by the given detector. An actuation is counted even if it overlaps a ground truth pulse by a single sample period of 1/6 sec. For reference, Table 1 tallies the total number of actuations included in this figure. Figure 6B shows the percentage of ground truth pulses that overlapped one or more actuations, with the remaining ground truth pulses being clearly under-counting errors by the given detector. Ideally there should be a one-to-one match between the ground truth and raw data, so Figure 6C shows the percentage of ground truth pulses that overlapped exactly one actuation ([15] shows the results broken down by individual student). Since the intent of this research is to evaluate the performance of operational detectors, these results exclude the fact that one out of the four 3M sensors did not report any data, i.e., the vehicles from that lane are not included in the ground truth for 3M. Figure 6 shows that the RTMS has the worst performance of the five sensors, followed by Reno, note that the overcounting errors roughly balance the under-counting errors for these two sensors. Figure 7 compares the on-times reported by the sensor against the ground truth. If multiple actuations intersect a ground truth pulse, to address the possibility of the sensor dropping out in the middle of a vehicle, the sum of the actuation on-times is used in the comparison. Figure 7A shows the bias between the on-times reported by the sensors and the ground truth on-times. All of the sensors had a bias under 1/6 sec. Figure 7B shows the average absolute on-time error across the ground truth pulses. Each loop sensor was under 1/6 sec while the RTMS had an average absolute error over 7/6 sec. Figure 7C shows the percentage of pulses that had an ontime error. All of the loop sensors were under 1%, with 3M being the best at about 2%, while 1
13 TE/24/2328 the RTMS was around 4%. Even with the aid of Videosync, the accuracy of the ground truth on-times is limited, after completing the data reduction the students were questioned about their technique. When the actuation appeared to be within 2/6 sec of being correct they tended to use the times recorded by the detector, so in general, the on-time comparisons show results that are slightly better than reality. Further code was written in Matlab to mark the following differences in an unused channel of the Videosync file: too few actuations for a ground truth pulse, too many actuations for a ground truth pulse, and an on-time difference greater than 3/6 sec. The author then used Videosync to review the data to manually classify the nature of each discrepancy from each student's data and the original video. Table 1 shows the net results summed across all three students for the 12 lane-minutes reduced for each sensor and the total number of vehicles observed broken down into three length classes (as measured by the loop detectors). Many of the errors were due to lane change maneuvers over the detection zone. These errors are further broken down into over-counting non-flicker (e.g., splash-over from a vehicle in another lane), over-counting flicker (e.g., the detector turns off and back on while a vehicle is traversing it), short on-time, and under-count if the vehicle is not detected at all. IST and Peek tended to detect vehicles changing lanes in both lanes, while the Reno and 3M sensors tended to underestimate the on-time of vehicles changing lanes in one lane while not detecting them in the second. The lane change maneuver problem seems to be a trade off between over and under counting, based on sensitivity. In each case, the number of such errors are noted on the table and their percent (relative to the total number of vehicles) is low in all cases. Ideally these errors should be addressed, but it does not look like it would be a major problem unless the loops are in a heavy weaving section. 11
14 TE/24/2328 Except for the RTMS, all remaining errors are listed under Other Errors. In the case of the RTMS, as evident in Figure 5B, many errors appear to be due to occlusion and these are reported separately in Table 2, while Table 1 includes only those errors that are not clearly attributable to occlusion or reflections by other vehicles. In reviewing the data, it was clear that there was significantly higher variance in the on-times from the RTMS (both systematic lane to lane and seemingly random from vehicle to vehicle), consistent with the results already presented in Figures 2 and 7. Table 2 shows the errors due to obscured vehicles and to reflections. The total of the non-lane change maneuver errors made by the RTMS (summed from Table 1 and 2) are reported in the final three columns. Note that the percent of vehicles missed, 4.8%, is almost balanced by the percent of non-vehicle, false detections, 5.6%. The difference is even smaller if one excludes the false detections due to flicker (4.6% of the total detections). Returning to Table 1, the last two columns explicitly subset two errors from the rest, drop midsemi and missed motorcycle, and the numbers reported in these columns are not included in the supersets, flicker and undercount, respectively. For all columns, the percentages are relative to the total number of vehicles except for drop mid-semi, which is relative to the number of vehicles over 13.5 m. All of the loop sensors had a few problems with motorcycles, particularly when they travel between lanes. Two non-negligible problems became apparent in the loop data during this review. First, as shown in Table 1, Reno had a tendency to flicker, particularly during congestion, with over five percent of the actuations being these false positives, e.g., Figures 2G and 5A. Second, IST will occasionally slip into a mode where they correctly detect a vehicle, turn off for 1/6 sec and then immediately turn back on when they should be off. Figure 8 shows a sample of this error in Videosync, comparing the raw data time series to the ground truth for lane 2 one sees that for 12
15 TE/24/2328 several successive vehicles the detector only turns off briefly and then turns back on when it should remain off (note that the graph width is larger than Figure 5). According to the manufacturer, the observed pattern is related to the auto-calibration the sensors use to coordinate operating frequencies across different loops and IST was the only sensor included in the study that had this feature. This auto-calibration feature allows easier installation since the technician does not have to manually set the frequencies and promises to correct for interference problems between loop sensors that would be impossible for a technician to identify under conventional deployment conditions. The feature could be turned off, but given the fact that the error was not identified until after the data collection, all of the study data from the IST sensors include this problem. It appears that the problem starts when the detector has been occupied for many seconds, though it may simply become readily apparent under these conditions, while briefly occurring at other times as well. Presumably this problem could be avoided by manually selecting the operating frequencies (which is the only option available with the other loop sensors in this study), but this speculation was not tested. Caltrans has since reported that IST has revised the sensors and eliminated this auto-calibration problem. CONCLUSIONS This study set out to evaluate the performance of four loop sensor models and RTMS. A traffic sensor needs to be sufficiently accurate since any errors will propagate to decision-making and it is important that a detector performs as expected. Each sensor was deployed following conventional guidelines and the data evaluated at multiple resolutions, including the distribution of individual vehicle actuations, manual validation, and trends in conventional aggregated data. 13
16 TE/24/2328 Each sensor examined in this study exhibited problems. Most of these problems could be identified and corrected with additional fine-tuning in the data processing by the controller or data aggregator, such as was done for [13-14]. However, this added effort is not currently employed by most operating agencies. So the results should be representative of conventional practice. Discussions continue with operating agencies as to how best to incorporate such tests in future controller software. Other errors would likely require a field visit to correct, such as the non-operational 3M and Peek sensors. The Reno sensor tended to flicker on for short periods in absence of a vehicle in the detection zone, this problem could likely be addressed in the controller software, but such a solution is less than ideal. Many errors were due to lane change maneuvers over the detection zone. IST and Peek tended to detect such vehicles in both lanes, while the Reno and 3M sensors tended to underestimate the on-time of vehicles changing lanes in one lane while not detecting them in the second. The lane change maneuver problem seems to be a trade off between over and under counting, based on sensitivity. Ideally these errors should be addressed, but it does not look like it would be a major problem unless the loops are in a heavy weaving section. Some systemic errors emerged, such as the difference in the RTMS performance for the furthest lanes (occlusion) and nearest lanes (smaller detection zone). This systematic change in performance is important to note for traffic responsive ramp metering and other applications that rely on occupancy. The RTMS count and on-time are generally noisier than loops, though errors of omission are roughly balanced by errors of commission in counts (Table 2). The RTMS also has a larger detection zone than the loops, while even across the four models of loop sensors the apparent size of the detection zone varied from one model to the next for the same physical loop in the pavement. These variations will impact the magnitude of the occupancy measurement. 14
17 TE/24/2328 They could likely be corrected with the sensitivity settings in the sensors, but as was noted with the comparison between loops in the same direction at the two stations, it is likely that sitespecific factors are at least as important as the sensitivity setting. It may prove to be more efficient to simply devise a calibration for occupancy based applications that can be applied individually to each detector station. ACKNOWLEDGEMENTS The author wishes to thank Emily Super, Phillip Reuss, Mark Lehman, and Stephen Sawyer for the many hours they devoted to reducing video data. Joe Palen for assembling VideoSync (and various other contributions), everyone in Caltrans District 4 for their continued support of research, and California drivers without whom no data would have been collected. This work was performed as part of the California PATH (Partners for Advanced Highways and Transit) Program of the University of California, in cooperation with the State of California Business, Transportation and Housing Agency, Department of Transportation. The Contents of this report reflect the views of the author who is responsible for the facts and accuracy of the data presented herein. The contents do not necessarily reflect the official views or policies of the State of California. This report does not constitute a standard, specification or regulation. REFERENCES [1] Klein, L, Kelley, M [Hughes Aircraft Company], Detection Technology for IVHS: Final Report, FHWA, 1996, FHWA-RD [2] MNDOT Field Test of Monitoring of Urban Vehicle Operations Using Non-Intrusive Technologies, FHWA, 1997,FHWA-PL
18 TE/24/2328 [3] Middleton, D, Jasek, D., Parker, R., Evaluation of Some Existing Technologies for Vehicle Detection, Texas Transportation Institute, 1999, FHWA/TX-/1715-S. [4] Wald, W., Microwave Vehicle Detection, Final Report, Caltrans, 24, [5], B., "Using Dual Loop Speed Traps to Identify Detector Errors", Transportation Research Record no. 1683, Transportation Research Board, 1999, pp [6], B., Dhoorjaty, S. "Event Data Based Traffic Detector Validation Tests", ASCE Journal of Transportation Engineering, Vol 13, No 3, 24, pp [7] Wang, J., Case, E., Manor, D., "The Road Traffic Microwave Sensor (RTMS)", Proc. of the 3rd Vehicle Navigation and Information Systems Conference, Oslo, Norway, IEEE, 1992, pp [8] (accessed on July 16, 24). [9] (accessed on July 16, 24). [1] (accessed on July 16, 24). [11] (accessed on July 16, 24). [12] (accessed on July 16, 24). [13], B., Lyddy, D., Skabardonis, A., "The Berkeley Highway Laboratory- Building on the I-88 Field Experiment", Proc. IEEE ITS Council Annual Meeting, Dearborn, MI, 2, pp 5-1, [14] Skabardonis, A., Petty, K., Noeimi, H., Rydzewski, D., Varaiya, P., "I-88 Field Experiment: Data-Base Development and Incident Delay Estimation Procedures", 16
19 TE/24/2328 Transportation Research Record 1554, TRB, 1996, pp [15], B., An Assessment of Loop Detector and RTMS Performance, Automated Diagnostics of Loop Detectors and the Data Collection System in the Berkeley Highway Laboratory- Part II, PATH research report, University of California, 24. [16] (accessed on November 1, 24). 17
20 TE/24/2328 FIGURES AND TABLES List of Tables Table 1, Summary of manual detector validation. Table 2, RTMS overcounting and undercounting due to occlusions and reflections. List of Figures Figure 1, (A) Sample video frame shot from a 3 story building viewing Station 8. (B) Sample video frame shot from a 3 story building viewing Station 7. (C) Sample video frame shot from a Caltrans CCTV camera (visible in part B) viewing Station 7. (D) Still photo from the ground showing the configuration of Station 7. Figure 2, (A)-(E) CDF of downstream on-times at Station 7 during free flow on the given day for IST, 3M, Reno, RTMS, and Peek, respectively. (F) The pair-wise set of vehicle speeds and effective lengths that would result in an on-time below 11/6 sec. (G) Percent of free flow actuations that fall below 11/6 sec for each detector. 18
21 TE/24/2328 Figure 3, Total percent of unmatched pulses at each loop in the eastbound dual loop detectors at each station for each of the loop sensors at the two stations. The left column shows the results on a large vertical scale while the right column zooms in on the same plots. The rows correspond to IST, Reno, Peek and 3M, respectively. Figure 4, Total percent of on-time differences during free flow conditions that are greater than 2/6 sec at each eastbound dual loop detector for each of the loop sensors at the two stations. The left column shows the results on a large vertical scale while the right column zooms in on the same plots. The rows correspond to IST, Reno, Peek and 3M, respectively. Figure 5, Two examples of the Videosync display showing several detector states synchronized with concurrent video, using lighter shaded ovals, (A) errors made by the Reno loop sensor are highlighted, (B) several errors made by the RTMS during a congested period are highlighted. Figure 6, Summing the results from all three students for each sensor, (A) the percent of actuations that overlapped ground truth. (B) The percent of ground truth that overlapped one or more actuations. (C) The percent of ground truth that overlapped EXACTLY ONE actuation. 19
22 TE/24/2328 Figure 7, Summing the results from all three students for each sensor, (A) the average on-time bias over all vehicles. (B) The average absolute on-time error over all vehicles. (C) The percentage of vehicles with an on-time error. Figure 8, An example of a unique error exhibited by the IST cards (highlighted with a lighter shaded oval), reportedly related to auto-calibration. 2


 Sample video frame shot from a Caltrans CCTV camera (visible in part B)")
23 B) nd A) d 1 Lane 2 e n La 3 e n La 4 Lane 5 e Lan 6 e Lan RTMS Station 7 C) Lane 4 eastbound Station 7 RTMS detection zone n zone p detectio stream loo Station 7 down Lane Lane Lane Lane D) Lane 1 Lane 2 Lane oun Lane b east Station 8 eas tbo u CCTV upstream loops eastbound downstream loops CCTV RTMS Controller cabinet Figure 1, (A) Sample video frame shot from a 3 story building viewing Station 8. (B) Sample video frame shot from a 3 story building viewing Station 7. (C) Sample video frame shot from a Caltrans CCTV camera (visible in part B) viewing Station 7. (D) Still photo from the ground showing the configuration of Station 7.
24 A) 1 B) IST, 8/6/ M, 8/11/23 CDF (%) 6 lane 1 4 lane 2 lane 3 2 lane 4 lane downstream on-time (1/6 sec) C) 1 D) Reno, 8/7/23 8 CDF (%) downstream on-time (1/6 sec) 1 8 RTMS, 8/11/23 CDF (%) 6 4 CDF (%) downstream on-time (1/6 sec) E) 1 F) Peek, 8/8/23 8 G) CDF (%) downstream on-time (1/6 sec) 2 effective vehicle length (m) RTMS on-time (1/6 sec) region with on-times below 11/6 sec speed (km/h) percent IST, 8/6/23 Reno, 8/7/23 Peek, 8/8/23 3M, 8/11/23 RTMS, 8/11/ lane Figure 2, (A)-(E) CDF of downstream on-times at Station 7 during free flow on the given day for IST, 3M, Reno, RTMS, and Peek, respectively. (F) The pair-wise set of vehicle speeds and effective lengths that would result in an on-time below 11/6 sec. (G) Percent of free flow actuations that fall below 11/6 sec for each detector.
25 A) 5 B) IST, 8/6/23 4 station 8, upstream 3 station 8, downstream station 7, upstream station 7, downstream 2 % of pulses unmatched lane # C) 5 D) Reno, 8/7/23 4 % of pulses unmatched lane # E) 5 F) Peek, 8/8/23 4 % of pulses unmatched lane # G) 5 H) 3M, 8/11/23 4 % of pulses unmatched lane # % of pulses unmatched % of pulses unmatched % of pulses unmatched % of pulses unmatched IST, 8/6/23 detail lane # Reno, 8/7/23 detail lane # Peek, 8/8/23 detail lane # 3M, 8/11/23 detail lane # Figure 3, Total percent of unmatched pulses at each loop in the eastbound dual loop detectors at each station for each of the loop sensors at the two stations. The left column shows the results on a large vertical scale while the right column zooms in on the same plots. The rows correspond to IST, Reno, Peek and 3M, respectively.
26 A) 1 B) station 8 IST, 8/6/23 station 7 percent bad 5 percent bad 1 5 IST, 8/6/23 detail lane C) 1 D) lane percent bad 5 Reno, 8/7/23 percent bad 5 Reno, 8/7/23 detail lane E) 1 F) lane percent bad 5 Peek, 8/8/23 percent bad 5 Peek, 8/8/23 detail lane G) 1 H) lane percent bad 5 3M, 8/11/23 percent bad 5 3M, 8/11/23 detail lane lane Figure 4, Total percent of on-time differences during free flow conditions that are greater than 2/6 sec at each eastbound dual loop detector for each of the loop sensors at the two stations. The left column shows the results on a large vertical scale while the right column zooms in on the same plots. The rows correspond to IST, Reno, Peek and 3M, respectively.


27
28 A) 1 % [across 3 students] IST Reno Peek 3M RTMS B) 1 % [across 3 students] free flow congested all IST Reno Peek 3M RTMS C) 1 % [across 3 students] IST Reno Peek 3M RTMS Figure 6, Summing the results from all three students for each sensor, (A) the percent of actuations that overlapped ground truth. (B) The percent of ground truth that overlapped one or more actuations. (C) The percent of ground truth that overlapped EXACTLY ONE actuation.
29 A) bias (1/6 sec) [across 3 students] IST Reno Peek 3M RTMS B) error (1/6 sec) [across 3 students] free flow congested all IST Reno Peek 3M RTMS C) 1 % [across 3 students] IST Reno Peek 3M RTMS Figure 7, Summing the results from all three students for each sensor, (A) the average on-time bias over all vehicles. (B) The average absolute on-time error over all vehicles. (C) The percentage of vehicles with an on-time error.

30
31 Table 1, Summary of manual detector validation. Vehicles a Errors during Lane Change Maneuvers Other errors b Sensor Conditions Lane total -7.5m m over 13.5m Overcount non-flicker Overcount flicker Short Ontime Undercount Major ontime error Overcount non-flicker Overcount flicker Undercount Drop midsemi missed motorcycle IST Free flow IST Congested IST Total Percent 1.6%.%.3%.%.1%.7%.%.% 1.%.% Reno Free flow Reno Congested Reno Total Percent.3%.1%.8%.%.2% 1.5% 3.5%.% 14.8%.1% Peek Free flow Peek Congested Peek Total Percent.8%.%.6%.%.4%.%.%.% 3.7%.3% (continued next page)
32 Table 1 (continued) Vehicles a Errors during Lane Change Maneuvers Other errors b Sensor Conditions Lane total -7.5m m over 13.5m Overcount non-flicker Overcount flicker Short Ontime Undercount Major ontime error Overcount non-flicker Overcount flicker Undercount Drop midsemi missed motorcycle 3M Free flow 1 c n/a n/a n/a n/a n/a n/a n/a n/a n/a n/a n/a n/a n/a n/a M Congested 1 c n/a n/a n/a n/a n/a n/a n/a n/a n/a n/a n/a n/a n/a n/a M Total Percent.7%.%.9%.%.%.%.%.1% 3.7%.% RTMS d Free flow 1 e RTMS d Free flow 1 e Percent RTMS d Total Percent.5%.%.2%.3%.3%.3%.9%.2% 2.%.1% a Since the errors are small, the count is reported as measured by the dual loop detectors. b Some errors could be classified in to several columns by definition. For clarity, each observed error is counted in exactly one column, e.g., "drop mid-semi" could be considered a special case of "Overcount flicker", but each occurrence is only counted in one column or the other. c The 3M sensors did not report any data in lane 1. d There was significantly higher variance in the on-times from the RTMS (both systematic lane to lane and seemingly random from vehicle to vehicle), less attention was placed on catching these errors than with loops, i.e., the threshold for identifying an on-time error for a loop sensor is less than the threshold used for the RTMS. e One of the three evaluators used RTMS data concurrent with the 3M data set, so length data were not available in lane 1 for that individual and these vehicles are excluded from the length numbers.
33 Table 2, RTMS overcounting and undercounting due to occlusions and reflections. Vehicles a Obscured Vehicles Reflections Total errors b total nonvehicles detected total nonvehicles, nonflicker detected Sensor Conditions Lane total short ontime missed altogether long ontime overcount non-vehicle total missed RTMS Free flow RTMS Congested Percent RTMS Total Percent 1.4% 4.6% 4.4% 4.3% 4.8% 5.6% 4.6% a Since the errors are small, the count is reported as measured by the dual loop detectors. b Including "Other errors" (from Table 1), "Obscured Vehicles" and "Reflections", excluding "Errors during lane change maneuvers" (from Table 1).
Identifying and Correcting Pulse Breakup Errors from Freeway Loop Detectors
 Identifying and Correcting Pulse Breakup Errors from Freeway Loop Detectors Ho Lee, PhD Candidate Graduate Research Assistant Department of Civil and Environmental Engineering and Geodetic Science The
ANALYTICAL TOOLS FOR LOOP DETECTORS, TRAFFIC MONITORING, AND RAMP METERING SYSTEMS.
 ANALYTICAL TOOLS FOR LOOP DETECTORS, TRAFFIC MONITORING, AND RAMP METERING SYSTEMS. Benjamin A. Coifman, Associate Professor Department of Civil and Environmental Engineering and Geodetic Science Department
Battery saving communication modes for wireless freeway traffic sensors
 Battery saving communication modes for wireless freeway traffic sensors Dr. Benjamin Coifman (corresponding author) Associate Professor The Ohio State University Joint appointment with the Department of
Length based vehicle classification on freeways from single loop detectors
 MN WI MI IL IN OH USDOT Region V Regional University Transportation Center Final Report NEXTRANS Project No 003OY01 Length based vehicle classification on freeways from single loop detectors By Benjamin
Traffic Surveillance with Wireless Magnetic Sensors
 Paper 4779 Traffic Surveillance with Wireless Magnetic Sensors Sing Yiu Cheung, Sinem Coleri Ergen * and Pravin Varaiya University of California, Berkeley, CA 94720-1770, USA *Tel: (510) 642-5270, csinem@eecs.berkeley.edu
Highway Traffic Data Sensitivity Analysis
 CALIFORNIA PATH PROGRAM INSTITUTE OF TRANSPORTATION STUDIES UNIVERSITY OF CALIFORNIA, BERKELEY Highway Traffic Data Sensitivity Analysis Xiao-Yun Lu, Benjamin Coifman California PATH Research Report UCB-ITS-PRR-2007-3
UC Berkeley Dissertations
 UC Berkeley Dissertations Title Vehicle Reidentification and Travel Time Measurement Using Loop Detector Speed Traps Permalink https://escholarship.org/uc/item/5d69n86x Author Coifman, Benjamin Andre Publication
Development of an Advanced Loop Event Data Analyzer (ALEDA) System for Dual-Loop Detector Malfunction Detection and Investigation
 System for Dual-Loop Detector Malfunction Detection and Investigation") Development of an Advanced Loop Event Data Analyzer (ALEDA) System for Dual-Loop Detector Malfunction Detection and Investigation Patikhom Cheevarunothai 1*, Yinhai Wang 2, and Nancy L. Nihan 3 1* Graduate
Development of an Advanced Loop Event Data Analyzer (ALEDA) System for Dual-Loop Detector Malfunction Detection and Investigation Patikhom Cheevarunothai 1*, Yinhai Wang 2, and Nancy L. Nihan 3 1* Graduate
IMPROVEMENTS TO A QUEUE AND DELAY ESTIMATION ALGORITHM UTILIZED IN VIDEO IMAGING VEHICLE DETECTION SYSTEMS
 IMPROVEMENTS TO A QUEUE AND DELAY ESTIMATION ALGORITHM UTILIZED IN VIDEO IMAGING VEHICLE DETECTION SYSTEMS A Thesis Proposal By Marshall T. Cheek Submitted to the Office of Graduate Studies Texas A&M University
Algorithm for Detector-Error Screening on Basis of Temporal and Spatial Information
 Algorithm for Detector-Error Screening on Basis of Temporal and Spatial Information Yang (Carl) Lu, Xianfeng Yang, and Gang-Len Chang Although average effective vehicle length (AEVL) has been recognized
Assessing the Performance of SpeedInfo Radar Traffic Sensors
 Assessing the Performance of SpeedInfo Radar Traffic Sensors Seoungbum Kim, PhD Seoungbum Kim, PhD Assistant Professor Division of Architectural, Urban, and Civil Engineering / Engineering Research Institute
Performance Evaluation of Coordinated-Actuated Traffic Signal Systems Gary E. Shoup and Darcy Bullock
 ABSTRACT Performance Evaluation of Coordinated-Actuated Traffic Signal Systems Gary E. Shoup and Darcy Bullock Arterial traffic signal systems are complex systems that are extremely difficult to analyze
Deployment and Testing of Optimized Autonomous and Connected Vehicle Trajectories at a Closed- Course Signalized Intersection
 Deployment and Testing of Optimized Autonomous and Connected Vehicle Trajectories at a Closed- Course Signalized Intersection Clark Letter*, Lily Elefteriadou, Mahmoud Pourmehrab, Aschkan Omidvar Civil
Traffic Measurement and Vehicle Classification with a Single Magnetic Sensor
 Traffic Measurement and Vehicle Classification with a Single Magnetic Sensor Sing Yiu Cheung, Sinem Coleri, Baris Dundar, Sumitra Ganesh, Chin-Woo Tan and Pravin Varaiya * University of California, Berkeley,
FINAL REPORT. On Project Supplemental Guidance on the Application of FHWA s Traffic Noise Model (TNM) APPENDIX K Parallel Barriers
 APPENDIX K Parallel Barriers") FINAL REPORT On Project - Supplemental Guidance on the Application of FHWA s Traffic Noise Model (TNM) APPENDIX K Parallel Barriers Prepared for: National Cooperative Highway Research Program (NCHRP) Transportation
FINAL REPORT On Project - Supplemental Guidance on the Application of FHWA s Traffic Noise Model (TNM) APPENDIX K Parallel Barriers Prepared for: National Cooperative Highway Research Program (NCHRP) Transportation
Minnesota Department of Transportation Rural Intersection Conflict Warning System (RICWS) Reliability Evaluation
 Reliability Evaluation") LLLK CENTER FOR TRANSPORTATION STUDIES Minnesota Department of Transportation Rural Intersection Conflict Warning System (RICWS) Reliability Evaluation Final Report Arvind Menon Max Donath Department of
LLLK CENTER FOR TRANSPORTATION STUDIES Minnesota Department of Transportation Rural Intersection Conflict Warning System (RICWS) Reliability Evaluation Final Report Arvind Menon Max Donath Department of
May 20, Keywords: automatic vehicle classification, sensors, traffic surveillance, vehicle detectors, advanced traffic management systems
 Traffic measurement and vehicle classification with a single magnetic sensor Sing Yiu Cheung, Sinem Coleri, Baris Dundar, Sumitra Ganesh, Chin-Woo Tan and Pravin Varaiya Traffic Measurement Group Department
1. EXECUTIVE SUMMARY
 1. EXECUTIVE SUMMARY 1.1 INTRODUCTION This document is the Final Evaluation Report for the Genesis Advanced Traveler Information System (ATIS) Field Operational Test (FOT). This test was co-sponsored by
Noise Mitigation Study Pilot Program Summary Report Contract No
 Ohio Turnpike Commission Noise Mitigation Study Pilot Program Summary Report Contract No. 71-08-02 Prepared For: Ohio Turnpike Commission 682 Prospect Street Berea, Ohio 44017 Prepared By: November 2009
SEQUENTIAL WARNING LIGHT SYSTEM FOR WORK ZONE LANE CLOSURES Paper No
 SEQUENTIAL WARNING LIGHT SYSTEM FOR WORK ZONE LANE CLOSURES Paper No. 01-2293 by Melisa D. Finley Assistant Transportation Researcher Texas Transportation Institute m-finley@tamu.edu Gerald L. Ullman,
Some Observed Queue Discharge Features at a Freeway Bottleneck Downstream of a Merge
 Some Observed Queue Discharge Features at a Freeway Bottleneck Downstream of a Merge Robert L. Bertini Portland State University Department of Civil Engineering P.O. Box 751 Portland, OR 9727-751 (53)
Mining vehicle classifications from the Columbus Metropolitan Freeway Management System
 Mining vehicle classifications from the Columbus Metropolitan Freeway Management System Prepared by: Benjamin Coifman, Bo Huang, Keith Redmill, Mo Wu Prepared for: The Ohio Department of Transportation,
Agenda. TS2 Cabinet Components and Operation. Understanding a Signal Plan Maccarone. Basic Preemption/Priority
 Morning Traffic Terminology TS2 Cabinet Components and Operation Traffic Signal Phasing Ring Structure Traffic Signal Timing Understanding a Signal Plan Maccarone Controller Programming Afternoon Basic
DISTRIBUTED SURVEILLANCE ON FREEWAYS EMPHASIZING INCIDENT DETECTION AND VERIFICATION
 DISTRIBUTED SURVEILLANCE ON FREEWAYS EMPHASIZING INCIDENT DETECTION AND VERIFICATION Benjamin A. Coifman corresponding author, Associate Professor The Ohio State University, Joint appointment with the
Evaluation of Portable Automated Data Collection Technologies: Interim Report, Work Accomplished During Fiscal Year
 CALIFORNIA PATH PROGRAM INSTITUTE OF TRANSPORTATION STUDIES UNIVERSITY OF CALIFORNIA, BERKELEY Evaluation of Portable Automated Data Collection Technologies: Interim Report, Work Accomplished During Fiscal
Chapter 10. Non-Intrusive Technologies Introduction
 Chapter 10 Non-Intrusive Technologies 10.1 Introduction Non-intrusive technologies include video data collection, passive or active infrared detectors, microwave radar detectors, ultrasonic detectors,
Design of Simulcast Paging Systems using the Infostream Cypher. Document Number Revsion B 2005 Infostream Pty Ltd. All rights reserved
 Design of Simulcast Paging Systems using the Infostream Cypher Document Number 95-1003. Revsion B 2005 Infostream Pty Ltd. All rights reserved 1 INTRODUCTION 2 2 TRANSMITTER FREQUENCY CONTROL 3 2.1 Introduction
Roadside Range Sensors for Intersection Decision Support
 Roadside Range Sensors for Intersection Decision Support Arvind Menon, Alec Gorjestani, Craig Shankwitz and Max Donath, Member, IEEE Abstract The Intelligent Transportation Institute at the University
Real-Time Identification and Tracking of Traffic Queues Based on Average Link Speed
 Paper No. 03-3351 Real-Time Identification and Tracking of Traffic Queues Based on Average Link Speed T. Nixon Chan M.A.Sc. Candidate Department of Civil Engineering, University of Waterloo 200 University
Detector-Health Classification for Quality Control of Traffic Counting Data (at MnDOT) NATMEC, 2018 Taek M.Kwon, Ph.D University of Minnesota Duluth
 NATMEC, 2018 Taek M.Kwon, Ph.D University of Minnesota Duluth") Detector-Health Classification for Quality Control of Traffic Counting Data (at MnDOT) NATMEC, 2018 Taek M.Kwon, Ph.D University of Minnesota Duluth Outline Background Theoretical basis Implementation
Detector-Health Classification for Quality Control of Traffic Counting Data (at MnDOT) NATMEC, 2018 Taek M.Kwon, Ph.D University of Minnesota Duluth Outline Background Theoretical basis Implementation
Traffic Solutions. How to Test FCD Monitoring Solutions: Performance of Cellular-Based Vs. GPS-based systems
 Traffic Solutions How to Test FCD Monitoring Solutions: Performance of Cellular-Based Vs. GPS-based systems About Cellint Israel Based, office in the US Main products NetEyes for quality of RF networks
Heuristic Drift Reduction for Gyroscopes in Vehicle Tracking Applications
 White Paper Heuristic Drift Reduction for Gyroscopes in Vehicle Tracking Applications by Johann Borenstein Last revised: 12/6/27 ABSTRACT The present invention pertains to the reduction of measurement
Jitter Analysis Techniques Using an Agilent Infiniium Oscilloscope
 Jitter Analysis Techniques Using an Agilent Infiniium Oscilloscope Product Note Table of Contents Introduction........................ 1 Jitter Fundamentals................. 1 Jitter Measurement Techniques......
MODEL L-1200 SERIES OPERATION MANUAL
 Reno A & E Telephone: (775) 826-2020 4655 Aircenter Circle Facsimile: (775) 826-99 Reno, Nevada 89502 Internet: www.renoae.com USA e-mail: contact@renoae.com MODEL L-200 SERIES OPERATION MANUAL Built-in
Use of Probe Vehicles to Increase Traffic Estimation Accuracy in Brisbane
 Use of Probe Vehicles to Increase Traffic Estimation Accuracy in Brisbane Lee, J. & Rakotonirainy, A. Centre for Accident Research and Road Safety - Queensland (CARRS-Q), Queensland University of Technology
TxDOT Project : Evaluation of Pavement Rutting and Distress Measurements
 0-6663-P2 RECOMMENDATIONS FOR SELECTION OF AUTOMATED DISTRESS MEASURING EQUIPMENT Pedro Serigos Maria Burton Andre Smit Jorge Prozzi MooYeon Kim Mike Murphy TxDOT Project 0-6663: Evaluation of Pavement
OPPORTUNISTIC TRAFFIC SENSING USING EXISTING VIDEO SOURCES (PHASE II)
") CIVIL ENGINEERING STUDIES Illinois Center for Transportation Series No. 17-003 UILU-ENG-2017-2003 ISSN: 0197-9191 OPPORTUNISTIC TRAFFIC SENSING USING EXISTING VIDEO SOURCES (PHASE II) Prepared By Jakob
CIVIL ENGINEERING STUDIES Illinois Center for Transportation Series No. 17-003 UILU-ENG-2017-2003 ISSN: 0197-9191 OPPORTUNISTIC TRAFFIC SENSING USING EXISTING VIDEO SOURCES (PHASE II) Prepared By Jakob
PROBE DATA FROM CONSUMER GPS NAVIGATION DEVICES FOR THE ANALYSIS OF CONTROLLED INTERSECTIONS
 PROBE DATA FROM CONSUMER GPS NAVIGATION DEVICES FOR THE ANALYSIS OF CONTROLLED INTERSECTIONS Arnold Meijer (corresponding author) Business Development Specialist, TomTom International P.O Box 16597, 1001
Estimation of Freeway Density Based on the Combination of Point Traffic Detector Data and Automatic Vehicle Identification Data
 Estimation of Freeway Density Based on the Combination of Point Traffic Detector Data and Automatic Vehicle Identification Data By Somaye Fakharian Qom Ph.D candidate and Research Assistant Department
4 th Grade Mathematics Learning Targets By Unit
 INSTRUCTIONAL UNIT UNIT 1: WORKING WITH WHOLE NUMBERS UNIT 2: ESTIMATION AND NUMBER THEORY PSSA ELIGIBLE CONTENT M04.A-T.1.1.1 Demonstrate an understanding that in a multi-digit whole number (through 1,000,000),
Lane Change Maneuver Detection from Probe Vehicle DGPS Data
 Lane Change Maneuver Detection from Probe Vehicle DGPS Data Yiguang Xuan, Member, IEEE, Benjamin Coifman, Member, IEEE Abstract The impact of lane change maneuvers is fundamental to microscopic traffic
Sensor Technologies for ITS
 Sensor Technologies for ITS Lawrence A. Klein, Ph.D. Prepared for Transportation Research Board Freeway Operations and Signal Systems Mid-Year Committee Meeting July 21 23 Park City Marriott Park City,
AN INTERSECTION TRAFFIC DATA COLLECTION DEVICE UTILIZING LOGGING CAPABILITIES OF TRAFFIC CONTROLLERS AND CURRENT TRAFFIC SENSORS.
 AN INTERSECTION TRAFFIC DATA COLLECTION DEVICE UTILIZING LOGGING CAPABILITIES OF TRAFFIC CONTROLLERS AND CURRENT TRAFFIC SENSORS Final Report November 2008 UI Budget KLK134 NIATT Report Number N08-13 Prepared
Impact of transient saturation of Current Transformer during cyclic operations Analysis and Diagnosis
 1 Impact of transient saturation of Current Transformer during cyclic operations Analysis and Diagnosis BK Pandey, DGM(OS-Elect) Venkateswara Rao Bitra, Manager (EMD Simhadri) 1.0 Introduction: Current
ENTERPRISE Transportation Pooled Fund Study TPF-5 (231)
") ENTERPRISE Transportation Pooled Fund Study TPF-5 (231) Impacts of Traveler Information on the Overall Network FINAL REPORT Prepared by September 2012 i 1. Report No. ENT-2012-2 2. Government Accession
ENTERPRISE Transportation Pooled Fund Study TPF-5 (231) Impacts of Traveler Information on the Overall Network FINAL REPORT Prepared by September 2012 i 1. Report No. ENT-2012-2 2. Government Accession
Lane Change Maneuver Detection from Probe Vehicle DGPS Data
 Proceedings of the IEEE ITSC 26 26 IEEE Intelligent Transportation Systems Conference Toronto, Canada, September 7-2, 26 MC7. Lane Change Maneuver Detection from Probe Vehicle DGPS Data Yiguang Xuan, Member,
Next Generation of Adaptive Traffic Signal Control
 Next Generation of Adaptive Traffic Signal Control Pitu Mirchandani ATLAS Research Laboratory Arizona State University NSF Workshop Rutgers, New Brunswick, NJ June 7, 2010 Acknowledgements: FHWA, ADOT,
High Precision Positioning Unit 1: Accuracy, Precision, and Error Student Exercise
 High Precision Positioning Unit 1: Accuracy, Precision, and Error Student Exercise Ian Lauer and Ben Crosby (Idaho State University) This assignment follows the Unit 1 introductory presentation and lecture.
MOBILITY RESEARCH NEEDS FROM THE GOVERNMENT PERSPECTIVE
 MOBILITY RESEARCH NEEDS FROM THE GOVERNMENT PERSPECTIVE First Annual 2018 National Mobility Summit of US DOT University Transportation Centers (UTC) April 12, 2018 Washington, DC Research Areas Cooperative
Figures. Tables. Comparison of Interchange Control Methods...25
 Signal Timing Contents Signal Timing Introduction... 1 Controller Types... 1 Pretimed Signal Control... 2 Traffic Actuated Signal Control... 2 Controller Unit Elements... 3 Cycle Length... 3 Vehicle Green
HIGHWAY WORK ZONE DATA COLLECTION INSTRUMENT
 HIGHWAY WORK ZONE DATA COLLECTION INSTRUMENT Case ID: MI Date of Investigation Respondent Employer Information 1. Is the employer the primary contractor or a subcontractor working at the site? Victim Information
Laboratory 1: Uncertainty Analysis
 University of Alabama Department of Physics and Astronomy PH101 / LeClair May 26, 2014 Laboratory 1: Uncertainty Analysis Hypothesis: A statistical analysis including both mean and standard deviation can
DUAL DIMMING, EXTENDED TEMPERATURE CCFL INVERTER MODULE. Obsolete. utilizing standard lamp current
 Dual Drive, Wide Range Dual Drive Dimming Control. The Dimming, Single Output Inverter. The inverters provide brightness adjustments utilizing standard lamp current LXMG1614E series of Direct Drive CCFL
Frequency Hopping Pattern Recognition Algorithms for Wireless Sensor Networks
 Frequency Hopping Pattern Recognition Algorithms for Wireless Sensor Networks Min Song, Trent Allison Department of Electrical and Computer Engineering Old Dominion University Norfolk, VA 23529, USA Abstract
VALIDATION OF LINK TRAVEL TIME USING GPS DATA: A Case Study of Western Expressway, Mumbai
 Map Asia 2005 Jaarta, Indonesia VALIDATION OF LINK TRAVEL TIME USING GPS DATA: A Case Study of Western Expressway, Mumbai Saurabh Gupta 1, Tom V. Mathew 2 Transportation Systems Engineering Department
ESTIMATING ROAD TRAFFIC PARAMETERS FROM MOBILE COMMUNICATIONS
 ESTIMATING ROAD TRAFFIC PARAMETERS FROM MOBILE COMMUNICATIONS R. Bolla, F. Davoli, A. Giordano Department of Communications, Computer and Systems Science (DIST University of Genoa Via Opera Pia 13, I-115
Roadmap to Successful Deployment of Adaptive Systems
 Smart Information for a Sustainable World Roadmap to Successful Deployment of Adaptive Systems Farhad Pooran Telvent Transportation North America Hampton Roads Transportation Operation Sub- Committee June
Loughborough University Institutional Repository. This item was submitted to Loughborough University's Institutional Repository by the/an author.
 Loughborough University Institutional Repository Digital and video analysis of eye-glance movements during naturalistic driving from the ADSEAT and TeleFOT field operational trials - results and challenges
Addressing Issues with GPS Data Accuracy and Position Update Rate for Field Traffic Studies
 Addressing Issues with GPS Data Accuracy and Position Update Rate for Field Traffic Studies THIS FEATURE VALIDATES INTRODUCTION Global positioning system (GPS) technologies have provided promising tools
PERFORMANCE MEASURES FOR TRAFFIC SIGNAL PEDESTRIAN BUTTON and DETECTOR MAINTENANCE
 1 2 3 4 5 6 7 8 9 10 11 12 13 14 15 16 17 18 19 20 21 22 23 24 25 26 27 28 29 30 31 32 33 PERFORMANCE MEASURES FOR TRAFFIC SIGNAL PEDESTRIAN BUTTON and DETECTOR MAINTENANCE by Corresponding Author Jay
ASSESSING THE POTENTIAL FOR THE AUTOMATIC DETECTION OF INCIDENTS ON THE BASIS OF INFORMATION OBTAINED FROM ELECTRONIC TOLL TAGS
 ASSESSING THE POTENTIAL FOR THE AUTOMATIC DETECTION OF INCIDENTS ON THE BASIS OF INFORMATION OBTAINED FROM ELECTRONIC TOLL TAGS Bruce Hellinga Department of Civil Engineering, University of Waterloo, Waterloo,
FHWA/TX-03/ Title and Subtitle INTERSECTION VIDEO DETECTION MANUAL. September Performing Organization Code
 1. Report No. FHWA/TX-03/4285-2 4. Title and Subtitle INTERSECTION VIDEO DETECTION MANUAL Technical Report Documentation Page 2. Government Accession No. 3. Recipient's Catalog No. 5. Report Date September
Exercise 6. Range and Angle Tracking Performance (Radar-Dependent Errors) EXERCISE OBJECTIVE
 EXERCISE OBJECTIVE") Exercise 6 Range and Angle Tracking Performance EXERCISE OBJECTIVE When you have completed this exercise, you will be familiar with the radardependent sources of error which limit range and angle tracking
Exercise 6 Range and Angle Tracking Performance EXERCISE OBJECTIVE When you have completed this exercise, you will be familiar with the radardependent sources of error which limit range and angle tracking
Learning Spatio-temporal Context for Vehicle Reidentification
 Learning Spatio-temporal Context for Vehicle Reidentification Ahmed Y. Tawfik Aidong Peng School of Computer Science University of Windsor Windsor, Ontario, Canada @uwindsor.ca Abstract
Magnetic Imaging Technology
 Magnetic Imaging Technology 200 Virginia Concrete Conference H. Thomas Yu State of the Practice " The importance of proper dowel alignment is widely recognized, but it could not be verified effectively
INNOVATIVE DEPLOYMENT OF DYNAMIC MESSAGE SIGNS IN SAFETY APPLICATIONS
 INNOVATIVE DEPLOYMENT OF DYNAMIC MESSAGE SIGNS IN SAFETY APPLICATIONS L.A. Griffin Director of Expressway Operations, Orlando-Orange County Expressway Authority 4974 ORL Tower Road Orlando, FL 32807 (407)
Real Time Traffic Light Control System Using Image Processing
 Real Time Traffic Light Control System Using Image Processing Darshan J #1, Siddhesh L. #2, Hitesh B. #3, Pratik S.#4 Department of Electronics and Telecommunications Student of KC College Of Engineering
SOUND: A Traffic Simulation Model for Oversaturated Traffic Flow on Urban Expressways
 SOUND: A Traffic Simulation Model for Oversaturated Traffic Flow on Urban Expressways Toshio Yoshii 1) and Masao Kuwahara 2) 1: Research Assistant 2: Associate Professor Institute of Industrial Science,
Appendix Traffic Engineering Checklist - How to Complete. (Refer to Template Section for Word Format Document)
") Appendix 400.1 Traffic Engineering Checklist - How to Complete (Refer to Template Section for Word Format Document) Traffic Engineering Checksheet How to Complete the Form June 2003 Version 3 Maintained
Appendix 400.1 Traffic Engineering Checklist - How to Complete (Refer to Template Section for Word Format Document) Traffic Engineering Checksheet How to Complete the Form June 2003 Version 3 Maintained
Individual Vehicle Speed Estimation Using Single Loop Inductive Waveforms
 CALIFORNIA PATH PROGRAM INSTITUTE OF TRANSPORTATION STUDIES UNIVERSITY OF CALIFORNIA, BERKELEY Individual Vehicle Speed Estimation Using Single Loop Inductive Waveforms Carlos Sun, Stephen G. Ritchie California
Texas Transportation Institute The Texas A&M University System College Station, Texas
 1. Report No. FHWA/TX-05/0-4422-2 4. Title and Subtitle DEVELOPMENT OF A TRAFFIC SIGNAL PERFORMANCE MEASUREMENT SYSTEM (TSPMS) 2. Government Accession No. 3. Recipient's Catalog No. Technical Report Documentation
On-line Partial Discharge Assessment and Monitoring of MV to EHV Cables
 On-line Partial Discharge Assessment and Monitoring of MV to EHV Cables William Higinbotham, Neil Davies and Victor Chan EA Technology LLC, New Jersey; USA, EA Technology Pty Ltd, Brisbane Australia; EA
FIBER OPTICS. Prof. R.K. Shevgaonkar. Department of Electrical Engineering. Indian Institute of Technology, Bombay. Lecture: 24. Optical Receivers-
 FIBER OPTICS Prof. R.K. Shevgaonkar Department of Electrical Engineering Indian Institute of Technology, Bombay Lecture: 24 Optical Receivers- Receiver Sensitivity Degradation Fiber Optics, Prof. R.K.
Exercise 4. Angle Tracking Techniques EXERCISE OBJECTIVE
 Exercise 4 Angle Tracking Techniques EXERCISE OBJECTIVE When you have completed this exercise, you will be familiar with the principles of the following angle tracking techniques: lobe switching, conical
Focus Group Participants Understanding of Advance Warning Arrow Displays used in Short-Term and Moving Work Zones
 Focus Group Participants Understanding of Advance Warning Arrow Displays used in Short-Term and Moving Work Zones Chen Fei See University of Kansas 2160 Learned Hall 1530 W. 15th Street Lawrence, KS 66045
FINAL REPORT IMPROVING THE EFFECTIVENESS OF TRAFFIC MONITORING BASED ON WIRELESS LOCATION TECHNOLOGY. Michael D. Fontaine, P.E. Research Scientist
 FINAL REPORT IMPROVING THE EFFECTIVENESS OF TRAFFIC MONITORING BASED ON WIRELESS LOCATION TECHNOLOGY Michael D. Fontaine, P.E. Research Scientist Brian L. Smith, Ph.D. Faculty Research Scientist and Associate
MODEL C-1000 SERIES OPERATION MANUAL
 Reno A & E Telephone: (775) 826-2020 4655 Aircenter Circle Facsimile: (775) 826-99 Reno, Nevada 89502 Internet: www.renoae.com USA e-mail: contact@renoae.com MODEL C-000 SERIES OPERATION MANUAL Built-in
Next Generation Traffic Control with Connected and Automated Vehicles
 Next Generation Traffic Control with Connected and Automated Vehicles Henry Liu Department of Civil and Environmental Engineering University of Michigan Transportation Research Institute University of
USING BLUETOOTH TM TO MEASURE TRAVEL TIME ALONG ARTERIAL CORRIDORS
 USING BLUETOOTH TM TO MEASURE TRAVEL TIME ALONG ARTERIAL CORRIDORS A Comparative Analysis Submitted To: City of Philadelphia Department of Streets Philadelphia, PA Prepared By: KMJ Consulting, Inc. 120
USE OF BLUETOOTH TECHNOLOGY IN TRAFFIC DATA COLLECTION & MANAGEMENT
 USE OF BLUETOOTH TECHNOLOGY IN TRAFFIC DATA COLLECTION & MANAGEMENT Justin Effinger, EIT Research Assistant/Teaching Assistant Department of Civil Engineering & Mechanics University of Wisconsin Milwaukee
Exercise 4-1 Image Exploration
 Exercise 4-1 Image Exploration With this exercise, we begin an extensive exploration of remotely sensed imagery and image processing techniques. Because remotely sensed imagery is a common source of data
Managing traffic through Signal Performance Measures in Pima County
 CASE STUDY Miovision TrafficLink Managing traffic through Signal Performance Measures in Pima County TrafficLink ATSPM Case Study Contents Project overview (executive summary) 2 Project objective 2 Overall
THE CHALLENGES OF USING RADAR FOR PEDESTRIAN DETECTION
 THE CHALLENGES OF USING RADAR FOR PEDESTRIAN DETECTION Keith Manston Siemens Mobility, Traffic Solutions Sopers Lane, Poole Dorset, BH17 7ER United Kingdom Tel: +44 (0)1202 782248 Fax: +44 (0)1202 782602
Keysight Technologies Making Accurate Intermodulation Distortion Measurements with the PNA-X Network Analyzer, 10 MHz to 26.5 GHz
 Keysight Technologies Making Accurate Intermodulation Distortion Measurements with the PNA-X Network Analyzer, 10 MHz to 26.5 GHz Application Note Overview This application note describes accuracy considerations
Chapter 4 Results. 4.1 Pattern recognition algorithm performance
 94 Chapter 4 Results 4.1 Pattern recognition algorithm performance The results of analyzing PERES data using the pattern recognition algorithm described in Chapter 3 are presented here in Chapter 4 to
Advanced Traffic Signal Control System Installed in Phuket City, Kingdom of Thailand
 INFORMATION & COMMUNICATION SYSTEMS Advanced Traffic Signal Control System Installed in Phuket City, Kingdom of Thailand Hajime SAKAKIBARA, Masanori AOKI and Hiroshi MATSUMOTO Along with the economic development,
VEHICLE INTEGRATED NAVIGATION SYSTEM
 VEHICLE INTEGRATED NAVIGATION SYSTEM Ian Humphery, Fibersense Technology Corporation Christopher Reynolds, Fibersense Technology Corporation Biographies Ian P. Humphrey, Director of GPSI Engineering, Fibersense
Surveillance and Calibration Verification Using Autoassociative Neural Networks
 Surveillance and Calibration Verification Using Autoassociative Neural Networks Darryl J. Wrest, J. Wesley Hines, and Robert E. Uhrig* Department of Nuclear Engineering, University of Tennessee, Knoxville,
Development of a Pavement Marking Condition Index from Retroreflectivity and Presence Measurements
 Development of a Pavement Marking Condition Index from Retroreflectivity and Presence Measurements Carmine E. Dwyer, P.E. (Corresponding Author) Senior Engineer 100 Trade Centre Drive, Suite 200 Champaign,
Automatic gauge control (AGC)/
/") 54 Technical Article Optimizing Strip Speed Measurement for AGC/Mass Flow and Elongation Control With Laser Surface Velocimeters Authors Leading manufacturers are constantly seeking out ways to increase
54 Technical Article Optimizing Strip Speed Measurement for AGC/Mass Flow and Elongation Control With Laser Surface Velocimeters Authors Leading manufacturers are constantly seeking out ways to increase
Ron Turner Technical Lead for Surface Systems. Syracuse, NY. Sensis Air Traffic Systems - 1
 Multilateration Technology Overview Ron Turner Technical Lead for Surface Systems Sensis Corporation Syracuse, NY Sensis Air Traffic Systems - 1 Presentation Agenda Multilateration Overview Transponder
Transportation and Traffic Theory: Flow, Dynamics and Human Interaction
 Real-Time Estimation of Travel Times on Signalized Arterials 1 Transportation and Traffic Theory: Flow, Dynamics and Human Interaction Proceedings of the 16 th International Symposium on Transportation
DC and AC Circuits. Objective. Theory. 1. Direct Current (DC) R-C Circuit
 R-C Circuit") [International Campus Lab] Objective Determine the behavior of resistors, capacitors, and inductors in DC and AC circuits. Theory ----------------------------- Reference -------------------------- Young
[International Campus Lab] Objective Determine the behavior of resistors, capacitors, and inductors in DC and AC circuits. Theory ----------------------------- Reference -------------------------- Young
DATACAR ADVANCED MULTILANE TRAFFIC MONITORING SYSTEM
 DATACAR Doc 9723 0030 ADVANCED MULTILANE TRAFFIC MONITORING SYSTEM Suitable both for permanent and temporary installations Non-Intrusive System Accurate detection, speed, counting and classifying traffic
Statistical Pulse Measurements using USB Power Sensors
 Statistical Pulse Measurements using USB Power Sensors Today s modern USB Power Sensors are capable of many advanced power measurements. These Power Sensors are capable of demodulating the signal and processing
Measurement over a Short Distance. Tom Mathew
 Measurement over a Short Distance Tom Mathew Outline Introduction Data Collection Methods Data Analysis Conclusion Introduction Determine Fundamental Traffic Parameter Data Collection and Interpretation
SIMULATION BASED PERFORMANCE TEST OF INCIDENT DETECTION ALGORITHMS USING BLUETOOTH MEASUREMENTS
 Transport and Telecommunication, 2016, volume 17, no. 4, 267 273 Transport and Telecommunication Institute, Lomonosova 1, Riga, LV-1019, Latvia DOI 10.1515/ttj-2016-0023 SIMULATION BASED PERFORMANCE TEST
Check the LCLS Project website to verify 2 of 7 that this is the correct version prior to use.
 1. Introduction: The XTOD Offset System (OMS) is designed to direct the LCLS FEL beam to the instruments and experimental stations, while substantially reducing the flux of unwanted radiation which accompanies
Chapter 5. Clock Offset Due to Antenna Rotation
 Chapter 5. Clock Offset Due to Antenna Rotation 5. Introduction The goal of this experiment is to determine how the receiver clock offset from GPS time is affected by a rotating antenna. Because the GPS
Improving the Detection of Near Earth Objects for Ground Based Telescopes
 Improving the Detection of Near Earth Objects for Ground Based Telescopes Anthony O'Dell Captain, United States Air Force Air Force Research Laboratories ABSTRACT Congress has mandated the detection of