Rev 2.0 September 2010 Copyright Lecoeur Electronique corporation all rights reserved -
|
|
|
- Kelly Hicks
- 6 years ago
- Views:
Transcription

1 USER MANUAL Rev 2.0 September 2010 Copyright Lecoeur Electronique corporation all rights reserved - US-Key 1
2 TABLE OF CONTENTS 1- INTRODUCTION GENERAL OVERVIEW PAREMETER SETTING 8 3- GRAPHICAL PART DETAILS VISUALIZATION MODES A-SCAN Mode Remanent Mode MHz A-SCAN Mode MHz RF Mode SET CHANNEL SET GAIN SET DELAY PARAMETERS SETTING DETAILS GAIN DELAY SCALE GATES Position Height DETAILS OF THE MENU PRINT MODE CHOICE SPECTRUM GATES Amplitude Alarmes releases Number of strikes before alarm Réglage Echo-start DAC PULSER Voltage Emission width Repetition Frequency Phase Delay AUXILIARIES Filters Standard of Alternation Report Wizard BSCAN ZOOM SETUP SAVE LOAD DESTROY ALARMS DETAILS. 33 2
3 7- Features 8- Additional functions 3
4 1- INTRODUCTION. This work is intended to establish a guide of technical reference for users of the US-Key system. Most of this handbook is devoted to the detail of the menus, thus a majority of the screens proposed by the ultrasonic modules appear in it, constituting a database precise and easy to consult. The US-Key is one of the most powerful tools as regards non-destructive ultrasonic testing. Its modular concept makes it evolutionary and easy to use. It s a precise measuring instrument. 4
5 2- GENERAL OVERVIEW. The display screen is divided into four parts: A first graphic part, one second indicating alarms and amplitudes, a third which is interested in the adjustments, and a last which gives access to a menu. The central part is assigned to posting of the A-scan signal. On right-hand side of the graph an elevator allows setting the profit of the signal. Under this signal, elevators authorise the adjustments of the delay and the scale of the base of time. Two constants located on the right of these elevators, make it possible respectively to fix the maximum values of these two parameters. The selection of the visualized channel as well as the choice of the visualization mode is done by two unrolling menus, located above the graph. 5
6 The part of right-hand side of the screen relates to the posting of measurements of amplitude and distance in the three gates. The affected colours allow a better correlation between the graph and these parameters. The piloting of the alarms represented by indicators will be described later on. The unrolling graph, located below these parameters, controls in the course of time the amplitudes acquired in the three gates. 6
7 The bottom part of the screen informs you about the significant parameters, which characterize the visualized signal (Gain, Delay...). These data indicate the current settings, and authorize the entry of a new value. The three gates are positioned by selecting a number, and entering the desired characteristics for each one. The adjustment of the gates is independent, and will be studied later on. The drop-down menu on left side makes possible to select the time mode or outdistances mode. 7
8 2-1- PAREMETER SETTING Any modifications of values are carried out easily using the mouse, or with the function key that is associated for ( F1 to F12). The high and low navigation keys make it possible to add or cut off the incrementing step associated to each displayed variable. This handling allows a finer adjustment. 8

9 3- GRAPHICAL PART DETAILS 3-1- VISUALIZATION MODES There are three visualization modes for the signal. 9
10 A-SCAN Mode. This representation makes it possible to detect the presence of a defect, to determine its position and to evaluate its reflection capacity. The signal then posted, is a signal digitized at 80MHz on the time base, and represented by 1000 samples. Moreover, a peaks capture system allows the measurement of the amplitudes with a precision equivalent to a sampling at very high frequency Remanent Mode. The characteristic of this function is to give priority to posting, in order to be able to carry out a visual monitoring at recurrence frequencies incompatible with our visual capacities. In that way, remanent visualization displays only one sequence every N, others are not lost, but sorted, to only post the best one (greatest echoes seen during the acquisition of the N A- scan not posted). N is settable by using the last variable, remanence length, which appears at the validation of this mode. 10
11 Using this representation, it is possible to visualize events that it would be difficult to see with a traditional posting. The efficiency of remanent visualization is a function of the speed of the computer MHz A-SCAN Mode. This visualization is the representation of the rectified signal, digitized at 80 MHz on the time base, on all the samples MHz RF Mode. The signal represented is the digitized signal at 80 MHz on the time base, and represented by all samples (digitalization point by point) SET CHANNEL. If your PC is equipped with several US-Key boards, you can independently set channels parameters, selecting, with the drop-down menu, the one you want to visualize SET GAIN. The gain of the receiver corresponds to the amplification applied to the signals from the transducer; for convenience reasons and standardization it is expressed in decibels. This parameter has a dynamics of 80 db, and is adjustable by two elevators. One is located on the right graph, the other below. The variable associated to the last one, makes possible to fix the maximum value accessible by the elevator. The variation step of this parameter is 0.1 db 3-4- SET DELAY. The elevator associated to this variable is located just below the graph and is represented with a green colour. This parameter is complementary to scale. It shifts the ultrasonic sequence towards the left in order to present at posting only a part of this one. The delay is expressed in millimetres or microsecond. The maximum value of the delay is a function of the scale. This value is calculated according the following low : 10*Scale + MaxDelay = 390 micro seconds. 11
12 4- PARAMETERS SETTING DETAILS GAIN. This parameter indicates the current value of the gain, and allows a finer adjustment of this parameter. This variable is accessible using the mouse, but also using the keyboard, in pressing the F1 function key that is associated to it DELAY. This parameter indicates the current value of the delay applied to the visualized signal. As for the gain, to reach this parameter that way allows a more precise adjustment. This variable is accessible using the key from F2 function, or the mouse. The delay is expressed in millimetres if the distance mode is selected or in micro second if the time mode is selected. This mode is in bottom left of the main panel SCALE. The posting scale defines the horizontal graduation on the screen; this one proves to be useful to calculate the depth of an ultrasonic indication. It is expressed in millimetre per division, if the distance mode is validated, but can also be posted in microsecond by division if you have chosen the time mode. 12
13 4-4- GATES. These four variables are closely dependent. According to the number of the selected gate, its position, its width, and its height are associated. The setting of the gates is completely independent, and each gate is represented by a distinct colour on the graph. First is modelled by the blue colour, second is associated to the green colour, and third to pink. These monitors cannot overlap. The units of these parameters depends also, of the mode (time or distance) selected Position. This parameter corresponds to the beginning of the temporal window in which will be carried out the real time processing of the ultrasonic signal. This variable is easily adjustable while acting on the function key that is associated to, or using the mouse. As each adjustment of monitor is independent, the function keys which are associated their characteristics are themselves different. The position is expressed in millimetre or microsecond according to the selected mode (time or distance) Width. The width of the monitor corresponds to the time during which the ultrasonic signals will be treated in real time and will measure positions, alarms and analogical outputs. The width is expressed in millimetre or microsecond according to the selected mode (time or distance). 13
14 Height. The height of the monitor fixes a level of amplitude above or below which the ultrasonic echoes will be treated different ways. The release of alarms can be regulated, a study of the menu will explain it later on (page 15 paragraph 4-6-2). This variable is always expressed as a percentage height of the screen. NB : You can use some cursors to adjust your gates.for each gates there are two cursors under the Ascan who allow you to adjust position and width. At the left of the Ascan a third cursor allows you to adjust the height of the gates the color of these cursors is the same of the gate. 14
15 5- DETAILS OF THE MENU PRINT. The printing of this panel is accessible by the small push rod, located on the left screen. A simple pressure launches an automatique impression For a better reading of prints, the colours inversion is automatic, in order to make the sheet printed as pleasant as possible 5-2- MODE CHOICE. The drop-down menu located on the left of the screen determines the display unit of the measurements (millimetres or micro seconds). The formula used is N(mm) = speed (m/s) * time (micro)/ The choice of the distance mode makes it possible to visualize the ultrasound speed. When distance mode is chosen, Calib button appears. This new function allows you to calibrate a new velocity and offset. 15

16 Calibration In the top right part, the curent distance 1 and distance 2 are displayed in function of curent velocity and offset. If these measures are wrong, you can enter the desired values in the blue windows and press Calibrate. At this moment, a new velocity and offset will be calculated to Recalibrate the measures. 16
, horizontal lengh (L) and depth (P) are displayed versus distance (d)")
17 Trigonometry Only for gate 1, after entering angle ( ) and thickness (mm), horizontal lengh (L) and depth (P) are displayed versus distance (d) 17
18 5-3- SPECTRUM. This image is the spectral representation of the RF signal and is used, amongst other things, to determine the resonance frequency of the sensor, and its bandwidth to -3 db, and -6 db. The cursor posted in this image is easily movable, you just have to seek the tool modelled by a white cross, to position it on the cursor, and to bring it to the frequency on the spectrum corresponding to the sensor. Thus, the values posted below the graph, will correspond to the characteristics of the sensor. This function can be used to control the state of the sensor you use. 18
19 5-4- GATES. The activation of this parameter involves the opening of a window under the graph that relates of the echo-start settings, and of the parameters such as the amplitude and alarms Amplitude. The amplitude measurement of the greatest echo present in the gate outputs as an analogical tension varying from 0 to 5V. If you want to measure the part of the echo behind the gate it is necessary to choose : "behind gate mesure"; if the entire amplitude is wished it is necessary to choose: "total amplitude measurement". To disable the measurement in a monitor, is possible by selecting "stop". 19

20 Alarmes releases. The alarms release is also programmable. It means that defect was detected in a gate. You can program this parameter so that an alarm corresponds to the detection of an echo in a gate, in this case it is necessary to choose the mode "Alarms on appears". If on the other-hand, an echo must always be present in a monitor, to its disappearance must correspond an alarm, it is then necessary to choose "Alarm on vanish". Last mode being not to carry out any control in a gate (you just have to set it to "Alarm stop"). Alarms are modelled by indicators, associated each monitor, that turn on by respecting the choice of release on each channel. 20

21 Number of strikes before alarm. This value makes it possible to make sure that the signal detected in the door is a real defect, and is not a parasite within the signal. Indeed it is necessary to wait to have N consecutive times the echo in the door to make sure that alarm truly corresponds to a defect. This number N is thus settable in this window and has a dynamics from 0 to Réglage Echo-start. When an immersed transducer is used, and you want to free the measurement from the variations of the water column between it and the part to examine, it is advised to use the function "echo-start". This function correctly set, synchronizes visualization as well as gates on the echo of entry in the object, whatever is the variations water column and events able to occur during the travel of the ultrasonic beam in water. The echo-start door thus defines a temporal space during which US-Key will seek an echo of synchronization. This time is determined by a start (INHIBITION) and duration; in this interval, any echo which amplitude is higher than 30% of the screen will be taken to synchronize the gates. 21
22 Inhibition : The inhibition of echo-start, is a temporal zone beginning with the emission and witch width is adjustable using this function. During this period, any event are ignored and are not taken as synchronization echo. Duration : The width of inhibition must be sufficient to avoid inopportune releases in water, but does not have to exceed the echo of synchronization (echo of entry). Once the system fixed on the entry of the part, all measurements, positions, widths, etc... Will have the echo of entry as time origin. Polarity : The ultrasonic signal resulting from a transducer being bipolar, it is appropriate to choose which alternation will be used for the release of the echo-start. The function "polarity" proposes the choice between the positive or negative half-wave. This choice must take place starting from the detailed examination of the echo of entry, the first alternation whose amplitude is generally the one it is necessary to use for synchronization. 22
23 Compensation Amplitude Distance 5-5- DAC. This function makes possible to compensate the amplitude of echoes at moments precise and selectable by the user. Actually, it adds, or cuts off a value from the gain into the visualized signals. DAC Curve is the layout point by point various gain along the time. Smoothing is an interpolation between the selected points. What thus avoids having a standard curve "crenel"? Using the DAC: To create a point, you just have to move the Y axis of the cursor to the chosen place for the first point, and then to take X axis of the cursor and increase or decrease the Gain. Incrementing or the decrementing the value of the gain determines the co-ordinates of a new or an existing point. DAC Curve with smoothing: 23
24 5-6- PULSER This menu allows the access to different parameters of the pulser such as tension, width, or frequency of recurrence Voltage. The function "Voltage" makes possible to modify the value of tension of the emission pulse. It determines the energy level transmitted to the transducer during the excitation. The voltage may vary from 0 with 230V by step of 5V. Note: It is advised to check the emission width after a modification of the power. 24
25 Emission width. The adjustment of the width of the emission pulse makes possible to adapt the frequency spectrum developed by the transmitting assembly to that of the transducer. Once this adaptation carried out, the transfer of energy between the transmitter and the transducer is maximum. This parameter can vary from 0 to 255. Note: To regulate the width of emission, an echo unsaturated should be posted. Enter width 0, and make vary until the amplitude of the echo passes by a maximum. The value of the width corresponding to this amplitude is the one that should be preserved. It is advised to adjust this parameter for each new transducer, or when setting a new value of the power Repetition Frequency. The recurrence frequency defines the number of ultrasonic shootings to produce in one second. The more this frequency is raised, the more the examination of the part is precise. This parameter cannot be regarded as intrinsic, because the choice of its value is always conditioned by the measurement environment (kinematic, acoustic...). This parameter can vary from 0.3 Khz to 20 Khz Phase Delay. Phase delay between transmissions, constitutes a significant function in the case of a use of multichannel system. Indeed, all the ultrasonic channels are automatically synchronized on the first one, if an acoustic configuration is not compatible with temporally simultaneous emissions, it is necessary to diphase some of them. This means to shift them regarding to channel 1. It is advised not to place a gate during the emission of another channel, elsewhere the cross talk phenomena may appear. 25

26 5-7- AUXILIARIES. This function gives the access to a panel that allows setting the filters applied to the signal, the polarity... The configuration of these parameters is essential to control an object into good conditions Filters. The electronic filters proposed in this menu are filters of RLC type witch quality factor is 1. This means that the bandwidth is equal to the central frequency (a filter of centre frequency 5 MHz will thus have a low cut-off frequency slightly higher than 3 MHz (logarithmic scale) and a high cut-off frequency slightly higher than 8 MHz). A position "broad band" is available for the use of deadened transducers. 26
27 Note: the frequencies available are: 1.25 MHz, 2.5 MHz, 5 MHz, 10 MHz, Broad band Standard of Alternation. The high frequency signal from the ultrasonic probe undergoes a rectification in order to facilitate its analysis; this operation can be done by three different ways: cut the negative part of the signal, and add it to positive part (rectification double-alternation), or withdraw the negative part (rectification simple-alternation) or finally withdraw the positive part and represent only the negative half-waves (rectification simple-alternation-negative). The modification of the polarity of the detector influences the whole data processing sequence of the signal, not only posting Report The report button gives access to a summary table of the whole settings on each channels. This screen could then be printed constantly. You can have two representations, either channel by channel, or all the gathered ways. Here an example of setting report on a mono-channel system: 27

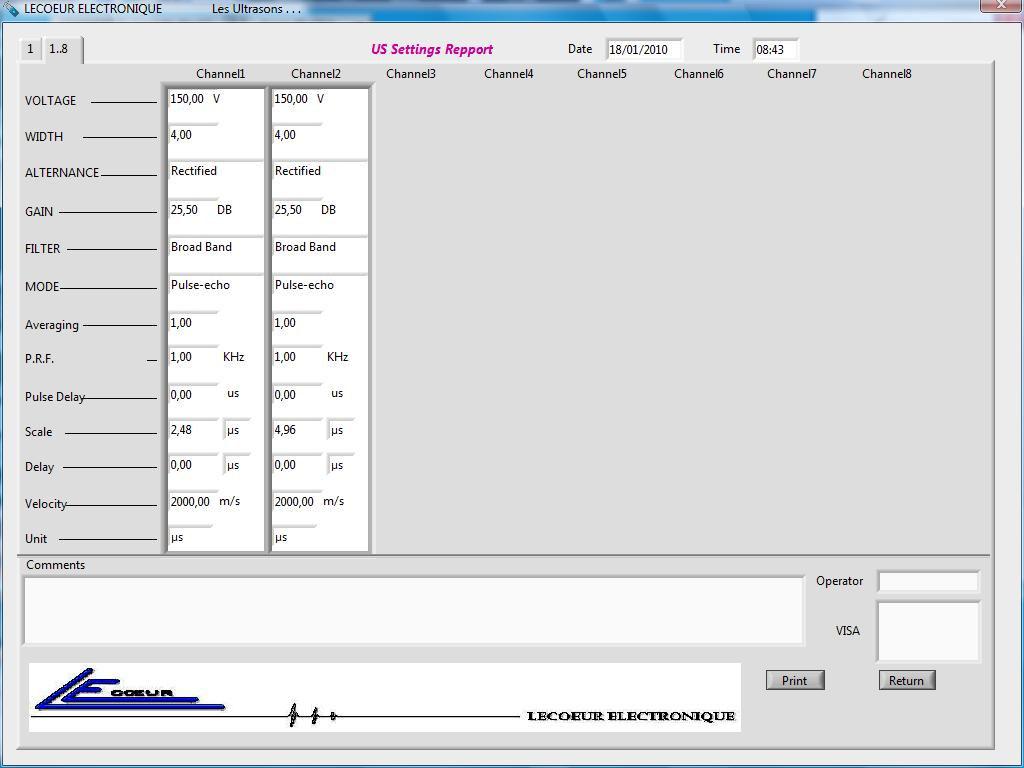
28 And then, on a multi-channel system: 28

29 Wizard The wizard option allows you to grow up the gain to 100 Db but only for the screen BSCAN The Bscan function allows an outline in Bscan unrolling of the Ascan signal. This option is particularly practical if you want to observe a variation in the signal, representative of the presence of a defect, or another variation of form. The current settings are always accessible, and the user can observe the Ascan signal refreshing on the bottom right of the screen. 29

30 5-9- ZOOM This function allows the user to get a bigger A-SCAN display. 30
31 5-10- SETUP This software can adapt to our whole products: Saphir board - saphir + board - onyx box - board ruby - US-BOX This is also in this menu that the parameter setting of the number of channels to be used is carried out. 31

32 In the case of a use of the system by several operator, the administrator will have the possibility of limiting the right of access to the various adjustments: Note: For more safety, the access to this type of parameter setting is protected by a password SAVE. The save makes possible to keep under a selected name the configuration of the channel in progress LOAD. The load of a configuration on a given channel is possible with this function. At that time, the system will require of you, if you wish to load the digitized A-scan. This makes possible to superimpose on the visualized signal, A-scan that was present at the screen at the moment of the save of this configuration. If you chose this functionality, to return to the visualization of your A-scan alone, you just have to strike key "ESC" DESTROY. This functionality can be use to destroy a configuration saved previously. 32

33 6- ALARMS DETAILS. The alarms colours allow a better correlation between the visualized signal, and the values measured in each gate. The indicators announcing possible alarms can be program by the menu with the "auxiliary" mode. This window thus makes it possible to know the amplitudes and the distances measured in each gate. The distances are expressed in millimetre, or in microsecond according to the selected mode distances" or "time". The amplitude is posted as a percentage of the screen. The unrolling graph makes it possible to visualize possible defects during control. The colours refer to the gates positioned on the graph 33
34 8 Additional functions Reject : this function cuts the feet of echoes to provide a cleaner display 34
35 Language : Select your language then validate : the next time you ll run US BOX the language will be updated 35
36 Saturation indicator: When the signal input is saturated lin base line is rased up 7 % This function is only available in filter mode not in broadband 36
Development and Application of 500MSPS Digitizer for High Resolution Ultrasonic Measurements
 Indian Society for Non-Destructive Testing Hyderabad Chapter Proc. National Seminar on Non-Destructive Evaluation Dec. 7-9, 2006, Hyderabad Development and Application of 500MSPS Digitizer for High Resolution
NDT Supply.com 7952 Nieman Road Lenexa, KS USA
 Smartor Ultrasonic Flaw Detector & Thickness Gauge One-hand Operation Smart Test Wizard Weld Simulation Advanced Conventional UT & Thickness Measurement SIUI s new Smartor is a combination ultrasonic testing
MULTI-CHANNEL ULTRASONIC FLAW DETECTOR ОКО-22М-UT THE BEST INDUSTRIAL OEM SOLUTION FOR IN-LINE AND IN-SERVICE SYSTEMS
 MULTI-CHANNEL ULTRASONIC FLAW DETECTOR ОКО-22М-UT THE BEST INDUSTRIAL OEM SOLUTION FOR IN-LINE AND IN-SERVICE SYSTEMS www.ndt.com.ua PURPOSE OKO-22M-UT PRO WIRELESS INTERFACE WI-FI The ОКО-22М-UT ultrasonic
SUPPERIOR MODERN PERFORMANCE
 ISONIC 2010 EL Entry Level Phased Array Ultrasonic Flaw Detection Package One-Touch Coverage and Smart Imaging Lightest weight / smallest size ever Phased Array / TOFD instrument PA Modality: 16:16 parallel,
ISONIC Superior Performance Portable Smart All-In-One Ultrasonic Flaw Detector and Recorder with A-, B-, CB-Scan, and TOFD Functionality
 Superior Performance Portable Smart All-In-One Ultrasonic Flaw Detector and Recorder with A-, B-, CB-Scan, and TOFD Functionality A-Scan TOFD SRUT GW - Short Range Guided Wave CHIME True-to-Geometry Flaw
Description of a device and software for precise sound velocity measurement
 R&D: Ultrasonic Technology / Fingerprint Recognition Przedsiębiorstwo Badawczo-Produkcyjne OPTEL Sp. z o.o. ul. Otwarta 10a PL 50-212 Wrocław tel.: +48 (71) 329 68 53 fax: 329 68 52 NIP 898-10-47-033 http://www.optel.pl
Guide to OPKUD and OPBOX Ultrasonic testing units Software Revision 3.0 / 2003
 R&D: Ultrasonic Technology / Fingerprint Recognition Przedsiębiorstwo Badawczo-Produkcyjne OPTEL Sp. z o.o. ul. Otwarta 10a PL 50-212 Wrocław tel.: +48 (71) 329 68 54 fax: 329 68 52 NIP 898-10-47-033 e-mail:
MFD900. The most industrial ultrasonic test system for flaw detection and thickness measurements
 MFD900 The most industrial ultrasonic test system for flaw detection and thickness measurements Guaranteed the lowest possible down time over many years. Pure ultrasonic testpower for high speed off- line
Using Frequency Diversity to Improve Measurement Speed Roger Dygert MI Technologies, 1125 Satellite Blvd., Suite 100 Suwanee, GA 30024
 Using Frequency Diversity to Improve Measurement Speed Roger Dygert MI Technologies, 1125 Satellite Blvd., Suite 1 Suwanee, GA 324 ABSTRACT Conventional antenna measurement systems use a multiplexer or
ULTRASONIC SIGNAL PROCESSING TOOLBOX User Manual v1.0
 ULTRASONIC SIGNAL PROCESSING TOOLBOX User Manual v1.0 Acknowledgment The authors would like to acknowledge the financial support of European Commission within the project FIKS-CT-2000-00065 copyright Lars
MFD900. The most industrial ultrasonic test system for flaw detection and thickness measurements
 MFD900 The most industrial ultrasonic test system for flaw detection and thickness measurements Guaranteed the lowest possible down time over many years. Pure ultrasonic testpower for high speed off- line
Effect of coupling conditions on ultrasonic echo parameters
 J. Pure Appl. Ultrason. 27 (2005) pp. 70-79 Effect of coupling conditions on ultrasonic echo parameters ASHOK KUMAR, NIDHI GUPTA, REETA GUPTA and YUDHISTHER KUMAR Ultrasonic Standards, National Physical
UNIVERSAL ULTRASONIC FLAW DETECTOR UD4-76. TOFD version.
 UNIVERSAL ULTRASONIC FLAW DETECTOR UD4-76 TOFD version www.ndt.com.ua PURSPOSE UD4-76 universal ultrasonic flaw detector-tomograph with large high-contrast TFT display is intended for products testing
Spectral Distance Amplitude Control for Ultrasonic Inspection of Composite Components
 ECNDT 26 - Mo.2.6.4 Spectral Distance Amplitude Control for Ultrasonic Inspection of Composite Components Uwe PFEIFFER, Wolfgang HILLGER, DLR German Aerospace Center, Braunschweig, Germany Abstract. Ultrasonic
Lesson 06: Pulse-echo Imaging and Display Modes. These lessons contain 26 slides plus 15 multiple-choice questions.
 Lesson 06: Pulse-echo Imaging and Display Modes These lessons contain 26 slides plus 15 multiple-choice questions. These lesson were derived from pages 26 through 32 in the textbook: ULTRASOUND IMAGING
ZONESCAN net Version 1.4.0
 ZONESCAN net.0 REV 1. JW ZONESCAN net 2 / 56 Table of Contents 1 Introduction... 5 1.1 Purpose and field of use of the software... 5 1.2 Software functionality... 5 1.3 Function description... 6 1.3.1
AN AUTOMATED ALGORITHM FOR SIMULTANEOUSLY DETERMINING ULTRASONIC VELOCITY AND ATTENUATION
 MECHANICS. ULTRASONICS AN AUTOMATED ALGORITHM FOR SIMULTANEOUSLY DETERMINING ULTRASONIC VELOCITY AND ATTENUATION P. PETCULESCU, G. PRODAN, R. ZAGAN Ovidius University, Dept. of Physics, 124 Mamaia Ave.,
MultiScan MS Tube Inspection System. Multi-technology System Eddy Current Magnetic Flux Leakage Remote Field IRIS Ultrasound
 MultiScan MS 5800 Tube Inspection System Multi-technology System Eddy Current Magnetic Flux Leakage Remote Field IRIS Ultrasound 920-107 MultiScan MS 5800 E Tube Inspection with Eddy Current Condensers
CRACKS DETECTION ON METAL PARTS BY ACOUSTIC EMISSION
 DELALANDE Christophe RENCKERT Olivier ZARIFE Victor CRACKS DETECTION ON METAL PARTS BY ACOUSTIC EMISSION 303 Abstract Control by acoustic emission during fitting of a bush in a metal part has been selected
MultiScan MS Tube Inspection System. Multi-technology System Eddy Current Magnetic Flux Leakage Remote Field IRIS Ultrasound
 MultiScan MS 5800 Tube Inspection System 920-107 Multi-technology System Eddy Current Magnetic Flux Leakage Remote Field IRIS Ultrasound MultiScan MS 5800 E Tube Inspection with Eddy Current Condensers
INTRODUCTION. Strong Performance: High resolution and penetration, achieving precise flaw detection
 Shantou Institute of Ultrasonic Instruments Co., Ltd. Add: 77 Jinsha Road, Shantou, Guangdong 515041, China Tel: 86-754-88250150 Fax: 86-754-88251499 Http://www.siui.com/ndt Product Data CTS-9009 Digital
Aerospatiale, Central Laboratory 12 rue Pasteur Suresnes, France
 INSPECTION SYSTEM FOR THE IN-SITU INSPECTION OF AIRCRAFT COMPOSITE STRUCTURES J.L. Arnaud, M. FIorei, and D.Lecuru Aerospatiale, Central Laboratory 12 rue Pasteur 92150 Suresnes, France I - INTRODUCTION
Fast, portable, user-friendly...the complete C-scan solution.
 Fast, portable, user-friendly......the complete C-scan solution. Designed for speed, portability, and performance, RapidScan2 has been developed as a versatile and user-friendly A, B and C-scan inspection
Keywords: Ultrasonic Testing (UT), Air-coupled, Contact-free, Bond, Weld, Composites
, Air-coupled, Contact-free, Bond, Weld, Composites") Single-Sided Contact-Free Ultrasonic Testing A New Air-Coupled Inspection Technology for Weld and Bond Testing M. Kiel, R. Steinhausen, A. Bodi 1, and M. Lucas 1 Research Center for Ultrasonics - Forschungszentrum
Single-Sided Contact-Free Ultrasonic Testing A New Air-Coupled Inspection Technology for Weld and Bond Testing M. Kiel, R. Steinhausen, A. Bodi 1, and M. Lucas 1 Research Center for Ultrasonics - Forschungszentrum
LOW FREQUENCY ACOUSTIC (IMPEDANCE) FLAW DETECTORS OF THE NEW GENERATION AND THEIR APPLICATION
 FLAW DETECTORS OF THE NEW GENERATION AND THEIR APPLICATION") 17th World Conference on Nondestructive Testing, 25-28 Oct 2008, Shanghai, China LOW FREQUENCY ACOUSTIC (IMPEDANCE) FLAW DETECTORS OF THE NEW GENERATION AND THEIR APPLICATION Abstarct Vladimir F. MUZHITSKY,
17th World Conference on Nondestructive Testing, 25-28 Oct 2008, Shanghai, China LOW FREQUENCY ACOUSTIC (IMPEDANCE) FLAW DETECTORS OF THE NEW GENERATION AND THEIR APPLICATION Abstarct Vladimir F. MUZHITSKY,
P a g e 1 ST985. TDR Cable Analyzer Instruction Manual. Analog Arts Inc.
 P a g e 1 ST985 TDR Cable Analyzer Instruction Manual Analog Arts Inc. www.analogarts.com P a g e 2 Contents Software Installation... 4 Specifications... 4 Handling Precautions... 4 Operation Instruction...
Raptor Operators Manual
 Raptor Operators Manual Important Information First and foremost, we at NDT Systems, Inc. would like to thank you for your purchase of the Raptor. The Raptor is a new category in Ultrasonic Flaw Detectors.
ISONIC PA AUT Spiral Scan Inspection of Tubular Parts Operating Manual and Inspection Procedure Rev 1.00 Sonotron NDT
 ISONIC PA AUT Spiral Scan Inspection of Tubular Parts Operating Manual and Inspection Procedure Rev 1.00 Sonotron NDT General ISONIC PA AUT Spiral Scan Inspection Application was designed on the platform
Module 1: Introduction to Experimental Techniques Lecture 2: Sources of error. The Lecture Contains: Sources of Error in Measurement
 The Lecture Contains: Sources of Error in Measurement Signal-To-Noise Ratio Analog-to-Digital Conversion of Measurement Data A/D Conversion Digitalization Errors due to A/D Conversion file:///g /optical_measurement/lecture2/2_1.htm[5/7/2012
Sonotron NDT 4, Pekeris str., Rabin Science Park, Rehovot, 76702, Israel Phone:++972-(0) Fax:++972-(0)
 Fax:++972-(0)") ISONIC 2010 Portable Ultrasonic Phased Array Flaw Detector and Recorder Phased Array 32:32 phased array electronics independently adjustable emitting and receiving aperture, parallel firing, A/D conversion,
ISONIC 2010 Portable Ultrasonic Phased Array Flaw Detector and Recorder Phased Array 32:32 phased array electronics independently adjustable emitting and receiving aperture, parallel firing, A/D conversion,
Technische Spezifikation (Technical Specification)
") Technical Specification ECHOGRAPH 9/9 Data for: Standard Version and [ m Version] valid for Option N = LF Version / Option SN = Super LF Version according to EN 2668-:2 valid from: 8 June 22 updated: 2
Technical Specification ECHOGRAPH 9/9 Data for: Standard Version and [ m Version] valid for Option N = LF Version / Option SN = Super LF Version according to EN 2668-:2 valid from: 8 June 22 updated: 2
A COMPARISON BETWEEN ASTM E588 AND SEP 1927 RELATING RESOLUTION LIMITS AT DETERMINATION OF THE PURITY GRADE
 19 th World Conference on Non-Destructive Testing 2016 A COMPARISON BETWEEN ASTM E588 AND SEP 1927 RELATING RESOLUTION LIMITS AT DETERMINATION OF THE PURITY GRADE Daniel KOTSCHATE 1, Dirk GOHLKE 1, Rainer
Standard Guide for Evaluating Performance Characteristics of Phased-Array Ultrasonic Testing Instruments and Systems 1
 Designation: E2491 08 Standard Guide for Evaluating Performance Characteristics of Phased-Array Ultrasonic Testing Instruments and Systems 1 This standard is issued under the fixed designation E2491; the
EE 422G - Signals and Systems Laboratory
 EE 422G - Signals and Systems Laboratory Lab 5 Filter Applications Kevin D. Donohue Department of Electrical and Computer Engineering University of Kentucky Lexington, KY 40506 February 18, 2014 Objectives:
S.K.Lalwani 1,a, G.D.Randale 1, V.H.Patankar 1, J.L.Singh 2, P.Jyothi 1, A.A.Agashe 1, R.K.Jain 1 and T.S.Ananthakrishnan 1
 Design, Development & Feasibility Trials of Multi-channel Ultrasonic Instrumentation for Accurate Measurement of Internal Diameter and Wall Thickness of Pressure Tubes of PHWR S.K.Lalwani 1,a, G.D.Randale
Structure of Speech. Physical acoustics Time-domain representation Frequency domain representation Sound shaping
 Structure of Speech Physical acoustics Time-domain representation Frequency domain representation Sound shaping Speech acoustics Source-Filter Theory Speech Source characteristics Speech Filter characteristics
Sonotron NDT 4, Pekeris str., Rabin Science Park, Rehovot, 76702, Israel. Portable Ultrasonic Phased Array Flaw Detector and Recorder
 ISONIC 2009 UPA-Scope Portable Ultrasonic Phased Array Flaw Detector and Recorder THE VERSATILITY OF ULTRASONICS Phased Array 64:64 phased array electronics independently adjustable emitting and receiving
Fast, portable, user-friendly...the complete C-scan solution.
 Fast, portable, user-friendly......the complete C-scan solution. Designed for speed, portability, and performance, RapidScan2 has been developed as a versatile and user-friendly A, B and C-scan inspection
Your first NMR measurement
 Your first NMR measurement Introduction Select 10mM water in D2O as NMR sample. The NMR spectrum of such sample consists of only two signals: the water signal and the peak of the reference (TSP). Follow
Rapid. Simplicity Capability Reliability
 Rapid Simplicity Capability Reliability Rapid Fast, portable, user-friendly......the complete C-scan solution. Designed for speed, portability and performance. RapidScan+ has been developed as a versatile
EXPERIMENT NUMBER 2 BASIC OSCILLOSCOPE OPERATIONS
 1 EXPERIMENT NUMBER 2 BASIC OSCILLOSCOPE OPERATIONS The oscilloscope is the most versatile and most important tool in this lab and is probably the best tool an electrical engineer uses. This outline guides
INSTRUCTION MANUAL FOR ULTRASONIC/MICROWAVE SENSORS
 INSTRUCTION MANUAL FOR ULTRASONIC/MICROWAVE SENSORS 1)Install PROBE_GatewayPC Software on PC.Remove previous installation. In Windows Control Panel go to the Programs and Features, select Probe_GatewayPC_Net
Pulse Doppler Flow-Dop
 EDUCATION Pulse Doppler Flow-Dop GAMPT-50100 User Manual Fon: +49 (0) 3461-278 691-0 Fax: +49 (0) 3461-278 691-101 email: info@gampt.de Gesellschaft für Angewandte Medizinische Physik und Technik mbh (GAMPT
High-Resolution Corrosion Monitoring for Reliable Assessment of Infrastructure
 19 th World Conference on Non-Destructive Testing 2016 High-Resolution Corrosion Monitoring for Reliable Assessment of Infrastructure André Lamarre 1 1 Olympus Scientific Solutions Americas, Quebec City,
PN9000 PULSED CARRIER MEASUREMENTS
 The specialist of Phase noise Measurements PN9000 PULSED CARRIER MEASUREMENTS Carrier frequency: 2.7 GHz - PRF: 5 khz Duty cycle: 1% Page 1 / 12 Introduction When measuring a pulse modulated signal the
9200 Series, 300 MHz Programmable Pulse Generator
 9200 Series, 300 MHz Programmable Pulse Generator Main Features Variable edge pulses (1 nsec to 1 msec) at rates to 250 MHz Fast 300 psec edges to 300 MHz Wide output swings to 32 V at pulse rates to 50
3.2 Measuring Frequency Response Of Low-Pass Filter :
 2.5 Filter Band-Width : In ideal Band-Pass Filters, the band-width is the frequency range in Hz where the magnitude response is at is maximum (or the attenuation is at its minimum) and constant and equal
Exercise 4. Angle Tracking Techniques EXERCISE OBJECTIVE
 Exercise 4 Angle Tracking Techniques EXERCISE OBJECTIVE When you have completed this exercise, you will be familiar with the principles of the following angle tracking techniques: lobe switching, conical
SonoLab Echo-I User Manual
 SonoLab Echo-I User Manual Overview: SonoLab Echo-I is a single board digital ultrasound pulse-echo solution. The system has a built in 50 volt high voltage generation circuit, a bipolar pulser, a transmit/receive
The Implementation of the New Standard EN ISO for Ultrasonic Phased-Array Systems at the Manufacturer
 19 th World Conference on Non-Destructive Testing 2016 The Implementation of the New Standard EN ISO 18563 for Ultrasonic Phased-Array Systems at the Manufacturer Johannes BUECHLER 1, Udo SCHLENGERMANN
Where DSP meets Measurement Science: A Sound Example. By Andrew Hurrell PhD
 Where DSP meets Measurement Science: A Sound Example By Andrew Hurrell PhD Measuring ultrasound why bother? 6 million ultrasound scans within NHS during 2004-2005 Ultrasound has potential for: Thermal
Technical Note 2. Standards-compliant test of non-ionizing electromagnetic radiation on radar equipment
 Technical Note 2 Standards-compliant test of non-ionizing electromagnetic radiation on radar equipment Technical Note: Standards-compliant test of non-ionizing electromagnetic radiation on radar equipment
Laboratory Experiment #1 Introduction to Spectral Analysis
 J.B.Francis College of Engineering Mechanical Engineering Department 22-403 Laboratory Experiment #1 Introduction to Spectral Analysis Introduction The quantification of electrical energy can be accomplished
Bird Model 7022 Statistical Power Sensor Applications and Benefits
 Applications and Benefits Multi-function RF power meters have been completely transformed since they first appeared in the early 1990 s. What once were benchtop instruments that incorporated power sensing
3D Distortion Measurement (DIS)
") 3D Distortion Measurement (DIS) Module of the R&D SYSTEM S4 FEATURES Voltage and frequency sweep Steady-state measurement Single-tone or two-tone excitation signal DC-component, magnitude and phase of
3D Distortion Measurement (DIS) Module of the R&D SYSTEM S4 FEATURES Voltage and frequency sweep Steady-state measurement Single-tone or two-tone excitation signal DC-component, magnitude and phase of
LV-Link 3.0 Software Interface for LabVIEW
 LV-Link 3.0 Software Interface for LabVIEW LV-Link Software Interface for LabVIEW LV-Link is a library of VIs (Virtual Instruments) that enable LabVIEW programmers to access the data acquisition features
Standard Guide for Evaluating Characteristics of Ultrasonic Search Units 1
 Designation: E 1065 99 An American National Standard Standard Guide for Evaluating Characteristics of Ultrasonic Search Units 1 This standard is issued under the fixed designation E 1065; the number immediately
Getting Started. MSO/DPO Series Oscilloscopes. Basic Concepts
 Getting Started MSO/DPO Series Oscilloscopes Basic Concepts 001-1523-00 Getting Started 1.1 Getting Started What is an oscilloscope? An oscilloscope is a device that draws a graph of an electrical signal.
Simulation of Ultrasonic Testing of Rail Wheel Face using Phased Array and DDF technique
 Simulation of Ultrasonic Testing of Rail Wheel Face using Phased Array and DDF technique Anand Desai, Ph.D. Abstract This paper presents a method of increasing the near surface resolution of a rail wheel
USB-UT350(T) Portable Ultrasonic Pulser/Receiver and Analog to Digital Converter. User s Guide
 Portable Ultrasonic Pulser/Receiver and Analog to Digital Converter. User s Guide") USB-UT350(T) Portable Ultrasonic Pulser/Receiver and Analog to Digital Converter User s Guide 2000-2009 US Ultratek, Inc. Revision 1.77 September 30, 2009 US Ultratek, Inc. 4070 Nelson Ave., Suite B Concord,
USB-UT350(T) Portable Ultrasonic Pulser/Receiver and Analog to Digital Converter User s Guide 2000-2009 US Ultratek, Inc. Revision 1.77 September 30, 2009 US Ultratek, Inc. 4070 Nelson Ave., Suite B Concord,
Confocal imaging on the Leica TCS SP8. 1) Turn the system on. 2) Use TCS user account. 3) Start LAS X software:
 Turn the system on. 2) Use TCS user account. 3) Start LAS X software:") Confocal imaging on the Leica TCS SP8 1) Turn the system on. 2) Use TCS user account. 3) Start LAS X software: 4) Do not touch the microscope while the software is initializing. Choose your options: Turn
Confocal imaging on the Leica TCS SP8 1) Turn the system on. 2) Use TCS user account. 3) Start LAS X software: 4) Do not touch the microscope while the software is initializing. Choose your options: Turn
ULTRASONIC FLAW DETECTOR +TOFD VERSION. CE MARKING EN Compliant
 ULTRASONIC FLAW DETECTOR U D 3-7 1 +TOFD VERSION CE MARKING EN 12668-1 Compliant PURPOSE UD3-71 flaw detector is an ultrasonic general-purpose flaw detector which is intended for: manual non-destructive
redefining the limits of ultrasound
 redefining the limits of ultrasound Non-Contact Ultrasonic Inspection for Continuous Feedback in Manufacturing JEC Europe Paris March 12, 2013 We will explore non-contact ultrasound (NCU), the advantages
IVI STEP TYPES. Contents
 IVI STEP TYPES Contents This document describes the set of IVI step types that TestStand provides. First, the document discusses how to use the IVI step types and how to edit IVI steps. Next, the document
Experiment 2: Electronic Enhancement of S/N and Boxcar Filtering
 Experiment 2: Electronic Enhancement of S/N and Boxcar Filtering Synopsis: A simple waveform generator will apply a triangular voltage ramp through an R/C circuit. A storage digital oscilloscope, or an
ZONESCAN net Version 1.4.1
 ZONESCAN net REV 3 JW ZONESCAN net 2 / 59 Table of Contents 1 Introduction... 5 1.1 Purpose and field of use of the software... 5 1.2 Software functionality... 5 1.3 Function description... 6 1.3.1 Structure...
TUD300 Ultrasonic Detector Operation Instructions
 Ultrasonic Detector Operation Instructions Beijing TIME High Technology Ltd. 1 Content Chapter I. Overview 4 1.1 How to Use the Instruction Manual 4 Chapter II Technical Parameters and Performance Features
TS9050/60. microgen. electronics TM FM Modulation and Spectrum Analyser
 TS9050/60 FM Modulation and Spectrum Analyser Introducing the TS9050 and TS9060, new and updated versions of the TS9000 NAB2004 Radio World Cool Stuff and The Radio Magazine Pick Hit award winner TS9050
Exercise 1-3. Radar Antennas EXERCISE OBJECTIVE DISCUSSION OUTLINE DISCUSSION OF FUNDAMENTALS. Antenna types
 Exercise 1-3 Radar Antennas EXERCISE OBJECTIVE When you have completed this exercise, you will be familiar with the role of the antenna in a radar system. You will also be familiar with the intrinsic characteristics
Advanced Test Equipment Rentals ATEC (2832)
") Established 1981 Advanced Test Equipment Rentals www.atecorp.com 800-404-ATEC (2832) Electric and Magnetic Field Measurement For Isotropic Measurement of Magnetic and Electric Fields Evaluation of Field
Established 1981 Advanced Test Equipment Rentals www.atecorp.com 800-404-ATEC (2832) Electric and Magnetic Field Measurement For Isotropic Measurement of Magnetic and Electric Fields Evaluation of Field
15, Route de Douchy CHUELLES - Tél. : Fax : US-Scan.
 US-Scan Page 1 sur 8 US-Scan GENERAL DESCRIPTION US-Scan is an ultrasound device with a single channel to transmit and receive ultrasonic waves. Its very small size and its advanced technology allows to
Experiment P01: Understanding Motion I Distance and Time (Motion Sensor)
") PASCO scientific Physics Lab Manual: P01-1 Experiment P01: Understanding Motion I Distance and Time (Motion Sensor) Concept Time SW Interface Macintosh file Windows file linear motion 30 m 500 or 700 P01
PASCO scientific Physics Lab Manual: P01-1 Experiment P01: Understanding Motion I Distance and Time (Motion Sensor) Concept Time SW Interface Macintosh file Windows file linear motion 30 m 500 or 700 P01
Novel Imaging Techniques for Defects Characterisation in Phased Array Inspection
 Novel Imaging Techniques for Defects Characterisation in Phased Array Inspection P. Rioux 1, F. Lachance 1 and J. Turcotte 1 1 Sonatest, Québec, Canada Phone: +1 418 683 6222, e-mail: sales@sonatest.com
SonaFlex. Set of Portable Multifunctional Equipment for Non-contact Ultrasonic Examination of Materials
 SonaFlex Set of Portable Multifunctional Equipment for Non-contact Ultrasonic Examination of Materials General Overview of the Testing Equipment SonaFlex is a unique intelligent ultrasonic testing system
Mach 5 100,000 PPS Energy Meter Operating Instructions
 Mach 5 100,000 PPS Energy Meter Operating Instructions Rev AF 3/18/2010 Page 1 of 45 Contents Introduction... 3 Installing the Software... 4 Power Source... 6 Probe Connection... 6 Indicator LED s... 6
RapidScan II Application Note General Composite Scanning
 RapidScan II Application Note General Composite Scanning RapidScan II General Composite Scanning Application Note Page 1 Applications The RapidScan system has been utilised for a wide range of inspections
ACOUSTIC MICRO IMAGING ANALYSIS METHODS FOR 3D PACKAGES
 ACOUSTIC MICRO IMAGING ANALYSIS METHODS FOR 3D PACKAGES Janet E. Semmens Sonoscan, Inc. Elk Grove Village, IL, USA Jsemmens@sonoscan.com ABSTRACT Earlier studies concerning evaluation of stacked die packages
ULTRASCOPE USB, ULTRAWOOD. all the power of a. the palm of your
 ULTRASCOPE USB ULTRASCOPE USB, all the power of a high-end system in the palm of your hand. Ultrascope USB is the single-channel ultrasound system with highest performance in its market range. Its easy
Audio Analyzer R&S UPV. Up to the limits
 44187 FIG 1 The Audio Analyzer R&S UPV shows what is possible today in audio measurements. Audio Analyzer R&S UPV The benchmark in audio analysis High-resolution digital media such as audio DVD place extremely
SECTION 2 BROADBAND RF CHARACTERISTICS. 2.1 Frequency bands
 SECTION 2 BROADBAND RF CHARACTERISTICS 2.1 Frequency bands 2.1.1 Use of AMS(R)S bands Note.- Categories of messages, and their relative priorities within the aeronautical mobile (R) service, are given
ISO INTERNATIONAL STANDARD. Non-destructive testing Ultrasonic inspection Evaluating electronic characteristics of ultrasonic test instruments
 INTERNATIONAL STANDARD ISO 12710 First edition 2002-09-15 Non-destructive testing Ultrasonic inspection Evaluating electronic characteristics of ultrasonic test instruments Essais non destructifs Contrôle
SpinCore RadioProcessor LabVIEW Extensions
 NMR Interface User's Manual SpinCore Technologies, Inc. http:// Congratulations and thank you for choosing a design from SpinCore Technologies, Inc. We appreciate your business! At SpinCore we try to fully
Federal Communications Commission Office of Engineering and Technology Laboratory Division
 April 9, 2013 Federal Communications Commission Office of Engineering and Technology Laboratory Division Guidance for Performing Compliance Measurements on Digital Transmission Systems (DTS) Operating
EMBEDDED DOPPLER ULTRASOUND SIGNAL PROCESSING USING FIELD PROGRAMMABLE GATE ARRAYS
 EMBEDDED DOPPLER ULTRASOUND SIGNAL PROCESSING USING FIELD PROGRAMMABLE GATE ARRAYS Diaa ElRahman Mahmoud, Abou-Bakr M. Youssef and Yasser M. Kadah Biomedical Engineering Department, Cairo University, Giza,
Troubleshooting Common EMI Problems
 By William D. Kimmel, PE Kimmel Gerke Associates, Ltd. Learn best practices for troubleshooting common EMI problems in today's digital designs. Industry expert William Kimmel of Kimmel Gerke Associates
A Turnkey Weld Inspection Solution Combining PAUT & TOFD
 A Turnkey Weld Inspection Solution Combining PAUT & TOFD INTRODUCTION With the recent evolutions of the codes & standards, the replacement of conventional film radiography with advanced ultrasonic testing
Noise Measurements Using a Teledyne LeCroy Oscilloscope
 Noise Measurements Using a Teledyne LeCroy Oscilloscope TECHNICAL BRIEF January 9, 2013 Summary Random noise arises from every electronic component comprising your circuits. The analysis of random electrical
ULTRASONIC FLAW DETECTOR Velograph II
 VELOG LTD PASSPORT MANUAL ULTRASONIC FLAW DETECTOR Velograph II LONDON MOSCOW, 2018 1. General information...3 1.1. Purpose... 3 1.2. Basic principles of use... 3 2. Equipment and accessories...5 2.1.
Photon Counters SR430 5 ns multichannel scaler/averager
 Photon Counters SR430 5 ns multichannel scaler/averager SR430 Multichannel Scaler/Averager 5 ns to 10 ms bin width Count rates up to 100 MHz 1k to 32k bins per record Built-in discriminator No interchannel
UCE-DSO212 DIGITAL OSCILLOSCOPE USER MANUAL. UCORE ELECTRONICS
 UCE-DSO212 DIGITAL OSCILLOSCOPE USER MANUAL UCORE ELECTRONICS www.ucore-electronics.com 2017 Contents 1. Introduction... 2 2. Turn on or turn off... 3 3. Oscilloscope Mode... 4 3.1. Display Description...
AV4051 Series Signal Analyzer
 AV4051 Series Signal Analyzer 3Hz~4GHz/9GHz/13.2GHz/18GHz/26.5GHz/40GHz/45GHz/50GHz Product Overview: AV4051 series signal analyzer have the advantages of broad bandwidth, high resolution, high dynamic
Data Communication. Chapter 3 Data Transmission
 Data Communication Chapter 3 Data Transmission ١ Terminology (1) Transmitter Receiver Medium Guided medium e.g. twisted pair, coaxial cable, optical fiber Unguided medium e.g. air, water, vacuum ٢ Terminology
Power Supply Rejection Ratio Measurement
 Power Supply Rejection Ratio Measurement Using the Bode 100 and the Picotest J2120A Line Injector www.telesplicing.com.tw +886-2-27053146 sales@telesplicing.com.tw Page 2 of 10 Table of Contents 1 EXECUTIVE
Determination of the width of an axisymmetric deposit on a metallic pipe by means of Lamb type guided modes
 Acoustics 8 Paris Determination of the width of an axisymmetric deposit on a metallic pipe by means of Lamb type guided modes M. El Moussaoui a, F. Chati a, F. Leon a, A. Klauson b and G. Maze c a LOMC
Ultrasonic Level Detection Technology. ultra-wave
 Ultrasonic Level Detection Technology ultra-wave 1 Definitions Sound - The propagation of pressure waves through air or other media Medium - A material through which sound can travel Vacuum - The absence
Signal Generators for Anritsu RF and Microwave Handheld Instruments
 Measurement Guide Signal Generators for Anritsu RF and Microwave Handheld Instruments BTS Master Spectrum Master Tracking Generator Option 20 Vector signal Generator Option 23 Anritsu Company 490 Jarvis
ERC Recommendation 54-01
 ERC Recommendation 54-01 Method of measuring the maximum frequency deviation of FM broadcast emissions in the band 87.5 to 108 MHz at monitoring stations Approved May 1998 Amended 13 February 2015 Amended
Notes on OR Data Math Function
 A Notes on OR Data Math Function The ORDATA math function can accept as input either unequalized or already equalized data, and produce: RF (input): just a copy of the input waveform. Equalized: If the
ULTRASONIC IMAGING of COPPER MATERIAL USING HARMONIC COMPONENTS
 ULTRASONIC IMAGING of COPPER MATERIAL USING HARMONIC COMPONENTS T. Stepinski P. Wu Uppsala University Signals and Systems P.O. Box 528, SE- 75 2 Uppsala Sweden ULTRASONIC IMAGING of COPPER MATERIAL USING
Technical Datasheet UltraScope USB
 Technical Datasheet UltraScope USB www.daselsistemas.com Revision INDEX 1 CHANNELS... 3 2 PULSER... 3 3 RECEIVER... 4 4 FILTERS... 4 5 TRIGGER MODES... 5 6 SIGNAL PROCESSING... 5 7 CONTROL SIGNALS... 6