ELE 635 Communication Systems. Assignment Problems and Solutions
|
|
|
- Shanna Jennings
- 5 years ago
- Views:
Transcription
1 ELE 635 Communication Systems Assignment Problems and Solutions Winter 2015
2 CONTENTS Assignment 1: Signals and Signal Space 1.1 Problems Solutions... 3 Assignment 2: Analysis and Transmission of Signals 2.1 Problems Solutions Assignment 3: Sampling 3.1 Problems Solutions Assignment 4: Amplitude Modulations and Demodulations 4.1 Problems Solutions Assignment 5: Angle Modulation and Demodulation 5.1 Problems Solutions Assignment 6: Effects of Noise in Communication Systems 6.1 Problems Solutions i
3 Note Assignment problems shown in this document are from the 3rd Edition of the course reference text. Mapping of assignment problems from this earlier edition to problems in the 4th Edition is shown on pages (iii) (viii). ii
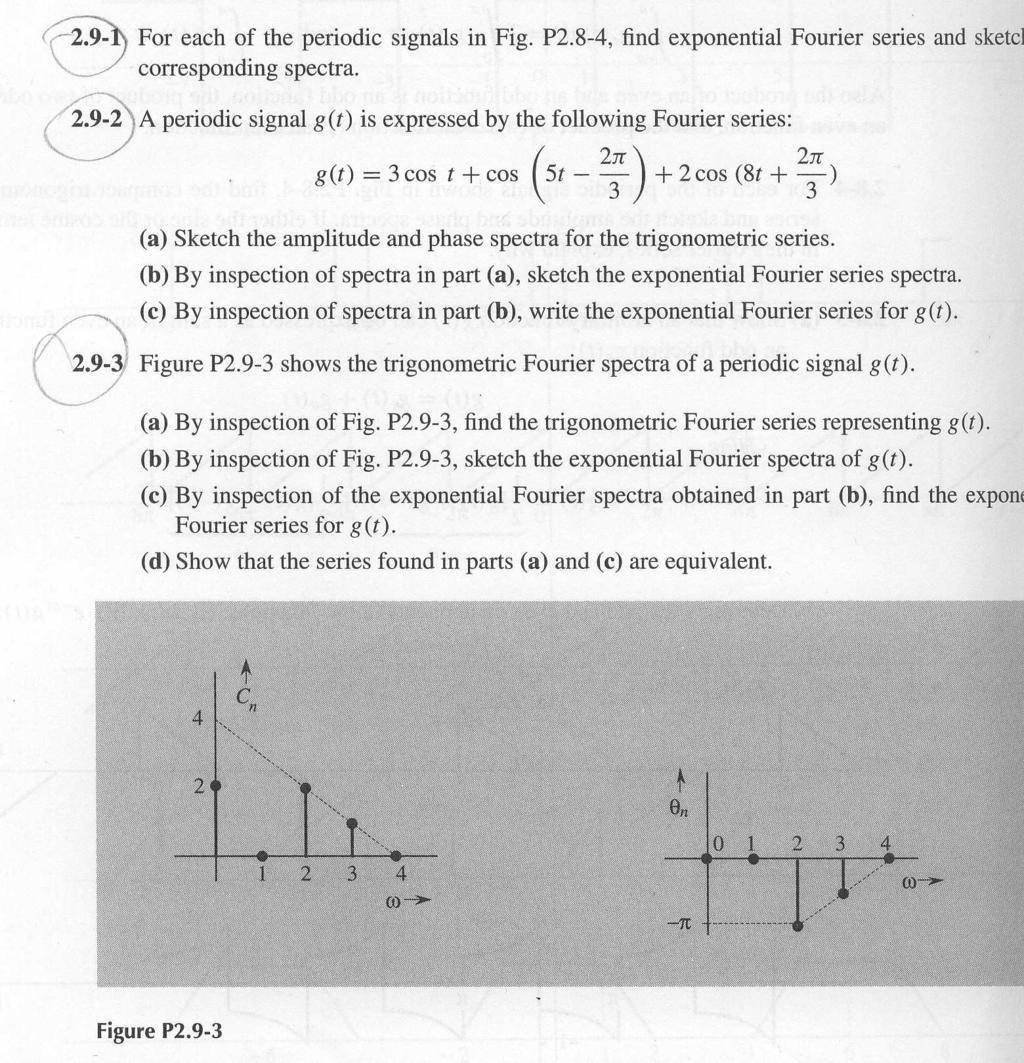
4 (2.1-1) Find the energies of the signals: a) sin t, 0 t π b) sin t, 0 t π c) 2 sin t, 0 t π d) sin (t-2π), 2π t 4π Problems from the 3 rd edition Comment on the effect on energy of sign change, time shifting or doubling of the signal. What is the effect on the energy if the signal is multiplied by k? (2.9-2) of the 3 rd edition is the same as (2.9-2) of 4 th edition with the following change: (2.9-3) Figure below shows the trigonometric Fourier spectra of a periodic signal g(t). a) By inspection of the figure, find the trigonometric Fourier series representing g(t). b) By inspection of the figure, sketch the exponential Fourier spectra of g(t). c) By inspection of the exponential Fourier spectra obtained in part (b), find the exponential Fourier series of g(t). Show that the series found in parts (a) and (c) are equivalent. (3.1-5) of the 3 rd edition is the same as (3.1-4) of the 4 th edition (3.1-7) of the 3 rd edition is the same as (3.1-6) of the 4 th edition with the following changes: Figure (a): bandwidth = π/2; Figure (b): bandwidth=. (3.2-2) Show that the Fourier transform of rect (t-5) is.
5 (3.3-6) of the 3 rd edition is the same as (3.3-6) of the 4 th edition with the following changes: Figures (b) and (c): Frequency range is from π to 3π (3.3-7) Using the frequency-shifting property, find the inverse Fourier transform of the following spectra: a) ) + ) b) ) + ) (3.3-10) of the 3 rd edition is the same as (3.3-9) of the 4 th edition with the following change: Bandwidth of the filter is W rad/sec (3.4-1) = (3.4-2) 4 th edition (3.5-3) Determine the maximum bandwidth of a signal that can be transmitted through the lowpass RC filter in fig. 3.28a with R=1000 and C=10-9 if, over this bandwidth, the amplitude response (gain) variation is to be within 5% and the time delay variation is to be within 2%. (6.1-1) = (6.1-1) 4 th edition with the following change: Figure (b) bandwidth = 15,000 Hz (6.1-2) Determine the Nyquist sampling rate and the Nyquist sampling interval for the signals: (a) ; (b) ; (c) ; (d) ; (e). (6.1-4) A signal is sampled (using uniformly space impulses) at a rate of (i) 5 Hz; (ii) 10 Hz; (iii) 20 Hz. For each of the three cases: a) Sketch the sampled signal. b) Sketch the spectrum of the sampled signal. c) Explain whether you can recover the signal g(t) from the sampled signal. d) If the sampled signal is passed through an ideal low-pass filter of bandwidth 5 Hz, sketch the spectrum of the output signal. (6.2-2) = (6.2-1) 4 th edition (6.2-9) = (6.2-10) 4 th edition with the following change:
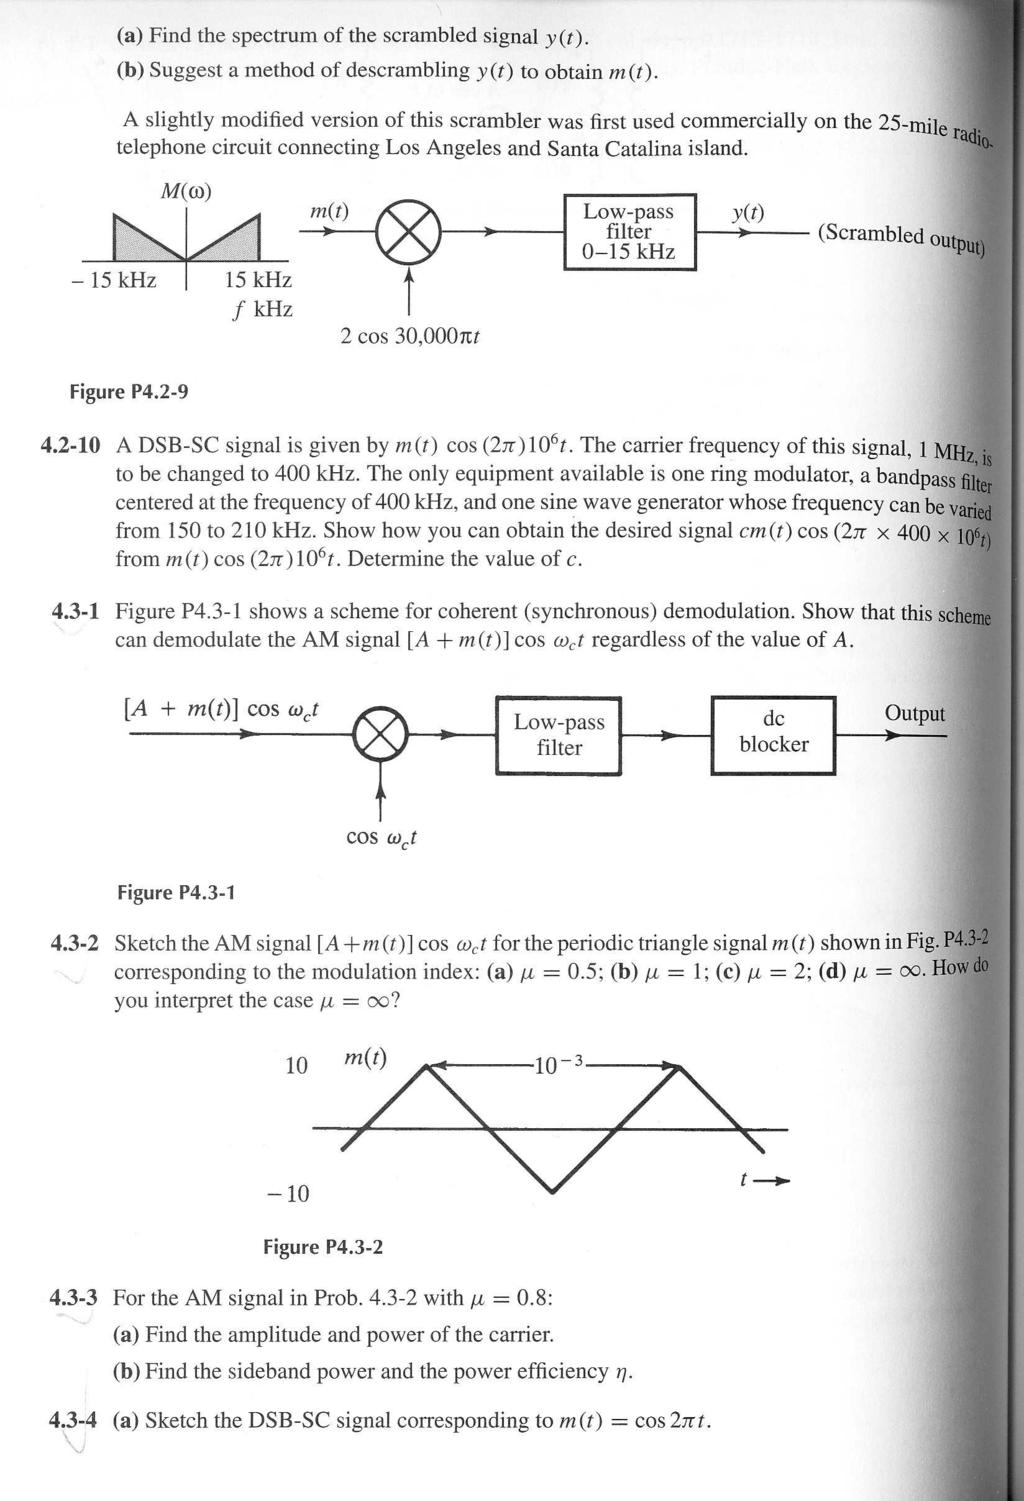
6 Sample rate = 50% higher than the Nyquist rate (6.2-10) = (6.2-11) 4 th edition with the following change: 10-bit quantizer; (4.2-1) For each of the following baseband signals: (i) (ii) (iii) : a) Sketch the spectrum of m(t). b) Sketch the spectrum of the DSB-SC signal. c) Identify the upper sideband (USB) and the lower sideband (LSB) spectra. d) Identify the frequencies in the baseband, and the corresponding frequencies in the DSB- SC, USB, and LSB spectra. Explain the nature of frequency shifting in each case. (4.2-2) Repeat Prob [parts (a), (b), and (c) only] if: (i) (ii) ; (iii). Observe that delayed by 1 second. For the last case you need to consider both the amplitude and the phase spectra. (4.2-3) Repeat Prob [parts (a), (b), and (c) only] for if the carrier is. (4.2-4) = (4.2-3) 4 th edition (4.2-6) = (4.2-5) 4 th edition (4.3-1) Show that coherent (synchronous) demodulation can demodulate the AM signal regardless of the value of A. (4.3-2) = (4.3-3) 4 th edition (4.3-3) For the AM signal in Prob with : a) Find the amplitude and power of the carrier. b) Find the sideband power and the power efficiency η. (4.3-4) a) Sketch the DSB-SC signal corresponding to.
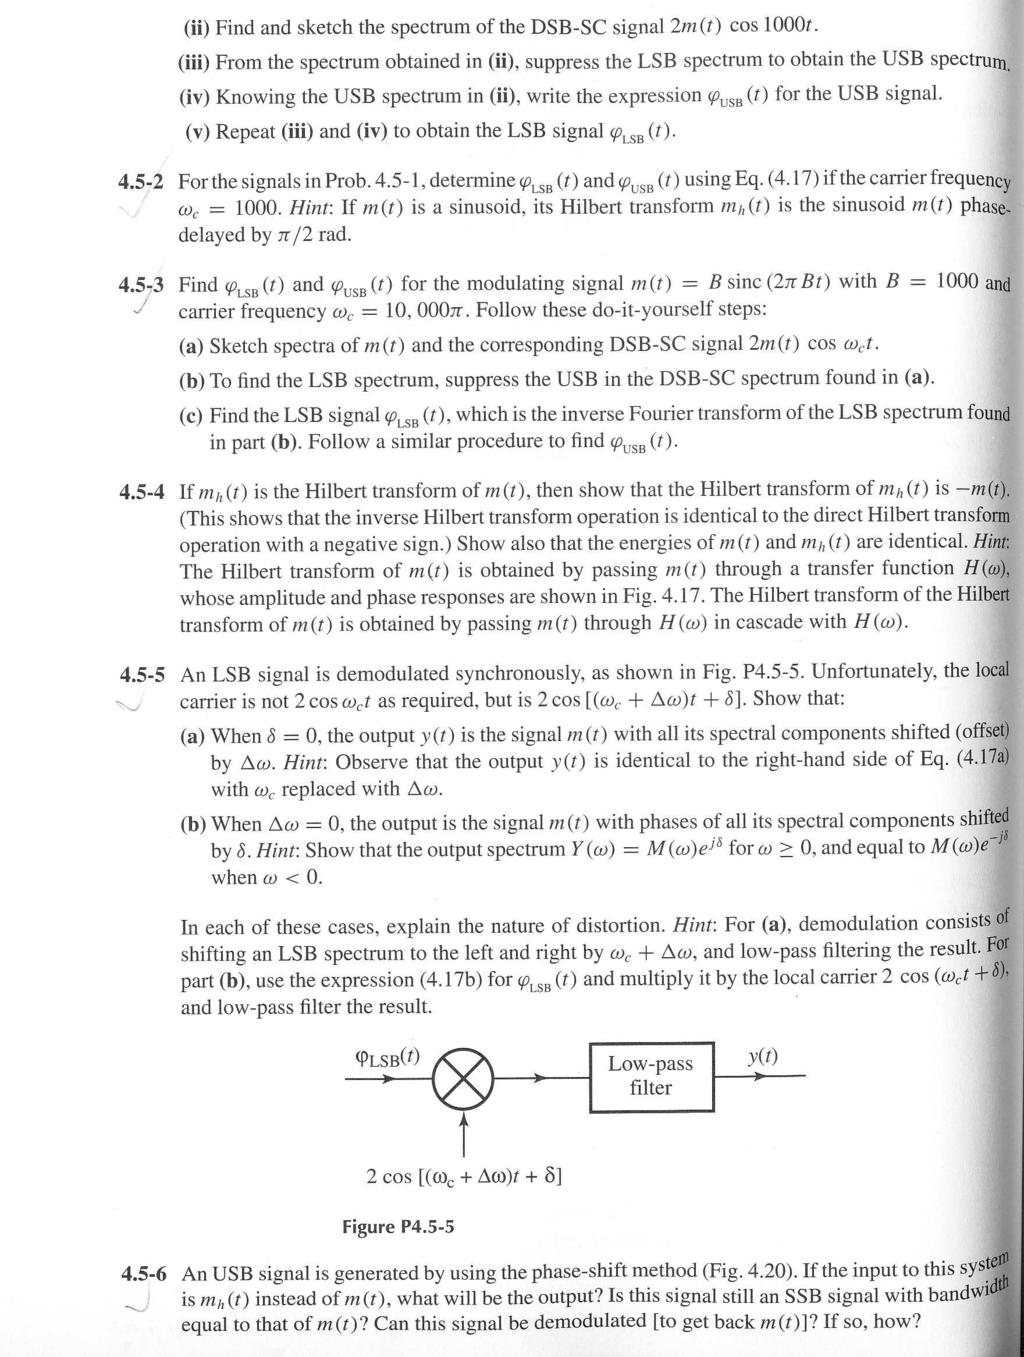
7 b) This DSB-SC signal is applied at the input of an envelope detector. Show that the output of the envelope detector is not, but. Show that, in general, if an AM signal is envelope-detected, the output is. Hence, show that the condition for recovering m(t) from the envelope detector is for all t. (4.5-1) A modulating signal is given by: a) b) c) In each case: i. Sketch the spectrum of ii. Find and sketch the spectrum of the DSB-SC signal. iii. From the spectrum obtained in (ii), suppress the LSB spectrum to obtain the USB spectrum. iv. Knowing the USB spectrum in (ii), write the expression for the USB signal. v. Repeat (iii) and (iv) to obtain the LSB signal. (4.5-2) For the signals in Prob , determine and if the carrier frequency. (4.5-3) Find and for the modulating signal with B= 1000 and carrier frequency Following this do it yourself steps: a) Sketch spectra of and the corresponding DSB-SC signal. b) To find the LSB spectrum, suppress the USB in the DSB-SC spectrum found in (a). c) Find the LSB signal, which is the inverse Fourier transform of the LSB spectrum found in part(b). Follow the similar procedure to find. (4.5-5) An LSB signal is demodulated synchronously. Unfortunately, the local carrier is not t as required, but is t +. Show that: a) When, the output y(t) is the signal m(t) with all its spectral components shifted (offset) by. b) When, the output is the signal m(t) with phases of all its spectral components shifted by In each of these cases, explain the nature of distortion. (4.5-6) = (4.4-7) 4 th edition
8 (4.8-1) A transmitter transmits an AM signal with a carrier frequency of 1500 khz. When an inexpensive radio receiver (which has a poor selectivity in its RF-stage bandpass filter) is tuned to 1500 khz, the signal is heard loud and clear. This same signal is also heard (not as strong) at another dial setting. State, with reasons, at what frequency you will hear this station. The IF frequency is 455 khz. (4.8-2) Consider a superheterodyne receiver designed to receive the frequency band of 1 to 30 MHz with IF frequency 8 MHz. What is the range of frequencies generated by the local oscillator for this receiver? An incoming signal with carrier frequency 10 MHz is received at the 10 MHz setting. At this setting of the receiver we also get interference from a signal with some other carrier frequency if the receiver RF stage bandpass filter has poor selectivity. What is the carrier frequency of the interfering signal? (5.1-3) = (5.1-4) 4 th edition with the following change: (5.2-1) = (5.2-3) 4 th edition with the following change in : (5.2-2) = (5.2-4) 4 th edition (5.2-3)=(5.2-5) 4 th edition (5.2-4)=(5.2-6) 4 th edition (5.2-5) Estimate the bandwidth of and in Prob Assume the bandwidth of to be the fifth harmonic frequency of. (5.2-7)=(5.2-8) 4 th edition with the following change:. (5.3-1)=(5.3-2) 4 th edition (5.3-2)=(5.3-1) 4 th edition (11.1-4) Determine and for the random process: where ω and θ are constants and a is an RV uniformly distributed in the range (-A, A). Also determine whether this is a wide-sense stationary process. (11.1-8)=(9.1-9) 4 th edition (11.2-3)=(9.2-4) 4 th edition with the following change:
9 (12.2-1) = (10.2-1) 4 th edition with the following changes: (11.5-1)=(9.8-1) 4 th edition ; signal bandwidth=4 khz; SNR>30dB;. (11.5-2) =(9.8-2) 4 th edition with (c). (11.5-3)=(9.8-3) 4 th edition (12.1-1) A certain telephone channel has over the signal band. The message signal PSD is. The channel noise PSD is. If the output SNR at the receiver is required to be at least 30dB, what is the minimum transmitted power required? Calculate the value of corresponding to this power. (12.2-2)=(10.2-2) 4 th edition (12.2-3)=(10.2-6) 4 th edition (12.2-4)=(10.2-3) 4 th edition (12.3-1)=(10.3-1) 4 th edition with the following changes:.
10 1. ASSIGNMENT Assignment 1 Problems : Show that the power of a signal g(t) given by n g(t) = D k e jω kt ω i ω k for all i k k=m is (Parseval s theorem) n P g = D k : Determine the power and the rms value for each of the following signals: (a) 10 cos(100t + π/3) (b) 10 cos(100t + π/3) + 16 sin(150t + π/5) (c) ( sin 3t) cos 10t (d) 10 cos 5t cos 10t (e) 10 sin 5t cos 10t (f) e jαt cos ω 0 t k=m
11 1. Assignment 1 2
12 1. Assignment Assignment 1 Solutions Let us denote the signal in question by g(t) and its energy by E g. For parts (a) and (b) E g = 2π 0 sin 2 tdt = 1 2 4π 2π (c) E g = sin 2 tdt = 1 2π 2 2π [ 1 (d) E g = (2 sin t) 2 dt = dt 1 2 4π 2π 2π 0 2π 0 dt 1 2 dt 1 2 cos(2t) dt = π + 0 = π 4π 2π 2π 0 cos(2t) dt = π + 0 = π ] cos(2t) dt = 4[π + 0] = 4π Sign change and time shift do not affect the signal energy. Doubling the signal quadruples its energy. In the same way, we can show that the energy of kg(t) is k 2 E g : 1 T/2 P g = lim g(t) g 1 T/2 n n (t)dt = lim D k D T T T/2 T T re j(ω k ω r )t T/2 k=m r=m The integrals of the cross-product terms (when k r) are finite because the integrands are periodic signals (made up of sinusoids). These terms, when divided by T, yields zero. The remaining terms (k = r) yields 1 lim T T T/2 n n D k 2 dt = D k 2 T/2 k=m k=m (a) Power of a sinusoid of amplitude C is C 2 /2 (Eq. frequency (ω 0) and phase. Therefore, in this case, P = (10) 2 /2 = 50. (2.6a)) regardless of its (b) Power of a sum of sinusoids is equal to the sum of the powers of the sinusoids (Eq. (2.6b)). Therefore, in this case, P = (10) 2 /2 + (16) 2 /2 = 178. (c) ( sin 3t) cos 10t = 10 cos 10t + sin 13t sin 3t. Hence, from (Eq. (2.6b)), P = (10) 2 /2 + 1/2 + 1/2 = 51 (d) 10 cos 5t cos 10t = 5(cos 5t + cos 15t). Hence, P=25; (e) 10 sin 5t cos 10t = 5(sin 15t sin 5t). Hence, P=25; (f) e jαt cos ω 0 t = 1/2[e j(α+ω 0)t + e j(α ω 0) ]. Using the results obtained in Prob , we obtain P = 1/4 + 1/4 = 1/ Using the fact that g(x)δ(x) = g(0)δ(x), we have (a) 0, (b) 2δ(ω) (c) 1 δ(t) (d) 9 2 1δ(t 1) (e) 1 δ(ω + 3) (f) kδ(ω) (use L Hopital s rule). 5 2 j In these problems remember that impulse δ(x) is located at x = 0. impulse δ(t τ) is located at τ = t, and so on. Thus, an
13 1. Assignment 1 4 (a) The impulse is located at τ = t and g(τ) at τ = t is g(t). Therefore, g(τ)δ(t τ)dτ = g(t) (b) The impulse δ(τ) is at τ = 0 and g(t τ) at τ = 0 is g(t). Therefore, δ(τ)g(t τ)dτ = g(t) Using similar arguments, we obtain (c) 1, (d) 0, (e) e 3, (f) 5, (g) g( 1) (h) e (a) T 0 = 4, ω 0 = π/2. Also, D 0 = 0 (by inspection), D n = 1 2π 1 1 e j(nπ/2)t dt 3 1 e j(nπ/2)t dt = 2 πn sin nπ 2 n 1 (b) T 0 = 10π, ω 0 = 2π/10π = 1/5. (c) g(t) = D n = 1 π e j n 5 t dt = 10π π g(t) = D 0 + n= D n = 1 2π n= j 2πn D n e j n 5 t where ( 2j sin nπ 5 ) = 1 πn sin ( nπ 5 D n e jnt where by inspection D 0 = 0.5 2π 0 t 2π e jnt dt = j 2πn so that D n = 1 2πn and D n = π/2 when n > 0 and π/2 when n < 0. (d) T 0 = π, ω 0 = 2 and D 0 = 0. D n = 1 π π/4 π/4 g(t) = (e) T 0 = 3, ω 0 = 2π 3. g(t) = D n = (f) T 0 = 6, ω 0 = π 3, and D 0 = n= D n e j2nt where 4t π e j(2n)t dt = j ( 2 πn sin πn πn 2 n= 2πn j t e 3 t dt = 3 4π 2 n 2 D n e j 2πn 3 t where ) πn cos 2 [ ( ) ] 2πn j j2πn e ) D n = 1 6 [ 1 2 (t + 2)e j πnt g(t) = dt n= D n e j πnt 3 where πnt 2 ] πnt j j e 3 dt + ( t + 2) e 3 dt 1 = 3 ( cos nπ π 2 n 2 3 ) 2nπ cos 3
14 1. Assignment 1 5 Fig. 1.1: Solution
15 1. Assignment (a) ( g(t) = 3 cos t + sin 5t π ) ( 2 cos 8t π ) 6 3 For a compact trigonometric form, all terms must have cosine form and amplitudes must be positive. For this reason, we rewrite g(t) as ( g(t) = 3 cos t + cos 5t π 6 π ) 2 ( = 3 cos t + cos 5t 2π ) + 2 cos cos (8t π ) 3 π ) ( 8t 4π 3 (b) By inspection of the trigonometric spectra in Fig.2a, we plot the exponential spectra as shown in Fig.2b. By inspection of exponential spectra in Fig.2a, we obtain g(t) = 3 ( e jt + e jt) + 1 [ e j(5t 2π/3) + e j(5t 2π/3)] + [ e j(8t 4π/3) + e j(8t 4π/3)] 2 2 = 3 ( ) 1 2 ejt + 2 e j2π/3 e j5t + ( e j4π/3) e j8t + 3 ( ) 1 2 e jt + 2 ej2π/3 e j5t + ( e j4π/3) e j8t Fig. 1.2: Solution (a) g(t) = cos(2t π) + cos(3t π/2) = 2 2 cos(2t) + sin(3t) (b) The exponential spectra are shown below. (c) By inspection of exponential spectral, g(t) = 2 + [ e (2t π) + e j(2t π)] + 1 [ e j(3t π/2) + e j(3t π/2)] 2 = cos(2t π) + cos(3t π/2)
16 1. Assignment 1 7 (d) Observe that the two expressions (trigonometric and exponential Fourier series) are equivalent. Fig. 1.3: Solution
17 2. ASSIGNMENT Assignment 2 Problems 3.2-2: From the definition of Fourier Transform, show that the Fourier transform of rect(t 5) is sinc(ω/2)e j5ω
18 2. Assignment 2 9
19 2. Assignment 2 10
20 2. Assignment 2 11
21 2. Assignment Assignment 2 Solutions (a) G(ω) = 1 0 4e jωt dt e jωt dt = 4 2e jω 2e j2ω jω (b) G(ω) = 0 τ t τ e jωt dt + τ 0 t τ e jωt dt = 2 [cos ωτ + ωτ sin ωτ 1] τω2 This results could also be derived by observing that g(t) is an even function. Therefore, from the result in Prob , G(ω) = 2 τ τ 0 t cos ωt dt = 2 [cos ωτ + ωτ sin ωτ 1] τω (a) g(t) = 1 π/2 cos ω e jωt dω = 2π π/2 e jωt (jt cos ω + sin 2π(1 t 2 ω)π/2 π/2 ) = 1 πt cos π(1 t 2 ) 2 (b) g(t) = 1 ω0 G(ω)e jωt dω = 1 [ ω0 ω0 ] G(ω) cos ωtdω + j G(ω) sin ωtdω 2π ω 0 2π ω 0 ω 0 Because G(ω) is even function, the second integral on the right-hand side vanishes. Also the integrand of the first term is an even function. Therefore, g(t) = 1 π ω0 0 ω ω 0 cos tω dω = 1 πω 0 t 2 [cos ω 0t + ω 0 t sin ω 0 t 1] The function rect(t 5) is centered at t = 5, has a width of unity, and its value over this interval is unity. Hence G(ω) = Fig.(b) g 1 (t) = g( t) and e jωt dt = 1 jω e jωt = 1 jω [e j4.5ω e j5.5ω ] = e j4.5ω jω [ejω/2 e jω/2 ] = e j5ω jω [2j sin ω ( ω 2 ] = sinc 2 G 1 (ω) = G( ω) = 1 ω 2 [e jω + jω e jω 1] ) e j5ω Fig.(c) g 2 (t) = g(t 1) + g 1 (t 1). Therefore G 3 (ω) = [G(ω) + G 1 (ω)]e jω = [G(ω) + G( ω)]e jω = 2e jω ω 2 [cos ω + ω sin ω 1]
22 2. Assignment 2 13 Fig.(d) g 3 (t) = g(t 1) + g 1 (t + 1) and ) G 4 (ω) = G(ω)e jω + G( ω)e jω = 1 ω 2 [2 2 cos ω] = 4 ω 2 sin2 ω 2 = sinc2 ( ω 2 Fig.(e) g 4 (t) = g(t 1/2) + g 1 (t + 1/2). Therefore G 4 (ω) = G(ω)e jω/2 + G 1 (ω)e jω/2 = e jω/2 = 1 [ 2ω sin ω ] ( ) ω = sinc ω ω 2 [e jω jωe jω 1] + ejω/2 ω 2 [e jω + jωe jω 1] Fig.(f) g 5 (t) can be obtained in three steps: (i) time-expanding g(t) by a factor 2; (ii) then delaying it by 2 seconds; (iii) and multiplying it by 1.5 (we may interchange the sequence for steps (i) and (ii)]. The first step (time0expansion by a factor 2) yields ( t f 2) Second step of time delay of 2 secs, yields, ( ) t 2 f 2 2G(2ω) = 1 2ω 2 (ej2ω 2jωe j2ω 1) 1 2ω 2 (ej2ω 2jωe j2ω 1)e j2ω = 1 2ω 2 (1 j2ω e j2ω ) The third step of multiplying the resulting signal by 1.5 yields ( ) t 2 g 5 (t) = 1.5f 2 3 4ω 2 (1 j2ω e j2ω )
23 2. Assignment 2 14
24 2. Assignment 2 15
25 2. Assignment 2 16
26 Assignment 2 17
27 3. ASSIGNMENT Assignment 3 Problems
28 3. Assignment 3 19
29 3. Assignment 3 20
30 3. Assignment : A message signal m(t) is transmitted by binary PCM without compression. If the SNR (signal-to-quantization-noise ratio) is required to be at least 47 db, determine the minimum value of L required, assuming that m(t) is sinusoidal. Determine the SNR obtained with this minimum L : The output SNR of a 10-bit PCM (N = 10) was found to be 30 db. The desired SNR is 42 db. It was decided to increase the SNR to the desired value by increasing the number of quantization levels L. Find the required number of levels.
31 3. Assignment Assignment 3 Solutions : The bandwidth of g 1 (t) and g 2 (t) are 100 khz and 150 khz, respectively. Therefore, : the Nyquist sampling rates for g 1 (t) is 200 khz, sampling interval T s = 1/200k = 5µs the Nyquist sampling rates for g 2 (t) is 300 khz, sampling interval T s = 1/300k = 3.33µs. the bandwidth of g 2 1(t) is 200 khz, f Nyq = 400 khz, f Nyq = 1/400k = 0.25µs. the bandwidth of g 3 2(t) is 450 khz, f Nyq = 900 khz, f Nyq = 1/900k = 1.11µs. the bandwidth of g 1 (t) g 2 (t) is 250 khz, f Nyq = 500 khz, f Nyq = 1/500k = 2µs. since ( ) ω sinc(100πt) 0.01rect 200π the bandwidth of this signal is 100 π rad/s or 50 Hz. The Nyquist rate is 100 Hz (samples/sec). ( ) ω sinc 2 (100πt) π the bandwidth of this signal is 200 π rad/s or 100 Hz. The Nyquist rate is 200 Hz (samples/sec). ( ) ( ) ω ω sinc(100πt) + sinc(50πt) 0.01rect rect 200π 100π the bandwidth of the first term on the right-hand side is 50 Hz and the second term is 25 Hz. Clearly the bandwidth of the composite signal is the higher of the two, that is, 100 Hz. The Nyquist rate is 200 Hz (samples/sec). ( ) ( ) ω ω sinc(100πt) + 3sinc 2 (60πt) 0.01rect π 240π the bandwidth of the first term is 50 Hz and that of the second term is 60 Hz. The bandwidth of the sum is the higher of the two, that is, 60 Hz. The Nyquist sampling rate is 120 Hz. ( ) ( ) ω ω sinc(50πt) 0.02rect sinc(100πt) 0.01rect 100π 200π The two signals have BW 25 Hz and 50 Hz respectively. The spectrum of the product of two signals is 1/(2π) times the convolution of their spectra. From width property of the convolution, the width of the convoluted signals is the sum of the widths of the signals convolved. Therefore, the BW of the product is 25+50=75 Hz. The Nyquist rate is 150 Hz.
32 3. Assignment : The pulse train is a periodic signal with fundamental frequency 2B Hz. Hence, ω s = 2π(2B) = 4πB. The period is T 0 = 1/(2B). It is an even function of t. Hence, the Fourier series for the pulse train can be expressed as p Ts (t) = C 0 + C n cos nω s t Using Eqs. (2.72), we obtain, n=1 a 0 = C 0 = 1 T 0 1/16B 1/16B dt = 1 4 and Hence a n = C n = 2 T 0 1/16B 1/16B ḡ(t) = g(t)p Ts (t) = 1 4 g(t) + cos nω s t dt = 2 nπ sin ( nπ 4 n=1 2 nπ sin ( nπ 4 ) ; b n = 0 ) g(t) cos nω s t : The BW of the signal g(t) is 5 Hz (10π rad/s), since the FT as below: ( ) ω g(t) = sinc 2 (5πt) G(ω) = π Therefore, the Nyquist rate is 10 Hz, and the Nyquist interval is T = 1/10 = 0.1s. Fig. 3.1: Solution for
33 3. Assignment 3 24 When f s = 5Hz, the spectrum 1 G(ω) repeats every 5 Hz (10π rad/sec). The T successive spectra overlap, and the spectrum G(ω) is not recoverable from Ḡ(ω), that is, g(t) cannot be recovered from its samples. If the sampled signal is passed through an ideal lowpass filter of BW 5 Hz, the output spectrum is rect(ω/20π), and the output signal is 10sinc(20πt), which is not the desired signal sinc 2 (5πt). When f s = 10Hz, the spectrum Ḡ(ω)consists of back-to-back, nonoverlapping repetition of 1 G(ω) repeating every 10 Hz. Hence, G(ω) can be recovered from Ḡ(ω) T using an ideal lowpass filter of BW 5 Hz (Fig.1(f)), and the output is 10sinc 2 (5πt). in the last case of oversampling (f s = 20 Hz), with empty band between successive cycles. Hence, G(ω) can be recovered from Ḡ(ω) using an ideal lowpass filter or even a practical lowpass filter. The output is 20sinc 2 (5πt) : This scheme is analyzed fully in Problem 3.4-1, where we found the bandwidth of y 1 (t), y 2 (t), and y(t) to be 10 khz, 5 khz, and 15 khz, respectively. Hence, the Nyquist rates for the three signals are 20 khz, 10 khz, and 30 khz, respectively : (a) When the input to this filter is b(t), the output of the summer is δ(t) δ(t T ). This acts as the input to the integrator. And, h(t), the output of the integrator is h(t) = t 0 [δ(t) δ(t T )] dτ = u(t) u(t T ) = rect The impulse response h(t) is shown in the figure below. ( ) t T/2 T (b) The transfer function of this circuit is ( ωt H(ω) = T sinc 2 ) e jωt/2 and ( H(ω) = T ωt sinc 2 ) : (a): the bandwidth is 15 khz. The Nyquist rate is 30 khz. (b): = 2 16, so that 16 binary digits are needed to encode each sample. (c): 30, = 480, 000 bits/s. (d): 44, = 705, 600 bits/s.
34 3. Assignment 3 25 Fig. 3.2: Solution for
35 4. ASSIGNMENT Assignment 4 Problems
36 4. Assignment 4 27
37 4. Assignment 4 28
38 4. Assignment 4 29
39 4. Assignment 4 30
40 4. Assignment 4 31
41 4. Assignment Assignment 4 Solutions 4.2-1:, For m(t) = cos 1000t, ψ DSB SC (t) = m(t) cos 10, 000t = cos 1000t cos 10, 000t = 1 [cos 9000t+cos 11, 000t] 2 where the first term is LSB part, the second term is USB part. For m(t) = 2 cos 1000t + cos 2000t, ψ DSB SC (t) = m(t) cos 10, 000t = [2 cos 1000t + cos 2000t] cos 10, 000t = cos 9000t + cos 11, 000t + 1 [cos 8000t + cos 12, 000t] 2 = [cos 9000t + 1 ] 2 cos 8000t + [cos 11, 000t + 1 ] 2 cos 12, 000t where the first bracket includes LSB part, and the second USB part. For m(t) = cos 1000t cos 3000t, ψ DSB SC (t) = m(t) cos 10, 000t = 0.5 [cos 2000t + cos 4000t] cos 10, 000t = 1 2 [cos 8000t + cos 12, 000t] + 1 [cos 6000t + cos 14, 000t] 2 = 1 2 [cos 8000t + cos 6000t] + 1 [cos 12, 000t + cos 14, 000t] 2 where the first bracket includes LSB part, and the second USB part : The relevant plots are shown in Fig. S : The relevant plots are shown in Fig. S : (a) The signal at point b is [ 3 g a (t) = m(t) cos 3 ω c t = m(t) 4 cos ω ct + 1 ] 4 cos 3ω ct The term 3 4 cos ω ct is the desired modulated signal, whose spectrum is centered at ±ω c. The remaining term 1 4 cos 3ω ct is the unwanted term, which represents the modulated signal with carrier frequency 3ω c with spectrum centered at ±3ω c, as shown in Fig. S The bandpass filter centered at ±ω c allows to pass the desired term 3 4 cos ω ct, but suppresses the unwanted term 1 4 cos 3ω ct. Hence, this system works as desired with the output 3 4 cos ω ct. (b) Fig. S4.2-4 shows the spectra at point b and c. (c) The minimum usable value of ω c is 2πB in order to avoid spectral folding at dc.
42 4. Assignment 4 33 Fig. 4.1: Solution for Fig. 4.2: Solution for
43 4. Assignment 4 34 (d) m(t) cos 2 ω c t = m(t) 2 [1 + cos 2ω ct] = 1 2 m(t) m(t) cos 2ω ct 1 This signal at point b consists of the baseband signal m(t) and a modulated signal 1 m(t) cos 2ω 2 ct, which has a carrier frequency 2ω c, not the desired value ω c. both the components will be suppressed by the filter, whose center frequency is ω c. Hence, this system will not do the desired job. (e) The reader may verify that the identity for cos nω c t contains a term cos ω c t when n is odd. This is not true when n is even. Hence, the system works for a carrier cos n ω c t only when n is odd. 2 Fig. 4.3: Solution for The resistance of each diode is r ohms while conducting, and when off. When the carrier A cos ω c t is prositive, the diodes conduct (during the entire positive half cycle), and when the carrier is negative, the diodes are open (during the entire negative half cycle). Thus, during the positive half cycle, the voltage R/(R + r)φ(t) appears across each of the resistor R. During the negative half cycle, the output voltage is zero. Therefore, the diodes act as a gate in the circuit that is basically a voltage divider with a gain 2R/(R+r). The output is therefore, e o (t) = 2R R + r w(t)m(t) The period of w(t) is T 0 = 2π/ω c. Hence, from Eq. (2.75), w(t) = [ cos ω c t 1 π 3 cos 3ω ct + 1 ] 5 cos 5ω ct + The output e o (t) is e o (t) = 2R R + r w(t)m(t) = 2R [ 1 R + r m(t) ( cos ω c t 1 π 3 cos 3ω ct + 1 )] 5 cos 5ω ct + (a) If we pass the output e o (t) through a bandpass filter (centered at ω c ), the filter suppresses the signal m(t) and m(t) cos nω c t for all n 1, leaving only the modulated term 4R m(t) cos ω π(r+r) ct intact. Hence, the system acts as a modulator.
44 4. Assignment 4 35 (b) The same circuit can be used as a demodulator if we use a bandpass filter at the output. In this case, the input is φ(t) = m(t) cos ω c t and the output is 4R m(t). π(r+r) g a (t) = [A + m(t)] cos ω c t. Hence, g b (t) = [A + m(t)] cos 2 ω c t = 1 2 [A + m(t)] [A + m(t)] cos 2ω ct The first term is a lowpass signal because its spectrum is centered at ω = 0. The lowpass filter allows this term to pass, but suppresses the second term, whose spectrum is centered at ±2ω c. Hence, the output of the lowpass filter is y(t) = A + m(t) When this signal is passed through a DC block, the DC term A is suppressed yielding the output m(t). This shows that the system can demodulate AM signal regardless of the value of A. This is a synchronous or coherent demodulation.
45 4. Assignment (a) (b) (c) (d) µ = 0.5 = m p A = 10 A A = 20 µ = 1.0 = m p A = 10 A A = 10 µ = 2.0 = m p A = 10 A A = 5 µ = = m p A = 10 A A = 0 This means that µ = represents the DSB-SC case.
46 4. Assignment 4 37
47 4. Assignment In Fig. 4.14, when the carrier is cos[( ω)t + δ] or sin[( ω)t + δ], we have x 1 (t) = 2[m 1 (t) cos ω c t + m 2 (t) sin ω c t] cos[(ω c + ω)t + δ] Similarly, = 2m 1 (t) cos ω c t cos[(ω c + ω)t + δ] + 2m 2 (t) sin ω c t cos[(ω c + ω)t + δ] = m 1 (t){cos[( ω)t + δ] + cos[(2ω c + ω)t + δ]} +m 2 (t){sin[(2ω c + ω)t + δ] sin[( ω)t + δ]} x 2 (t) = m 1 (t){sin[(2ω c + ω)t + δ] + sin[( ω)t + δ] +m 2 (t){cos[( ω)t + δ] cos[(2ω c + ω)t + δ]} After x 1 (t) and x 2 (t) are passed through lowpass filter, the outputs are m 1(t) = m 1 (t) cos[( ω)t + δ] m 2 (t) sin[( ω)t + δ] m 2(t) = m 1 (t) sin[( ω)t + δ] + m 2 (t) cos[( ω)t + δ] To generate a DSB-SC signal from m(t), we multiply m(t) with cos ω c t. However, to generate the SSB signals of the same relative magnitude, it is convenient to multiply m(t) with 2 cos ω c t. This also avoids the nuisance of the fractions 1/2, and yields the DSB-SC spectrum M(ω ω c ) + M(ω + ω c ). We suppress the USB spectrum (above ω c and below ω c ) to obtain the LSB spectrum. Similarly, to obtain the USB spectrum, we suppress the LSB spectrum (between ω c and ω c ) from the DSB-SC spectrum. Fig.S4.5-1 a,b, and c show the three cases. (a) From Fig.a, we can express ψ LSB (t) = cos 900t and ψ USB (t) = cos 1100t. (b) From Fig.b, we can express ψ LSB (t) = 2 cos 700t + cos 900t and ψ USB (t) = cos 1100t + 2 cos 1300t. (b) From Fig.c, we can express ψ LSB (t) = 0.5[cos 400t+cos 600t and ψ USB (t) = 0.5[cos 1400t+ 2 cos 1600t].
48 4. Assignment 4 39
49 4. Assignment (a) Fig. S4.5-3a shows the spectrum of m(t) and Fig.S4.5-3b shows the corresponding DSB-SC spectrum 2m(t) cos 10, 000πt. (b) Fig.S4.5-3c shows the corresponding LSB spectrum obtained by suppressing the USB spectrum. (c) Fig.S4.5-3d shows the corresponding USB spectrum obtained by suppressing the LSB spectrum. We now find the inverse Fourier transforms of the LSB and USB spectra from Table 3.1 (pair 18) and the frequency shifting property as ψ LSB (t) = 1000sinc(1000πt) cos 9000πt ψ USB (t) = 1000sinc(1000πt) cos 11000πt The incoming SSB signal at the receiver is given by [Eq. (4.17b)] ψ LSB (t) = m(t) cos ω c t + m h (t) sin ω c t Let the local carrier be cos[(ω c + ω)t + δ]. The product of the incoming signal and the local carrier is e d (t), given by e d (t) = ψ LSB (t) cos[(ω c + ω)t + δ] = 2[m(t) cos ω c t + m h (t) sin ω c t] cos[(ω c + ω)t + δ] The lowpass filter suppresses the sum frequency component centered at the frequency (2ω c + ω), and passes only the difference frequency component centered at the frequency
50 4. Assignment 4 41 ω. Hence, the filter output e o (t) is given by e o (t) = m(t) cos[( ω)t + δ] m h (t) sin[( ω)t + δ] Observe that if both ω and δ are zero, the output is given by e o (t) = m(t) as expected. If only δ = 0, then the output is given by e o (t) = m(t) cos( ω)t m h (t) cos( ω)t This is an USB signal corresponding to a carrier frequency ω as shown in Fig. S5.5-5b. This spectrum is the same as the spectrum M(ω) with each frequency component shifted by a frequency ω. This changes the sound of an audio signal slightly. For voice signals, the frequency shift within ±20Hz is considered tolerable. Most US systems, however, restrict the shift to ±2Hz. (b) When only ω = 0, the lowpass filter output is e o (t) = m(t) cos δ m h (t) sin δ We now show that this is a phase distortion, where each frequency component of M(ω) is shifted in phase by amount δ. The Fourier transform of this equation yields E o (ω) = M(ω) cos δ M h (ω) sin δ
51 4. Assignment 4 42 But from Eq.(4.14b) jm(ω) ω > 0 M h (ω) = jsgn(ω)m(ω) = M(ω) ω < 0 and M(ω)e jδ ω > 0 E o (ω) = M(ω)e jδ ω < 0 It follows that the amplitude spectrum of e o (t) is M(ω). The same as that for m(t). But the phase of each component is shifted by δ. Phase distortion generally is not a serious problem with voice signals, because the human ear is somewhat insensitive to phase distortion. Such distortion may change the quality of speech, but the voice is still intelligible. In video signals and data transmissions, however, phase distortion may be intolerable We showed in Prob that the Hilbert transform of m h (t) is m(t). Hence, if m h (t) (instead of m(t)) is applied at the input in Fig.4.20, the USB output is ( y(t) = m h (t) cos ω c t m(t) sin ω c t = m(t) cos ω c t + π ) ( + m h (t) sin ω c t + π ) 2 2 Thus, if we apply m h (t) at the input of the Fig.4.20, the USB output is an LSB signal corresponding to m(t). The carrier also acquires a phase shift π/2. Similarly, we can show that if we apply m h (t) at the input of the Fig.4.20, the LSB output would be an USB signal corresponding to m(t) (with a carrier phase shifted by π/2) From Eq. (4.20) H o (ω) = 1 H i (ω + ω c ) + H i (ω ω c ) ω 2πB Fig.S4.6-1a shows H i (ω ω c ) and H i (ω + ω c ). Fig. S4.6-1b shows the reciprocal, which is H o (ω) A station can be heard at its allocated frequency 1500 khz as well as at its image frequency. The two frequencies are 2f IF Hz apart. In the present case, f IF = 455 khz. hence, the image frequency is = 910 khz apart. Therefore, the station will also be heard if the receiver is tuned to frequency =590 khz. The reason for this is as follows.when the receiver is tuned to 590 khz, the local oscillator frequency is f LO = = 1045 khz. Now this frequency f LO is multiplied with the incoming signal of frequency f c = 1500 khz. The output yields the two modulated signals whose carrier frequencies are the sum and difference frequencies, which are =2545 khz and =455 khz. The sum carrier is suppressed, but the difference carrier passes through, and the station is received.
52 4. Assignment The local oscillator generates frequencies in the range 1+8=9 Mhz. When the receiver setting is 10Mhz, f LO = 10+8 = 18 Mhz. Now, if there is a station at 18+8 = 26 Mhz, it will beat (mix) with f LO = 18 Mhz to produce two signals centered at 26+18=44 Mhz and at 26-18=8 Mhz. The sum component is suppressed by the IF filter, but the difference component, which is centered at 8 Mhz, passes through the IF filter.
53 5. ASSIGNMENT Assignment 5 Problems
54 5. Assignment 5 45
55 5. Assignment 5 46
56 5. Assignment Assignment 5 Solutions 5.1-1: In this case, f c = 10 MHz, m p = 1 and m p = For FM: f = k f m p /2π = 2π 10 5 /2π = 10 5 Hz. Also, f c = Hence, (f i ) max = = 10.1 MHz, and (f i ) min = = 9.9 MHz. The carrier frequency increases linearly from 9.9 MHz to 10.1 MHz over a quarter (rising) cycle of duration a seconds. For the next a seconds, when m(t) = 1, the carrier frequency remains at 10.1 MHz. Over the next quarter (the falling) cycle of duration a, the carrier frequency decreases linearly from 10.1 MHz to 9.9 MHz, and over the last quarter cycle, when m(t) = 1, the carrier frequency remains at 9.9 MHz. This cycles repeat periodically with the period 4a seconds as shown in Fig.1. For PM: f = k p m p/2π = 50π 8000/2π = Hz. Also, (f i ) max = = 10.2 MHz, and (f i ) min = = 9.8 MHz. Fig. 1b shows ṁ(t). We conclude that the frequency remains at 10.2 MHz over the (rising) quarter cycle, where ṁ(t) = For the next a second, ṁ(t) = 0, and the carrier frequency remains at 10 MHz. Over the next a seconds, where ṁ(t) = 8000, the carrier frequency remains at 9.8 MHz. Over the last quarter cycle, ṁ(t) = 0 again, and the carrier frequency remains at 10 MHz. This cycles repeat periodically with the period 4a seconds as shown in Fig.1. Fig. 5.1: Solution for : In this case, f c = 1 MHz, m p = 1 and m p = For FM: f = k f m p /2π = 20, 000π/2π = 10 4 Hz. Also, f c = 1 MHz. Hence, (f i ) max = = 1.01 MHz, and (f i ) min = = 0.99 MHz. The carrier frequency increases linearly from 0.99 MHz to 1.01 MHz over the cycle (over the interval 10 3 /2 < t < 10 3 /2). Then instantaneously, the carrier frequency falls to 0.99MHz and starts rising linearly to MHz over the next cycle. This cycle repeats periodically with period 10 3 as shown in Fig.2
57 5. Assignment 5 48 For PM: Here, because m(t) has jump discountinuities, we shall use a direct approach. For convenience, we select the origin for m(t) as shown in Fig.2. Over the interval 10 3 /2 < t < 10 3 /2, we can express the message signal as m(t) = 2000t. Hence, φ P M (t) = cos [2π(10) 6 t + π ] 2 m(t) = cos[2π(10) 6 t πt] = cos[2π( ) t] At the discontinuity, the amount of jump is m d = 2. Hence, the phase discontinuity is k p m d = π. Therefore, the carrier frequency is constant throughout at Hz. But at the points of discontinuity, there is a phase discontinuity of π radians as shown in Fig.2. In this case, we must maintain k p < π because there is a discontinuity of the amount 2. For k p > π, the phase discontinuity will be higher than 2π given rise to ambiguity in demodulation. Fig. 5.2: Solution for : (a) φ P M (t) = A cos[ω c t + k p m(t)] = 10 cos[10, 000t + k p m(t)] We are given that φ P M (t) = 10 cos(13, 000t) with k p = clearly, m(t) = 3t over the interval t 1. (b) Therefore, Hence, t φ F M (t) = A cos [ω c t + k f k f t 0 0 ] m(α) dα = 10 cos [10, 000t + k f t t m(α) dα = 1000 m(α) dα = 3000t 0 3t = t 0 m(α) dα m(t) = 3 0 ] m(α) dα
58 5. Assignment : In this case, k f = 1000π and k p = 1. For m(t) = 2 cos 100t + 18 cos 2000πt and ṁ(t) = 200 sin 100t 36, 000π sin 2000πt Therefore, m p = 20 and m p = 36, 000π Also the baseband signal BW B = 2000π/2π = 1kHz. For FM: f = k f m p /2π = 10, 000 and B F M = 2( f +B) = 2(20, ) = 42kHz. For PM: f = k f m p/2π = 18, /πHz, and B P M = 2( f + B) = 2(18, ) = kHz : φ EM (t) = 10 cos(ω c t sin 2000πt). Here, the baseband signal bandwidth B = 2000π/2π = 1000Hz. Also, ω i (t) = ω c + 200π cos 2000πt Therefore, ω = 200π and f = 100Hz and B EM = 2( f + B) = 2( ) = 2.2kHz 5.2-3: φ EM (t) = 5 cos(ω c t + 20 sin 1000πt + 10 sin 2000πt). Here, the baseband signal bandwidth B = 2000π/2π = 1000Hz. Also, ω i (t) = ω c + 20, 000π cos 1000πt + 20, 000π cos 2000πt Therefore, ω = 20, 000π + 20, 000π = 40, 000π and f = 20kHz and B EM = 2( f + B) = 2(20, ) = 42kHz 5.2-4: The baseband signal bandwidth B = = 3000Hz For FM: f = k f m p = π 2π For PM: f = kpm p = π 2π = kHz and B F M = 2( f + B) = kHz. = kHz and B F M = 2( f + B) = kHz : The baseband signal bandwidth B = = 5000Hz For FM: f = k f m p = 2000π 1 2π 2π = 1kHz and B F M = 2( f + B) = 2(2 + 5) = 14kHz. For PM: To find B PM, we observe from Fig. 2 that φ F M (t) is essentially a sequence of sinusoidal pulses of width T = 10 3 seconds and of frequency f c = 1 MHz. Such a pulse and its spectrum are depicted in Figs. 3.22c and d, respectively. The bandwidth of the pulse, as seen from Fig. 3.22d, is 4π/T rad/s or 2/T Hz. Hence, B P M = 2kHz : (a) For FM: f = k f m p = 100kHz and the baseband signal bandwidth B = 2π 2π = 1kHz. Therefore, B F M = 2( f + B) = 202kHz. 2000π 2π = 200,000π 1
59 5. Assignment 5 50 For PM: f = kpm p = π 2π 2π = 10kHz and B F M = 2( f + B) = 2(10 + 1) = 22kHz. (b) m(t) = 2 sin 2000πt, and B = 2000π/2π = 1kHz. Also, m p = 2 and m p = 4000π. For FM: f = k f m p = 200kHz and the baseband signal bandwidth B = 2π 2π = 1kHz. Therefore, B F M = 2( f + B) = 2( ) = 402kHz. 2000π 2π = 200,000π 2 For PM: f = kpm p = π 2π 2π = 20kHz and B F M = 2( f + B) = 2(20 + 1) = 42kHz. (c) m(t) = sin 4000πt, and B = 4000π/2π = 2kHz. Also, m p = 1 and m p = 4000π. For FM: f = k f m p 2π 204kHz. For PM: f = k pm p = π 2π 2π = 200,000π 1 2π = 100kHz and, B F M = 2( f + B) = 2( ) = = 20kHz and B F M = 2( f + B) = 2(20 + 2) = 44kHz. (d) Doubling the amplitude of m(t) roughly doubles the bandwidth of both FM and PM. Doubling the frequency of m(t) (expanding the spectrum M(ω) by a factor of 2) has hardly any effect on the FM bandwidth. However, it roughly doubles the bandwidth of PM, indicating that PM spectrum is sensitive to the shape of the baseband spectrum. FM spectrum is relatively insensitive to the nature of the spectrum M(ω) : From pair 22 (Table 3.1), we obtain e t2 πe ω2 /4 The spectrum M(ω) = πe ω2 /4 is a Gaussian pulse, which decays rapidly. Its 3 db bandwidth is rad/s=0.187 Hz. This is an extremely small bandwidth compared to f. Also, ṁ(t) = 2te t2 /2. The spectrum of ṁ(t) is M (ω) = jωm(ω) = j πωe ω2 /4. This spectrum also decays rapidly away from the origin, and its bandwidth can also be assumed o be negligible compared to f. For FM: f = k f m p = 6000π 1 2π 2π = 3kHz and, B F M 2( f) = 2 3 = 6kHz. For PM: To find m p, we set the derivative of ṁ(t) = 2te t2 /2 equal to zero. This yields m(t) = 2e t2 /2 + 4t 2 e t2 /2 = 0 t = 1 2 and m p = ṁ(1/ 2) = 0.858, and f = kpm p 2π 2( f) = 2(3.432) = 6.864kHz. = 8000π π = 3.432kHz and B P M 5.3-1: The block diagram of the design is shown in Fig : The block diagram of the design is shown in Fig : (a) φ P M (t) = A cos[ω c t + k p m(t)]
60 5. Assignment 5 51 Fig. 5.3: Solution for Fig. 5.4: Solution for
61 5. Assignment 5 52 When this φ P M (t) is passed through an ideal FM demodulator. The output is k p ṁ(t). This signal, when passed through an ideal integrator, yields k p m(t). Hence, FM demodulator followed by an ideal integrator acts as a PM demodulator. However, if m(t) has a discontinuity, ṁ(t) = at the point(s) of discontinuity, and the system will fail. (b) t φ F M (t) = A cos [ω c t + k f 0 ] m(α) dα when this signal φ F M (t) is passed through an ideal PM demodulator, the output is k t f 0 m(α) dα. When this signal is passed through an ideal differentiator, the output is k f m(t). Hence, PM demodulator followed by an ideal differentiator, acts as FM demodulator regardless of whether m(t) has jump discontinuities or not : Fig. 5 shows the waveforms at points b, c, d and e. The figure is self explanatory. Fig. 5.5: Solution for
62 6. ASSIGNMENT Assignment 6 Problems : Determine X(t) and R X (t 1, t 2 ) for the random process in Prob. determine whether this is a wide-sense stationary process , and : Repeat Prob for the random process x(t) = a cos(ω c t + Θ) where ω c is a constant, a and Θ are independent RVs uniformly distributed in the ranges (-1,1) and (0, 2π) respectively : Show that if the PSD of a random process X(t) is band-limited to B Hz, and if ( ) n R X = 2B 1 n = 0 0 n = ±1, ±2, ±3, then X(t) is a white bandlimited process; that is, S X (ω) = krect(ω/4πb). Hint: Using the interpolation formula, reconstruct R X (τ).
63 6. Assignment 6 54
64 6. Assignment : A certain telephone channel has H c (ω) 10 3 over the signal band. The message signal PSD is S m (ω) = βrect(ω/2α), with α = 8000π. The channel noise PSD is S n (ω) = If the output SNR at the receiver is required to be at least 30 db, what is the minimum transmitted power required? Calculate the value of β corresponding to this power : For a DSB-SC system with a channel noise PSD of S n (ω) = and a baseband signal of bandwidth 4 khz, the receiver output SNR is required to be at least 30 db. The receiver is as shown in Fig a. What must be the signal power S i received at the receiver input? b. What is the receiver output noise power N 0? c. What is the minimum transmitted power S T if the channel transfer function is H c (ω) = 10 4 over the transmission band? : Repeat Prob for SSB-SC : Determine the output SNR of each of the two quadrature multiplexed channels and compare the results with those of DSB-SC and SSB-SC : Assume [m(t)] max = [m(t)] min = m p. a. Show that for AM m p = µa b. Show that the output SNR for AM [Eq. (12.14)] can be expressed as where k 2 = m 2 p/m 2. S o N o = µ 2 K 2 + µ 2 γ c. Using the result in part (2), show that for tone modulation with µ = 1, S o /N o = γ/3. d. Show that if S T and S T are the AM and DSB-SC transmitted powers, respectively, required to attain a given output SNR, then S T k 2 S T for µ = 1 and k 2 >> : For an FM communication system with β = 2 and white channel noise with PSD S n (ω) = 10 10, the output SNR is found to be 28 db. The baseband signal m(t) is gaussian and band-limited to 15 khz, and 3σ loading is used. The demodulator constant α = This means that the FM demodulator output is α ψ when the input is A cos(ω c t + ψ(t)). In the present case, the signal at the demodulator output is αk f m(t). The output noise is also multiplied by α.
65 6. Assignment 6 56 a. Determine the received signal power S i. b. Determine the output signal power S o. c. Determine the output noise power N o.
66 6. Assignment Assignment 6 Solutions : Since x(t) = a cos(ωt + θ) A E[x(t)] = E[a cos(ωt + θ)] = E[a] cos(ωt + θ) = cos(ωt + θ) A = [cos(ωt + θ)/(2a)] a da = 0 A A ap a (a) da : R X (t 1, t 2 ) = E[a 2 cos(ωt 1 + θ) cos(ωt 2 + θ)] = cos(ωt 1 + θ) cos(ωt 2 + θ)e[a 2 ] = A a 2 A3 cos(ωt 1 + θ) cos(ωt 2 + θ) da = A 2A 3 cos(ωt 1 + θ) cos(ωt 2 + θ)(6.1) x(t) = a cos(ω c t + θ), E[a] = 0 and E[a 2 ] = 1 3 (b) E[x(t)] = E[a cos(ω c t + θ)] = E[a] E[cos(ω c t + θ)] = 0 (c) R X (t 1, t 2 ) = E[a 2 ] E[cos(ω c t 1 + θ) cos(ω c t 2 + θ)] = 1 3 E[cos ω c(t 1 t 2 ) + cos ω c (t 1 + t 2 ) + 2θ] = 1 3 cos ω c(t 1 t 2 ) + 1 2π (d) The process is W.S.S 2π 0 cos[ω c (t 1 t 2 ) + 2θ] dθ = 1 3 cos ω c(t 1 t 2 ) : R X (τ) = 0 for τ = ± n and its Fourier transform S 2B X(ω) is bandlimited to B Hz. Hence, R X (τ) = 0 is a waveform bandlimited to B Hz and according to Eq.6.10b Since R X ( n 2B R X (τ) = n= = 0 for all n except n = 0, therefore, ( ) n R X sinc (2πBτ n). 2B R X (τ) = R X (0)sinc(2πBτ) and S X (ω) = R ( ) X(0) ω 2B rect 4πB Hence, x(t) is a white process bandlimited to B Hz.
67 6. Assignment 6 58
68 6. Assignment : since N 0 /2 = 10 10, we have N 0 = (a) therefore, S i = dB = 1000 = S 0 σ 2 o = γ = S i N 0 B = S i (b) From Eq.(12.7), the receiver output noise power σ 2 o is given as σ 2 o = N 0 B = = (c) Since S i = H c (ω) 2 S T = 10 8 S T, therefore, S T = S i /10 8 =
69 6. Assignment 6 60
70 6. Assignment 6 61
Problems from the 3 rd edition
 (2.1-1) Find the energies of the signals: a) sin t, 0 t π b) sin t, 0 t π c) 2 sin t, 0 t π d) sin (t-2π), 2π t 4π Problems from the 3 rd edition Comment on the effect on energy of sign change, time shifting
Communication Channels
 Communication Channels wires (PCB trace or conductor on IC) optical fiber (attenuation 4dB/km) broadcast TV (50 kw transmit) voice telephone line (under -9 dbm or 110 µw) walkie-talkie: 500 mw, 467 MHz
ELE636 Communication Systems
 ELE636 Communication Systems Chapter 5 : Angle (Exponential) Modulation 1 Phase-locked Loop (PLL) The PLL can be used to track the phase and the frequency of the carrier component of an incoming signal.
Speech, music, images, and video are examples of analog signals. Each of these signals is characterized by its bandwidth, dynamic range, and the
 Speech, music, images, and video are examples of analog signals. Each of these signals is characterized by its bandwidth, dynamic range, and the nature of the signal. For instance, in the case of audio
CHAPTER 5. Additional Problems (a) The AM signal is defined by st () = A c. k a A c 1
 The AM signal is defined by st () = A c. k a A c 1") CHAPTER 5 Additional Problems 5.7 (a) The AM signal is defined by st () A c ( + k a mt ()) cos( ω c k a A c + ------------ + t cos( ω c To obtain 5% modulation, we choose k a, which results in the modulated
CHAPTER 5 Additional Problems 5.7 (a) The AM signal is defined by st () A c ( + k a mt ()) cos( ω c k a A c + ------------ + t cos( ω c To obtain 5% modulation, we choose k a, which results in the modulated
ANALOGUE TRANSMISSION OVER FADING CHANNELS
 J.P. Linnartz EECS 290i handouts Spring 1993 ANALOGUE TRANSMISSION OVER FADING CHANNELS Amplitude modulation Various methods exist to transmit a baseband message m(t) using an RF carrier signal c(t) =
B.Tech II Year II Semester (R13) Supplementary Examinations May/June 2017 ANALOG COMMUNICATION SYSTEMS (Electronics and Communication Engineering)
 Supplementary Examinations May/June 2017 ANALOG COMMUNICATION SYSTEMS (Electronics and Communication Engineering)") Code: 13A04404 R13 B.Tech II Year II Semester (R13) Supplementary Examinations May/June 2017 ANALOG COMMUNICATION SYSTEMS (Electronics and Communication Engineering) Time: 3 hours Max. Marks: 70 PART A
Code: 13A04404 R13 B.Tech II Year II Semester (R13) Supplementary Examinations May/June 2017 ANALOG COMMUNICATION SYSTEMS (Electronics and Communication Engineering) Time: 3 hours Max. Marks: 70 PART A
AM Limitations. Amplitude Modulation II. DSB-SC Modulation. AM Modifications
 Lecture 6: Amplitude Modulation II EE 3770: Communication Systems AM Limitations AM Limitations DSB-SC Modulation SSB Modulation VSB Modulation Lecture 6 Amplitude Modulation II Amplitude modulation is
Amplitude Modulation II
 Lecture 6: Amplitude Modulation II EE 3770: Communication Systems Lecture 6 Amplitude Modulation II AM Limitations DSB-SC Modulation SSB Modulation VSB Modulation Multiplexing Mojtaba Vaezi 6-1 Contents
Amplitude Modulation, II
 Amplitude Modulation, II Single sideband modulation (SSB) Vestigial sideband modulation (VSB) VSB spectrum Modulator and demodulator NTSC TV signsals Quadrature modulation Spectral efficiency Modulator
Outline. Communications Engineering 1
 Outline Introduction Signal, random variable, random process and spectra Analog modulation Analog to digital conversion Digital transmission through baseband channels Signal space representation Optimal
EE4512 Analog and Digital Communications Chapter 6. Chapter 6 Analog Modulation and Demodulation
 Chapter 6 Analog Modulation and Demodulation Chapter 6 Analog Modulation and Demodulation Amplitude Modulation Pages 306-309 309 The analytical signal for double sideband, large carrier amplitude modulation
Digital Signal Processing
 Digital Signal Processing Lecture 9 Discrete-Time Processing of Continuous-Time Signals Alp Ertürk alp.erturk@kocaeli.edu.tr Analog to Digital Conversion Most real life signals are analog signals These
Laboratory Assignment 5 Amplitude Modulation
 Laboratory Assignment 5 Amplitude Modulation PURPOSE In this assignment, you will explore the use of digital computers for the analysis, design, synthesis, and simulation of an amplitude modulation (AM)
Lecture 6. Angle Modulation and Demodulation
 Lecture 6 and Demodulation Agenda Introduction to and Demodulation Frequency and Phase Modulation Angle Demodulation FM Applications Introduction The other two parameters (frequency and phase) of the carrier
Signals and Systems. Lecture 13 Wednesday 6 th December 2017 DR TANIA STATHAKI
 Signals and Systems Lecture 13 Wednesday 6 th December 2017 DR TANIA STATHAKI READER (ASSOCIATE PROFFESOR) IN SIGNAL PROCESSING IMPERIAL COLLEGE LONDON Continuous time versus discrete time Continuous time
HW 6 Due: November 3, 10:39 AM (in class)
") ECS 332: Principles of Communications 2015/1 HW 6 Due: November 3, 10:39 AM (in class) Lecturer: Prapun Suksompong, Ph.D. Instructions (a) ONE part of a question will be graded (5 pt). Of course, you do
ECS 332: Principles of Communications 2015/1 HW 6 Due: November 3, 10:39 AM (in class) Lecturer: Prapun Suksompong, Ph.D. Instructions (a) ONE part of a question will be graded (5 pt). Of course, you do
Solution to Chapter 4 Problems
 Solution to Chapter 4 Problems Problem 4.1 1) Since F[sinc(400t)]= 1 modulation index 400 ( f 400 β f = k f max[ m(t) ] W Hence, the modulated signal is ), the bandwidth of the message signal is W = 00
Twelve voice signals, each band-limited to 3 khz, are frequency -multiplexed using 1 khz guard bands between channels and between the main carrier
 Twelve voice signals, each band-limited to 3 khz, are frequency -multiplexed using 1 khz guard bands between channels and between the main carrier and the first channel. The modulation of the main carrier
Problem Sheet for Amplitude Modulation
 Problem heet for Amplitude Modulation Q1: For the sinusoidaly modulated DB/LC waveform shown in Fig. below. a Find the modulation index. b ketch a line spectrum. c Calculated the ratio of average power
(b) What are the differences between FM and PM? (c) What are the differences between NBFM and WBFM? [9+4+3]
![(b) What are the differences between FM and PM? (c) What are the differences between NBFM and WBFM? [9+4+3]](/thumbs/85/91561193.jpg "(b) What are the differences between FM and PM? (c) What are the differences between NBFM and WBFM? [9+4+3]") Code No: RR220401 Set No. 1 1. (a) The antenna current of an AM Broadcast transmitter is 10A, if modulated to a depth of 50% by an audio sine wave. It increases to 12A as a result of simultaneous modulation
Code No: RR220401 Set No. 1 1. (a) The antenna current of an AM Broadcast transmitter is 10A, if modulated to a depth of 50% by an audio sine wave. It increases to 12A as a result of simultaneous modulation
Signals and Systems Lecture 9 Communication Systems Frequency-Division Multiplexing and Frequency Modulation (FM)
") Signals and Systems Lecture 9 Communication Systems Frequency-Division Multiplexing and Frequency Modulation (FM) April 11, 2008 Today s Topics 1. Frequency-division multiplexing 2. Frequency modulation
Signals and Systems Lecture 9 Communication Systems Frequency-Division Multiplexing and Frequency Modulation (FM) April 11, 2008 Today s Topics 1. Frequency-division multiplexing 2. Frequency modulation
DIGITAL COMMUNICATIONS SYSTEMS. MSc in Electronic Technologies and Communications
 DIGITAL COMMUNICATIONS SYSTEMS MSc in Electronic Technologies and Communications Bandpass binary signalling The common techniques of bandpass binary signalling are: - On-off keying (OOK), also known as
Introduction to Amplitude Modulation
 1 Introduction to Amplitude Modulation Introduction to project management. Problem definition. Design principles and practices. Implementation techniques including circuit design, software design, solid
Code No: R Set No. 1
 Code No: R05220405 Set No. 1 II B.Tech II Semester Regular Examinations, Apr/May 2007 ANALOG COMMUNICATIONS ( Common to Electronics & Communication Engineering and Electronics & Telematics) Time: 3 hours
3.1 Introduction to Modulation
 Haberlesme Sistemlerine Giris (ELE 361) 9 Eylul 2017 TOBB Ekonomi ve Teknoloji Universitesi, Guz 2017-18 Dr. A. Melda Yuksel Turgut & Tolga Girici Lecture Notes Chapter 3 Amplitude Modulation Speech, music,
Chapter 5. Amplitude Modulation
 Chapter 5 Amplitude Modulation So far we have developed basic signal and system representation techniques which we will now apply to the analysis of various analog communication systems. In particular,
Amplitude Modulated Systems
 Amplitude Modulated Systems Communication is process of establishing connection between two points for information exchange. Channel refers to medium through which message travels e.g. wires, links, or
Digital Communication System
 Digital Communication System Purpose: communicate information at required rate between geographically separated locations reliably (quality) Important point: rate, quality spectral bandwidth, power requirements
YEDITEPE UNIVERSITY ENGINEERING FACULTY COMMUNICATION SYSTEMS LABORATORY EE 354 COMMUNICATION SYSTEMS
 YEDITEPE UNIVERSITY ENGINEERING FACULTY COMMUNICATION SYSTEMS LABORATORY EE 354 COMMUNICATION SYSTEMS EXPERIMENT 3: SAMPLING & TIME DIVISION MULTIPLEX (TDM) Objective: Experimental verification of the
Problem Sheet 1 Probability, random processes, and noise
 Problem Sheet 1 Probability, random processes, and noise 1. If F X (x) is the distribution function of a random variable X and x 1 x 2, show that F X (x 1 ) F X (x 2 ). 2. Use the definition of the cumulative
Theory of Telecommunications Networks
 Theory of Telecommunications Networks Anton Čižmár Ján Papaj Department of electronics and multimedia telecommunications CONTENTS Preface... 5 1 Introduction... 6 1.1 Mathematical models for communication
Principles of Baseband Digital Data Transmission
 Principles of Baseband Digital Data Transmission Prof. Wangrok Oh Dept. of Information Communications Eng. Chungnam National University Prof. Wangrok Oh(CNU) / 3 Overview Baseband Digital Data Transmission
Amplitude Modulation. Ahmad Bilal
 Amplitude Modulation Ahmad Bilal 5-2 ANALOG AND DIGITAL Analog-to-analog conversion is the representation of analog information by an analog signal. Topics discussed in this section: Amplitude Modulation
 Modulations Analog Modulations Amplitude modulation (AM) Linear modulation Frequency modulation (FM) Phase modulation (PM) cos Angle modulation FM PM Digital Modulations ASK FSK PSK MSK MFSK QAM PAM Etc.
Angle Modulated Systems
 Angle Modulated Systems Angle of carrier signal is changed in accordance with instantaneous amplitude of modulating signal. Two types Frequency Modulation (FM) Phase Modulation (PM) Use Commercial radio
ECE5713 : Advanced Digital Communications
 ECE5713 : Advanced Digital Communications Bandpass Modulation MPSK MASK, OOK MFSK 04-May-15 Advanced Digital Communications, Spring-2015, Week-8 1 In-phase and Quadrature (I&Q) Representation Any bandpass
UNIT TEST I Digital Communication
 Time: 1 Hour Class: T.E. I & II Max. Marks: 30 Q.1) (a) A compact disc (CD) records audio signals digitally by using PCM. Assume the audio signal B.W. to be 15 khz. (I) Find Nyquist rate. (II) If the Nyquist
UNIT I AMPLITUDE MODULATION
 UNIT I AMPLITUDE MODULATION Prepared by: S.NANDHINI, Assistant Professor, Dept. of ECE, Sri Venkateswara College of Engineering, Sriperumbudur, Tamilnadu. CONTENTS Introduction to communication systems
Final Exam Solutions June 14, 2006
 Name or 6-Digit Code: PSU Student ID Number: Final Exam Solutions June 14, 2006 ECE 223: Signals & Systems II Dr. McNames Keep your exam flat during the entire exam. If you have to leave the exam temporarily,
Signals A Preliminary Discussion EE442 Analog & Digital Communication Systems Lecture 2
 Signals A Preliminary Discussion EE442 Analog & Digital Communication Systems Lecture 2 The Fourier transform of single pulse is the sinc function. EE 442 Signal Preliminaries 1 Communication Systems and
CSE4214 Digital Communications. Bandpass Modulation and Demodulation/Detection. Bandpass Modulation. Page 1
 CSE414 Digital Communications Chapter 4 Bandpass Modulation and Demodulation/Detection Bandpass Modulation Page 1 1 Bandpass Modulation n Baseband transmission is conducted at low frequencies n Passband
Spread spectrum. Outline : 1. Baseband 2. DS/BPSK Modulation 3. CDM(A) system 4. Multi-path 5. Exercices. Exercise session 7 : Spread spectrum 1
 system 4. Multi-path 5. Exercices. Exercise session 7 : Spread spectrum 1") Spread spectrum Outline : 1. Baseband 2. DS/BPSK Modulation 3. CDM(A) system 4. Multi-path 5. Exercices Exercise session 7 : Spread spectrum 1 1. Baseband +1 b(t) b(t) -1 T b t Spreading +1-1 T c t m(t)
Spread spectrum Outline : 1. Baseband 2. DS/BPSK Modulation 3. CDM(A) system 4. Multi-path 5. Exercices Exercise session 7 : Spread spectrum 1 1. Baseband +1 b(t) b(t) -1 T b t Spreading +1-1 T c t m(t)
EXAMINATION FOR THE DEGREE OF B.E. Semester 1 June COMMUNICATIONS IV (ELEC ENG 4035)
") EXAMINATION FOR THE DEGREE OF B.E. Semester 1 June 2007 101902 COMMUNICATIONS IV (ELEC ENG 4035) Official Reading Time: Writing Time: Total Duration: 10 mins 120 mins 130 mins Instructions: This is a closed
EXAMINATION FOR THE DEGREE OF B.E. Semester 1 June 2007 101902 COMMUNICATIONS IV (ELEC ENG 4035) Official Reading Time: Writing Time: Total Duration: 10 mins 120 mins 130 mins Instructions: This is a closed
Digital Communication System
 Digital Communication System Purpose: communicate information at certain rate between geographically separated locations reliably (quality) Important point: rate, quality spectral bandwidth requirement
Module 4. Signal Representation and Baseband Processing. Version 2 ECE IIT, Kharagpur
 Module 4 Signal Representation and Baseband Processing Lesson 1 Nyquist Filtering and Inter Symbol Interference After reading this lesson, you will learn about: Power spectrum of a random binary sequence;
Digital communication
 Chapter 4 Digital communication A digital is a discrete-time binary m : Integers Bin = {0, 1}. To transmit such a it must first be transformed into a analog. The is then transmitted as such or modulated
Lecture 10. Digital Modulation
 Digital Modulation Lecture 10 On-Off keying (OOK), or amplitude shift keying (ASK) Phase shift keying (PSK), particularly binary PSK (BPSK) Frequency shift keying Typical spectra Modulation/demodulation
Chapter 7 Single-Sideband Modulation (SSB) and Frequency Translation
 and Frequency Translation") Chapter 7 Single-Sideband Modulation (SSB) and Frequency Translation Contents Slide 1 Single-Sideband Modulation Slide 2 SSB by DSBSC-AM and Filtering Slide 3 SSB by DSBSC-AM and Filtering (cont.) Slide
Chapter 7 Single-Sideband Modulation (SSB) and Frequency Translation Contents Slide 1 Single-Sideband Modulation Slide 2 SSB by DSBSC-AM and Filtering Slide 3 SSB by DSBSC-AM and Filtering (cont.) Slide
EE3723 : Digital Communications
 EE3723 : Digital Communications Week 8-9: Bandpass Modulation MPSK MASK, OOK MFSK 04-May-15 Muhammad Ali Jinnah University, Islamabad - Digital Communications - EE3723 1 In-phase and Quadrature (I&Q) Representation
Chapter-2 SAMPLING PROCESS
 Chapter-2 SAMPLING PROCESS SAMPLING: A message signal may originate from a digital or analog source. If the message signal is analog in nature, then it has to be converted into digital form before it can
Chapter 3: Analog Modulation Cengage Learning Engineering. All Rights Reserved.
 Contemporary Communication Systems using MATLAB Chapter 3: Analog Modulation 2013 Cengage Learning Engineering. All Rights Reserved. 3.1 Preview In this chapter we study analog modulation & demodulation,
Digital Modulation Schemes
 Digital Modulation Schemes 1. In binary data transmission DPSK is preferred to PSK because (a) a coherent carrier is not required to be generated at the receiver (b) for a given energy per bit, the probability
Digital Processing of Continuous-Time Signals
 Chapter 4 Digital Processing of Continuous-Time Signals 清大電機系林嘉文 cwlin@ee.nthu.edu.tw 03-5731152 Original PowerPoint slides prepared by S. K. Mitra 4-1-1 Digital Processing of Continuous-Time Signals Digital
4.1 REPRESENTATION OF FM AND PM SIGNALS An angle-modulated signal generally can be written as
 1 In frequency-modulation (FM) systems, the frequency of the carrier f c is changed by the message signal; in phase modulation (PM) systems, the phase of the carrier is changed according to the variations
SIR PADAMPAT SINGHANIA UNIVERSITY UDAIPUR Sample Question Paper for Ph.D. (Electronics & Communication Engineering) SPSAT 18
 SPSAT 18") INSTRUCTIONS SIR PADAMPAT SINGHANIA UNIVERSITY UDAIPUR Sample Question Paper for Ph.D. (Electronics & Communication Engineering) SPSAT 18 The test is 60 minutes long and consists of 40 multiple choice
INSTRUCTIONS SIR PADAMPAT SINGHANIA UNIVERSITY UDAIPUR Sample Question Paper for Ph.D. (Electronics & Communication Engineering) SPSAT 18 The test is 60 minutes long and consists of 40 multiple choice
Islamic University of Gaza. Faculty of Engineering Electrical Engineering Department Spring-2011
 Islamic University of Gaza Faculty of Engineering Electrical Engineering Department Spring-2011 DSP Laboratory (EELE 4110) Lab#4 Sampling and Quantization OBJECTIVES: When you have completed this assignment,
Digital Processing of
 Chapter 4 Digital Processing of Continuous-Time Signals 清大電機系林嘉文 cwlin@ee.nthu.edu.tw 03-5731152 Original PowerPoint slides prepared by S. K. Mitra 4-1-1 Digital Processing of Continuous-Time Signals Digital
TSEK02: Radio Electronics Lecture 2: Modulation (I) Ted Johansson, EKS, ISY
 Ted Johansson, EKS, ISY") TSEK02: Radio Electronics Lecture 2: Modulation (I) Ted Johansson, EKS, ISY 2 Basic Definitions Time and Frequency db conversion Power and dbm Filter Basics 3 Filter Filter is a component with frequency
TSEK02: Radio Electronics Lecture 2: Modulation (I) Ted Johansson, EKS, ISY 2 Basic Definitions Time and Frequency db conversion Power and dbm Filter Basics 3 Filter Filter is a component with frequency
EE390 Final Exam Fall Term 2002 Friday, December 13, 2002
 Name Page 1 of 11 EE390 Final Exam Fall Term 2002 Friday, December 13, 2002 Notes 1. This is a 2 hour exam, starting at 9:00 am and ending at 11:00 am. The exam is worth a total of 50 marks, broken down
2.1 BASIC CONCEPTS Basic Operations on Signals Time Shifting. Figure 2.2 Time shifting of a signal. Time Reversal.
 1 2.1 BASIC CONCEPTS 2.1.1 Basic Operations on Signals Time Shifting. Figure 2.2 Time shifting of a signal. Time Reversal. 2 Time Scaling. Figure 2.4 Time scaling of a signal. 2.1.2 Classification of Signals
On-off keying, which consists of keying a sinusoidal carrier on and off with a unipolar binary signal
 Bandpass signalling Thus far only baseband signalling has been considered: an information source is usually a baseband signal. Some communication channels have a bandpass characteristic, and will not propagate
Weaver SSB Modulation/Demodulation - A Tutorial
 Weaver SSB odulation/demodulation - A Tutorial Derek Rowell February 18, 2017 1 Introduction In 1956 D. K. Weaver 1 proposed a new modulation scheme for single-sideband-suppressedcarrier (SSB) generation.
Exercises for chapter 2
 Exercises for chapter Digital Communications A baseband PAM system uses as receiver filter f(t) a matched filter, f(t) = g( t), having two choices for transmission filter g(t) g a (t) = ( ) { t Π =, t,
Master Degree in Electronic Engineering
 Master Degree in Electronic Engineering Analog and telecommunication electronic course (ATLCE-01NWM) Miniproject: Baseband signal transmission techniques Name: LI. XINRUI E-mail: s219989@studenti.polito.it
Part A: Question & Answers UNIT I AMPLITUDE MODULATION
 PANDIAN SARASWATHI YADAV ENGINEERING COLLEGE DEPARTMENT OF ELECTRONICS & COMMUNICATON ENGG. Branch: ECE EC6402 COMMUNICATION THEORY Semester: IV Part A: Question & Answers UNIT I AMPLITUDE MODULATION 1.
TSEK02: Radio Electronics Lecture 2: Modulation (I) Ted Johansson, EKS, ISY
 Ted Johansson, EKS, ISY") TSEK02: Radio Electronics Lecture 2: Modulation (I) Ted Johansson, EKS, ISY An Overview of Modulation Techniques: chapter 3.1 3.3.1 2 Introduction (3.1) Analog Modulation Amplitude Modulation Phase and
TSEK02: Radio Electronics Lecture 2: Modulation (I) Ted Johansson, EKS, ISY An Overview of Modulation Techniques: chapter 3.1 3.3.1 2 Introduction (3.1) Analog Modulation Amplitude Modulation Phase and
Music 270a: Modulation
 Music 7a: Modulation Tamara Smyth, trsmyth@ucsd.edu Department of Music, University of California, San Diego (UCSD) October 3, 7 Spectrum When sinusoids of different frequencies are added together, the
Objectives. Presentation Outline. Digital Modulation Lecture 03
 Digital Modulation Lecture 03 Inter-Symbol Interference Power Spectral Density Richard Harris Objectives To be able to discuss Inter-Symbol Interference (ISI), its causes and possible remedies. To be able
EE470 Electronic Communication Theory Exam II
 EE470 Electronic Communication Theory Exam II Open text, closed notes. For partial credit, you must show all formulas in symbolic form and you must work neatly!!! Date: November 6, 2013 Name: 1. [16%]
Outline Chapter 3: Principles of Digital Communications
 Outline Chapter 3: Principles of Digital Communications Structure of a Data Transmission System Up- and Down-Conversion Lowpass-to-Bandpass Conversion Baseband Presentation of Communication System Basic
Amplitude Modulation Early Radio EE 442 Spring Semester Lecture 6
 Amplitude Modulation Early Radio EE 442 Spring Semester Lecture 6 f f f LO audio baseband m http://www.technologyuk.net/telecommunications/telecom_principles/amplitude_modulation.shtml AM Modulation --
Other Modulation Techniques - CAP, QAM, DMT
 Other Modulation Techniques - CAP, QAM, DMT Prof. David Johns (johns@eecg.toronto.edu) (www.eecg.toronto.edu/~johns) slide 1 of 47 Complex Signals Concept useful for describing a pair of real signals Let
Handout 13: Intersymbol Interference
 ENGG 2310-B: Principles of Communication Systems 2018 19 First Term Handout 13: Intersymbol Interference Instructor: Wing-Kin Ma November 19, 2018 Suggested Reading: Chapter 8 of Simon Haykin and Michael
EECS 216 Winter 2008 Lab 2: FM Detector Part I: Intro & Pre-lab Assignment
 EECS 216 Winter 2008 Lab 2: Part I: Intro & Pre-lab Assignment c Kim Winick 2008 1 Introduction In the first few weeks of EECS 216, you learned how to determine the response of an LTI system by convolving
SAMPLING THEORY. Representing continuous signals with discrete numbers
 SAMPLING THEORY Representing continuous signals with discrete numbers Roger B. Dannenberg Professor of Computer Science, Art, and Music Carnegie Mellon University ICM Week 3 Copyright 2002-2013 by Roger
Fourier Transform Analysis of Signals and Systems
 Fourier Transform Analysis of Signals and Systems Ideal Filters Filters separate what is desired from what is not desired In the signals and systems context a filter separates signals in one frequency
Chpater 8 Digital Transmission through Bandlimited AWGN Channels
 Chapter 8. Digital Transmission through Bandlimited AWGN Channels - 1-1 st Semester, 008 Chpater 8 Digital Transmission through Bandlimited AWGN Channels Text. [1] J. G. Proakis and M. Salehi, Communication
EEE 309 Communication Theory
 EEE 309 Communication Theory Semester: January 2017 Dr. Md. Farhad Hossain Associate Professor Department of EEE, BUET Email: mfarhadhossain@eee.buet.ac.bd Office: ECE 331, ECE Building Types of Modulation
SIGNALS AND SYSTEMS LABORATORY 13: Digital Communication
 SIGNALS AND SYSTEMS LABORATORY 13: Digital Communication INTRODUCTION Digital Communication refers to the transmission of binary, or digital, information over analog channels. In this laboratory you will
Lab10: FM Spectra and VCO
 Lab10: FM Spectra and VCO Prepared by: Keyur Desai Dept. of Electrical Engineering Michigan State University ECE458 Lab 10 What is FM? A type of analog modulation Remember a common strategy in analog modulation?
3.1 Introduction 3.2 Amplitude Modulation 3.3 Double Sideband-Suppressed Carrier Modulation 3.4 Quadrature-Carrier Multiplexing 3.
 Chapter 3 Amplitude Modulation Wireless Information Transmission System Lab. Institute of Communications Engineering g National Sun Yat-sen University Outline 3.1 Introduction 3. Amplitude Modulation 3.3
OBJECTIVES EQUIPMENT LIST
 1 Reception of Amplitude Modulated Signals AM Demodulation OBJECTIVES The purpose of this experiment is to show how the amplitude-modulated signals are demodulated to obtain the original signal. Also,
END-OF-YEAR EXAMINATIONS ELEC321 Communication Systems (D2) Tuesday, 22 November 2005, 9:20 a.m. Three hours plus 10 minutes reading time.
 Tuesday, 22 November 2005, 9:20 a.m. Three hours plus 10 minutes reading time.") END-OF-YEAR EXAMINATIONS 2005 Unit: Day and Time: Time Allowed: ELEC321 Communication Systems (D2) Tuesday, 22 November 2005, 9:20 a.m. Three hours plus 10 minutes reading time. Total Number of Questions:
END-OF-YEAR EXAMINATIONS 2005 Unit: Day and Time: Time Allowed: ELEC321 Communication Systems (D2) Tuesday, 22 November 2005, 9:20 a.m. Three hours plus 10 minutes reading time. Total Number of Questions:
Signals and Systems Lecture 6: Fourier Applications
 Signals and Systems Lecture 6: Fourier Applications Farzaneh Abdollahi Department of Electrical Engineering Amirkabir University of Technology Winter 2012 arzaneh Abdollahi Signal and Systems Lecture 6
COMM 601: Modulation I
 Prof. Ahmed El-Mahdy, Communications Department The German University in Cairo Text Books [1] Couch, Digital and Analog Communication Systems, 7 th edition, Prentice Hall, 2007. [2] Simon Haykin, Communication
QUESTION BANK. SUBJECT CODE / Name: EC2301 DIGITAL COMMUNICATION UNIT 2
 QUESTION BANK DEPARTMENT: ECE SEMESTER: V SUBJECT CODE / Name: EC2301 DIGITAL COMMUNICATION UNIT 2 BASEBAND FORMATTING TECHNIQUES 1. Why prefilterring done before sampling [AUC NOV/DEC 2010] The signal
Wireless Communication Fading Modulation
 EC744 Wireless Communication Fall 2008 Mohamed Essam Khedr Department of Electronics and Communications Wireless Communication Fading Modulation Syllabus Tentatively Week 1 Week 2 Week 3 Week 4 Week 5
Communication Engineering Prof. Surendra Prasad Department of Electrical Engineering Indian Institute of Technology, Delhi
 Communication Engineering Prof. Surendra Prasad Department of Electrical Engineering Indian Institute of Technology, Delhi Lecture - 10 Single Sideband Modulation We will discuss, now we will continue
Chapter 6 Double-Sideband Suppressed-Carrier Amplitude Modulation. Contents
 Chapter 6 Double-Sideband Suppressed-Carrier Amplitude Modulation Contents Slide 1 Double-Sideband Suppressed-Carrier Amplitude Modulation Slide 2 Spectrum of a DSBSC-AM Signal Slide 3 Why Called Double-Sideband
EECE 301 Signals & Systems Prof. Mark Fowler
 EECE 301 Signals & Systems Prof. Mark Fowler Note Set #16 C-T Signals: Using FT Properties 1/12 Recall that FT Properties can be used for: 1. Expanding use of the FT table 2. Understanding real-world concepts
Lecture 2 Review of Signals and Systems: Part 1. EE4900/EE6720 Digital Communications
 EE4900/EE6420: Digital Communications 1 Lecture 2 Review of Signals and Systems: Part 1 Block Diagrams of Communication System Digital Communication System 2 Informatio n (sound, video, text, data, ) Transducer
M(f) = 0. Linear modulation: linear relationship between the modulated signal and the message signal (ex: AM, DSB-SC, SSB, VSB).
 = 0. Linear modulation: linear relationship between the modulated signal and the message signal (ex: AM, DSB-SC, SSB, VSB).") 4 Analog modulation 4.1 Modulation formats The message waveform is represented by a low-pass real signal mt) such that Mf) = 0 f W where W is the message bandwidth. mt) is called the modulating signal.
4 Analog modulation 4.1 Modulation formats The message waveform is represented by a low-pass real signal mt) such that Mf) = 0 f W where W is the message bandwidth. mt) is called the modulating signal.
1. Clearly circle one answer for each part.
 TB 1-9 / Exam Style Questions 1 EXAM STYLE QUESTIONS Covering Chapters 1-9 of Telecommunication Breakdown 1. Clearly circle one answer for each part. (a) TRUE or FALSE: Absolute bandwidth is never less
Introduction. Amplitude Modulation System Angle Modulation System
 Introduction Amplitude Modulation System Angle Modulation System Frequency Modulation Phase Modulation Digital Communication Elements of Information Theory Advanced Communication Techniques 1 Tools for
ECE 201: Introduction to Signal Analysis
 ECE 201: Introduction to Signal Analysis Prof. Paris Last updated: October 9, 2007 Part I Spectrum Representation of Signals Lecture: Sums of Sinusoids (of different frequency) Introduction Sum of Sinusoidal
Solutions to some sampled questions of previous finals
 Solutions to some sampled questions of previous finals First exam: Problem : he modulating signal m(a m coπf m is used to generate the VSB signal β cos[ π ( f c + f m ) t] + (1 β ) cos[ π ( f c f m ) t]
Signals and Systems Lecture 6: Fourier Applications
 Signals and Systems Lecture 6: Fourier Applications Farzaneh Abdollahi Department of Electrical Engineering Amirkabir University of Technology Winter 2012 arzaneh Abdollahi Signal and Systems Lecture 6
Spectrum. Additive Synthesis. Additive Synthesis Caveat. Music 270a: Modulation
 Spectrum Music 7a: Modulation Tamara Smyth, trsmyth@ucsd.edu Department of Music, University of California, San Diego (UCSD) October 3, 7 When sinusoids of different frequencies are added together, the
DT Filters 2/19. Atousa Hajshirmohammadi, SFU
 1/19 ENSC380 Lecture 23 Objectives: Signals and Systems Fourier Analysis: Discrete Time Filters Analog Communication Systems Double Sideband, Sub-pressed Carrier Modulation (DSBSC) Amplitude Modulation